THE SOLUTION FOR DESIGNING YOUR ENERGY EFFICIENT DISTRICT RETROFITTING PROJECT!
←
→
Page content transcription
If your browser does not render page correctly, please read the page content below

THE SOLUTION FOR
                         DESIGNING YOUR ENERGY
                         EFFICIENT DISTRICT
                         RETROFITTING PROJECT!
                                     OPTIMISED ENERGY EFFICIENT DESIGN
                                         PLATFORM FOR REFURBISHMENT
                                                     AT DISTRICT LEVEL

                         OptEEmAL Final Booklet

This project has received funding from the European Union’s Horizon 2020 research and innovation programme
under grant agreement No 680676.
TABLE OF CONTENTS

PROJECT ID                                                                            1 PREFACE .  .  .  .  .  .  .  .  .  .  .  .  .  .  .  .  .  .  .  .  .  .  .  .  .  .  .  .  .  .  .  .  .  .  .  .  .  .  .  .  .  .  .  .  .  .  .  .  .  .  .  .  .  .  .  .  .  .  .  .  .  .  .  . 4

Duration:          42 months (September 2015 – February 2019)
                                                                                      2 INTRODUCTION  .  .  .  .  .  .  .  .  .  .  .  .  .  .  .  .  .  .  .  .  .  .  .  .  .  .  .  .  .  .  .  .  .  .  .  .  .  .  .  .  .  .  .  .  .  .  .  .  .  .  .  .  .  .  .  .  .  . 6
Partners:          13 partners from 8 countries
                   (France, Germany, Greece, Ireland, Italy, Spain, Sweden, Turkey)
Coordinator:       CARTIF Technology Centre
                                                                                      3 OPTEEMAL PROJECT .  .  .  .  .  .  .  .  .  .  .  .  .  .  .  .  .  .  .  .  .  .  .  .  .  .  .  .  .  .  .  .  .  .  .  .  .  .  .  .  .  .  .  .  .  .  .  .  .  .  .  .  .  . 9
Call identifier:   H2020-EeB-2014-2015 / H2020-EeB-2015
Topic:             EeB-05-2015 Innovative design tools for refurbishment                     3.1 Mission and Objectives .  .  .  .  .  .  .  .  .  .  .  .  .  .  .  .  .  .  .  .  .  .  .  .  .  .  .  .  .  .  .  .  .  .  .  .  .  .  .  .  .  .  .  .  .  .  .  . 9
                   at building and district level

                                                                                             3.2 Impact of the OptEEmAL Platform  .  .  .  .  .  .  .  .  .  .  .  .  .  .  .  .  .  .  .  .  .  .  .  .  .  .  .  .  .  .  .  .  .  .  .  .  .  . 11

                                                                                             3.3 OptEEmAL Project Partners .  .  .  .  .  .  .  .  .  .  .  .  .  .  .  .  .  .  .  .  .  .  .  .  .  .  .  .  .  .  .  .  .  .  .  .  .  .  .  .  .  .  .  . 12

                                                                                      4 PLATFORM FOR ENERGY EFFICIENT DISTRICT RETROFITTING DESIGN  .  .  .  .  .  .  .  .  .  .  .  . 14

                                                                                             4.1 Stakeholder Involvement .  .  .  .  .  .  .  .  .  .  .  .  .  .  .  .  .  .  .  .  .  .  .  .  .  .  .  .  .  .  .  .  .  .  .  .  .  .  .  .  .  .  .  .  .  . 14

                                                                                             4.2 Modules and Tools .  .  .  .  .  .  .  .  .  .  .  .  .  .  .  .  .  .  .  .  .  .  .  .  .  .  .  .  .  .  .  .  .  .  .  .  .  .  .  .  .  .  .  .  .  .  .  .  .  .  . 16

                                                                                             4.3 Development Strategy for Retrofitting Design Projects .  .  .  .  .  .  .  .  .  .  .  .  .  .  .  .  .  .  .  .  .  . 36

                                                                                             4.4 Platform Prototype .  .  .  .  .  .  .  .  .  .  .  .  .  .  .  .  .  .  .  .  .  .  .  .  .  .  .  .  .  .  .  .  .  .  .  .  .  .  .  .  .  .  .  .  .  .  .  .  .  .  . 38

                                                                                             4.5 OptEEmAL Case Studies .  .  .  .  .  .  .  .  .  .  .  .  .  .  .  .  .  .  .  .  .  .  .  .  .  .  .  .  .  .  .  .  .  .  .  .  .  .  .  .  .  .  .  .  .  . 46

                                                                                             4.6 The OptEEmAL Designs for Our Demonstration Cities  .  .  .  .  .  .  .  .  .  .  .  .  .  .  .  .  .  .  .  .  .  . 48

                                                                                      5 CONCLUSION AND WHERE TO GO FROM HERE . . . . . . . . . . . . . . . . . . . . . . . . . . . . . . . 52

                                                                                      6 REFERENCES  .  .  .  .  .  .  .  .  .  .  .  .  .  .  .  .  .  .  .  .  .  .  .  .  .  .  .  .  .  .  .  .  .  .  .  .  .  .  .  .  .  .  .  .  .  .  .  .  .  .  .  .  .  .  .  .  .  .  . 55

                                                                                      7 OPTEEMAL SCIENTIFIC PUBLICATIONS  .  .  .  .  .  .  .  .  .  .  .  .  .  .  .  .  .  .  .  .  .  .  .  .  .  .  .  .  .  .  .  .  .  .  .  .  .  . 56
1 PREFACE
          The design of retrofitting projects for existing buildings still suffers from     In summary, we have worked towards reducing fragmentation, time and
          needless fragmentation, long processes and uncertainties. This hinders the        uncertainties of the process in order to become THE solution for designing
          building stock from becoming more sustainable and contributing to the EU’s        your Energy Efficient District Retrofitting project.
          ambitious targets of 40 % emissions reduction by 2030. This is reflected in
          the current renovation rates of ~1.5 %, which are still too low. Therefore, new
          solutions that facilitate collaboration and improve the whole process are
          demanded by the retrofitting sector.
          The fragmentation of the retrofitting market with multiple stakeholders with
          different and often conflicting interests is mirrored in the communication
          among them. Traditional collaboration methods provoke inefficiencies in the
          process of modelling, evaluating and selecting retrofitting alternatives. New
          paradigms are therefore required, such as the implementation of Integrated
          Delivery Methods (IPD), in order to reinforce collaboration and ensure the
          appropriate involvement of stakeholders from the beginning of the process.
          Evaluating candidate alternatives poses also a big challenge for the stake-
          holders of the process, and the time required to define, model and simulate
          them is too time-consuming to consider a good range of solutions. This limits
          the space of alternatives and sometimes hinders the implementation of
          combinations of technologies that could benefit the project in a greater
          manner. Furthermore, the use of different tools to model and simulate the
Preface

                                                                                                                                                                                                     Preface
          retrofitting scenarios obliges to create ad-hoc models due to the lack of

                                                                                                                                                                                        © OptEEmAL
          interoperability among tools.
          The above is prone to errors in modelling and, added to the lack of informa-
          tion about some technologies and their related costs or benefits, turns into                                 OptEEmAL Kick-Off Meeting, 6-7 October 2015, Valladolid, Spain
          increased uncertainties along the process. This lack of credible information
          results in an increased risk that prevents, in most cases, investments in
          retrofitting.                                                                     Our consortium has worked with great efforts towards these objectives in an
          Acknowledging these challenges, OptEEmAL has been working during                  unbeatable environment of trust, mutual support and continuous learning,
          42 months to deliver a platform that aims at solving these issues through         which we hope is reflected in these pages you now have in your hands.
          offering stakeholders with functionalities that automatically perform a           Enjoy reading!
          diagnosis of the district, propose candidate scenarios, evaluate and
          optimise them, and provide the required data for an improved design of a
          retrofitting project, using the necessary tools for each step. The integration
          of such tools, interoperability mechanisms and catalogues of technologies
          to improve energy efficiency and optimisation methods has been our
          working field leading to a successfully integrated platform and a number of
          progresses beyond the state of the art that will have a big impact on the         Miguel Á. García-Fuentes        Susana Martín-Toral
          scientific community and the society.

                                                                                            OptEEmAL Project Coordinators

                                                                                            CARTIF Technology Centre

4                                                                                                                                                                                                     5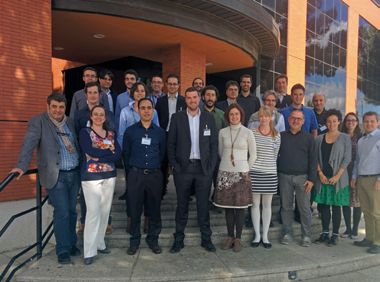
2 INTRODUCTION
                                                                                                        450
                 ENERGY EFFICIENCY IN BUILDINGS AND RETROFITTING: FACTS & FIGURES                       400
                                                                                                                                                                                                  Transport
                                                                                                        350
               Cities across Europe are growing and continue to consume increasing
                                                                                                        300                                                                                       Residential
               amounts of energy. Among often neglected sources of emissions responsi-
                                                                                                        250                                                                                       Industry
               ble for climate change are buildings. EU statistics still find buildings are
               responsible for approximately 40 % of energy consumption and 36 % of                     200
               CO2 emissions in the EU1 .                                                               150                                                                                        Services

                                           Other                                                        100
                                           0,5 %                                                                                                                                                   Agriculture
                                                                                                         50                                                                                        and Fishing
                                                                                                          0                                                                                        Other
                                                                          Buildings
                                                                           38,1 %                             1990            1995           2000            2005           2010           2015
                                                      Residential
                                                        24,8 %
                           Industry
                            25,9 %                                                                                                                                        Final Energy Consumption by Sector
                                                               Services                                              Source: European Commission (2017). EU Energy in figures. Statistical Pocketbook 2017, 85.
                                                                13,3 %

                             Agriculture
                               2,2 %
                                                                                                              The 2010 Energy Performance of Buildings Directive has made it possible
Introduction

                                                                                                                                                                                                                  Introduction
                                                                                                              for consumers to make informed choices that will help them save energy
                                                                                                              and money, and has resulted in a positive change of trends in the energy
                                                   Transport
                                                    33,3 %                                                    performance of buildings. Following the introduction of energy efficiency
                                                                          Data source: Eurostat, 2014
                                                                                                              requirements in national building codes in line with the directive, today,
                                                                                                              new buildings consume only half as much energy as typical buildings from
               ENERGY EFFICIENCY AND EU POLICY2                                                               the 1980s.
               Until today, the 2010 Energy Performance of Buildings Directive and the                        However, about 35 % of the EU’s buildings are over 50 years old and almost
               2012 Energy Efficiency Directive are the EU’s main legislative instruments                     75 % of the building stock is energy inefficient, while only 0.4 – 1.2 %
               promoting the improvement of the energy performance of buildings within                        (depending on the country) of the building stock is renovated each year.
               the EU and providing a stable environment for investment decisions. Mem-                       Therefore, more renovation of existing buildings has the potential to lead to
               ber States needed to transpose them into national legislation.                                 significant energy savings – potentially reducing the EU’s total energy
               On 19 June 2018, Directive (2018/844/EU) amending the Energy Perfor-                           consumption by 5 – 6 % and lowering CO2 emissions by about 5 %.3
               mance of the Buildings Directive was published. It entered into force on
               9 July 2018. The new amendments aim at accelerating the cost-effective
               renovation of existing buildings, with the vision of a decarbonised building                   WHILE NEWEST KNOW-HOW AND TECHNOLOGIES CAN BE INTEGRATED INTO NEW BUILDINGS
               stock by 2050 and the mobilisation of investments. Member States will                          AND CONSTRUCTION PROCESSES, WE STILL NEED BETTER SOLUTIONS TO REDUCE ENERGY
               have 20 months to transpose its provisions into national law (namely by
                                                                                                              CONSUMPTION IN EXISTING BUILDINGS AND CITY INFRASTRUCTURES, WHICH STILL MAKE
               10 March 2020).
                                                                                                              UP THE LARGEST PART OF THE CITY INFRASTRUCTURE ACROSS EUROPE.
               Under the current Energy Efficiency Directive, for example, EU countries
               had to draw up long-term national building renovation strategies which can
               be included in their National Energy Efficiency Action Plans. Under the new,
               revised Energy Performance of Buildings Directive (EPBD), EU countries
               must establish stronger long-term renovation strategies, aiming at decarbonis-
               ing the national building stocks by 2050, and with a solid financial component.
 6                                                                                                                                                                                                                  7
RETROFITTING CHALLENGES AND THE OPTEEMAL SOLUTION                                                  3 OPTEEMAL PROJECT
               The OptEEmAL Platform will change energy efficient design of retrofitting                                      3.1 MISSION AND OBJECTIVES
               projects. Improving the energy efficiency of buildings not only generates
               economic, social and environmental benefits. Better performing buildings
                                                                                                      OptEEmAL explained: An Integrated Solution to design your Energy
               also provide higher levels of comfort and wellbeing for their occupants, and
                                                                                                      Efficient District Retrofitting Project
               improve health by reducing illnesses caused by a poor indoor climate. They
               also have a major impact on the affordability of housing and on energy                 OptEEmAL is a project, funded under the European Union’s Horizon 2020
               poverty.                                                                               research and innovation programme, in which 13 partners from 8 coun-
                                                                                                      tries are working on delivering an optimised, integrated and systemic
               Investments in energy efficiency also stimulate the economy, in particular
                                                                                                      design tool for building and district retrofitting projects based on an
               the construction industry, which generates about 9 % of Europe’s GDP and
                                                                                                      Integrated Project Delivery approach.
               accounts for 18 million direct jobs. SMEs would particularly benefit from a
               boosted renovation market, as they contribute more than 70 % of the value              This Optimised Energy Efficient Design Platform was developed to design
               added in the European building sector.                                                 energy efficient retrofitting projects that are based on different energy
                                                                                                      conservation measures to improve the energy performance of buildings
               In retrofitting projects, municipalities, city planners, energy consultants,
                                                                                                      and districts. The tool will reduce time delivery and uncertainties and result
               construction companies and many other stakeholders need to work together.
                                                                                                      in improved solutions when compared to business-as-usual practices. The
               They all use different planning tools and concepts, making it hard to commu-
                                                                                                      platform will provide automatic and accurate calculation of the best

                                                                                                                                                                                       OptEEmAL Project – Mission and Objectives
               nicate. With the OptEEmAL Platform, they have the chance to collect all their
                                                                                                      possible scenarios for district retrofitting projects.
               data in one place and translate it into one language and thus, overcome
               those challenges to provide customised and high-end solutions for the                  Watch our introductory OptEEmAL video here.
               retrofitting of buildings and entire
Introduction

               districts.
               To develop and implement the best
               possible refurbishment solutions
               for existing buildings, all stakehold-
               ers need to be involved from the
               start to reduce costs and increase
               the relevance and impact of the re-
               furbishment projects. The social
               and economic contexts of urban
               planning have to be considered to                                                      Our main objective is being achieved through a mix of development and
               reach better and more holistic                                                         testing activities, including:
               energy efficiency solutions across
               Europe.                                                                                  Developing a holistic and automated services platform, integrating in-
               The OptEEmAL Platform allows its                                                         teroperable modules and tools for diagnosis and generating optimised
               users and stakeholders to create an optimised, integrated and systemic                   district energy retrofit scenarios according to user preferences.
               design for their retrofitting projects of buildings or entire districts. It automat-
                                                                                                        Reinforcing the commitment of all stakeholders involved through an
               ically calculates the “OptEEmAL” retrofit scenario and helps choose the best
               retrofit solution in terms of costs and benefits. OptEEmAL is based on a cloud           Integrated Project Delivery approach allowing them to articulate their
               system and latest construction modelling tools, which makes its results                  needs through a collaborative and value-based process.
               most accurate. Involving all stakeholders during all project phases, the
               platform helps to avoid conflicts and reduces time and resources needed,                 Creating an integrated ontology-based District Data Model containing
               thus saving at least 19 % of the retrofitting costs. OptEEmAL makes retrofitting         key information on energy, comfort, environment, economic and social
               easier and more profitable for all people involved.                                      well-being and urban morphology.

 8                                                                                                                                                                                             9
3.2 IMPACT OF THE OPTEEMAL PLATFORM

                                                                                                                            The OptEEmAL Platform provides stakeholders with an optimised, integrat-
      GUIs-3D VISUALISATION                                                                                                 ed and systemic design for their retrofitting projects of buildings and entire
                                                                        INPUT DATA                  EXISTING DATA SETS      districts.
                        CLOUD            Stakeholders
                      COMPUTING                                                                                             This leads to the following impacts:
     SCENARIOS GENERATOR
        AND OPTIMISER                 ECMS                                                                                     High economic impact through the reduction of costs by 19 % during the
                                    CATALOGUE                                                                                  design phase compared to business-as-usual. Promotion of holistic
                                                                    EXTERNAL
                                                                      TOOLS                                                    solutions reduces costs of the operational phase by 25 % and leads to a
                                    SEMANTICALLY                                                                               higher return on investment.
                                      ENRICHED                                                    DISTRICT SUSTAINABILITY
                                     DATA MODEL                                                         INDICATORS             Greater market competitiveness through the utilisation of energy effi-
        DISTRIBUTED –
     PARALLEL PROCESSING                        Data Model / Ontology          Interoperability                                cient solutions in a holistic integration and the improvement of the
                                                                                                                               contractual processes.
                      EXPORT DATA

                                                                                                                                                                                                             OptEEmAL Project – Impact of the OptEEmAL Platform
                                                                                                                               Boost of the European construction sector through the creation of new
                                                                                                                               jobs and strengthening SMEs in the sector.

                                                                                                                               Promotion of social impacts by involving the inhabitants in the
                                                                                                                               decision-making process. This ensures that their expectations are met
                                                   Execution, maintenance and operation
                                                                                                                               and increases user acceptance of the activities carried out, ultimately
                                                                                                                               leading to an improvement of social well-being.
                                                                                     Concept of the OptEEmAL project
                                                                                                                               Dissemination of new knowledge at professional level through specific
                                                                                                                               information channels and trainings targeting relevant stakeholders and
                                                                                                                               user groups.
                    Cataloguing Energy Conservation Measures including technical, operati-
                    onal, maintenance and cost information providing valuable and consis-
                                                                                                                            TO HELP YOU UNDERSTAND HOW THE OPTEEMAL PLATFORM CAN SUPPORT YOU IN FINDING
                    tent outputs for design, district operation and maintenance stages.
                                                                                                                            YOUR BEST RETROFIT SOLUTION, WE OFFER GENERAL AND TECHNICAL TRAININGS IN OUR
                    Developing a bio-inspired optimisation module based on evolutionary                                     DEMO CITIES.
                    computing that automates the decision-making process for an optimal                                     Our trainings and consultations show you how the OptEEmAL Platform
                    energy efficient retrofitting plan at district level.                                                   works and how it can help you get the job done. The trainings are organised
                                                                                                                            in cooperation with our demo site partners in Lund (Sweden), San
                    Externally connecting the OptEEmAL Platform to relevant entities, i.e.                                  Sebastián (Spain) and Trento (Italy) and present the OptEEmAL project and
                    existing Building Information Modelling (BIM) and CityGML tools, ena-                                   its benefits to all stakeholders and potential users.
                    bling the calculation of indicators to generate and optimise the retrofit
                                                                                                                            You are guided through the IPD implementation and trained on how to
                    scenarios.                                                                                              collect your input data, use the platform and make YOUR district retrofitting
                    Strategic dissemination, training, exploitation and market deployment of                                project work.
                    the project’s developments and results.                                                                 For more information on our OptEEmAL General and Technical Trainings,
                                                                                                                            please contact our Coordinator (opteemal_contact@cartif.es) or Communi-
                                                                                                                            cation and Dissemination Secretariat (opteemal@steinbeis-europa.de) or
                                                                                                                            visit www.opteemal-project.eu

10                                                                                                                                                                                                                    11
3.3 OPTEEMAL PROJECT PARTNERS

                                               The OptEEmAL consortium consists of 13 partners from 8 countries (Spain,
                                               France, Italy, Greece, Turkey, Germany, Ireland and Sweden), each one
                                               contributing specific knowledge to meet OptEEmAL objectives, according
                                               to their skills and role in the project.
                                               The project partners represent key stakeholders within the value chain of
                                               the retrofitting design process of buildings and districts: research institu-
                                               tions, large industries, small and medium-sized enterprises, including
                                               technical offices representing the final user, public authorities, and an
                                               exploitation and dissemination/communication expert partner.

                                                  CARTIF Technology Centre               Project Coordinator of OptEEmAL and
                                                  Spain                                  in charge of the overall platform
                                                                                         design, ECO Tool and Evaluator
                                                                                         Development
                                                  Fundación TECNALIA                     Definition and Development of the
                                                  Spain                                  Energy Conservation (ECMs) Cata-
OptEEmAL Project – OptEEmAL Project Partners

                                                                                         logue, Development of the Optimisa-
                                                                                         tion Module
                                                  NOBATEK                                Environmental Simulation, Platform
                                                  France                                 Validation and Demonstration on
                                                                                         Technical and Societal Levels
                                                  Fundació Privada Universitat i         Definition and Development of the
                                                  Tecnologia                             Ontologies-based District Data Model
                                                  Spain                                  (DDM) and Data Repository
                                                  Technical University of Crete          Development of District and Build-
                                                  Greece                                 ing-Level Performance Indicators, and
                                                                                         Tools and Interfaces with Simulation
                                                                                         Software
                                                  ACCIONA Construction                   Stakeholders’ Involvement and Retrofit
                                                  Spain                                  Scenarios; Integrated Delivery Ap-
                                                                                         proach (IPD)
                                                  United Technologies Research Centre    Energy Conservation and HVAC Simu-
                                                  Ireland                                lation
                                                  Expert System                          Main platform developer and integra-
                                                  Italy                                  tor of Data Insertion and Data Expor-
                                                                                         tation Modules
                                                  ARGEDOR Information Technologie Ltd. Graphical User Interfaces (GUIs)
                                                  Turkey
                                                  Distretto tecnologico trentino per     Demo site, Software Testing of Retrofit
                                                  l’energia e l’ambiente                 Analysis of existing Buildings in differ-
                                                  Italy                                  ent Districts
                                                                                                                                     Construction
                                                  Fomento San Sebastián                  Demo site, Coordinator of smart                            Technical
                                                  Spain                                  activities in San Sebastián                                University
                                                  City of Lund                           Demo site where the Calculation Tool                       of Crete
                                                  Sweden                                 is tested and implemented
                                                  Steinbeis-Europe-Zentrum               Dissemination, Communication and
                                                  Germany                                Exploitation of project results

    12                                                                                                                                                           11
                                                                                                                                                                 13
4 PLATFORM FOR ENERGY EFFICIENT
                                                                                                  DISTRICT RETROFITTING DESIGN                                           OptEEmAL is a tool to support the decision-making process in district retro-
                                                                                                                                                                         fitting. The two main groups of stakeholders represented in the project are
                                                                                                             4.1 STAKEHOLDER INVOLVEMENT                                 the executive group and the operational group. The communication among
                                                                                                                                                                         them, as well as their confirmation in every relevant decision of the design
                                                                                                                                                                         of the project retrofit is granted within OptEEmAL. To do so, the Integrated
                                                                                       Pursuing energy-efficient buildings and districts is not only a challenge in      Project Delivery approach, as it will be explained later, has been imple-
                                                                                       terms of the complexity of the design and the analysis required, but also         mented. To this end, three actors have been defined to represent the
                                                                                       regarding the number of stakeholders involved. Moreover, each project is          different stakeholders (owner, prime designer and prime constructor)
                                                                                       specific and it is not easy to identify the necessary stakeholders for all        and mandatory interactions have been set at specific and relevant
                                                                                       district retrofitting plans. EU-wide, each country has its own structural         stages of the project. In addition, a chat has been integrated into
                                                                                       organisations.                                                                    the platform to assure the constant communication if required by the users.
                                                                                       The most common stakeholder involvement schemes based on a review of
Platform for Energy Efficient District Retrofitting Design – Stakeholder Involvement

                                                                                                                                                                                                                                                        Platform for Energy Efficient District Retrofitting Design – Stakeholder Involvement
                                                                                       numerous district retrofitting plans in Europe are classified into three
                                                                                       main categories:
                                                                                          executive group,
                                                                                          operational group and
                                                                                          interest group
                                                                                       The executive group includes politicians, city planning and study
                                                                                       departments, as well as developers or investors and building stock
                                                                                       owners and managers. They are in charge of the direction in which
                                                                                       a district retrofit should evolve and of the main objectives or constraints
                                                                                       to be set. They are also influenced by the main regulations,
                                                                                       including the energy directives. The second group is the operational
                                                                                       group, which includes contractors, builders, service providers, network
                                                                                       managers and planning, design and engineering offices. They hold the
                                                                                       technical knowledge to carry out a district retrofit, as well as the main
                                                                                       interest in terms of efficiency in the process and cost reduction. Finally,
                                                                                       the interest group is represented by inhabitants and NGOs, which are in
                                                                                       the end the beneficiaries of such energy retrofits.
                                                                                       The adequate communication among stakeholders as well as their
                                                                                       representation in the decision-making process is crucial to avoid modifica-
                                                                                       tions in the project in future stages that may result in a cost increase. It is
                                                                                       necessary to bear in mind that whereas in the retrofit of a building, the
                                                                                       decisions to be taken are numerous and have a great impact on the results
                                                                                       and final costs of the retrofit, in district retrofitting, this impact becomes
                                                                                       exponential due to its complexity and dimensions.

        14                                                                                                                                                                                                                                                              15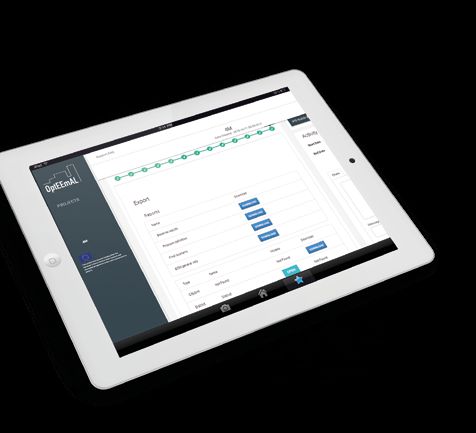
4.2 MODULES AND TOOLS
INTEGRATED DELIVERY APPROACH The changed conceptualisation of the elements is due to different ways of
interaction between the different actors in the project. In a traditional
INTEGRATED PROJECT DELIVERY (IPD) IS A PROJECT DELIVERY APPROACH THAT INTE- approach, it is the owner who sets the goals, targets and barriers to the
GRATES PEOPLE, SYSTEMS, BUSINESS STRUCTURES AND PRACTICES INTO A PROCESS THAT project without interaction or exchange with the prime designer who has to
COLLABORATIVELY HARNESSES THE TALENTS AND INSIGHTS OF ALL PARTICIPANTS TO elaborate the actual and the optimised models depending on the informa-
tion given by the owner – nor with the prime constructor.
OPTIMISE PROJECT RESULTS, INCREASE VALUE TO THE OWNER, REDUCE WASTE AND
MAXIMISE EFFICIENCY THROUGH ALL PHASES OF DESIGN, FABRICATION, AND CONSTRUCTION.4 In an integrated process, all the main actors (owner, prime designer and
prime constructor) work together on the definition of the goals and targets.
Together, they asses the actual scenario of the project and look for an
One main difference to other project delivery approaches relates to improved scenario together.
the workflow boundaries. An Integrated Delivery implies a very high team
involvement in the early phases of the design, determining what the project
Platform for Energy Efficient District Retrofitting Design – Modules and Tools
Platform for Energy Efficient District Retrofitting Design – Modules and Tools
goals are, who will build and how the design will be realised.
Inputs from the broader integrated team coupled with BIM tools to model e s t ab
lish
and simulate the project, bring the design to a higher level of completion
OWNER TARGET
before the documentation phase is started. Thus, the conceptualisation,
criteria design and detailed design phases involve more effort than their GOALS
BARRIERS
counterparts in the traditional flow.
ve
The implementation documention phase will be shorter than the traditional im pro
ck &
construction document phase, and the early participation of regulatory c he
agencies, subcontractors and fabricators allows for a shortening of the CURRENT SCENARIO
BIM MODEL
agency review and buyout phases. As a result, the project is defined and elaborate
coordinated to a much higher level prior to construction start, enabling a
more efficient construction and a shorter construction period.
elabor
PRIMAL DESIGNER ate IMPROVED SCENARIO
BIM MODEL
Traditional Project Delivery Integrated Project Delivery
Traditional Approach Process Use Case Diagram (UML notation)
Fragmented, assembled on “just-as- TEAMS An integrated team entity composed by
needed” or “minimum-necessary” key project stakeholders, assembled
basis, strongly hierarchical, controlled early in the process, open, collaborative
Linear, distinct, segregated, knowledge PROCESS Concurrent and multi-level, early esta
gathered “just-as-needed”, information contributions of knowledge and b li s h e
hoarded, silos of knowledge and expertise, information openly shared, ch TARGET p r ov
ec k & im
expertise stakeholders trust and respect k
& GOALS c hec
im e
Individually managed, transferred to the Collectively managed, appropriately OWNER BARRIERS ov
RISK pr
ov pr PRIMAL
greatest extent possible shared e im
& CONSTRUCTOR
im ali d
c h r ove t e
k
Individually pursued, minimum effort for Team success tied to project success, ec
p a
ec &
v
COMPENSATION/
ch
k,
maximum return, (usually) first-cost REWARD value-based
&
based CURRENT SCENARIO
a t ve
e
li d r o
BIM MODEL
ov
Paper-based, COMMUNICATIONS/ Digitally based, virtual, Building
e
va , imp
pr
2 dimensional, analog TECHNOLOGY Information Modeling (3,4 and 5
dimensional) im
k
k&
ec
te
ch
ec
o ra
ch
Encourage unilateral effort, allocate AGREEMENTS Encourage, foster, promote and support
e l ab
and transfer risk, no sharing multi-lateral open sharing and IMPROVED SCENARIO
collaboration, risk sharing BIM MODEL
ate
PRIMAL el ab o r
DESIGNER
Project elements in Traditional and Integrated Project Delivery Approaches (Source: AIA / AIA California Council, 2007) Integrated Approach Process Use Case Diagram (UML notation)
16 17
In OptEEmAL, the IPD approach is applied in the first phases of the project during                              DATA INSERTION MODULE
                      which the conceptualisation, criteria setting and detailed design are carried out.
                                                                                                                                      This module is responsible for collecting input data from the user (e.g. login
                      This process will provide all the documentation needed for the project implemen-                                information) and project data, e.g. project name, description, CityGML and
                      tation prior to the permission and bidding processes inherent to the project.                                   Industry Foundation Classes (IFC) files, which will be used in the optimisa-
                                                                                                                                      tion phase. It also allows for preliminary checks and/or validation of such
                                                                                                                                      data, excluding CityGML and IFC file validations.
                               WHAT
                                                                                                                        REALISE       The inputs for the module are data related to the project such as:
                                                                          HOW
                                                                                           WHO                                           user’s buildings data
                   Predesign      Schematic
                                   design
                                                          Design
                                                       development
                                                                        Construction
                                                                        documents
                                                                                       Agency/permit
                                                                                          bidding
                                                                                                         Construction      Closeout      district data

                                                                                                                                                                                                                       Platform for Energy Efficient District Retrofitting Design – Modules and Tools
                                                                                         AGENCY                                          weather
                     OWNER
                                                                                                                                         economic data
     TRADITIONAL

                     ARCHITECT
                                                                                                                                         targets and boundaries
                                      ENGINEERS

                                                                                         CONTRACTOR                                      barriers and prioritisation criteria
                                                                                         SUBCONTRACTORS                               The user is guided in every step of the data entry.
                   Conceptualisation        Criteria     Detailed    Implementation    Agency coord/     Construction      Closeout
                                            design        design       documents        final buyout

                                       AGENCY
                                                                                                                                      MAIN PROJECT DATA
                     OWNER                                                                                                            The user introduces general information on the project:
     INTEGRATED

                     ARCHITECT

                                       ENGINEERS

                                       CONTRACTOR

                                                             SUBCONTRACTORS

                        WHAT

                                      WHO

                                      HOW                                                                  REALISE

                                                        OptEEmAL

                               Traditional Delivery vs. Integrated Delivery. Edited from source: AIA / AIA California Council, 2007

                               “The OptEEmAL project has drawn attention to the possibilities BIM
                               offers. It has also shown how important it is to have a holistic
                               approach to energy efficiency measures in which multiple actors’
                               interests must be balanced.”
                               City of Lund, Sweden – OptEEmAL Project Partner

18                                                                                                                                                                                                    CityGML Upload                  19
Baseline Energy Systems
DISTRICT DATA MODEL
As a basis for calculating the district performance indicators of a district in
different domains, the OptEEmAL District Data Model (DDM) collects infor-
mation from different sources, such as BIM / Geographic Information
System (GIS) models and contextual information (energy prices and
weather conditions among others). The DDM ensures the interoperability
between the data sources and a set of simulation tools that calculate
district performance indicators.
Platform for Energy Efficient District Retrofitting Design – Modules and Tools
OPTIMISATION DPIs
1 BIM MODELS
SIMULATION
(IFC standard)
ENERGY HVAC TOOL
2 GIS MODELS
ECONOMIC ECO TOOL
(CityGML standard)
URBAN NEST
Weather data SOCIAL E+
3 CONTEXTUAL DATA Energy prices
(multiple sources)
Users’ objectives
Socio-economic
Contextual Data data
From a Retrofitting Plan to a District Data Model
The DDM has been conceived as a unified multi-level data model based on
semantically enriched existing standards such as IFC and CityGML. The
data model is organised in different domains (e.g. energy, economic, social
etc.) in which a vocabulary, i.e. ontology, has been implemented for each of
the domains including all the terms and properties to model the data
required as input for a simulation tool of a particular domain. This makes it
easier to develop specific connectors for the simulation tools. For example,
unique interfaces based on standardised communication protocols have
been implemented to generate any input required by simulation tools
(e.g. EnergyPlus, HVAC tool, NEST).
Final Scenario for
Your Refurbishment Project
20 21ECM CATALOGUE
DISTRICT RETROFITTING DISTRICT MODEL SIMULATION The Energy Conservation Measure (ECM) catalogue is one of the main
Optimiser Semantic Simulation features of the OptEEmAL Platform. It sets the basis for the calculation of
Data Models tools
retrofit scenarios by applying a series of conventional and innovative reno-
vating solutions, both at building and district level. This catalogue contains
ENERGY HVAC TOOL information about materials and equipment – for a wide range of measures
ECONOMIC ECO TOOL
– to reduce the district energy demand and consumption through Passive,
Active, Control and Renewable Energy Source (RES) integration measures.
Indicators URBAN NEST
Passive ECMs aim at achieving a significant reduction of the energy
SOCIAL E+ demand for heating and cooling.
Platform for Energy Efficient District Retrofitting Design – Modules and Tools
Active ECMs use traditional energy sources in the most efficient way
Energy
Conservation possible.
Measures
Catalogue Control ECMs optimise the implementation and integration of active and
Simulation and Optimisation in the District Data Model
control ECMs.
Renewable ECMs use sustainable sources of energy like wind, sun and
geothermal energy to meet the building’s energy demand.
The DDM is populated following a set of data transformation and integra-
tion processes based on Semantic Web technologies. This makes the The ECM catalogue data model or structure is composed by numerous
transformation processes transparent and enables the community to parameters that accurately define each renovating measure and allow for
maintain them and create new ones. The transformation and integration the calculation of different scenarios formed by a single or a combination
processes take into account the semantic and structural heterogeneity of EMCs.
between the data sources making the DDM an interoperability solution for Informative parameters will inform the user of the advantages, disad-
the architecture, engineering and construction (AEC) industry. vantages, necessary maintenance and installation requirements of
each ECM.
Optimisation parameters will determine the barriers, targets and appli-
“An accurate and reliable generation of the initial BIM model
cation scale of the ECMs. These parameters will be used by the optimi-
(based on IFC) and CityGML file feeding the OptEEmAL Platform is
sation module of the platform to determine the feasibility of each measure.
mandatory for the success of their use. In order to help the
experts to generate these IFC and CityGML files properly, IFC and Technical, economic and environmental parameters will be used to
CityGML guidelines have been generated in the scope of the calculate the impact and reach of the renovating actions.
OptEEmAL project as a contribution to the experts’ community.”
CARTIF Technology Centre, Spain – OptEEmAL Project Coordinator
22 23MULTI-SCALE INTEGRATION FOR DISTRICT SIMULATION
ECM
The Simulation module, aiming at certain District Performance Indicators
(DPIs) calculations, is supporting two key processes in the OptEEmAL
GENERIC DATA TECHNICAL DATA platform: the data insertion and diagnosis process; and the scenarios
generation and optimisation process. In both processes, data retrieved
from proper Data Models (Energy, Energy Carrier, Urban, etc.) comply with
ADVANTAGES & certain groups of transformation rules to generate the required simula-
DESCRIPTION tion input files:
DISADVANTAGES
an XML file for every building of interest to be used as input to NEST5 for
the environmental DPIs calculation;
Platform for Energy Efficient District Retrofitting Design – Modules and Tools
Platform for Energy Efficient District Retrofitting Design – Modules and Tools
ENERGY DATA MAINTENANCE ECONOMIC INSTALLATION ENVIRONMENTAL ECO tool inputs for the economical DPIs calculation;
DATA DATA DATA DATA
Input Data Files (IDF) files for every building of interest, to be used as
ECM Catalogue Data Structure input to EnergyPlus6 for the building envelop thermal simulation and
computation of its energy loads; and
multiple configuration files to be used as input to the HVAC tool for the
Additionally, the end user of the OptEEmAL Platform and the equipment energy and comfort DPIs calculation. Note here that within OptEEmAL,
manufacturers will have the possibility to include new personalised or SimModel7 has been chosen as the Energy data model.
commercial ECMs and components, widening the range of application of
the OptEEmAL Platform by adapting it to specific refurbishment projects
and commercial equipment.
“To achieve functions like data retrieval, data transformation,
execution of the simulation tools and computation of DPIs, new
and existing, but modified components have been developed. The
“Obtaining an Energy Conservation Measure (ECM) Catalogue need for most of these components was stipulated in the design
containing all the information useful for the involved stakeholders of the simulation module, while the need for others, like the BIM
in refurbishment projects is complex.Hence, a dynamic, active exporter modifications, became apparent later when the quality
and updated ECM catalogue is essential to succeed in the kind of of data obtained from commercial tools was not acceptable.”
solution proposed by the OptEEmAL project.” Technical University of Crete, Greece – OptEEmAL Project Partner
CARTIF Technology Centre, Spain – OptEEmAL Project Coordinator
“However, further data quality issues have to be solved and there
is always room for improvement. Regarding the HVAC data, for in-
stance, instead of a short OptEEmAL’s BES catalogue, IFC and its
translation to Building Energy Performance (BEP) simulation input
data files could be implemented, despite limitations in the de-
scription of HVAC systems. Commonly, HVAC modeling in BEP sim-
ulation engines requires further information than the one included
in an IFC file and can be captured within an IFC scheme. A thorough
documentation of such missing information and recommendations
on how to deal with this drawback would be preeminent.”
Technical University of Crete, Greece – OptEEmAL Project Partner
24 25Energy Simulation HVAC Simulation
Concerning the Energy simulation, a set of components has been devel- The optimisation platform includes a tool that simulates HVAC (Heating,
oped to support the Data Insertion and Graphical User Interface functionalities: ventilation, and air conditioning), Controls and Renewables, providing the
basis for a complete simulation of the retrofit scenario. The output of the
a document of BIM Guidelines provides the modeler with design rules to
tool is used by the platform to determine the energy and comfort District
be followed towards generating a consistent BIM model;
Performance Indicators (DPIs). The tool chooses one or more units out of
a modified version of the Revit IFC Exporter enables exportation of infor- the ECM catalogue such that the thermal demand can be fully supplied. In
mation which could not be exported by its original version (e.g. material case the considered refurbishment scenario includes more than one HVAC
thermal properties); unit, the system-level control logic is taken into account to determine how
the HVAC units share the load and the final consumption of each unit given
the model checker (BIM checking component) checks, using a static set
the variable efficiency models included in the tool. Additional control mod-
of rules, whether required data are present in the IFC file, while
Platform for Energy Efficient District Retrofitting Design – Modules and Tools
Platform for Energy Efficient District Retrofitting Design – Modules and Tools
els are available in the tool to enable the estimation of the variation in the
the Geometry Error tool checks for geometry errors that may affect total energy demand when the system schedules (start and stop times) are
other tools (e.g. Common Boundary Intersection Projection (CBIP) tool). varied with respect to the reference values. In this way, scenarios can be
investigated where the energy consumption is reduced and thermal
Related to data management and simulation functionalities, the compo- comfort maintained or improved.
nents that have been developed are the following:
Compared with other simulation tools developed in other research efforts,
the CBIP tool8 enriches the IFC file with geometry information that is this tool can assess the actual costs and energy performances of commer-
required for Building Energy Performance simulations (BEPs) (namely, cial HVAC units (whereas existing tools usually take into account only costs
generates the 2nd-level space boundary information); per kW) and use a comprehensive set of high-fidelity simulation models
the DNS tool9 retrieves information from the CityGML and generates a and tools to determine DPIs.
set of surfaces that have shading effect to the buildings under investiga- The layout of the tool is shown on page 28 depicting a complete set of
tion (these buildings define the district); supply and demand systems at building and district level. The supply sys-
the Automatic Zoning tool10 aims at generating zoning information if this tems include hot water boilers (condensing and non-condensing), com-
is not available from the supplied IFC file — these three supporting tools bined heat-power-units, solar-thermal panels, electric reciprocating
belong to the enrichment layer and interact with the Data Management chillers, air to water heat-pumps and more. The models of demand systems
Module; are efficiency-based models applicable to different building demand
systems, namely: baseboard heating systems, fan-coil systems, constant
the SimModel Enrichment tool retrieves the output of the ETL2 process air-volume (CAV) systems, variable air-volume systems (VAV), variable
(a mapping process from IFC RDF to SimModel RDF) and enriches the refrigerant flow (VRF) systems, packaged terminal heat pumps (PTHP) and
energy data models with additional information required for energy air conditioning units (PTAC), water to air heat pump systems (W2A HP),
simulations; underfloor heating systems. The models include zone-level consumption of
the Simulation Input Model Generator Module retrieves data from the water circulation pumps and fans.
Instance Creator (Data Management Module), generates input files for In addition, the tool includes a set of simulation models enabling the user
specific simulation tools (e.g. EnergyPlus), and submits these files to the to address a group of system-level controls, which are applicable to the
Cluster Computing tool for simulation, results of which are retrieved by energy supply systems. These are: system scheduling, optimal start-up &
the DPI Calculation tool, and after some aggregation operations, DPIs stop, thermal load following, weather compensation for hot and chilled
values are computed and stored at the project repository. water loops and sequencing control for boiler and chiller plants.
Once the proper system is selected and sim-xml models are linked to the
tool, the simulation engine runs and reports a complete set of energy and
comfort DPIs to the platform, which will be used in scenario selection and
determination of the Pareto optimal points according to user objectives
and targets from the refurbishment project.
26 27Developed as a plugin for SketchUp, the NEST tool has been turned into a
web service in the frame of the OptEEmAL project. The developed web
HVAC TOOL service has to be connected to the rest of the platform through the simula-
tion module using xml files. In order to match with the OptEEmAL philosophy,
the tool has been “simplified” compared to the commercial version, with
CONTROL MODELS HVAC & RENEWABLES MODELS only two indicators considered among the eight available and with consid-
URBAN DATA eration of buildings and energy networks solely as components of urban
MODEL System scheduling Boilers Heat Pumps Renewables
systems.
Optimal start/stop CHPs Chillers Demand systems
Weather compensation
Load following
Platform for Energy Efficient District Retrofitting Design – Modules and Tools
Sequencing
ENE
SIM-MODELS COM
District Building Baseboard Fan-coils DPIs
Plant Plant
CAV VAV
WtoA HP VRF
ENERGYPLUS PTHP PTAC
OUTPUT
DISTRICT BUILDING
SUPPLY SUPPLY Underfloor Heating
SYSTEM SYSTEM
BUILDING / ZONE DEMAND SYSTEMS
All Levels of the HVAC Tool in the OptEEmAL Platform
Web-based NEST tool by NOBATEK/INEF4
Environmental Simulation
One objective of the OptEEmAL project was to create links between existing
tools. In this sense, and in order to perform the requested environmental
simulations, the existing NEST11 tool has been integrated into the platform,
within the simulation module. Using the developed web service, all environmental DPIs considered by the
platform are calculated with the NEST tool using the life cycle assessment
Initially, the NEST tool was developed in order to apply the life cycle assess- methodology. To make these calculations, NEST is using input data provid-
ment methodology to new or to be retrofitted districts. The objectives of the ed by the user, but also by other simulations - in particular energy simula-
tool are to identify environmental hotspots associated with urban systems tions performed using EnergyPlus, highlighting the links created between
using a quantitative assessment methodology and thus, ease decision- the different already existing tools.
making while integrating environmental aspects. In this way, NEST consid-
ers not only the environmental impacts of buildings, but also of other urban For more information on EnergyPlus, please visit: https://energyplus.net/
elements such as roads, green areas, mobility networks etc.
28 29Economic Simulation SCENARIO EVALUATOR
In the context of the OptEEmAL project, one specific tool (ECO tool) has Each one of the scenarios is automatically evaluated analysing the result of
been developed in order to calculate the indicators needed for the the most significant District Performance Indicators (DPIs). Specifically,
economic evaluation of the scenarios generated. This software, developed 18 DPIs have been selected for the evaluation. These DPIs, calculated in
using JAVA programing language, is able to calculate different economic previous simulation stages, have been classified into two main groups:
indicators, such as operational energy cost, investment, life cycle cost, those which imply a cost and those which represent a benefit:
return on investment and payback period.
The cost group contains the DPIs that indicate the environmental
In order to calculate these DPIs, ECO tool needs different types of data as (Global Warming Potential – GWP, primary energy consumption and
input: information about the cost of the ECMs implemented in the scenario, energy payback time) or economic (investments, life cycle cost and
information about the units of the ECMs applied or the surface covered by payback Period) cost for the scenario.
the ECMs, the surface to be refurbished, and also the values of
Platform for Energy Efficient District Retrofitting Design – Modules and Tools
Platform for Energy Efficient District Retrofitting Design – Modules and Tools
The benefit group involves the DPIs that could show a benefit for
other DPIs calculated in other steps. The information of the energy
the scenario: reduction of energy demand or consumption, increase of
prices and their increment is automatically collected in a previous step,
the energy demand covered by renewable sources, increase of the
during the data insertion (five values are gathered corresponding to the
comfort, energy used from district heating, and also, this group takes
last five years together with the type of units, e.g. Kilowatt-hour). The DPIs
into consideration the benefits obtained when increasing the contribu-
needed are diagnosis DPIs from the baseline situation and evaluation DPIs
tion of renewable energies: photovoltaic, solar thermal, hydraulic,
(specifically final energy consumptions of different sources: electricity,
mini-eolic, geothermal and biomass etc.
natural gas, gasoil and biomass) from the scenario that is being evaluated
for the calculation of the Economic DPIs in the evaluation process.
With all the described information, the ECO tool is able to calculate the The DPIs are normalised in order to be able to make a comparison between
economic indicators that will be the basis of the economic evaluation of them. After calculating and normalising the DPIs, they are aggregated
each scenario. following a dynamic weighting scheme that varies according to user priori-
ties. The user can define his/her priorities introducing the prioritisation
criteria through two different mechanisms:
objectives can be inferred from the pairwise comparison of the
18 indicators, performed by the user, indicating the importance of
“Capturing the reality of retrofitting a district is a big challenge in
each DPI over the others or
terms of modeling and solving in a semi-automatic manner, a
problem that requires multiple interactions between data, stake- the user can select one scheme from the pre-defined schemes, which are
holders and tools. To address this challenge appropriately, differ- based on possible objectives to be pursued according to directives,
ent and complementary knowledge fields have been integrated such as having a “nearly Zero Energy District” or “generation through
resulting in a tool that supports the retrofitting design process renewables”. In this step, a cost value is obtained, calculated as the
and that allows for the reduction of time, errors and costs for weighted aggregation of the normalised DPIs belonging to the cost
stakeholders.” group and the benefit value generated as the weighted aggregation of
the normalized DPIs belonging to the benefit group. The results of the
CARTIF Technology Centre, Spain – OptEEmAL Project Coordinator
cost and benefit analysis are used by the optimisation module in order
to compare and rank the different scenarios.
30 31OPTIMISATION MODULE The prioritising criteria, specified in the data insertion and diagnosis
process, is introduced in the optimisation module (scenario generator),
The optimisation module is a key element within the OptEEmAL Platform,
which will generate scenario vectors by means of combining the applicable
as it enables the generation of feasible retrofit scenarios to be evaluated,
ECMs. In the first iteration, the scenarios proposed will be random, whereas
with the final aim to look for optimal retrofit scenarios along the Pareto
in the following iterations, the scenario generation will be based on the
frontier. The multi-objective algorithm is based on the Multi-Objective
outcomes of the optimisation algorithm. Once the simulation data models
Harmony Search (MOHS) that simultaneously optimises cost and benefit
have been created, the scenario’s DPIs will be calculated and directed to
fitness functions at district level. The proposed multi-objective algorithm
the data management module to be stored in the project repository.
does not converge towards a unique solution. Therefore, a set of solutions
is proposed, which represent the best trade-off scenario (related to the Once DPIs are stored, these can be retrieved by the optimisation module
bi-objective optimisation) in form of the Pareto optimal front. (evaluator) in order to have two unique, understandable and easy-to-
handle values for each scenario to be ranked by the optimisation module:
This module comes into action at the second and third stages of the plat-
Platform for Energy Efficient District Retrofitting Design – Modules and Tools
Platform for Energy Efficient District Retrofitting Design – Modules and Tools
cost and benefit functions. With the result of the objective function, the
form process (scenarios generation and optimisation process), after the
optimisation module (optimisation algorithm) will either generate more
user has inserted all relevant data of the project and after this data has
combination rules and continue the iterative process or finish the iteration
been checked and stored. Diagnosis DPIs, which correspond to the base-
process if the stopping criteria is met. In this last case, the optimiser
line scenario and represent the initial status of the district, have also been
output data would be stored in the OptEEmAL repositories.
calculated at this stage.
DATA EXPORTATION MODULE
The data exportation module provides two typologies of output through its
components: Scenario Selector and Data Exporter. The output of the first
component is the desired
scenario chosen by the
users among the ranking
of scenarios generated in
the optimisation process.
Scenario Selection
After this step, the Data
Exporter will enable the
user to export the files
with the information gen-
erated in the platform,
using different file for-
mats: IFC, CityGML, PDF
and XLS.
Optimal Scenario Selection Interface – Pareto Front Curve
Optimal Scenario Selection Interface – DPI Results
32 33Example of Baseline Results Problem Definition
Among the exported data, this tab presents the District Performance Indi- The following part of
cators (DPIs) of the final scenario of the examined district. It reflects the the report presents the
performance of the district after retrofitting and compares it with the base- data introduced in order
line scenario. In this tab, only the results for the selected DPIs are presented. to define the problem
formulation.
Platform for Energy Efficient District Retrofitting Design – Modules and Tools
Data Input for Problem Definition
ECM General Information
This entire file summarises the Energy Conservation Measures (ECMs)
which have been considered in the final scenario.
District Performance Indicators (DPI) of the final scenario
Energy Conservation Measures (ECMs)
considered in final scenario
34 354.3 DEVELOPMENT STRATEGY FOR RETROFITTING DESIGN PROJECTS
The design of energy efficient retrofitting projects, in this case at district Therefore, OptEEmAL automates the processes of generating the multi-
scale, is a challenging problem that requires a multi-scale and multi- domain and multi-scale models, the generation of candidate retrofit
domain evaluation and a constant interaction among stakeholders, data scenarios as combinations of Energy Conversation Measures and the eval-
and tools. An appropriate interaction of stakeholders as data providers and uation and optimisation of these scenarios through the appropriate
decision-makers turns essential in order to achieve the expected goals ecosystem of tools. This turns into a reduction of time, errors and costs
more effectively and to deliver projects that are financially and technically related to this process while the interaction among stakeholders is
sustainable. deepened and reinforced.
Platform for Energy Efficient District Retrofitting Design – Development Strategy for Retrofitting Design Projects
Platform for Energy Efficient District Retrofitting Design – Development Strategy for Retrofitting Design Projects
OptEEmAL integrates processes in order to allow generating and evaluat-
ing the candidate retrofit scenarios integrating an optimisation and evalua-
tion core tackling the diverse domains and scales that this problem poses “The jump needed to be able to design refurbishment projects at
and also integrating the data models and tools for this aim. building level to entire district level projects exponentially increas-
Capturing and representing the reality of the retrofitting value chain has es the complexity of the developed platform. For that reason, the
been a cornerstone of OptEEmAL since the platform was conceived and, as concept of scalability has to be taken into account from the early
such, it provides four main processes as a strategy to design a retrofitting beginning of the project to mitigate the risk of complicating the
project, guiding the user through the steps that allow transforming input problem to be solved.”
data into a solution to the requirements and priorities of the stakeholders. CARTIF Technology Centre, Spain – OptEEmAL Project Coordinator
These four core steps are:
Problem statement: a set of interactions allow the users to insert all
data required by OptEEmAL in a friendly manner through models
created outside OptEEmAL and through the interfaces of the tool. “We have seen an incredible knowledge generation and transfor-
Problem mapping: OptEEmAL takes the data inserted by the users and mation of this knowledge into a real product in three and a half
transforms it into a problem that can be interpreted by the tools that will years. The use of BIM models for retrofitting projects in an “auto-
evaluate the current conditions and the proposed retrofit scenarios. mated” manner is a great breakthrough and offers new possibili-
The problem is conceived as a set of data models that allow represent- ties in the building sector.
ing the energy, comfort, economic, environmental or urban performance OptEEmAL has brought web technologies knowledge and their
of the district as well as integrating information about the users, inhabit- application to retrofitting projects to a new level!”
ants, boundary conditions, expected targets or prioritisation criteria.
NOBATEK, France – OptEEmAL Project Partner
Problem solving: once the baseline models are generated, OptEEmAL
proposes a set of candidate retrofit scenarios automatically through
selecting and combining Energy Conservation Measures from the cata-
logue that represents them. Thus, the optimisation loop is launched
where sets of scenarios are generated, evaluated and optimised until
the stopping criteria are achieved.
Solution exporting: as a last step, the user is presented with the set of
best scenarios against the prioritisation criteria inserted at the
beginning of the process and the exportation documents are generated
to be downloaded by the user.
36 374.4 PLATFORM PROTOTYPE
First of all, the user has to log in to the platform. If the user does not have 0 NEW PROJECT
an account yet, a register form is shown. After that, the user has to follow
the next steps to complete a project in the OptEEmAL Platform:
0 New Project
1 IPD Group Creation
Platform for Energy Efficient District Retrofitting Design – Platform Prototype
Platform for Energy Efficient District Retrofitting Design – Platform Prototype
2 Data Upload and CityGML-BIM Matching
PROBLEM STATEMENT
3 Baseline Energy Systems
4 Contextual Data
5 Energy Conservation Measures
Create New Project
6 Check Strategies
1 IPD GROUP CREATION
7 Baseline Performance
PROBLEM MAPPING
IPD Group Creation: The three profiles involved in this step are: the Owner, the Prime
8 Targets and Boundaries Designer and the Prime Constructor. In this step, you can download the IPD guide
9 Prioritisation Criteria
10 Problem Summary
PROBLEM SOLVING
11 Optimisation Progress
12 Select Scenario
SOLUTION EXPORTING
13 Export
38 392 DATA UPLOAD AND CITYGML-BIM MATCHING 4 CONTEXTUAL DATA
Contextual data is collected by the platform through accessing public data sources such as
Upload CityGML and IFC files Matching BIM in CityGML EUROSTAR or E+. The user can also upload and validate his/her own contextual data files
3 BASELINE ENERGY 5 ENERGY CONSERVATION
SYSTEMS MEASURES
Complete the questionnaire related to Select the Energy
the Baseline Energy Systems Conservation Measures
40 41You can also read