The remote response of the South Asian Monsoon to reduced dust emissions and Sahara greening during the middle Holocene
←
→
Page content transcription
If your browser does not render page correctly, please read the page content below
Clim. Past, 17, 1243–1271, 2021
https://doi.org/10.5194/cp-17-1243-2021
© Author(s) 2021. This work is distributed under
the Creative Commons Attribution 4.0 License.

The remote response of the South Asian Monsoon to reduced
dust emissions and Sahara greening during the middle
Holocene
Francesco S. R. Pausata1 , Gabriele Messori2,3 , Jayoung Yun4 , Chetankumar A. Jalihal5,6 , Massimo A. Bollasina4 , and
Thomas M. Marchitto7
1 Centre ESCER (Étude et la Simulation du Climat à l’Échelle Régionale) and GEOTOP (Research Center on the dynamics of
the Earth System), Department of Earth and Atmospheric Sciences, University of Quebec in Montreal, Montreal, Canada
2 Department of Earth Sciences, Uppsala University, and Centre of Natural Hazards and Disaster Science (CNDS),

Uppsala, Sweden
3 Department of Meteorology, Stockholm University, and Bolin Centre for Climate Research, Stockholm, Sweden
4 School of GeoSciences, University of Edinburgh, Edinburgh, UK
5 Centre for Atmospheric and Oceanic Sciences, Indian Institute of Science, Bengaluru, India
6 DST-Centre of Excellence in Climate Change, Divecha Centre for Climate Change, Indian Institute of Science,

Bengaluru, India
7 Department of Geological Sciences and Institute of Arctic and Alpine Research, University of Colorado Boulder,

Boulder, CO, USA

Correspondence: Francesco S. R. Pausata (pausata.francesco@uqam.ca)

Received: 4 November 2020 – Discussion started: 21 November 2020
Revised: 27 April 2021 – Accepted: 3 May 2021 – Published: 17 June 2021

Abstract. Previous studies based on multiple paleoclimate       mote influence is mediated by anomalies in Indian Ocean sea
archives suggested a prominent intensification of the South     surface temperatures and may have shaped the evolution of
Asian Monsoon (SAM) during the mid-Holocene (MH, ∼              the SAM during the termination of the African Humid Pe-
6000 years before present). The main forcing that con-          riod.
tributed to this intensification is related to changes in the
Earth’s orbital parameters. Nonetheless, other key factors
likely played important roles, including remote changes in      1   Introduction
vegetation cover and airborne dust emission. In particular,
northern Africa also experienced much wetter conditions and     The South Asian Monsoon (SAM) directly affects the cli-
a more mesic landscape than today during the MH (the so-        mate of the Indian subcontinent and indirectly influences far-
called African Humid Period), leading to a large decrease       afield regions through atmospheric and oceanic teleconnec-
in airborne dust globally. However, most modeling studies       tions (e.g., Lau, 1992; Liu et al., 2004). Due to its key role
investigating the SAM changes during the Holocene over-         for regional and global hydrological cycles, much attention
looked the potential impacts of the vegetation and dust emis-   has been devoted to better understand and predict its vari-
sion changes that took place over northern Africa. Here, we     ability on multiple timescales, including its long-term future
use a set of simulations for the MH climate, in which veg-      changes (e.g., Huo and Peltier, 2020; Swapna et al., 2018).
etation over the Sahara and reduced dust concentrations are     However, SAM future projections are highly uncertain (e.g.,
considered. Our results show that SAM rainfall is strongly      Huang et al., 2020), and even representing recent trends and
affected by Saharan vegetation and dust concentrations, with    identifying their drivers has been challenging (e.g., Mishra
a large increase in particular over northwestern India and a    et al., 2018) due to the relatively short modern observational
lengthening of the monsoon season. We propose that this re-     record that spans roughly a century. Hence, investigating past

Published by Copernicus Publications on behalf of the European Geosciences Union.
1244                                                         F. S. R. Pausata et al.: SAM remote response to Sahara greening

SAM changes is of utmost importance to better understand            mid-Holocene (MH). Hopcroft and Valdes (2019) showed
its dynamics and future evolution.                                  the dependence on the modeled dust optical properties and
   Dramatic shifts in the intensity of the SAM occurred at          particle size range of the impacts on WAM rainfall, leading
the end of the deglaciation (Bird et al., 2014; Campo et            to potential overestimation of the direct radiative effect on
al., 1982; Dallmeyer et al., 2013; Fleitmann et al., 2003;          precipitation.
Gill et al., 2017; Saraswat et al., 2013) when stronger bo-            Through a set of sensitivity experiments performed with
real summer insolation, increasing greenhouse gas concen-           an Earth system model, Pausata et al. (2017a, b) have shown
trations, and shrinking ice sheets triggered a strengthening of     that the strengthening of the WAM and the associated veg-
the Northern Hemisphere summer monsoon systems (Jalihal             etation and dust feedbacks during the MH are able to affect
et al., 2019a; Sun et al., 2019). In particular, the increased      the El Niño–Southern Oscillation variability as well as trop-
orbital forcing enhanced moisture transport from the Indian         ical storm activity worldwide. Using the same set of simula-
Ocean to the Indian subcontinent, leading to stronger mon-          tions, Piao et al. (2020) showed that a vegetated Sahara leads
soonal precipitation there (e.g., Dallmeyer et al., 2013; Tex-      to an enhancement of the western Pacific subtropical high,
ier et al., 2000). These changes occurred in parallel with a        which in turn strengthens the east Asian summer monsoon.
prolonged period of intense precipitation over northwestern         Sun et al. (2019) highlighted that Northern Hemisphere land
Africa – labeled the African Humid Period. The African Hu-          monsoon precipitation significantly increases by over 30 %
mid Period spanned the entire early and middle Holocene             under the effect of the “Green Sahara”. However, a system-
(12 000–5000 BP) and had far-reaching local and global cli-         atic evaluation of the joint impacts of atmospheric dust load-
matic influences (Muschitiello et al., 2015; Pausata et al.,        ing reductions, Saharan land-cover changes, and insolation
2017a, b; Piao et al., 2020; Sun et al., 2019). Locally, it         changes on the SAM during the mid-Holocene is lacking in
coincided with a major intensification of the West African          current literature.
Monsoon (WAM) and a greening of the present-day Sahara.                Here, we address this gap with the aim of providing in-
Amongst its many remote impacts, the WAM strengthening              sights into future SAM changes. Indeed, a number of recent
contributed to the greening of the arid and semi-arid regions       studies have projected future increases in Sahelian precipita-
of east and south Asia (see Pausata et al., 2020, for a recent      tion (Biasutti, 2013; Giannini and Kaplan, 2019) associated
review). Indeed, the large circulation changes instigated by        with a surface greening and reduced dust emissions (Evan et
the African Humid Period greening of the Sahara, together           al., 2016).
with the associated changes in sea surface temperatures, have          The remainder of the paper is organized as follows: the cli-
likely complemented orbital changes in modulating the SAM           mate model used and the experimental design are described
(see Texier et al., 2000).                                          in Sect. 2. Next, we examine SAM changes during the sum-
   Numerical paleoclimate simulations have typically been           mer, both at the surface and aloft (Sect. 3). A discussion and
deficient in capturing the dramatic shift in the WAM in the         conclusions follow in Sect. 4.
mid-Holocene, even when changes in orbital forcing and
land-surface cover were considered (Harrison et al., 2014).
A crucial factor that has been largely overlooked until re-         2   Model description and experimental design
cently has been the role played by the sharp decrease in Sa-
haran dust emissions, which occurred in conjunction with            The study is based on a set of simulations performed with
the greening (Arbuszewski et al., 2013; McGee et al., 2013).        an Earth system model (EC-Earth version 3.1). EC-Earth
Pausata et al. (2016), Gaetani et al. (2017), and Messori et        version 2 participated in the fifth phase of the Coupled
al. (2019) have shown that atmospheric dust loading pro-            Model Intercomparison Project (CMIP5) and version 3 will
foundly affects monsoonal dynamics and, while changes in            participate in CMIP6 (http://www.ec-earth.org/, last access:
vegetation do lead to increased monsoonal precipitation, a          1 June 2021). The model is comprised of the Integrated
better agreement with proxy data is only reached when a             Forecasting System (IFS cycle 36r4) for the atmosphere,
dust reduction is also simulated (see Tierney et al., 2017).        the Nucleus for European Modelling of the Ocean version
The latter strengthens the effects of land-surface changes,         2 (NEMO2) for the ocean, and the Louvain-la-Neuve sea-
leading to a further increase and northward extension of the        ice Model version 3 (LIM3) for sea ice (Hazeleger et al.,
WAM. Egerer et al. (2018) have also shown that accounting           2010; Yepes-Arbós et al., 2016). The IFS model includes the
for both vegetation and dust feedbacks leads to a better match      Tiled ECMWF Scheme for Surface Exchanges over Land
between model simulations and paleoclimate reconstructions          incorporating land surface hydrology (H-TESSEL) and is
from the northwestern African margin. Another recent study          run at T159 horizontal spectral resolution corresponding to
(Thompson et al., 2019) has suggested a contribution from           roughly 1.125◦ in longitude and latitude, with 62 vertical lev-
dust aerosol reduction of about 15 %–20 % to the total rain-        els. NEMO has a 1◦ horizontal resolution except at the Equa-
fall over the Sahara; however, they also revealed that dust–        tor, where it increases to 1/3◦ (Sterl et al., 2012), and 46 verti-
cloud interactions have the opposite effect compared to the         cal levels. The different components are coupled via the OA-
direct radiative effect on rainfall in northern Africa during the   SIS3 coupler. Relevant for this study, vegetation cover and

Clim. Past, 17, 1243–1271, 2021                                                         https://doi.org/10.5194/cp-17-1243-2021
F. S. R. Pausata et al.: SAM remote response to Sahara greening                                                            1245

monthly aerosol concentrations (Tegen et al., 1997) are pre-      independently and together: orbital (MHPMIP ), orbital forc-
scribed in the model; however, the indirect effect of aerosols    ing and Sahara greening (MHGS ), orbital forcing and dust
on clouds is not considered. A detailed description of the        reduction (MHRD ), and orbital forcing, Sahara greening, and
aerosol components can be found in Hess et al. (1998).            dust reduction (MHGS+RD ). In Sect. 3.3 we then compare the
The main characteristics of dust particles are reported in Ta-    model findings to paleoclimate archives.
ble A1.
   We analyze a MH experiment (MHPMIP ), which follows
the protocol for the standard mid-Holocene simulations in ac-     3.1     Changes in surface climate
cordance with the third phase of the Paleoclimate Modelling
Intercomparison Project (PMIP3) (Taylor et al., 2009, 2012)       3.1.1    Precipitation
and three sensitivity experiments performed by Pausata et
al. (2016) and Gaetani et al. (2017) (Table 1). The MHPMIP        In the PI experiment, the SAM displays the most intense
includes mid-Holocene orbital forcing and greenhouse gas          summertime (particularly June and July) precipitation over
concentrations, pre-industrial land cover, and airborne dust      the west coast of the Indian subcontinent and the Himalayan
concentrations. The three sensitivity experiments were car-       foothills (Fig. 1a), in overall agreement with observations
ried out to investigate the effects of changes to land-cover      (Figs. A1 and A2). The MHPMIP experiment simulates a gen-
conditions and dust concentration in isolation as well as in      eral increase in SAM rainfall over south Asia compared to PI
combination. In the MHGS (“Green Sahara”) setup, the veg-         (Fig. 2a) as also shown by other PMIP model experiments
etation type (and related parameters; see below) over the Sa-     (e.g., Zhao and Harrison, 2012), particularly over southern
hara (defined as the area within 11–33◦ N, 15◦ W–35◦ E) is        India and the Himalayan foothills. In contrast, decreased pre-
prescribed to be evergreen shrub, representing an idealized       cipitation is seen over most of the Bay of Bengal, South
African Humid Period scenario, while dust concentration is        China Sea, and Thailand. This decrease in precipitation is
left unaltered at its pre-industrial (PI) amounts. In the MHRD    a result of the reduced surface latent heat flux over the ocean
(“reduced dust”) setup, the dust concentration over north-        as shown in Jalihal et al. (2019b). This results in a decrease
ern Africa is reduced by up to 80 % relative to pre-industrial    in the net energy flux into the atmosphere over these regions,
values (see Figs. 1 and S1 in Gaetani et al., 2017). Outside      leading to a decline in precipitation. A precipitation anomaly
northern Africa, dust concentrations smoothly transition to       dipole is simulated along the equatorial Indian Ocean, with
pre-industrial values. Over India and the Arabian Sea the re-     increased precipitation to the west and decrease to the east.
duction of dust concentrations ranges between 20 % (east-         The greening of the Sahara (MHGS ) leads to a general inten-
ern Indian subcontinent) and 60 % (Horn of Africa and the         sification of the anomaly pattern simulated when only includ-
Middle East); for more details, see Fig. S1 in Pausata et         ing orbital forcing (MHPMIP ; Fig. A3a). However, some pe-
al. (2016). In the MHRD experiment the land-surface proper-       culiar characteristics emerge: in particular, the precipitation
ties are kept to PI values. The final experiment (MHGS+RD )       increases over a broad swathe of northwestern India and Pak-
considers the case where both vegetation and dust changes         istan, while it decreases over the Western Ghats (cf. Fig. 2a
described above are simultaneously prescribed. The imposed        and b, and see also Fig. A3a). The positive rainfall anomaly
changes in vegetation type correspond to important changes        over the western equatorial Indian Ocean extends eastward,
in surface albedo and leaf area index (LAI) as summarized in      strongly reducing the negative precipitation anomaly in the
Table 2. Both albedo and LAI are fixed throughout the simu-       eastern side of the basin. The reduction in precipitation over
lations and are not modulated by modeled processes. Under         the Bay of Bengal, southeast Asia, and Thailand further in-
the Green Sahara scenario, the albedo decreases from 0.3 to       tensifies. The reduced Saharan dust (MHRD ) leads to a pat-
0.15, while the LAI increases from 0.2 to 2.6. For a more de-     tern that is very similar – albeit with weaker anomalies – to
tailed description of these simulations, the reader is referred   the orbital-only forcing (MHPMIP ; Fig. A3b); however, the
to Pausata et al. (2016) and Gaetani et al. (2017). These sen-    precipitation increase over southern India is confined to east
sitivity experiments are compared to a PI simulation to in-       of the Western Ghats, while a small decrease in rainfall is
vestigate the role of each forcing in altering the SAM. The       simulated along the western coast of the Indian subcontinent
analysis focuses on the June–September (JJAS) period using        (cf. Fig. 2a and c, and see also Fig. A3b). When combin-
the last 50 years of each experiment. Finally, the statistical    ing vegetation and reduced dust (MHGS+RD ), features of both
significance of the differences between experiments at the        simulations (MHGS and MHRD ) are preserved (Fig. 2d): the
5 % level is evaluated by a two-tailed Student’s t test.          MHGS+RD anomaly pattern in the region is almost exactly
                                                                  the linear combination of the MHGS and MHRD experiments
                                                                  (Fig. A4). For example, the reduced precipitation over the
3   Results                                                       Western Ghats is further enhanced in the MHGS+RD , while
                                                                  the increase over the Himalayan foothills is reduced com-
This section discusses the SAM response in terms of local         pared to the MHGS , which is due to the effect of the dust
(Sect. 3.1) and large-scale changes (Sect. 3.2) to each forcing   reduction (cf. Fig. 2a and c, and see also Fig. A3b).

https://doi.org/10.5194/cp-17-1243-2021                                                      Clim. Past, 17, 1243–1271, 2021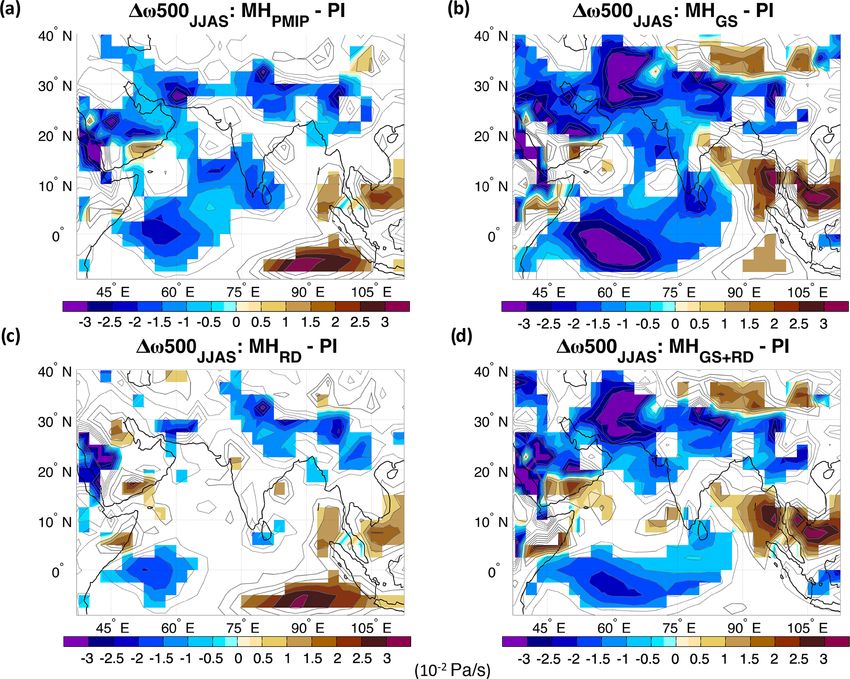
1246 F. S. R. Pausata et al.: SAM remote response to Sahara greening
Table 1. Boundary conditions for all MH experiments.
Simulation Orbital forcing GHGs Saharan Saharan
BP vegetation dust
MHPMIP 6000 MH Desert PI
MHGS 6000 MH Shrub PI
MHRD 6000 MH Desert Reduced
MHGS+RD 6000 MH Shrub Reduced
Table 2. Albedo and leaf area index (LAI) for desert, evergreen shrub, and the domain over which the vegetation changes are applied in each
setup.
Vegetation type Albedo LAI Domain
PS Mainly desert 0.30 0.18 11–33◦ N, 15◦ W–35◦ E
GS Evergreen shrub 0.15 2.6 11–33◦ N, 15◦ W–35◦ E
While seasonal-mean precipitation determines the overall pattern is similar to observations, our simulation displays a
amount of water supplied, subseasonal changes in the mon- cold anomaly over a large part of the domain (Fig. A1). The
soon, such as a shift in the onset and/or the withdrawal, are changes in the orbital forcing (MHPMIP ) do not remarkably
key to determining the length and hence the precipitation rate alter the summer surface temperature over India and south-
over the monsoonal season. The SAM in the PI simulation east Asia, with only a modest increase over central eastern
starts in late May (Figs. 3 and A2a), with the monsoon then India and up to 1 ◦ C warming in southeast Asia (Fig. 4a).
developing until early August and retreating in early Septem- A large increase (even more than 3 ◦ C) is instead simulated
ber (Figs. 3 and A2a). In the MHPMIP experiment, the model outside the area of direct influence of the SAM and in partic-
simulates a delayed onset south of 15◦ N but not at higher ular over the arid and semi-arid regions of south Asia and
latitudes (Fig. 3a). The withdrawal is, however, delayed at all the Arabian Peninsula (Fig. 3a). A positive Indian Ocean
latitudes, lengthening the overall duration of the monsoon by dipole (IOD)-like pattern develops in the Indian Ocean with
about 1 month. The Sahara greening (MHGS ) leads to a fur- warmer sea surface temperatures (SSTs) of about 0.5–1 ◦ C
ther lengthening of the monsoon season from April to Octo- over the eastern equatorial Indian Ocean up to roughly 15◦ N
ber, and increased cumulative precipitation over a large part and colder anomalies of up to 1.5 ◦ C off the east coast of In-
of the SAM region (Fig. 3b). The delayed onset is confined donesia (Fig. 4a). Colder SSTs are instead present over the
to the region well south of 10◦ N. While showing a length- northernmost part of the Arabian Sea, and warmer SSTs are
ening of the monsoon season, the regions around the 15◦ N prevalent over most of the Bay of Bengal, in contrast with
latitude band show a decrease in precipitation between June the conventional IOD as seen in reanalysis data (e.g., Saji
and mid-August (Fig. 3b). Dust reduction (MHRD ) leads to et al., 1999; Webster et al., 1999). The positive IOD-like pat-
a much stronger delay of the monsoon onset that extends up tern that develops under MH orbital forcing is responsible for
to 25◦ N compared to the MHPMIP experiment (Fig. 3c). The some of the rainfall anomalies discussed above (Fig. 2a): in
withdrawal of the monsoon is also delayed and resembles particular, the precipitation dipole along the Equator and in-
the MHPMIP simulation (Fig. 3c). In the MHGS+RD case, the creased rainfall over the southern tip of India (Fig. 2a), which
distribution of rainfall is dominated by the Sahara greening, are typical of a positive IOD pattern (Fig. A5). There are,
but the footprint of the dust reduction is visible at the lower however, differences in the anomalies over India and the Bay
latitudes. These display a stronger decrease in precipitation of Bengal in the simulations since the orbital forcing primar-
than the MHGS simulation, in particular during the core mon- ily drives these anomalies. A classical positive IOD leads to
soonal season – June to late August (Fig. 3d). Therefore, re- an increase in precipitation over the core monsoon zone and
duced dust seems to primarily reduce the south Asian mon- the northern Bay of Bengal and a decrease in precipitation
soonal precipitation at low latitudes, while the greening of over the southern Bay of Bengal, peninsular India, and the
the Sahara increases the precipitation further north. Himalayan foothills (see Ashok et al., 2001; Saji et al., 1999).
The orbital forcing leads to a different response over land and
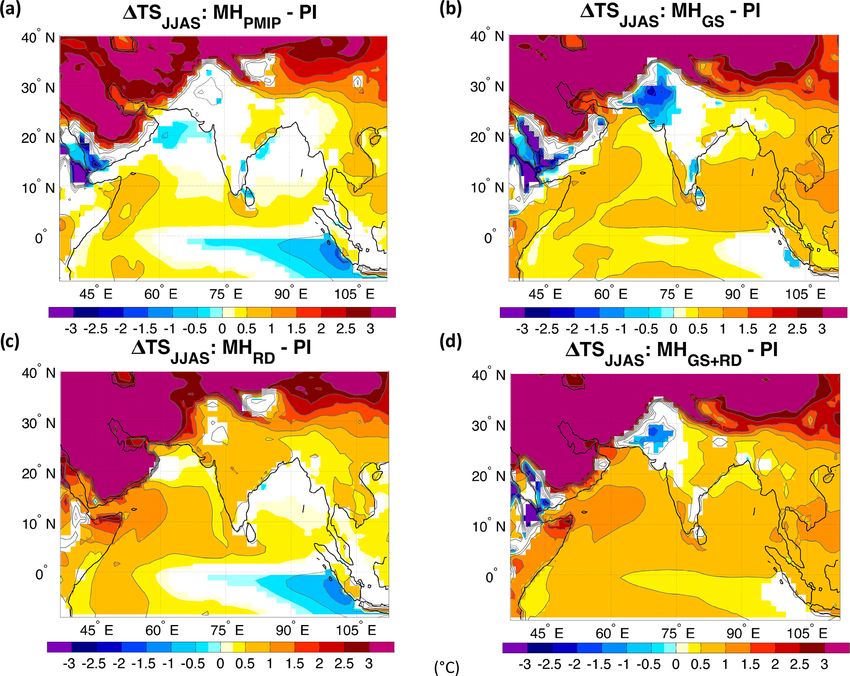
3.1.2 Surface temperature the ocean (Fig. 2a).
The Sahara greening (MHGS ) leads to a similar anomaly
The highest PI surface temperatures on the Indian subconti- pattern to that of MHPMIP in the surface temperature (cf.
nent are simulated over its northwestern part, in agreement Fig. 4a and b, and see also Fig. A6a). However, the warming
with observations (Fig. A1). However, while the temperature
Clim. Past, 17, 1243–1271, 2021 https://doi.org/10.5194/cp-17-1243-2021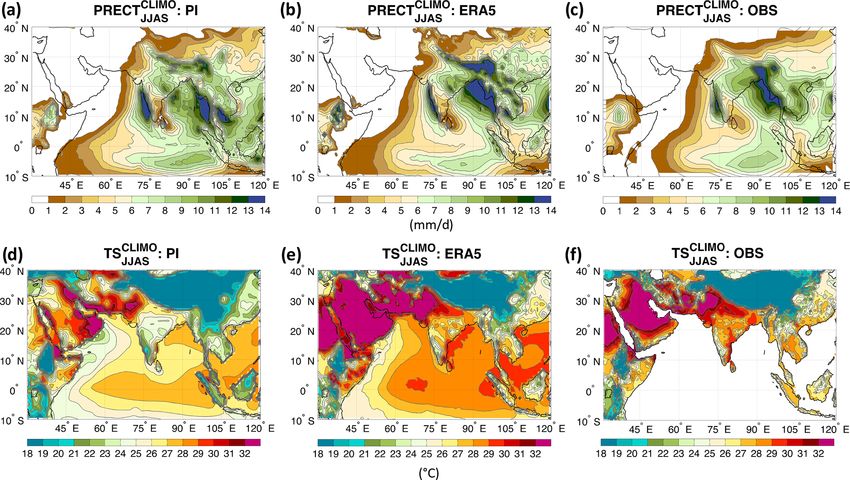
F. S. R. Pausata et al.: SAM remote response to Sahara greening 1247
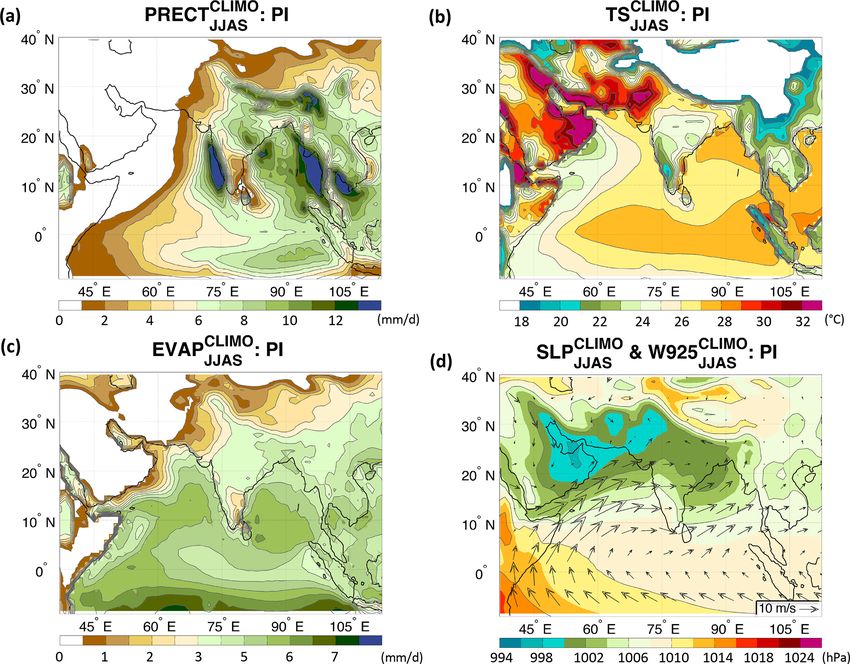
Figure 1. (a) Climatological summer (JJAS) precipitation (PRECT, mm/d); (b) surface temperature (TS, ◦ C); (c) evaporation (EVAP, mm/d);
and (d) sea level pressure (shadings, SLP, hPa) and 925 hPa wind (arrows, W925, m/s) for the PI experiment. The contour lines follow the
color-bar scale.
is more pronounced than in MHPMIP over the bulk of the do- Table A1), it increases the incoming solar radiation reaching
main, with northwestern India being an exception (Fig. A6a). the surface and hence favors surface warming. For the same
This may be linked to the simulated increase in rainfall in reason, the cold SST anomalies in the northernmost Arabian
the region (Figs. 2b, A3a). The cold SST anomalies over Sea in the MHPMIP experiment are replaced by a modest
the northern Arabian Sea are replaced by warm anomalies warm anomaly. Finally, the surface temperature response to
that encompass almost the entire Indian Ocean north of the the combined forcings (MHGS+RD ; Fig. 4d) closely resem-
Equator. The temperature increases off the coast of the So- bles the linear combination of the two forcings (Fig. A4f),
mali peninsula and the southern tip of India exceed 1 ◦ C. The except over the regions facing the Gulf of Aden and southern
positive IOD-like pattern is still present, particularly when Red Sea, where the cooling due to increased monsoonal pre-
considering relative anomalies as the SSTs over the equa- cipitation in the MHGS (Fig. 2b) prevails over the warming
torial Indian Ocean are generally warmer compared to the associated with enhanced shortwave radiation in the MHRD
MHPMIP . The IOD index is inversely related to the Indian (Fig. 5).
monsoon rainfall (Fig. A7), thus suggesting that the MH, GS,
and RD forcings have a dominant effect on the Indian mon-
soon. Reduced Saharan dust (MHRD ) leads to a widespread 3.1.3 Evapotranspiration
surface warming over the Arabian Peninsula, the Arabian
From an impact-based perspective, changes in precipitation
Sea, and the Indian subcontinent (cf. Fig. 4a and c, and see
are only one part of the hydrological cycle, which also
also Fig. A6b). Such warming is partially due to a reduc-
includes evaporation and, over land, transpiration as well.
tion in rainfall (Fig. A3b) and hence cloud cover in particu-
Therefore, it is important to also investigate the evapotran-
lar over southern India and southern Arabic Peninsula. Fur-
spiration changes during the MH climate to better understand
thermore, while the reduced dust layer leads to a decrease
the impacts of changes in orbital forcing and Saharan vegeta-
in temperature in the mid-troposphere as dust is moderate-
tion and dust on the water budget of south Asia. In the PI ex-
to-highly absorbing (single scattering albedo ω0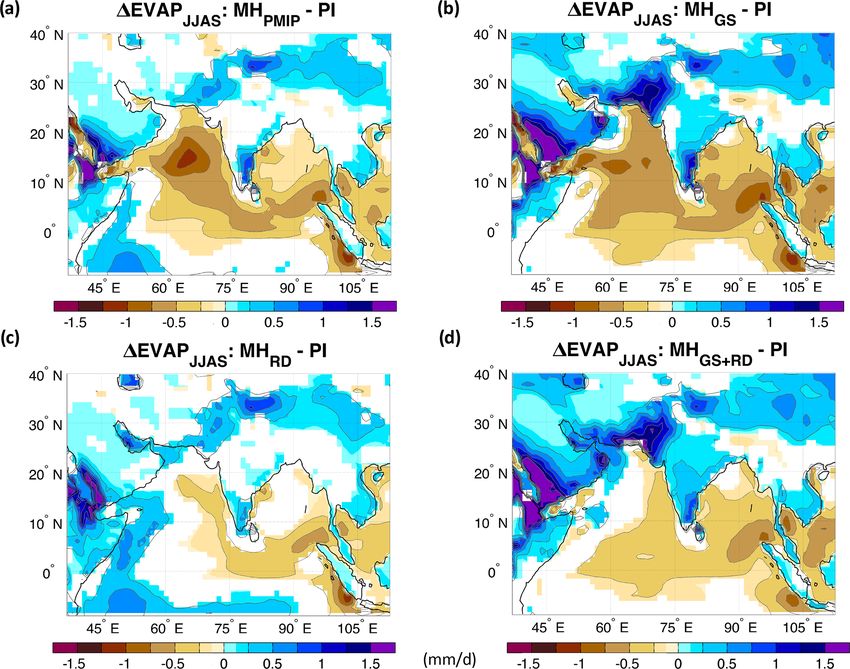
1248 F. S. R. Pausata et al.: SAM remote response to Sahara greening
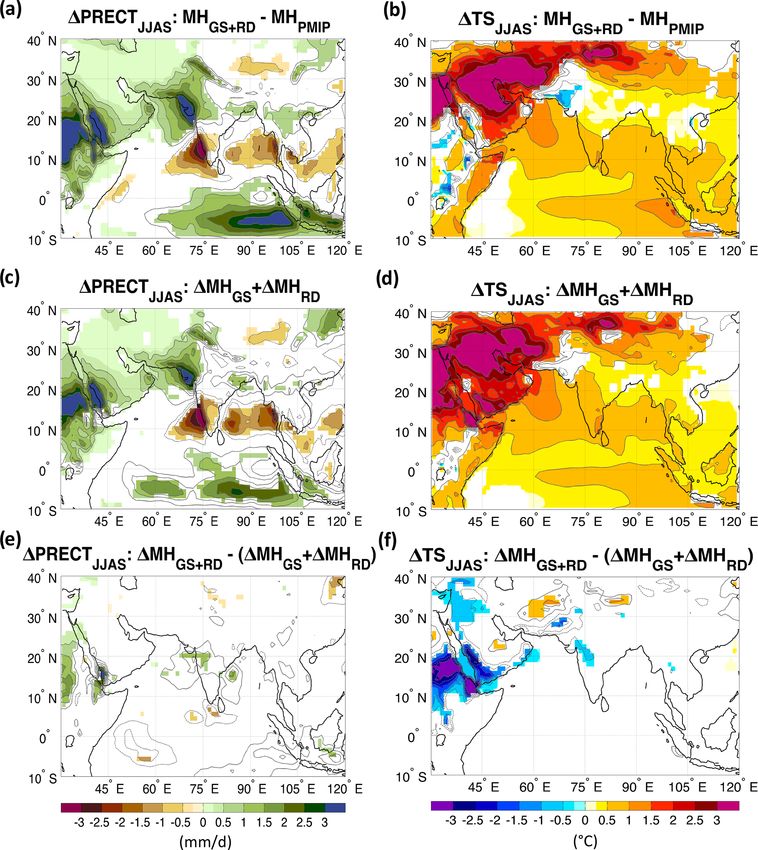
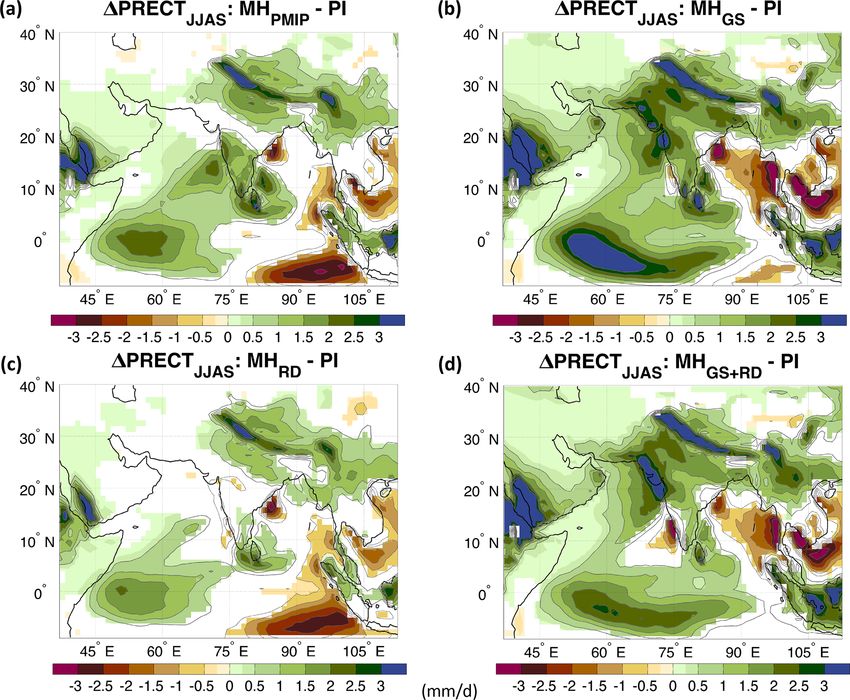
Figure 2. Changes in summer (JJAS) precipitation (PRECT; mm/d) for the (a) mid-Holocene-only orbital forcing (MHPMIP ); (b) the Sahara
greening (MHGS ); (c) the dust-only reduction (MHRD ); and (d) the Sahara greening and dust reduction (MHGS+RD ) experiments relative to
the PI reference simulation. The contour lines follow the color-bar scale (the 0 lines are omitted for clarity). Only differences significant at
the 95 % confidence level using the Student t test are shaded.
subtropical desert regions, while rates in excess of 3 mm/d effects of dust reduction dominate over the Arabian Sea and
are present over the Indian subcontinent (Fig. 1c). In the western Indian Ocean (Fig. 6d).
MHPMIP experiment, the evapotranspiration is increased over
northwestern and southeastern India, the Tibetan Plateau, and
3.2 Changes in the large-scale monsoonal circulation
southeast Asia (Fig. 6a). These regions are characterized by
increases in precipitation and/or surface temperature (Figs. 2 The PI sea level pressure (SLP) pattern displays a thermal
and 4), which enhance the evapotranspiration. On the con- low over the Arabian Peninsula extending into the northern
trary, the Indian Ocean displays a widespread decrease in part of the Indian subcontinent (Fig. 1d). This is associated
evaporation rates except along the coast of Somalia. The with an anticyclonic circulation over the Indian Ocean lead-
Sahara greening (MHGS ) leads to a widespread increase in ing to a strong westerly flow across the Indian subcontinent
evapotranspiration across most of the Indian subcontinent, and southeast Asia, which brings large amounts of moisture
enhancing the anomaly pattern simulated in the MHPMIP ex- to these regions (Figs. 1a and d, A10a). The strong wester-
periment (Fig. 6a and b, and see also Fig. A8a). The reduc- lies over the Arabian Sea favor upwelling and explain the
tion in airborne dust (MHRD ) does not notably alter the evap- origin of the “cold pool” in that region (Fig. 1b). Anomalous
oration over land compared to the orbital-forcing-only exper- easterlies along the equatorial Indian Ocean advect warmer
iment (MHPMIP ); however, it significantly increases the evap- water towards the western basin, leading to an increase in
oration over the Arabian Sea due to the increase in incoming SSTs there. This further enhances convection over the west-
solar radiation (panels a and c in Figs. 5 and 6, and A8b). ern equatorial Indian Ocean region. Concurrently, upwelling
Finally, the combined forcing (MHGS+RD ) leads to mainly increases over the eastern equatorial Indian Ocean, and thus
positive anomalies over land, as in the MHGS case, while the SSTs cool and precipitation decreases. As a result, a strong
coupling between precipitation, circulation, and SST anoma-
Clim. Past, 17, 1243–1271, 2021 https://doi.org/10.5194/cp-17-1243-2021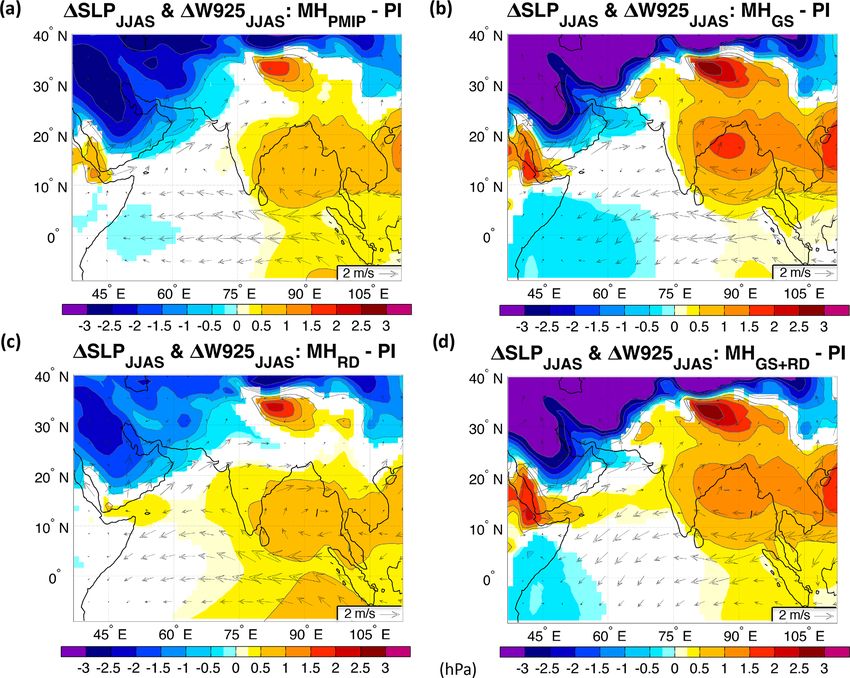
F. S. R. Pausata et al.: SAM remote response to Sahara greening                                                                     1249

Figure 3. Changes in climatological seasonal cycle of zonal precipitation (PRECT; mm/d) between 65 and 95◦ E for (a) the mid-Holocene-
only orbital forcing (MHPMIP ); (b) the Sahara greening (MHGS ); (c) the dust-only reduction (MHRD ); and (d) the Sahara greening and dust
reduction (MHGS+RD ) experiments relative to the PI reference simulation. The contour lines show the climatological zonal precipitation of
the PI experiment (1 mm/d intervals).

lies is established across the equatorial Indian Ocean, bearing        Bay of Bengal towards the western Indian Ocean and then
close similarity with the pattern characteristic of the positive       the Arabian Sea and Indian subcontinent (Fig. 8a), explain-
phase of the IOD. The subsequent changes in the low-level              ing the rainfall changes seen in Fig. 2a. One may further
jet (intensification and a northward shift) lead to a cooling          connect the above circulation changes to the widespread de-
in the northern Arabian Sea (through enhanced coastal up-              crease in evaporation rates simulated across most of the In-
welling) and warming in the Bay of Bengal (through reduced             dian Ocean and the concomitant increase along the coast of
winds and therefore evaporation). Thus, the SST anomalies              Somalia (Fig. 6a). For example, the latter evaporation in-
in the Arabian Sea and the Bay of Bengal are different in the          crease is most likely driven by weakened monsoonal flow
MH simulations from those for a positive IOD in the reanal-            (Fig. 7a), which causes higher SSTs (Fig. 4a) and increases
ysis data (e.g., Saji et al., 1999; Webster et al., 1999).             evaporation in the MHPMIP compared to the PI experiment
   The MH orbital forcing (MHPMIP ) deepens the Saharan                (Fig. 6a). Conversely, the decreased evaporation in the north-
and Saudi Arabian heat low, while increasing the pressure              ern Arabian Sea may be ascribed to the strengthened mon-
over the Bay of Bengal relative to the PI. This anomaly pat-           soonal flow, which increases upwelling and in turn cools the
tern leads to an intensification of the easterly flow south of         region (Fig. 4a). Finally, the weakened westerly flow around
the Indian subcontinent, which then turns northeastward over           the southern tip of India may be responsible for decreased
the Arabian Sea (Fig. 7a), intensifying the monsoonal flow             evaporation and a consequent increase in SSTs of that re-
and in turn the upwelling in the region. The colder SSTs               gion. Under the Green Sahara conditions (MHGS ), the SLP
simulated over the northernmost part of the Arabian Sea are            anomaly pattern intensifies relative to the MHPMIP and shifts
likely a direct consequence of this (Fig. 4a). The intensified         to the northwest, thus weakening the southwesterlies over
monsoonal flow enhances the transport of moisture from the             the Arabian Sea, while strengthening the easterlies over the

https://doi.org/10.5194/cp-17-1243-2021                                                             Clim. Past, 17, 1243–1271, 2021
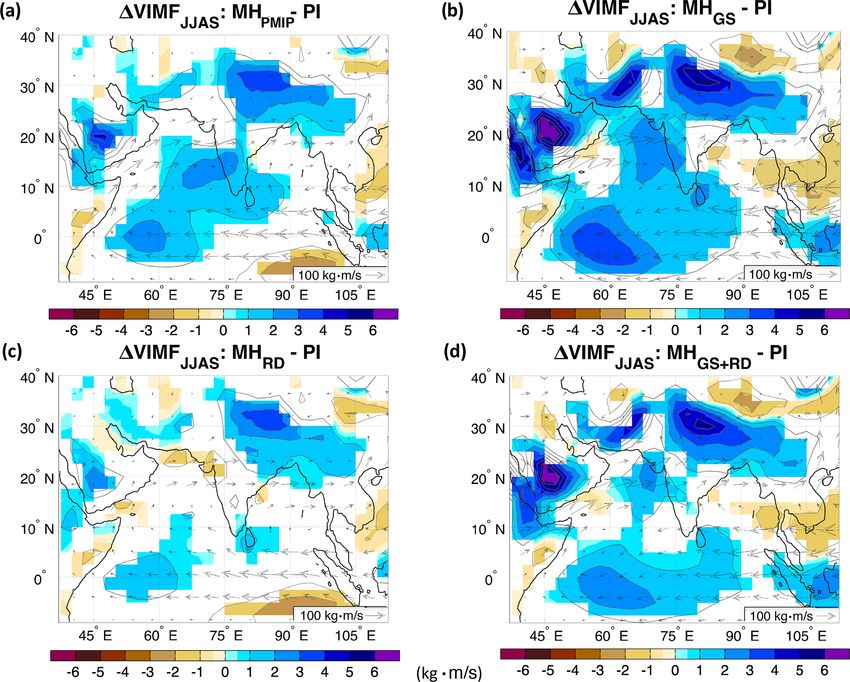
1250                                                             F. S. R. Pausata et al.: SAM remote response to Sahara greening

Figure 4. Changes in summer (JJAS) surface temperature (TS; ◦ C) for the (a) mid-Holocene-only orbital forcing (MHPMIP ); (b) the Sahara
greening (MHGS ); (c) the dust-only reduction (MHRD ); and (d) the Sahara greening and dust reduction (MHGS+RD ) experiments relative to
the PI reference simulation. The contour lines follow the color-bar scale (the 0 lines are omitted for clarity). Only differences significant at
the 95 % confidence level using the Student t test are shaded.

southern tip of India (Fig. 6a and b, and see also Fig. A9a).             ther east, there is a strengthened northwesterly flow over the
The latter anomaly can explain the decrease in precipita-                 Bay of Bengal extending towards the western equatorial Pa-
tion over the western slopes of the Western Ghats and the                 cific, associated with a decreased moisture convergence over
increase on their eastern side. Although the southwesterly                Bangladesh and northeastern India relative to the MHPMIP
flow over the Arabian Sea is less intense than in the MHPMIP              simulation (Fig. A11b). This circulation change causes a pre-
(Fig. A9a), the moisture advection is enhanced (Figs. 7b and              cipitation increase in the MHRD that is smaller than that in
A11a), which explains the increased precipitation and evap-               the MHPMIP relative to the PI (Figs. 2c and A3b). When com-
otranspiration over most of India (Figs. 2b, 6b, A8a). Indeed,            bining both Sahara greening and dust reduction (MHGS+RD ),
the weakened atmospheric flow decreases the upwelling and                 SLP anomalies are mostly a linear combination of the two
in turn increases SSTs, favoring more evaporation over the                forcings (Fig. 7d). In particular, the cyclonic footprint over
Arabian Sea (Fig. A8a). Reduced Saharan dust (MHRD ) re-                  the Indian Ocean and the easterly moisture transport from
sults in a northward expansion of the Mascarene High in the               the Pacific to the Indian Ocean are both features of the MHGS
southern Indian Ocean and a weakening of the Saudi Ara-                   experiment (Figs. A9 and A11). On the other hand, over the
bian heat low relative to MHPMIP experiment (Fig. 6a and                  Arabian Sea, both forcings contribute to a weakened westerly
c, and see also Fig. A9b). This leads to a weakening of the               flow, albeit at slightly different latitudes.
Somali jet, a weaker coastal upwelling in the Arabian Sea                    We next analyze the mid- and upper-level circulation as-
favoring modest warm SST anomalies there (Fig. 4c), and                   sociated with the monsoonal flows. The PI 500 hPa vertical
ultimately a weaker moisture transport from the Arabian Sea               velocity field shows a strong ascending flow across the trop-
to the southern half of the Indian subcontinent (Fig. 7a and              ics during the monsoon season (Fig. A10b), matching the
c, and see also Fig. A11b). The weakened low-level winds                  areas of low SLP shown in Fig. 1d, with the clear excep-
relative to MHPMIP are consistent with the significant de-                tion of the areas under thermal low pressures (e.g., Saudi
crease in precipitation over western India (Fig. A3b). Fur-               Arabia and Iran). Subsidence is largely limited to the west

Clim. Past, 17, 1243–1271, 2021                                                                https://doi.org/10.5194/cp-17-1243-2021

F. S. R. Pausata et al.: SAM remote response to Sahara greening                                                                    1251

Figure 5. Changes in summer (JJAS) top-of-the-atmosphere shortwave radiation (RADTOP ; W/m2 ) for the (a) mid-Holocene-only orbital
forcing (MHPMIP ); (b) the Sahara greening (MHGS ); (c) the dust-only reduction (MHRD ); and (d) the Sahara greening and dust reduction
(MHGS+RD ) experiments relative to the PI reference simulation. The contour lines follow the color-bar scale (the 0 lines are omitted for
clarity). Only differences significant at the 95 % confidence level using the Student t test are shaded.

Arabian Sea and Somali peninsula (Fig. A10b). Addition-                Fig. A12b), except over the southern tip of India where sub-
ally, strong subsidence occurs over the desert regions of              sidence is increased. However, significant anomalies in the
the Arabian Peninsula and Iran. Changes in orbital forcing             vertical velocity emerge over the Arabian Peninsula relative
(MHPMIP ) drive a strengthened upward motion over the west-            to the MHPMIP simulation (Fig. A12b). The result of the Sa-
ern north-equatorial Indian Ocean, southern India, and the             hara greening and dust reduction forcing (MHGS+RD ) over
Himalayan foothills (Fig. 9a). This favors cloud formation             Asia is to a great extent a linear combination of the two sep-
and is consistent with increased precipitation over these re-          arate forcings (Fig. 9d), as was indeed the case for the other
gions (Fig. 2a). Upward anomalies are also found over the              variables analyzed here.
climatologically dry southern Arabian Peninsula and part of               We next discuss the upper-level velocity potential and di-
the Horn of Africa (Fig. 9a). Sahara greening (MHGS ) in-              vergent winds, which provide a framework to analyze the
tensifies the anomaly pattern seen in the MHPMIP experi-               regional anomalies in the context of the large-scale tropi-
ment, in particular over northwestern India and the western            cal overturning circulation. The PI experiment shows a di-
Indian Ocean, with much stronger increases in upward mo-               vergent flow emanating from southeast Asia towards the sur-
tions (Fig. A12a). On the other hand, subsidence develops on           rounding Asian monsoon regions (contour lines in Fig. 10),
the lee side of the Western Ghats (Figs. 9b and A12a) due to           which is consistent with the low SLP there (Fig. 1d). In
the stronger easterly anomalies simulated in the MHGS rela-            the MHPMIP , the whole pattern of velocity potential and
tive to the MHPMIP experiment (Fig. A9a). Reducing Saharan             the centers of divergence/convergence are shifted westward
dust emissions (MHRD ) lead to overall minor and mostly in-            (Fig. 10a), with dipole anomalies centered over northern
significant anomalies over the central SAM region relative             Africa and the Arabian Peninsula (negative velocity poten-
to the MHPMIP simulation (cf. Fig. 8a and c, and see also              tial/divergence) and South America (positive velocity poten-

https://doi.org/10.5194/cp-17-1243-2021                                                            Clim. Past, 17, 1243–1271, 2021
1252                                                            F. S. R. Pausata et al.: SAM remote response to Sahara greening

Figure 6. Changes in summer (JJAS) evapotranspiration (EVAP; mm/d) for the (a) mid-Holocene-only orbital forcing (MHPMIP ); (b) the
Sahara greening (MHGS ); (c) the dust-only reduction (MHRD ); and (d) the Sahara greening and dust reduction (MHGS+RD ) experiments
relative to the PI reference simulation. The contour lines follow the color-bar scale (the 0 lines are omitted for clarity). Only differences
significant at the 95 % confidence level using the Student t test are shaded.

tial/convergence). The divergence over the northwestern In-              5◦ N, 50–65◦ E) and northeastern Africa (NEA, 10–20◦ N,
dian subcontinent is strengthened, which implies an intensi-             30–45◦ E). Anomalous convective heating over these regions
fied low-level convergence and hence stronger precipitation              in response to changes in Earth’s precession can drive a
in the region. The greening of the Sahara (MHGS ) further in-            Matsuno–Gill-like response in the low-level winds over the
tensifies the anomaly pattern seen in the MHPMIP experiment              Indian Ocean (Jalihal et al., 2019b). The anomalous easter-
(cf. Fig. 9a and b, and see also Fig. A13a). The dust reduction          lies extend into the Bay of Bengal, reducing the wind speed
experiment contributes to a strong positive anomaly in ve-               there and leading to a reduction in surface latent heat fluxes.
locity potential over the Arabian Sea relative to MHPMIP (cf.            This further leads to a decrease in the net energy flux into the
Fig. 9a and c, and see also Fig. A13b), thus weakening upper             atmosphere (top plus bottom) over the Bay of Bengal. Since
tropospheric divergence and the lower tropospheric conver-               precipitation is proportional to the net energy flux into the
gence. The Green Sahara reduced dust (MHGS+RD ) experi-                  atmosphere, precipitation over the Bay of Bengal decreases
ment resembles the MHGS forcing, but the anomalies are re-               (Jalihal et al., 2019b). The vegetation and dust forcings fur-
duced due to the effect of dust reduction (Figs. 10 and A13c).           ther modulate the precipitation over the WEIO and NEA, re-
   The anomalies in velocity potential are negative over both            sulting in a corresponding change in precipitation over the
India and the Bay of Bengal, albeit with smaller magnitudes              Bay of Bengal. MHGS shows the largest increase in precipi-
over the latter region. Therefore, the decrease in precipitation         tation over the WEIO and NEA (Fig. 11a). Proportionately,
over the Bay of Bengal cannot be explained by the changes                the decrease in latent heat flux over the Bay of Bengal is also
in upper-level velocity potential/divergence alone. To under-            the largest. On the other hand, the weakest increase in pre-
stand the effect of the greening of the Sahara and the reduc-            cipitation over the WEIO and NEA regions is simulated in
tion of dust concentrations (MHGS , MHRD , and MHGS+RD )                 the MHRD . The associated reduction in latent heat flux over
on precipitation over the Bay of Bengal, we consider the rain-           the Bay of Bengal is also the smallest. As the latent heat flux
fall over the western equatorial Indian Ocean (WEIO, 5◦ S–               decreases, it leads to a larger reduction in precipitation over

Clim. Past, 17, 1243–1271, 2021                                                              https://doi.org/10.5194/cp-17-1243-2021
F. S. R. Pausata et al.: SAM remote response to Sahara greening                                                                       1253

Figure 7. Changes in summer (JJAS) sea level pressure (shadings, SLP; hPa) and 925 hPa wind (arrows, W925; m/s) for the (a) mid-
Holocene-only orbital forcing (MHPMIP ); (b) the Sahara greening (MHGS ); (c) the dust-only reduction (MHRD ); and (d) the Sahara greening
and dust reduction (MHGS+RD ) experiments relative to the PI reference simulation. The contour lines follow the color-bar scale (the 0 lines
are omitted for clarity). Only SLP differences significant at the 95 % confidence level using the Student t test are shaded.

the Bay of Bengal (Fig. 11b). This change in latent heat flux           leads to a pattern anomaly very similar to the MHPMIP ex-
is due to the impact of precipitation over the WEIO and NEA             periment – albeit weaker (cf. Fig. 12a and c). The effect
on wind speed over the Bay of Bengal (Fig. A14). Our simu-              of the combined forcings (MHGS+RD ) is dominated by the
lations show a linear relationship between precipitation over           MHGS pattern (Fig. 12d) and in this case the anomalies are
the WEIO and NEA, and precipitation over the Bay of Ben-                even larger than in the MHGS case. This is likely due to the
gal (Fig. 11c).                                                         increase in temperature gradient between low and high lati-
   We conclude our analysis by investigating the changes in             tudes relative to the MHGS case (not shown).
the upper-level (200 hPa) jet (Fig. 12). In the PI experiment,
the core of the subtropical jet is located over western Asia
and the exit of jet is located over northeastern China (con-            3.3    Model–proxy intercomparison
tour lines in Fig. 12). In the MHPMIP simulation, the jet is
shifted northwards, with an overall weakening to the south              To evaluate the model performance when accounting for Sa-
and a strengthening confined to the northward side of the               hara greening and reduction in airborne dust concentrations,
exit of the jet streak (Fig. 12a). The Sahara greening (MHGS )          we compare our simulations to the available marine and ter-
leads to an accelerated westerly flow at the jet entrance but           restrial paleoclimate archives. We focus on the most appar-
an overall slowing down at the jet exit together with a fur-            ent dissimilarities between the sensitivity experiments and
ther increase in the northward shift relative to the MHPMIP             the standard MH simulation (MHPMIP ) where only orbital
experiment (Fig. 12b). These changes cause a slight tilt in             forcing is considered. While our simulations are centered at
the jet that favors more aloft divergence over northern India           6000 BP, they should be seen as indicative of the wet early–
and Pakistan as also seen in Fig. 9b, which in turn favors              middle Holocene rather than a snapshot of exactly 6000 BP,
increased rainfall in the region. The dust reduction (MHRD )            which appears to be a period of transition in particular for
                                                                        Indian terrestrial records (e.g., Prasad et al., 1997).

https://doi.org/10.5194/cp-17-1243-2021                                                              Clim. Past, 17, 1243–1271, 2021
1254 F. S. R. Pausata et al.: SAM remote response to Sahara greening Figure 8. Changes in summer (JJAS) vertically integrated (from 1000 to 300 hPa) horizontal moisture flux (VIMF; kg m/s) for the (a) mid- Holocene-only orbital forcing (MHPMIP ); (b) the Sahara greening (MHGS ); (c) the dust-only reduction (MHRD ); and (d) the Sahara greening and dust reduction (MHGS+RD ) experiments relative to the PI reference simulation. The contour lines follow the color-bar scale (the 0 lines are omitted for clarity). The arrows represent the zonal and meridional components of the moisture flux. Only differences significant at the 95 % confidence level using the Student t test are shaded. Notable differences in summer precipitation between crease in precipitation (Fig. 2) over western and northwest- the four simulations occur over western India (Fig. 2), ern India, even though the monsoonal flow is weaker com- which shows substantially wetter conditions in MHGS and pared to MHPMIP (Fig. A4). This suggests that the modern MHGS+RD , compared to the MHPMIP experiment in that re- teleconnections may not precisely hold in the past, and the gion. Nal Sarovar, a brackish lake bordering the Thar Desert, inferred changes based on only tropical Pacific SST patterns appears to have been wetter than today around 6200 BP, may underestimate the total rainfall changes during the early with a drying tendency towards the end of the MH (Prasad and middle Holocene over northwestern India. et al., 1997). There is evidence for a substantial pluvial Another region where our simulations show divergent re- between ∼ 9000 and 6000 BP farther north in the core of sults is southwestern coastal India. There, the MHGS+RD the Thar (Deotare et al., 2004; Gill et al., 2015; and refer- experiment shows drier conditions relative to PI, while the ences therein), and a reduced dimension analysis suggests MHPMIP shows wetter conditions (Fig. 2). Paleoclimate that reconstructed tropical Pacific SSTs alone could have archives from the Nilgiri Mountains, in the Western Ghats driven a 60 % increase in precipitation there during the early at the eastern edge of the simulated dry anomaly, suggest Holocene (see Fig. 5 in Gill et al., 2017). However, Gill et that the region was wetter between 12 000 and 10 000 BP al. (2017) inferred winds and the precipitation over India and then gradually became drier during the mid-Holocene using exclusively a proxy-based reconstruction of the trop- relative to today (Sukumar et al., 1993). Hence, accounting ical Pacific SSTs, assuming modern teleconnections. The for the greening of the Sahara may improve the precipitation MHPMIP experiment simulates a localized rainfall increase anomaly pattern seen during the mid-Holocene over India; in the region of the Thar Desert above 40 %–50 %, whereas however, a systematic model validation is not currently pos- the MHGS+RD suggests a more intense and widespread in- Clim. Past, 17, 1243–1271, 2021 https://doi.org/10.5194/cp-17-1243-2021
F. S. R. Pausata et al.: SAM remote response to Sahara greening                                                                    1255

Figure 9. Changes in summer (JJAS) vertical pressure velocity at 500 hPa (ω500; Pa/s) for the (a) mid-Holocene-only orbital forc-
ing (MHPMIP ); (b) the Sahara greening (MHGS ); (c) the dust-only reduction (MHRD ); and (d) the Sahara greening and dust reduction
(MHGS+RD ) experiments relative to the PI reference simulation. The contour lines follow the color-bar scale (the 0 lines are omitted for
clarity). Only differences significant at the 95 % confidence level using the Student t test are shaded.

sible due to the paucity of available paleoclimate archives            al., 2008). Alkenones document 0 to 1 ◦ C cooling in the
and their large uncertainties.                                         northern Arabian Sea during this time period (Böll et al.,
   With respect to changes in SSTs, the MHGS+RD exper-                 2015; Schulte and Müller, 2001), with negligible change off
iment simulates a warming of the Arabian Sea and Bay                   the Arabian Peninsula (Huguet et al., 2006; Rostek et al.,
of Bengal summer SSTs relative to PI, while little change              1997) and southwest India (Sonzogni et al., 1998). Regional
or a slight cooling is simulated in the MHPMIP experi-                 Mg/Ca and alkenone compilations by Gaye et al. (2018)
ment (Fig. 4). In the Arabian Sea, proxy evidence for                  suggest that no sector of the Arabian Sea was warmer at
widespread mid-Holocene SST warming is lacking. Dahl                   6000 BP, with the possible exception of south of India, which
and Oppo (2006) showed that the early Holocene (at around              also warms slightly in all four simulations. Alkenones from
8000 BP) was 1.4 ± 1.3 ◦ C cooler than the late Holocene,              the northern Bay of Bengal (Lauterbach et al., 2020) and
on the basis of Mg/Ca in the planktic foraminifer Glo-                 G. ruber Mg/Ca from the southern Bay of Bengal (Raza et
bigerinoides ruber from 12 cores spanning much of the                  al., 2017) indicate
1256                                                            F. S. R. Pausata et al.: SAM remote response to Sahara greening

Figure 10. Changes in summer (JJAS) velocity potential (VelPot – shadings; m2 /s) and divergence wind (DIV – arrows; m/s) at 200 hPa for
the (a) mid-Holocene-only orbital forcing (MHPMIP ); (b) the Sahara greening (MHGS ); (c) the dust-only reduction (MHRD ); and (d) the Sa-
hara greening and dust reduction (MHGS+RD ) experiments relative to the PI reference simulation. The contour lines show the climatological
summer velocity potential of the PI experiment. Only differences significant at the 95 % confidence level using the Student t test are shaded.

Figure 11. Scatter plot of summer (JJAS) changes between (a) latent heat flux over the Bay of Bengal (BoB, 10–20◦ N, 85–95◦ E; W/m2 )
and precipitation over the western equatorial Indian Ocean (WEIO, 5◦ S to 5◦ N, 50–65◦ E; mm/d), and northeastern Africa (NEA, 10–20◦ N,
30–45◦ E), between (b) precipitation and latent heat flux over the BoB, and between (c) precipitation over the BoB and over WEIO + NEA.
Changes are shown for the mid-Holocene-only orbital forcing (MHPMIP ) in red, the Sahara greening (MHGS ) in green, dust-only reduction
(MHRD ) in yellow, and the Sahara greening with dust reduction (MHGS+RD ) in blue with respect to the PI reference simulation.

   South of the Equator, west of Sumatra, the MHPMIP sim-                dian basin off the coast of Tanzania, Mg/Ca reconstruction
ulation produces a stronger cooling (>1 ◦ C) that disappears             suggests that SSTs were about 1 to 1.5 ◦ C warmer during
in the MHGS+RD experiment (Fig. 4). Here, alkenones are                  the mid-Holocene compared to late Holocene (Kuhnert et al.,
more consistent with MHPMIP , albeit with a more modest                  2014), which is more consistent with the MHGS+RD experi-
cooling of 0.5 to 1 ◦ C (Li et al., 2016; Lückge et al., 2009).          ment (Fig. 4d). This record also shows a rapid SST cooling
However, G. ruber Mg/Ca indicates negligible change, more                concomitant with an abrupt retreat of the SAM as suggested
consistent with MHGS+RD (Mohtadi et al., 2010). Seasonal                 by a recently published paleoclimate archives from western
differences in proxy carrier production may explain such dif-            Yunnan Plateau in southwestern China (Wang et al., 2020)
ferences, with Mg/Ca perhaps being more appropriate for                  and northern Laos (Griffiths et al., 2020). Such changes are
comparison to JJAS simulations, as suggested for the equa-               also synchronous with the end of the African Humid Period
torial Pacific (Gill et al., 2016; Timmermann et al., 2014).             (e.g., deMenocal et al., 2000); hence, our simulations sug-
Finally, south of the Equator, on the western side of the In-            gest that the changes in vegetation over the Sahara and in air-

Clim. Past, 17, 1243–1271, 2021                                                               https://doi.org/10.5194/cp-17-1243-2021
F. S. R. Pausata et al.: SAM remote response to Sahara greening                                                                      1257

Figure 12. Changes in summer (JJAS) zonal wind at 200 hPa (U200; m/s) for the (a) mid-Holocene-only orbital forcing (MHPMIP ); (b) the
Sahara greening (MHGS ); (c) the dust-only reduction (MHRD ); and (d) the Sahara greening and dust reduction (MHGS+RD ) experiments
relative to the PI reference simulation. The contour lines show the climatological summer zonal wind at 200 hPa for the PI experiment. Only
differences significant at the 95 % confidence level using the Student t test are shaded.

borne dust emissions may have played a key role in shaping              2017a, b; Piao et al., 2020; Sun et al., 2019; Thompson et
the evolution of the SAM.                                               al., 2019), and it has been shown that airborne dust may
                                                                        play an important role in modulating the intensity and ge-
                                                                        ographical extent of the West African Monsoon (Pausata et
4   Discussion and conclusions
                                                                        al., 2016; Thompson et al., 2019) as well as impacting cli-
                                                                        mate far afield. However, the role of Saharan dust changes in
The mid-Holocene was characterized by a strengthening of
                                                                        affecting the SAM system has not hitherto been investigated.
the Northern Hemisphere monsoon system (e.g., Sun et al.,
                                                                        The key goal of the present study is to fill this knowledge gap
2019) due to increased boreal summer insolation. The con-
                                                                        by outlining the remote response of the mid-Holocene SAM
sequent increase in rainfall led to a greening of several
                                                                        system to the Sahara greening and associated reduction in
semi-arid and arid regions in northern Africa and Asia (e.g.,
                                                                        airborne dust concentrations.
Campo et al., 1982; Dallmeyer et al., 2013; Fleitmann et
                                                                           We analyze a set of simulations where the land cover is
al., 2003; Lézine et al., 2011; Tierney et al., 2017) and to
                                                                        changed from desert to shrubland over a large part of north-
a marked reduction in airborne dust emissions (deMenocal
                                                                        ern Africa and dust concentration over the region is reduced
et al., 2000; McGee et al., 2013). The largest dust emission
                                                                        by up to 80 % compared to the pre-industrial period (Gae-
decreases are thought to have occurred in northern Africa,
                                                                        tani et al., 2017; Pausata et al., 2016). We find that a vege-
where large tracts of what is today the Sahara were vege-
                                                                        tated Sahara – albeit weakening the low-level southwesterly
tated. Understanding this complex set of interrelated changes
                                                                        winds – enhances the moisture flux from the Arabian Sea to
can provide insights into the mechanisms of monsoonal vari-
                                                                        the northern Indian subcontinent and increases the precipita-
ability and contribute to strengthening our physical under-
                                                                        tion in this region compared to a simulation in which only
standing of monsoonal changes in climate projections. How-
                                                                        the orbital forcing is considered (Figs. 2, A9, and A11). Re-
ever, many modeling efforts for the mid-Holocene have fo-
                                                                        duced dust emissions from the Sahara partially counter the
cused only on the impact of solar insolation changes, as this
                                                                        vegetation effect by weakening the thermal low over the Ara-
has been the common protocol for climate simulations of this
                                                                        bian Peninsula and the climatological southwesterlies and
period (Otto-Bliesner et al., 2017; Taylor et al., 2009, 2012),
                                                                        subsidence (Figs. 7, 9, A9, A11, and A12). This results in
neglecting the feedbacks induced by the altered vegetation,
                                                                        decreased precipitation over India in the mid-Holocene ex-
soil properties, and associated dust emissions.
                                                                        periment with both changes in vegetation and dust concen-
   Indeed, the role of reduced dust emissions during the mid-
                                                                        tration (MHGS+RD ) compared to the vegetated-Sahara-only
Holocene on local and global climate has only recently been
                                                                        case (MHGS ), especially in the central-southern and western
addressed (Hopcroft and Valdes, 2019; Pausata et al., 2016,

https://doi.org/10.5194/cp-17-1243-2021                                                             Clim. Past, 17, 1243–1271, 2021
1258 F. S. R. Pausata et al.: SAM remote response to Sahara greening seaboard regions (Figs. 2 and A3). Overall, the SAM rainfall fall over India when including the greening of the Sahara and in the MHGS+RD is significantly increased compared to the dust reduction relative to the orbital-forcing-only simulation. PI climate as well as to the orbital-forcing-only simulation In particular, our simulations suggest that the vegetation and (MHPMIP ). The monsoon season is also extended by several dust emission changes may have played an important role in months, particularly in the withdrawal phase (Fig. 3). affecting the Indian Ocean temperature and shaping the evo- Sun et al. (2019) showed that the greening of the Sahara lution of the SAM during the termination of the African Hu- and a reduction in dust emissions significantly influence the mid Period. However, no robust conclusions can be drawn in Northern Hemisphere land monsoon precipitation, but the this respect due to the relative paucity of geographically and largest impact is on the WAM. Here, we show that the SAM temporally referenced, quantitative paleo-precipitation data is significantly affected by both vegetation changes in north- in the region. A similar difficulty is encountered in evaluating ern Africa and dust reduction, and the remote response is the modeled SST changes. Only some paleo-archives point to about half of the rainfall change simulated locally over north- closer agreement with the MHGS+RD simulation; however, in ern Africa (cf. Fig. 2 here with Fig. 2 in Pausata et al., 2016). general, the amplitudes of SST changes are small relative to However, the simulated impact of dust changes needs fur- proxy uncertainties, making it difficult to provide a system- ther investigation, as rainfall in tropical regions is strongly af- atic model validation. fected by the specific prescription of dust optical properties. Finally, in our experiments, we only consider changes in In particular, the choice of the single scattering albedo ω0 vegetation over northern Africa and its remote impact on can significantly alter the effect of dust on precipitation via SAM. However, proxy archives from the mid-Holocene point the so-called “heat pump” effect (Lau et al., 2009). The atmo- to widespread vegetation changes across the globe, with ex- spheric dust layer in which the dust particles are moderate-to- panded forest cover in Eurasia (Prentice et al., 1998; Tarasov highly absorbing (single scattering albedo ω0
F. S. R. Pausata et al.: SAM remote response to Sahara greening                                                                   1259

Appendix A: Model validation

In order to evaluate the performance of the EC-Earth model
used here in reproducing the SAM dynamics, we com-
pare our PI simulation to surface temperature and pre-
cipitation data from ECMWF’s ERA5 reanalysis product
(Hersbach et al., 2020) and gridded observational products.
Long-term precipitation rates from ERA5 compare favorably
with NASA’s Tropical Rainfall Measuring Mission (TRMM)
multi-satellite precipitation analysis (Hersbach et al., 2020;
Huffman et al., 2010), and over the Indian subcontinent dif-
ferences between ERA5 and the Global Precipitation Clima-
tology Project (GPCP) gridded observational dataset (Adler
et al., 2018) are mostly below 0.5 mm/d (Figs. A1 and A2).
Good agreement is also found between ERA5 temperatures
and the Climatic Research Unit (CRU) dataset (Harris et
al., 2020) and ERA5 improves in this respect over previous
datasets (Hersbach et al., 2020).
   EC-Earth’s PI simulation in general underestimates rain-
fall over the northeastern Indian subcontinent and overesti-
mates it over the western side. The model further presents a
large cold bias (Fig. A1).

Table A1. Aerosol optical depth, single scattering albedo, and composition of the mineral dust for a relative humidity of 50 %.

                         Type                  RH     AOD at      SSA     Component            Number        Mass
                                               (%)    550 nm      (ω0 )                        (cm−3 )    (µg/m3 )
                         “Desert” dust-like     50      0.037    0.888    Total                  2300        225.8
                                                                          Water soluble           2000         4.0
                                                                          Mineral (nuclei)       269.5         7.5
                                                                          Mineral (accum.)         30.5      168.7
                                                                          Mineral (coarse)       0.142        45.6

https://doi.org/10.5194/cp-17-1243-2021                                                              Clim. Past, 17, 1243–1271, 2021
You can also read