Energy Storage Grand Challenge: Energy Storage Market Report - U.S. Department of Energy
←
→
Page content transcription
If your browser does not render page correctly, please read the page content below
Energy Storage Grand
Challenge: Energy Storage
Market Report
U.S. Department of Energy

Technical Report
NREL/TP-5400-78461
DOE/GO-102020-5497
December 2020
Energy Storage Grand Challenge Energy Storage Market Report 2020                          December 2020

Disclaimer
This report was prepared as an account of work sponsored by an agency of the United States
Government. Neither the United States Government nor any agency thereof, nor any of its employees,
makes any warranty, express or implied, or assumes any legal liability or responsibility for the accuracy,
completeness, or usefulness of any information, apparatus, product, or process disclosed, or represents
that its use would not infringe privately owned rights. Reference herein to any specific commercial
product, process, or service by trade name, trademark, manufacturer, or otherwise does not necessarily
constitute or imply its endorsement, recommendation, or favoring by the United States Government or
any agency thereof. The views and opinions of authors expressed herein do not necessarily state or
reflect those of the United States Government or any agency thereof.

                                                     i
Energy Storage Grand Challenge Energy Storage Market Report 2020                          December 2020

Foreword
As part of the U.S. Department of Energy’s (DOE’s) Energy Storage Grand Challenge (ESGC), DOE intends
to synthesize and disseminate best-available energy storage data, information, and analysis to inform
decision-making and accelerate technology adoption. The ESGC Roadmap provides options for
addressing technology development, commercialization, manufacturing, valuation, and workforce
challenges to position the United States for global leadership in the energy storage technologies of the
future. 1 This report provides a baseline understanding of the numerous dynamic energy storage markets
that fall within the scope of the ESGC via an integrated presentation of deployment, investment, and
manufacturing data from the best publicly available sources.

This report covers the following energy storage technologies: lithium-ion batteries, lead–acid batteries,
pumped-storage hydropower, compressed-air energy storage, redox flow batteries, hydrogen, building
thermal energy storage, and select long-duration energy storage technologies. The user-centric use
cases laid out in the ESGC Roadmap inform the identification of markets included in this report. In turn,
this market analysis provides an independent view of the markets where those use cases play out.
Future versions of this report could continue to develop this alignment of the market data and
characterization with the use case framework.

Not all energy storage technologies and markets could be addressed in this report. Due to the wide
array of energy technologies, market niches, and data availability issues, this market report only includes
a select group of technologies. For example, thermal energy storage technologies are very broadly
defined and cover a wide range of potential markets, technology readiness levels, and primary energy
sources. In other areas, data scarcity necessitates a greater understanding of future applications and
emerging science. Future efforts will update data presented in this report and be expanded to include
other energy storage technologies.

This data-driven assessment of the current status of energy storage markets is essential to track
progress toward the goals described in the Energy Storage Grand Challenge and inform the decision-
making of a broad range of stakeholders. At the same time, gaps identified through the development of
this report can point to areas where further data collection and analysis could provide an even greater
level of understanding of the full range of markets and technologies.

Finally, numerous complementary analyses are planned, underway, or completed that will provide a
deeper understanding of the specific technologies and markets covered at a high level in this report.

1
 View the ESGC roadmap at https://energy.gov/energy-storage-grand-challenge/downloads/energy-storage-
grand-challenge-roadmap.

                                                    ii
Energy Storage Grand Challenge Energy Storage Market Report 2020                            December 2020

Acknowledgments
The Energy Storage Grand Challenge (ESGC) is a crosscutting effort managed by the U.S. Department of
Energy’s Research Technology Investment Committee. The Energy Storage Market Report was
developed by the Office of Technology Transfer (OTT) under the direction of Conner Prochaska and
Marcos Gonzales Harsha, with guidance and support from the Energy Storage Subcommittee of the
Research Technology Investment Committee, co-chaired by Alex Fitzsimmons, Deputy Assistant
Secretary in the Office of Energy Efficiency and Renewable Energy (EERE), and Michael Pesin, Deputy
Assistant Secretary in the Office of Electricity Delivery and Energy Reliability (OE).

Development of the Energy Storage Market Report was led by Margaret Mann (National Renewable
Energy Laboratory [NREL]), Susan Babinec (Argonne National Laboratory), and Vicky Putsche (NREL),
with guidance and direction from Stephen Hendrickson (OTT), Hugh Ho (EERE), and Paul Spitsen (EERE).
Data gathering was supported by the following NREL staff: David Feldman, Spencer Gilleon Madeline
Gilleran, Chad Hunter, Michael Penev, Genevieve Saur, and Dustin Weigl.

The report would not have been possible without the input and guidance of the Market Report Steering
Committee, whose members include: Craig Anderson (Science), Briggs White (National Energy
Technology Laboratory), Peter Faguy (EERE), Joe Cresko (EERE), Andrew Dawson (EERE), Vinod Siberry
(OE), Karma Sawyer (EERE), and Eric Miller (EERE).

Additional contributions to the report were made by Diana Bauer, Steven Boyd, Joe Cresko, Sarah
Garman, Alejandro Moreno, David Peterson, Rob Sandoli, Avi Shultz, Timothy Silverman, Changwon Suh,
and Paul Syers of EERE; Katherine Harsanyi and Rima Oueid of OTT; John Vetrano of the Office of
Science; Eric Hsieh of OE; Bhima Sastri of the Office of Fossil Energy; Kelly Lefler of the Office of Nuclear
Energy; Vikram Linga and Chris Namovicz of the Energy Information Administration; Monique Fridell of
the Loan Programs Office; Scott Litzelman of the Advanced Research Projects Agency – Energy; Kendall
Mongird and Vince Sprenkle of Pacific Northwest National Laboratory; and David Feldman, Chad
Augustine, and Nate Blair of NREL.

                                                     iii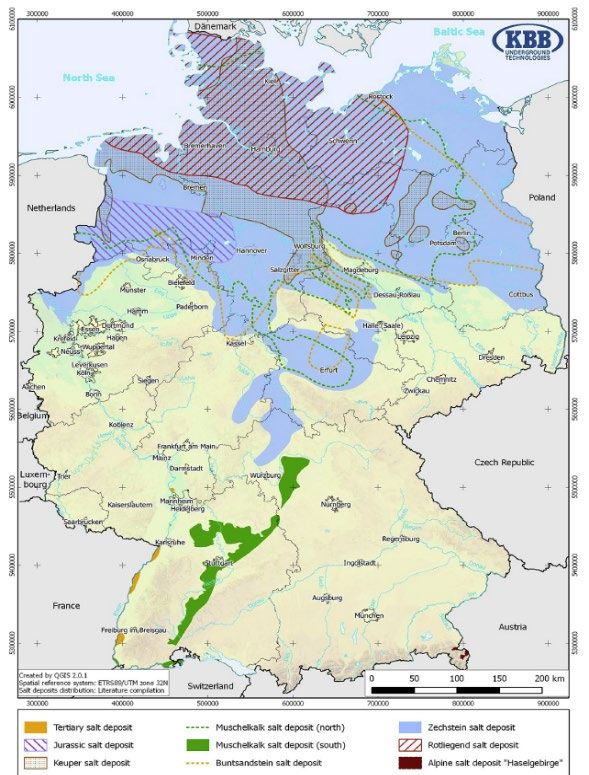
Energy Storage Grand Challenge Energy Storage Market Report 2020            December 2020

Acronyms
ARPA-E         Advanced Research Projects Agency – Energy
BNEF           Bloomberg New Energy Finance
CAES           compressed-air energy storage
CAGR           compound annual growth rate
C&I            commercial and industrial
DOE            U.S. Department of Energy
EERE           Office of Energy Efficiency and Renewable Energy
ESGC           Energy Storage Grand Challenge
EV             electric vehicle
FCEV           fuel cell electric vehicle
FERC           Federal Energy Regulatory Commission
IEA            International Energy Agency
IHA            International Hydropower Association
LDES           long-duration energy storage
LHV            lower heating value
Li-ion         lithium-ion
NREL           National Renewable Energy Laboratory
OE             Office of Electricity Delivery and Energy Reliability
OTT            Office of Technology Transfer
PSH            pumped-storage hydropower
PV             photovoltaics
ReEDS          Regional Energy Deployment System
RFB            redox flow battery
ROA            rest of Asia
ROW            rest of the world
SLI            starting, lighting, and ignition
STEPS          Stated Policies (IEA)
TES            thermal energy storage
UPS            uninterruptible power source
xEV            electric vehicle (light-, medium-, and heavy-duty classes)

                                                   iv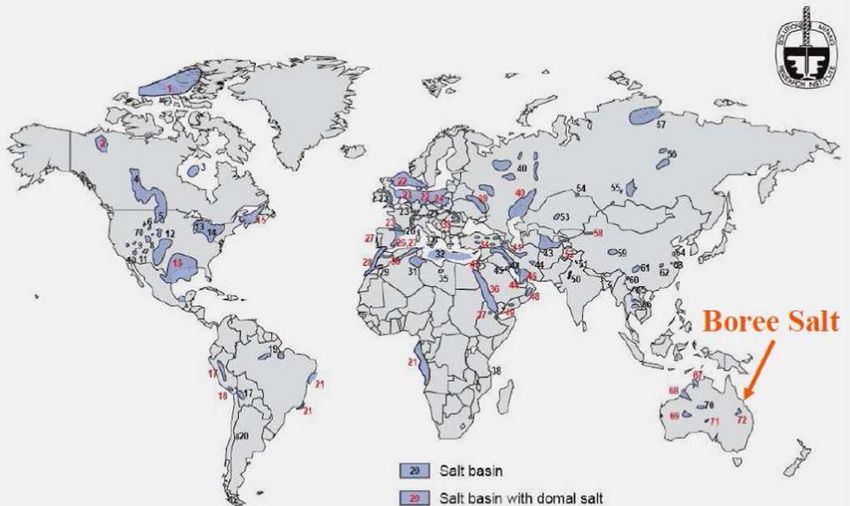
Energy Storage Grand Challenge Energy Storage Market Report 2020                                                                         December 2020

Table of Contents
Executive Summary....................................................................................................................................... 1
   Report Methodology and Scope ............................................................................................................... 2
High-Level Energy Storage Market Summary ............................................................................................... 6
   Transportation Sector ............................................................................................................................... 7
   Stationary Market ..................................................................................................................................... 7
       Grid-Related.......................................................................................................................................... 8
       Industrial ............................................................................................................................................. 11
Lithium-Ion Batteries .................................................................................................................................. 12
   Li-Ion Market........................................................................................................................................... 12
   Li-Ion Manufacturing............................................................................................................................... 16
   Li-Ion Research and Development.......................................................................................................... 18
Lead–Acid Batteries .................................................................................................................................... 20
   Lead–Acid Market ................................................................................................................................... 20
   Lead–Acid Manufacturing....................................................................................................................... 24
Pumped Storage Hydropower (PSH)........................................................................................................... 25
   PSH Market ............................................................................................................................................. 25
Compressed Air Energy Storage (CAES) ...................................................................................................... 30
   CAES Market ........................................................................................................................................... 30
Redox Flow Batteries (RFBs) ....................................................................................................................... 33
   RFB Market.............................................................................................................................................. 33
Hydrogen..................................................................................................................................................... 37
   Market – Hydrogen ................................................................................................................................. 37
Building Thermal Energy Storage (TES) – Ice .............................................................................................. 46
   TES Ice Market ........................................................................................................................................ 47
Nascent Application – Long-Duration Energy Storage (LDES) .................................................................... 50

                                                                               v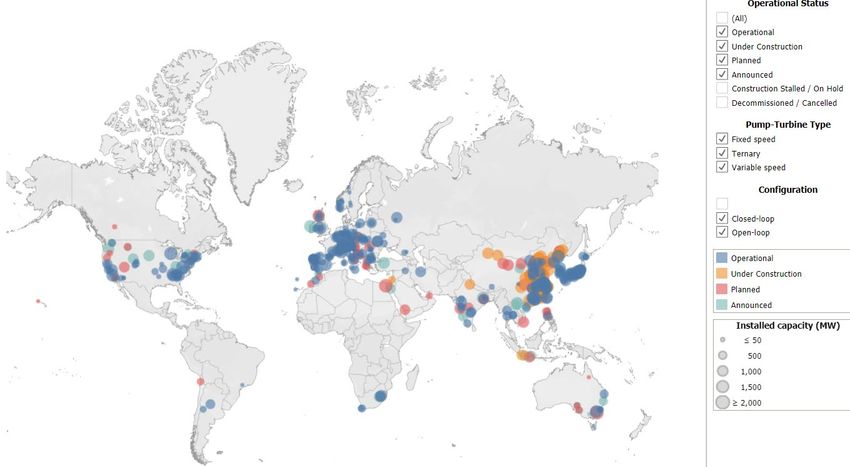
Energy Storage Grand Challenge Energy Storage Market Report 2020 December 2020
List of Figures
Figure 1. Global energy storage market ....................................................................................................... 6
Figure 2. Projected global annual transportation energy storage deployments.......................................... 7
Figure 3. Global annual stationary-source projections by sector ................................................................. 8
Figure 4. Global projected grid-related annual deployments by region (2015–2030) ................................. 9
Figure 5. Global projected grid-related annual deployments by application (2015–2030) ......................... 9
Figure 6. Projected cumulative U.S. grid-related deployment by electric power region (2015–2022)...... 10
Figure 7. Projected cumulative U.S. grid-related deployment by application (2015–2022) ...................... 10
Figure 8. Projected global industrial energy storage deployments by application .................................... 11
Figure 9. Historical annual global Li-ion deployment – all markets............................................................ 12
Figure 10. BNEF projected global Li-ion deployment – all markets............................................................ 13
Figure 11. Avicenne global Li-ion projections – all markets ....................................................................... 13
Figure 12. Projected global Li-ion deployment in xEVs by vehicle class for IEA STEPS scenario (Ebus:
electric bus; LDVs: light-duty vehicles; MD/HDVs: medium- and heavy-duty vehicles)............................. 14
Figure 13. Projected Global Li-ion Deployment in xEVs by Region for IEA STEPS Scenario........................ 15
Figure 14. Projected Global Annual Li-ion Deployments in xEVs for IEA Scenarios.................................... 15
Figure 15. Global Li-ion battery cell manufacturing ................................................................................... 17
Figure 16. Li-ion battery manufacturing planned (blue) or under construction (red) ............................... 17
Figure 17. Global Li-ion component manufacturing................................................................................... 18
Figure 18. Cost and technology trends for lithium-based EV batteries...................................................... 19
Figure 19. Potential for future battery technology cost reductions........................................................... 19
Figure 20. 2018 global lead–acid battery deployment by application (% GWh) ........................................ 20
Figure 21. 2018 lead–acid battery sales by company................................................................................. 21
Figure 22. Projected global lead–acid battery demand – all markets ........................................................ 21
Figure 23. Projected lead–acid capacity increase from vehicle sales by region based on BNEF................ 22
Figure 24. Projected lead–acid capacity increase from vehicle sales by class............................................ 22
Figure 25. Global cumulative lead–acid stationary storage by region ....................................................... 23
Figure 26. Global cumulative lead–acid stationary storage by application................................................ 24
Figure 27. Domestic lead–acid industry and related industries ................................................................. 24
Figure 28. States with direct jobs from lead battery industry .................................................................... 25
Figure 29. Global cumulative PSH deployment (GW) ................................................................................. 26
Figure 30. Global PSH installations ............................................................................................................. 27
Figure 31. Projected annual global PSH installations.................................................................................. 28
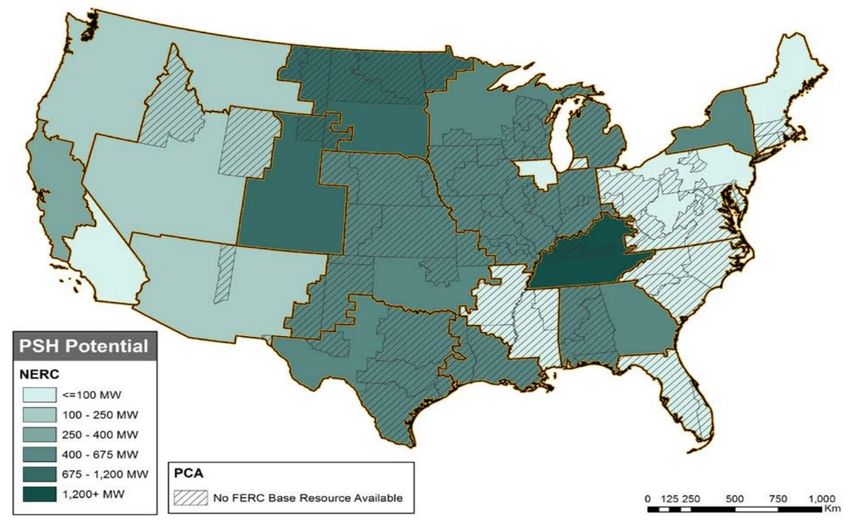
Figure 32. Lower-bound domestic PSH potential based on ReEDS modeling ............................................ 29
Figure 33. U.S. PSH deployments model ReEDS: tech improvement and financing increase .................... 30
Figure 34. Cumulative (2011–2019) global CAES energy storage deployment .......................................... 31
Figure 35. Cumulative (2011–2019) global CAES power deployment ........................................................ 31
Figure 36. U.S. CAES resource estimate...................................................................................................... 32
Figure 37. Projected Addressable Market for CAES Technology ................................................................ 33
Figure 38. Global annual deployment of RFBs by region............................................................................ 34
Figure 39. Global cumulative deployment of RFBs by region..................................................................... 34
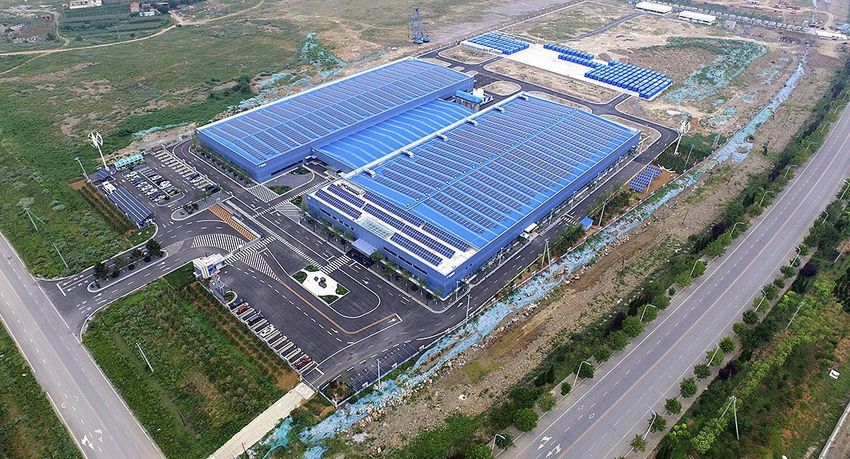
Figure 40. Largest vanadium redox flow battery facility (under construction) .......................................... 35
Figure 41. Potential redox flow battery market by application.................................................................. 36
Figure 42. International installations of RFBs ............................................................................................. 36
vi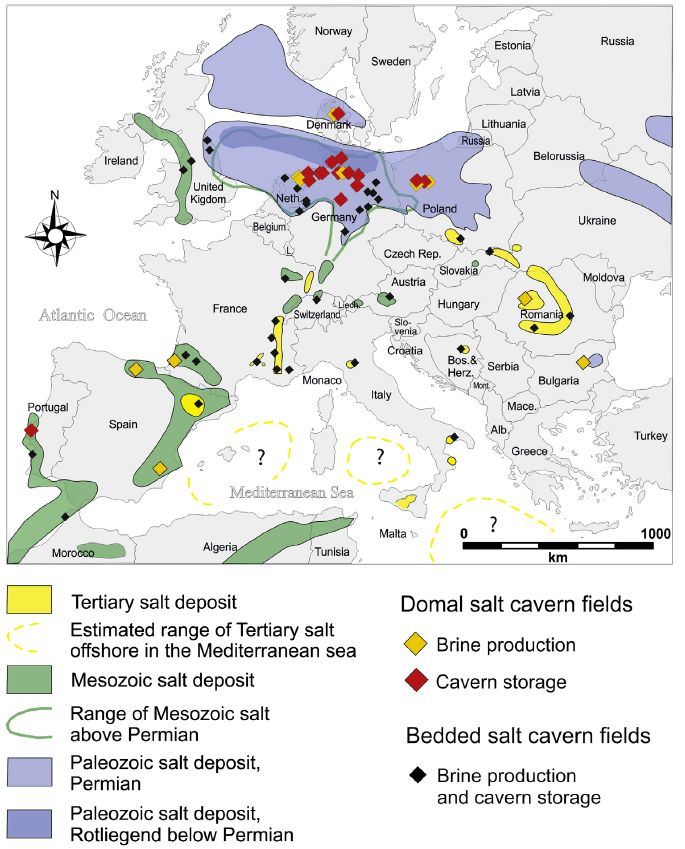
Energy Storage Grand Challenge Energy Storage Market Report 2020                                                                  December 2020

Figure 43. Hydrogen energy economy........................................................................................................ 37
Figure 44. Global hydrogen consumption – all sources.............................................................................. 38
Figure 45. Hydrogen consumption by region ............................................................................................. 39
Figure 46. H2 gas storage ............................................................................................................................ 40
Figure 47. Major salt deposits..................................................................................................................... 41
Figure 48. Salt deposits and caverns in Germany ....................................................................................... 41
Figure 49. European salt domes and caverns ............................................................................................. 42
Figure 50. Estimated global cumulative hydrogen storage deployment by vehicle type........................... 43
Figure 51. Estimated global cumulative onboard hydrogen storage by region.......................................... 43
Figure 52. Projected onboard hydrogen storage by region........................................................................ 44
Figure 53. Projected onboard hydrogen storage by vehicle type............................................................... 44
Figure 54. Active and planned hydrogen refueling stations by region....................................................... 45
Figure 55. Active public and private hydrogen refueling stations by region .............................................. 46
Figure 56. Typical thermal energy storage cycle ........................................................................................ 46
Figure 57. Thermal energy storage installation .......................................................................................... 47
Figure 58. Domestic cumulative TES (ice) deployment .............................................................................. 47
Figure 59. TES vendor revenue by region – market study 1 ....................................................................... 48
Figure 60. TES vendor revenue by region – market study 2 ....................................................................... 48
Figure 61. TES energy capacity deployments by region ............................................................................. 49
Figure 62. LDES targets ............................................................................................................................... 50

List of Tables
Table 1. Transportation Application Descriptions ........................................................................................ 3
Table 2. Stationary Application Descriptions................................................................................................ 3

                                                                           vii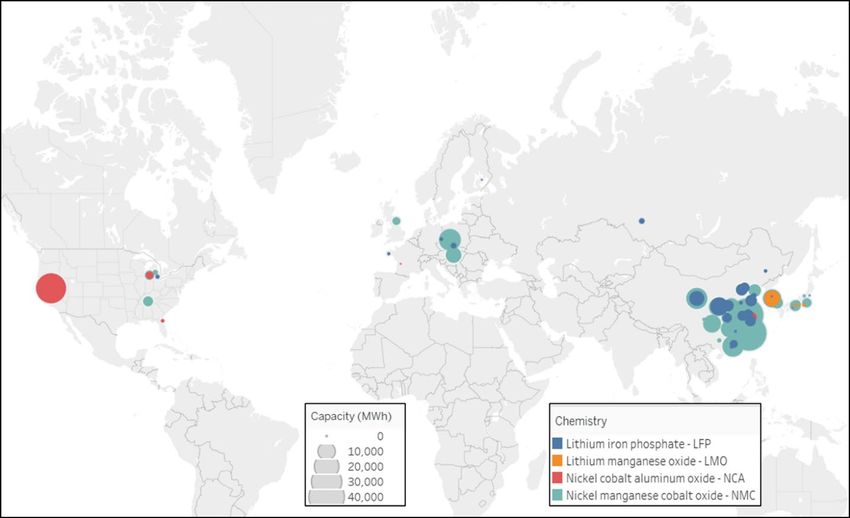
Energy Storage Grand Challenge Market Report 2020                                           December 2020

Executive Summary
As part of the U.S. Department of Energy’s (DOE’s) Energy Storage Grand Challenge (ESGC), this report
summarizes published literature on the current and projected markets for the global deployment of
seven energy storage technologies in the transportation and stationary markets through 2030. This work
focuses on collecting the best-available estimates of how energy storage is projected to grow, both in
the United States and internationally. Thus, the purpose of this report is to summarize available data
rather than to provide new analyses of the current and future markets for energy storage.

By 2030, stationary and transportation energy storage combined markets are estimated to grow 2.5–4
terawatt-hours (TWh) annually, approximately three to five times the current 800-gigawatt-hour (GWh)
market. Electrified powertrains (i.e., onboard energy storage) have gained greater acceptance and have
transitioned mobility to the largest single demand for energy storage, representing approximately five
to ten times greater usage by energy capacity than stationary energy storage. The convergence of
electrified transportation, a rapid decrease in battery storage costs, and increased variable renewable
generation has led to a surge in research and market deployments of energy storage across the global
electric and transportation sectors. Although once considered the missing link for high levels of grid-tied
renewable electricity, stationary energy storage is no longer seen as a barrier, but rather a real
opportunity to identify the most cost-effective technologies for increasing grid reliability, resilience, and
demand management. This report seeks to capture the latest projections for energy storage markets.

The growth seen over the last few years in electric vehicle (EV) adoption is expected to continue as
central and local government incentives for consumers remain in place in many major world markets,
and as manufacturers increase the size of manufacturing platforms. Analysts project mobility storage
demands in 2030 of 0.8 to 3.0 TWh, with the demand for light-duty EVs dominating near-term markets.
China is expected to be the largest medium-term mobility storage market; however, quite unexpectedly,
in July 2020, the European xEV market (with “x” representing electric vehicles across light-duty,
medium-duty, and heavy-duty classes) exceeded China’s, and is expected to exceed 1 million xEVs this
year.

The existing capacity in stationary energy storage is dominated by pumped-storage hydropower (PSH),
but because of decreasing prices, new projects are generally lithium-ion (Li-ion) batteries. By 2030,
annual global deployments of stationary storage (excluding PSH) is projected to exceed 300 GWh,
representing a 27% compound annual growth rate (CAGR) for grid-related storage and an 8% CAGR for
use in industrial applications such as warehouse logistics and data centers. China has announced the
development of greater than 35-GW PSH from 2020–2026 through development of several multi-
gigawatt projects, and although not currently in the development phase, the United States is exploring
avenues for PSH growth as well. The largest markets for stationary energy storage in 2030 are projected
to be in North America (41.1 GWh), China (32.6 GWh), and Europe (31.2 GWh). Excluding China, Japan
(2.3 GWh) and South Korea (1.2 GWh) comprise a large part of the rest of the Asian market. Much of the
expansive growth is 4-hour-duration hybrid configurations coupled to utilities, commercial and industrial
(C&I), and residential renewables (generally photovoltaics [PV]).

                                                      1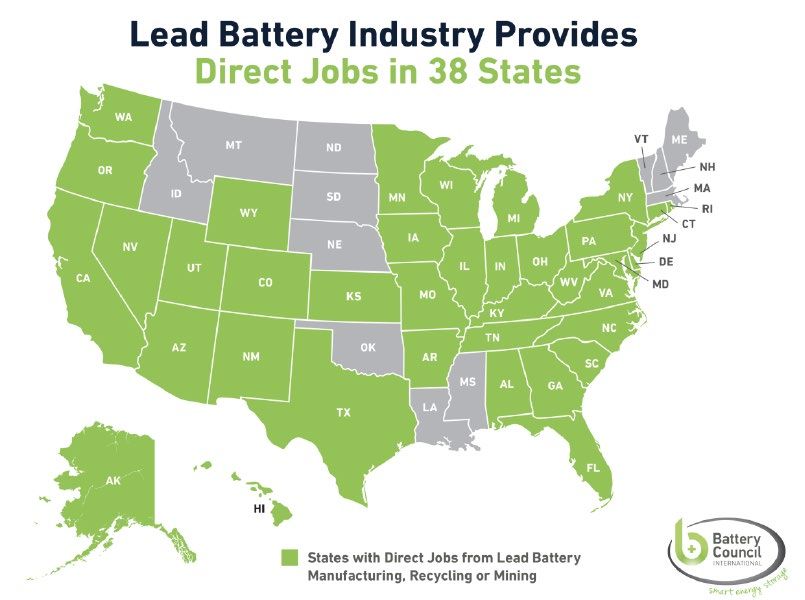
Energy Storage Grand Challenge Market Report 2020                                       December 2020

Report Methodology and Scope
This report, supported by the U.S. Department of Energy’s Energy Storage Grand Challenge, summarizes
current status and market projections for the global deployment of selected energy storage
technologies in the transportation and stationary markets. Published projections, derived with different
assumptions, are presented to provide the current outlook of how energy storage is expected to
develop through 2030. To further inform expectations, recent and current activities expected to have a
large impact are included, including research advances in nascent technologies and storage applications.
Tracking how projections evolve and how markets actually develop can help inform government and
industry research and deployment strategies.

Within this overall framework, the report begins with a summary of each market by sector and region.
Then, each technology is discussed individually and their current and expected demand in the applicable
markets are presented. Where available, global manufacturing capacities are presented to characterize
the current size of the market and dominant locations.

Technologies and Markets
Seven energy storage technologies were selected for inclusion in this first report:

    •   Lithium-ion batteries
    •   Lead–acid batteries
    •   Pumped storage hydropower
    •   Compressed-air energy storage (CAES)
    •   Redox flow batteries (RFBs)
    •   Hydrogen (H2)
    •   Building thermal energy storage (TES) – Ice.

The technologies covered in this report are addressed in both the stationary and transportation
markets. Although some technologies (primarily Li-ion) are also used in the consumer electronics
market, this market is not covered in depth. The report looks both at the historical deployments and
projected demands of these technologies over the 2015–2030 time period. In some cases, important
information was available prior to 2015 and is included for context. On the other hand, in some cases,
information was not available to project the deployment of certain energy storage technologies through
2030. Where available, projections based on differing assumptions are offered for comparison, such as
with the total energy storage global market.

The report looks at global deployment of all the technologies. Whenever possible, the information is
disaggregated into the following regions:

    •   China
    •   United States
    •   Europe
    •   Rest of Asia (ROA)
    •   Rest of the world (ROW).

                                                       2
Energy Storage Grand Challenge Market Report 2020 December 2020
Deeper dives into the domestic market for several technologies (CAES, PSH, lead–acid) are also
presented.
The two primary markets covered in this report are stationary and transportation, and each is further
broken down into its sectors. Transportation has two major sectors: (1) mobility as either electric
vehicles (xEVs) or fuel cell electric vehicles (FCEVs) and (2) starting, lighting, and ignition (SLI). The
applications associated with each sector are further described in Table 1. The stationary storage market,
much of which is related to grid and commercial resilience, is described in Table 2.
Table 1. Transportation Application Descriptions
Application Sector Application Description
Electric vehicles (light-duty, medium-duty, and
heavy-duty)
Mobility – battery storage Battery electric vehicle
Plug-in hybrid electric vehicle
Hybrid electric vehicle
Hydrogen storage on FCEVs (light-duty, medium-
Mobility – hydrogen storage
duty, and heavy-duty)
Batteries in cars, trucks, boats, and other internal
SLI – starting, lighting, and ignition
combustion motorized vehicles
Table 2. Stationary Application Descriptions
Sector Category Application Application Description
Provision or absorption of short bursts of power to
Ancillary services maintain supply and demand and thus the frequency of
the grid; frequency regulation and reserves
Peaking capacity Provision of capacity to meet system maximum demand
Uptake is driven by increasing system flexibility needs.
Energy storage is charged during low prices and surplus
Energy shifting supply and discharged to meet demand. Batteries can
be charged from surplus renewable energy or from
Grid-related – assets that, along with battery, become dispatchable
utility Use of an energy storage system as an alternative to
traditional network reinforcement, such as to meet an
Transmission-level incremental increase in transmission capacity instead of
an expensive transmission line upgrade
Use of an energy storage system as an alternative to
traditional network reinforcement such as to meet an
Distribution-level incremental increase in distribution capacity instead of
an expensive distribution line upgrade
3Energy Storage Grand Challenge Market Report 2020 December 2020
Sector Category Application Application Description
Aggregation of energy storage that is integrated with
Grid-related – Residential PV +
rooftop PV at the household level; residential PV that is
residential storage
not integrated with the grid is not included
Energy storage that is used to increase the rate of self-
Grid-related – consumption of a PV system from a commercial or
C&I energy storage
C&I industrial customer
Commercial and private EV charging stations (not
Grid-related –
EV charging residential); Use of battery storage to at EV charging
utility/residential
infrastructure stations to mitigate demand charges and time-of-use
and C&I
rates.
Energy storage that is stored for ≥10 hours at their rated
Long-duration energy
LDES capacity, per the Advanced Research Projects Agency –
storage
Energy (ARPA-E) [1]
Uninterruptible power Use of batteries for uninterruptible power and data
source (UPS) + data centers
centers
Telecommunications towers require UPS and backup
Telecom backup
power and are a significant demand in the stationary
power
sector
Industrial,
Use of building thermal energy systems based on ice to
including military Air conditioning/ provide air conditioning and/or refrigeration for
use refrigeration commercial and industrial systems
Hydrogen refueling Refueling stations for FCEVs
stations
Commercial and industrial use of battery systems on
Motive (forklifts) forklifts for motive power
Literature Sources
An extensive literature search was conducted to identify available market data for the selected
technologies. Relevant DOE sources were used to underpin the analysis and were augmented with
private and public market data sources. Although more than 50 information sources were used in the
development of this report, several sources contributed significantly:
DOE and National Labs
• U.S. Department of Energy, “DOE OE Global Energy Storage Database.” DOE.
https://www.sandia.gov/ess-ssl/global-energy-storage-database/ (Accessed July 8, 2020).
• U.S. Department of Energy Office of Energy Efficiency and Renewable Energy Water Power
Technologies Office, “Hydropower Vision: A New Chapter for America's 1st Renewable
Electricity Source,” U.S. DOE, Washington, D.C., DOE/GO-102016-4869, 2016. Available:
https://www.energy.gov/sites/prod/files/2018/02/f49/Hydropower-Vision-021518.pdf
• M. Brown et al., “Regional Energy Deployment System (ReEDS) Model Documentation: Version
2019,” National Renewable Energy Laboratory, Golden, CO, NREL/TP-6A20-74111, 2020.
Available: https://www.nrel.gov/docs/fy20osti/74111.pdf.
4Energy Storage Grand Challenge Market Report 2020 December 2020
Bloomberg New Energy Finance
• Bloomberg New Energy Finance, “Electric Vehicle Outlook 2020,” BloombergNEF, New York,
2020. Available: https://about.bnef.com/electric-vehicle-outlook/
• Bloomberg New Energy Finance, “2019 Long-Term Energy Storage Outlook,” BloombergNEF,
New York, 2019. Available: https://about.bnef.com/blog/energy-storage-investments-boom-
battery-costs-halve-next-decade/
International Energy Agency
• International Energy Agency, “Global EV Outlook 2020: Entering the decade of electric drive?”
IEA, Paris, June 2020. Available: https://www.iea.org/reports/global-ev-outlook-2020.
Avicenne Energy
• C. Pillot, “Lead Acid Battery Market,” Avicenne Energy, Paris, 2019, unpublished.
• C. Pillot. (May 2019). The Rechargeable Battery Market and Main Trends 2018-2030. Presented
at Advanced Automotive Battery Conference. Available: https://niobium.tech/en/pages/
gateway-pages/pdf/technical-briefings/the-rechargeable-battery-market-and-main-trends-
2018-2030.
International Hydropower Association (IHA)
• IHA, “The world's water battery: Pumped hydropower storage and the clean energy transition,”
IHA, London, December 2018. Available: https://www.hydropower.org/publications/the-world-
e2-80-99s-water-battery-pumped-hydropower-storage-and-the-clean-energy-transition
• IHA, “Pumped Storage Tracking Tool.” IHA. https://www.hydropower.org/hydropower-pumped-
storage-tool (Accessed Sep. 20, 2020).
Assumptions and Data Quality
This report is a compilation of a wide range of technologies and markets to provide a high-level snapshot
of the markets for the selected technologies. It is out of the scope of this report to determine the “best”
source or that the assumptions among reports were consistent. Rather, reputable and reliable sources
of information were compiled, including high-level summaries of the underlying assumptions, to show
the breadth of potential market outcomes.
Report Limitations
Another important component of this broad summary is to help identify those areas where information
is lacking or incomplete. Although the overall objective of this report was to report on the deployment,
future projections, and manufacturing of each technology, in many cases—especially with respect to
manufacturing—information was simply not available. In most cases, this is because some technologies
(e.g., CAES) are not based on a specialized unit such as a battery, but instead are technology systems
made up of common components (e.g., compressors). These common components can be sourced from
multiple companies and can be used in multiple applications, including non-storage applications. Thus,
tracking the manufacturing and development of these systems is difficult. Other technologies (e.g.,
RFBs) are relatively new and so manufacturing information is sparse or nonexistent.
5Energy Storage Grand Challenge Market Report 2020 December 2020
High-Level Energy Storage Market Summary
This section summarizes the current global deployment and projected demand across both markets and
by sector within each market. Due to the availability of information, the grid-related sector within
stationary storage is examined in the greatest detail, with summaries by application and global region,
including a summary of domestic regions and applications.
The global stationary and transportation combined annual energy storage market projections are
summarized in Figure 1. 2 Market is projected to increase fourfold by 2030 to more than 2,500 GWh, from
a 2018 baseline. The vast majority of this growth is due to the adoption of xEVs; in fact, aggressive
adoption (i.e., 30% of vehicle sales) of xEVs could result in up to a 4-TWh market [2]. Transportation
annual storage deployments are 2–10 times that of stationary, including PSH, depending upon the
assumptions for the transportation deployment. Lower deployments (2 times) generally assume only
current policies, whereas higher deployments (10 times) assume policies favoring mobility
electrification. These scenarios are described in more detail in the Li-ion section.
Figure 1. Global energy storage market
Sources: [3] Bloomberg New Energy Finance, “Electric Vehicle Outlook 2020,” BloombergNEF, New York, 2020. Available:
https://about.bnef.com/electric-vehicle-outlook/.
[4] C. Pillot, “Lead Acid Battery Market,” Avicenne Energy, Paris, 2019.
[5] Bloomberg New Energy Finance, “2019 Long-Term Energy Storage Outlook,” BloombergNEF, New York, 2019. Available:
https://about.bnef.com/blog/energy-storage-investments-boom-battery-costs-halve-next-decade/
[6] International Hydropower Association, “The world's water battery: Pumped hydropower storage and the clean energy
transition,” IHA, London, December 2018. Available: https://www.hydropower.org/publications/the-world-e2-80-99s-water-
battery-pumped-hydropower-storage-and-the-clean-energy-transition.
2
PSH is separated from the rest of the stationary storage as it is generally reported in gigawatts, instead of
gigawatt-hours, and its storage duration is often is not not available. For this diagram, it was estimated with a 21-h
storage duration based on a range of 18–24 h.
6Energy Storage Grand Challenge Market Report 2020 December 2020
Transportation Sector
SLI applications (included in Figure 1), exclusively lead–acid today, currently dominate the
transportation market as they are used with all types of vehicles—internal combustion engine vehicles,
xEVs, and FCEVs. They are expected to grow slowly through 2030, following global vehicle sales. Annual
mobility storage deployments, which are currently a fraction of SLI, will likely exceed SLI for the first
time in 2023, with explosive growth expected through 2030. Mobility storage includes both onboard
battery and hydrogen storage. Storage on battery electric vehicles and plug-in hybrid vehicles is
dominated by lithium-ion batteries. Hybrid electric vehicles can employ other battery chemistries such
as nickel metal hydride. Figure 2 summarizes the projected growth of the transportation sector.
Figure 2. Projected global annual transportation energy storage deployments
Sources: [2] International Energy Agency, “Global EV Outlook 2020: Entering the decade of electric drive?” IEA, Paris, June
2020. Available: https://www.iea.org/reports/global-ev-outlook-2020.
[4] C. Pillot, “Lead Acid Battery Market,” Avicenne Energy, Paris, 2019, unpublished.
Stationary Market
Figure 3 offers a more detailed breakdown of the global stationary market, showing ~150 GWh/yr in
2018 growing to 380 GWh/yr by 2030, with a peak at 535 GWh/yr in 2024 [4], [5], [6]. PSH is generally
deployed as large-sized singular projects with long lead times, and so these deployments do not follow a
smooth curve. Currently, industrial applications are significantly higher than grid-related deployments
with an 8% CAGR. Industrial motive storage (e.g., forklifts) are a large segment of this market, followed
by UPS and telecom applications. By 2030, however, grid-based applications surpass industrial
applications due to its significant growth (27% CAGR).
7Energy Storage Grand Challenge Market Report 2020 December 2020
Figure 3. Global annual stationary-source projections by sector
Sources: [4] C. Pillot, “Lead Acid Battery Market,” Avicenne Energy, Paris, 2019, unpublished.
[5] Bloomberg New Energy Finance, “Energy Storage Outlook 2019,” BloombergNEF, New York, 2019. Available:
https://about.bnef.com/
[6] International Hydropower Association, “The world's water battery: Pumped hydropower storage and the clean energy
transition,” IHA, London, December 2018. Available: https://www.hydropower.org/publications/the-world-e2-80-99s-water-
battery-pumped-hydropower-storage-and-the-clean-energy-transition.
Grid-Related
Grid-related global deployment, segmented by region, is summarized in Figure 4 [5]; it was about 10
GWh in 2019 and is projected to increase 15 times, to almost 160 GWh, in 2030. 3 All regions show
significant growth over this period, with China showing the largest increase at 8.6 times, increasing from
3.8 GWh in 2020 to 32.6 GWh in 2030. Europe, the United States, and ROA increase 5–7 times over this
same period, with the United States deploying 34.3 GWh in 2030 and Europe and ROA reaching 31.2 and
11.4 GWh, respectively. Grid-related transformations, which require energy storage, are global in scope;
this is illustrated by the fact that ROW is the region showing the greatest deployments (45 GWh) by
2030.
3
The drop in deployment in 2026 is an artifact of Bloomberg New Energy Finance’s (BNEF’s) models due to a drop
in the projections of power plant retirements. They would expect deployments to be more evenly spread out
(email from J. Frith, BNEF, to V. Putsche, National Renewable Energy Laboratory [NREL], September 25, 2020).
8Energy Storage Grand Challenge Market Report 2020 December 2020
Figure 4. Global projected grid-related annual deployments by region (2015–2030)
Source: [5] Bloomberg New Energy Finance, "2019 Long-Term Energy Storage Outlook," BloombergNEF, New York, 2019.
Available: https://about.bnef.com/blog/energy-storage-investments-boom-battery-costs-halve-next-decade/
Bloomberg New Energy Finance (BNEF) also looked at the deployment of grid-related applications in its
2019 long-term energy storage outlook [5], summarized in Figure 5. C&I PV plus storage, often known as
hybrid systems, as well as energy-shifting applications, show the most growth over the period. BNEF [5]
expects annual expenditures in this sector will increase 3.5 times, from $8.6 billion in 2020 to $30.1
billion in 2030.
Figure 5. Global projected grid-related annual deployments by application (2015–2030)
Source: [5] Bloomberg New Energy Finance, "2019 Long-Term Energy Storage Outlook," BloombergNEF, New York, 2019.
Available: https://about.bnef.com/blog/energy-storage-investments-boom-battery-costs-halve-next-decade/
BNEF [5] also looked at the projected domestic market for grid-related applications. They expect annual
U.S. stationary storage deployment to more than quadruple from 2019 to 2022 [5], as shown in Figure 6
9Energy Storage Grand Challenge Market Report 2020 December 2020
(regional) and Figure 7 (application). Much of the growth is expected as energy-shifting applications 4 in
California. Peaking capacity and residential applications will show strong growth as well.
Figure 6. Projected cumulative U.S. grid-related deployment by electric power region 5 (2015–2022)
Source: [5] Bloomberg New Energy Finance, "2019 Long-Term Energy Storage Outlook," BloombergNEF, New York, 2019. Available:
https://about.bnef.com/blog/energy-storage-investments-boom-battery-costs-halve-next-decade/
Figure 7. Projected cumulative U.S. grid-related deployment by application (2015–2022)
Source: [5] Bloomberg New Energy Finance, "2019 Long-Term Energy Storage Outlook," BloombergNEF, New York, 2019.
Available: https://about.bnef.com/blog/energy-storage-investments-boom-battery-costs-halve-next-decade/
4
Energy-shifting applications use surplus renewable energy or other assets to charge batteries and that, along with
the batteries, becomes dispatchable [5].
5
Electric power regions: California (CA), New England (CT, ME, MA, NH, RI, and VT), Midcontinent Independent
System Operator (MISO) (all or part of MT, ND, SD, MN, WI, MI, IA, IL, IN, IA, MO, AR, LA, MS, and TN), Northwest
(WA, OR, ID, WY, MT, UT, British Columbia, Alberta, and small portion of Northern CA), PJM (all or part of DE, IL, IN,
KY, MD, MI, NJ, NC, OH, PA, TN, VA, and WV), Southeast (all or part of GA, AL, MS, NC, SC, MO, and TN), Southwest
(AZ, NM, southern NV, CO, and small parts of WY, SD, and NE), Electric Reliability Council of Texas (ERCOT) (most of
TX), and Others (Southwest Power Pool [SPP] – KS, OK, and parts of MT, ND, SD, MO, AR, LA, and NM).
10Energy Storage Grand Challenge Market Report 2020 December 2020
Industrial
Global industrial energy storage segments are detailed in Figure 8 [4]. This sector includes applications
such as telecom industry backup power, UPS, data centers, FCEV refueling, and forklifts. Global
industrial energy storage is projected to grow 2.6 times, from just over 60 GWh to 167 GWh in 2030. The
majority of the growth is due to forklifts (8% CAGR). UPS and data centers show moderate growth (4%
CAGR) and telecom backup battery demand shows the lowest growth level (2% CAGR) through 2030.
Figure 8. Projected global industrial energy storage deployments by application
Source: [4] C. Pillot, "Lead Acid Battery Market," Avicenne Energy, Paris, 2019, unpublished.
Data center energy demand is important in estimating the size of the DC backup market. It is a mixed
function of true demand, including overcapacity for mission-critical needs. Data center annual energy
consumption estimates for 2020 cover a range of 200–1,000 TWh [7], [8]. Assuming that the data
centers would need to meet the average load of 600 TWh for up to 20 minutes once per day would
require 23 GWh of energy storage. Energy storage needs would increase if the time for backup or the DC
load required is higher.
DC energy storage technology is transitioning away from primarily lead–acid to alternatives that have
longer cycle and calendar life, such as Li-ion. Li-ion flammability, however, is an issue that requires some
system engineering. Another new storage chemistry that provides both high power and very long cycle
life, Prussian blue chemistry, can meet the demanding DC market performance requirements. DOE
funded a startup with this chemistry and their 2020 launch exceeds 50,000 kW [9].
11Energy Storage Grand Challenge Market Report 2020 December 2020
Lithium-Ion Batteries
Li-ion batteries are deployed in both the stationary and transportation markets. They are also the major
source of power in consumer electronics. Most analysts expect Li-ion to capture the majority of energy
storage growth in all markets over at least the next 10 years [2], [3], [4], [5], [10].
Li-Ion Market
Li-ion is the fastest-growing rechargeable battery segment; its global sales across all markets more than
doubled between 2013 and 2018. The transportation sector dominates the Li-ion market and is also the
fastest growing, with just 1% of automotive sales consuming 60% of Li-ion batteries [10]. Christophe
Pillot of Avicenne reports [10] that the Li-ion market was $40 billion in 2018, and as shown in Figure 9,
this corresponded to a global deployment of 172 GWh, rising to 195 GWh in 2019 [3].
Figure 9. Historical annual global Li-ion deployment – all markets
Source: [3] Bloomberg New Energy Finance, "Electric Vehicle Outlook 2020," BloombergNEF, New York, 2020. Available:
https://about.bnef.com/electric-vehicle-outlook/.
Several analysts have projected the Li-ion markets to 2030. The underlying assumptions, as well which
markets are included in the analyses, depend upon the specific source. This section provides a high-level
summary of these analyses and assumptions.
BNEF [3] and Pillot [10] projected Li-ion deployment for 2030 for all markets, as shown in Figures 10 and
11, respectively. BNEF developed a single scenario and projects just over 2 TWh across consumer
electronics, stationary storage, and transportation. Avicenne’s projections included these markets as
well as an “other” market (e.g., medical devices and power tools) for two scenarios: Base (0.9 TWh) and
Realistic (1.2 TWh). 6 All three scenarios over both studies project the transportation sector to dominate
6
Avicenne does not present detailed descriptions of either scenario, but both are presented here to show
potential options.
12Energy Storage Grand Challenge Market Report 2020 December 2020
(i.e., comprise >90%) Li-ion deployment over the study period. BNEF projects 1.8 TWh of Li-ion for
transportation in 2030, whereas Avicenne projects 0.7–1.0 TWh.
Figure 10. BNEF projected global Li-ion deployment – all markets
Source: [3] Bloomberg New Energy Finance, "Electric Vehicle Outlook 2020," BloombergNEF, New York, 2020. Available:
https://about.bnef.com/electric-vehicle-outlook/.
Figure 11. Avicenne global Li-ion projections – all markets
Source: [10] C. Pillot. (May 2019). The Rechargeable Battery Market and Main Trends 2018-2030. Presented at Advanced
Automotive Battery Conference. Available: https://niobium.tech/en/pages/gateway-pages/pdf/technical-briefings/the-
rechargeable-battery-market-and-main-trends-2018-2030.
The International Energy Agency (IEA) Global EV Outlook 2020 [2] evaluated the transportation sector
only and projected xEV (hybrid and plug-in hybrid electric vehicle) sales by country. The first scenario
13Energy Storage Grand Challenge Market Report 2020 December 2020
evaluated was “Stated Policies,” or STEPS, and is based on current goals, plans, and policy measures.
Included in this scenario are the effects of achieving national xEV deployment targets, internal
combustion engine vehicle phase-out plans, purchase incentives, and current and announced policies
for seven major markets (Canada, Chile, China, European Union, India, Japan, and the United States). It
also considers announcements from original equipment manufacturers regarding plans to expand the
range of xEV models offered and plans for scaling up their production [2].
The Li-ion storage required in 2030 for the vehicles in the STEPS scenario was estimated 7 at 1.6 TWh,
which is similar to BNEF’s [3] 1.8-TWh estimate. Figures 12 and 13 detail the IEA STEPS scenario by
mobility segment and region, respectively. As shown in the figures, light-duty vehicles comprise the
largest class of mobile Li-ion storage and China has the largest market for mobile Li-ion storage.
Figure 12. Projected global Li-ion deployment in xEVs by vehicle class for IEA STEPS scenario (Ebus: electric bus;
LDVs: light-duty vehicles; MD/HDVs: medium- and heavy-duty vehicles)
Source: [2] International Energy Agency, "Global EV Outlook 2020: Entering the decade of electric drive?" IEA, Paris, June 2020.
Available: https://www.iea.org/reports/global-ev-outlook-2020.
7
Li-ion storage was estimated from the global vehicle sales by class and typical onboard battery sizes for each
vehicle class.
14Energy Storage Grand Challenge Market Report 2020 December 2020
Figure 13. Projected Global Li-ion Deployment in xEVs by Region for IEA STEPS Scenario
Source: [2] International Energy Agency, "Global EV Outlook 2020: Entering the decade of electric drive?" IEA, Paris, June 2020.
Available: https://www.iea.org/reports/global-ev-outlook-2020.
IEA [2] also evaluated a second scenario, the “Sustainable Development Scenario,” which assumes that
the xEVs capture 30% of vehicle sales share for light-, medium-, and heavy-duty vehicles and buses
globally [2]. Under this scenario, up to 3 TWh of Li-ion mobility capacity could be added by 2030. Figure
14 compares the two IEA scenarios.
Figure 14. Projected Global Annual Li-ion Deployments in xEVs for IEA Scenarios
Source: [2] International Energy Agency, "Global EV Outlook 2020: Entering the decade of electric drive?" IEA, Paris, June
2020. Available: https://www.iea.org/reports/global-ev-outlook-2020.
15Energy Storage Grand Challenge Market Report 2020 December 2020
Despite many projections otherwise, the European electric-car market exceeded China for the first time
in 2020; further, it is expected to reach over 1 million xEVs in 2020 [11]. This growth is related to
Europe’s sustained policies and subsidies, whereas China has reduced their EV subsidies. Germany, for
example, has set targets of 7–10 million xEVs by 2030, and is offering up to €9,000 for new EVs and
hybrids [12]. Germany is also investing greater than €1.5 billion in battery cell research and production,
targeting initial 2020 manufacturing, which will transition to production scale by the mid-2020s [12].
To support the rapid expansion of the EV market, numerous companies, countries, and municipalities
are investing in EV charging infrastructure. Global EV charging ports recently surpassed 1 million, which
is a doubling over last 3 years. Europe leads in the expansion, increasing its EV charging infrastructure
fivefold between 2017 and 2020. Over the same period, China’s growth expanded by 158% and U.S.
growth was 65%. Japan, which has invested heavily in hydrogen fuel cell vehicles, saw only a 30%
expansion [13].
In contrast to growth in transportation, the United States is a leader in global stationary storage
deployments. This is usually because renewables are often the lowest-cost generation source, but
require storage to mitigate variability. For example, the California grid is estimated to need 12 GW of
energy storage for balancing after solar replaces 9 GW of retired gas generation [14]. The California
Public Utilities Commission has thus far approved a total of 5.1 GW, which is planned out to 2022.
Li-Ion Manufacturing
The majority of global Li-ion cell manufacturing is in China, the United States, Asia, and Europe, as
shown in Figure 15 [15]. China dominates today with nearly 80% of the global manufacturing capacity
(~525 GWh); additionally, it has over 60% of near-term (2025) 1,400 GWh, which is either planned or
under construction (Figure 16). For comparison, the Rocky Mountain Institute projects a 2023 global Li-
ion manufacturing capability of 1,300 GWh, with half of that in China [16].
The United States is the second-largest manufacturer of battery cells at 8% of current global capacity,
primarily due to the Tesla-Panasonic plants in Nevada. The United States also has 6% (~90 GWh) of the
facilities planned/under construction. With aggressive new legislation and government-backed
financing, manufacturing in Europe is expected to grow significantly.
16Energy Storage Grand Challenge Market Report 2020 December 2020
Figure 15. Global Li-ion battery cell manufacturing
Source: [15] Bloomberg New Energy Finance, "Storage Data Hub, Cell Manufacturers," BloombergNEF, New York, 2020. Available:
https://about.bnef.com/
Figure 16. Li-ion battery manufacturing planned (blue) or under construction (red)
Source: [15] Bloomberg New Energy Finance, "Storage Data Hub, Cell Manufacturers," BloombergNEF, New York, 2020. Available:
https://about.bnef.com/
Although China’s dominance in manufacturing today is well-established, mobility-fueled growth may
change the global footprint in the future. Europe has enacted strong policies and incentives for local and
regional growth that supports xEVs. The European Battery Alliance projects that the market for
Eureopean-manufactured batteries could be €250 billion by the mid-2020s [11]. Currently, two
gigafactories—plants that will produce enough batteries for over one million EVs—are planned in
Dourvin, France, and Kaiserslautern, Germany [17], with French and German public investment of €1.5
billion and €3.5 billion, respectively, from private investors.
17Energy Storage Grand Challenge Market Report 2020 December 2020 Figure 17 [18] summarizes the global manufacturing capacity of four of the major components in a lithium-ion battery: anodes, cathodes, electrolyte salts, and electrolyte solutions. 8 Currently, Li-ion anodes are primarily composed of graphite and are manufactured in five countries: China, Japan, the United States, the Republic of Korea, and India, which are responsible for 76%, 13%, 6%, 4%, and 1%, respectively, of global production. Li-ion cathodes, which have varied in composition as new lower- cobalt chemistries have become technically viable, are manufactured in nine countries. Over half (58%) are manufactured in China, followed by Japan and the Republic of Korea, which each have almost 17%. The United States manufactures
You can also read