A multi-environmental tracer study to determine groundwater residence times and recharge in a structurally complex multi-aquifer system - HESS
←
→
Page content transcription
If your browser does not render page correctly, please read the page content below
Hydrol. Earth Syst. Sci., 24, 249–267, 2020
https://doi.org/10.5194/hess-24-249-2020
© Author(s) 2020. This work is distributed under
the Creative Commons Attribution 4.0 License.

A multi-environmental tracer study to determine
groundwater residence times and recharge in a
structurally complex multi-aquifer system
Cornelia Wilske1,2 , Axel Suckow2 , Ulf Mallast1 , Christiane Meier3 , Silke Merchel4 , Broder Merkel5 ,
Stefan Pavetich4,6 , Tino Rödiger7 , Georg Rugel4 , Agnes Sachse7 , Stephan M. Weise1 , and Christian Siebert1
1 Department of Catchment Hydrology, Helmholtz Centre for Environmental Research, Halle (Saale), 06120, Germany
2 CSIRO  Land and Water, Urrbrae, South Australia, 5064, Australia
3 Umweltbundesamt (UBA), Dessau-Roßlau, 06844, Germany
4 Helmholtz-Zentrum Dresden-Rossendorf, Dresden, 01328, Germany
5 Technische Universität Bergakademie Freiberg, 09599, Germany
6 Department of Nuclear Physics, Research School of Physics and Engineering,

Australian National University, Canberra, ACT 2609, Australia
7 Department of Computational Hydrosystems, Helmholtz Centre for Environmental Research, Leipzig, 04318, Germany

Correspondence: Christian Siebert (christian.siebert@ufz.de)

Received: 30 August 2019 – Discussion started: 9 September 2019
Revised: 18 November 2019 – Accepted: 11 December 2019 – Published: 16 January 2020

Abstract. Despite being the main drinking water resource         the groundwater were further indications of infiltration dur-
for over 5 million people, the water balance of the Eastern      ing the last 30 years. The combination of multiple environ-
Mountain Aquifer system on the western side of the Dead          mental tracers and lumped parameter modelling helped to
Sea is poorly understood. The regional aquifer consists of       understand the groundwater age distribution and to estimate
fractured and karstified limestone – aquifers of Cretaceous      recharge despite scarce data in this very complex hydro-
age, and it can be separated into a Cenomanian aquifer (upper    geological setting. Our groundwater recharge rates support
aquifer) and Albian aquifer (lower aquifer). Both aquifers are   groundwater management of this politically difficult area and
exposed along the mountain ridge around Jerusalem, which         can be used to inform and calibrate ongoing groundwater
is the main recharge area. From here, the recharged ground-      flow models.
water flows in a highly karstified aquifer system towards the
east and discharges in springs in the lower Jordan Valley
and Dead Sea region. We investigated the Eastern Mountain
Aquifer system for groundwater flow, groundwater age and         1   Introduction
potential mixtures, and groundwater recharge. We combined
36 Cl / Cl, tritium, and the anthropogenic gases SF , CFC-12     About 20 % of the Earth’s land surface is covered by carbon-
                                                    6
(chlorofluorocarbon) and CFC-11, while using CFC-113 as          ate karst or sulfate aquifers and serves as the primary water
“dating” tracers to estimate the young water components in-      resource for at least 25 % of the world’s population. In addi-
side the Eastern Mountain Aquifer system. By application         tion, about a fifth of the world’s karst systems are in (semi-
of lumped parameter models, we verified young groundwa-          )arid areas, whose water scarcity is aggravated by strong pop-
ter components from the last 10 to 30 years and an admix-        ulation growth (Ford and Williams, 2007). Karst systems rep-
ture of a groundwater component older than about 70 years.       resent abundant but highly variable water resources whose
Concentrations of nitrate, simazine (pesticide), acesulfame K    extremely heterogeneous and anisotropic flow behaviour pre-
(ACE-K; artificial sweetener) and naproxen (NAP; drug) in        vents exact predictions regarding mass transport and the us-
                                                                 able water quantities (Bakalowicz, 2005). Nevertheless, the

Published by Copernicus Publications on behalf of the European Geosciences Union.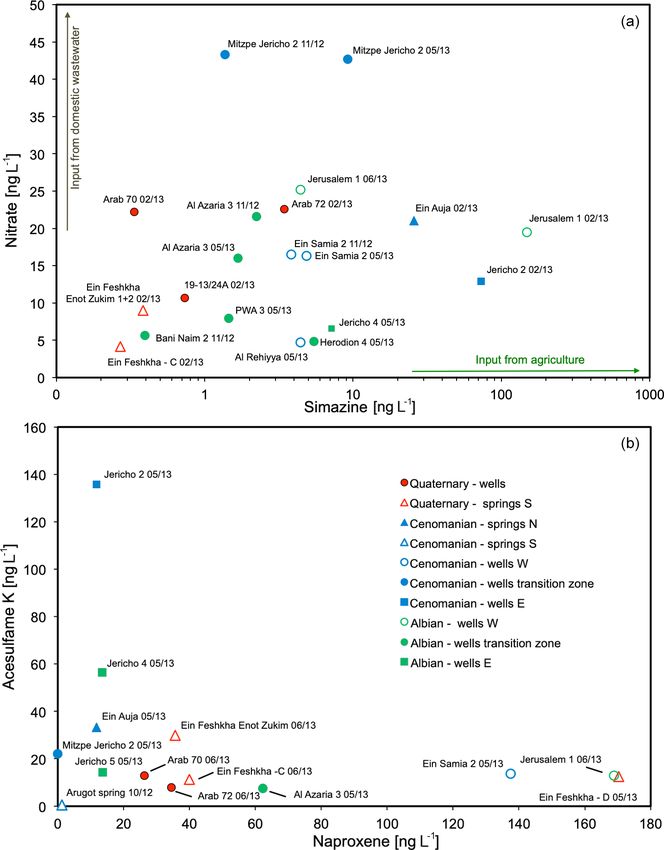
250       C. Wilske et al.: A multi-environmental tracer study to determine groundwater residence times and recharge

water balance meets the basic requirement for sustainable            In our study, the Eastern Mountain Aquifer (EMA) sys-
management and protection of any water resource.                  tem in the western Dead Sea catchment is the pivotal water
   Environmental tracers play an important role in sustain-       resource for some million people in the West Bank and Is-
able water management strategies because they allow for es-       rael. An unequal distribution of borehole information leads
timating the groundwater age distribution with depth, and         to poor and limited data for studying that aquifer system. Pre-
together with simple lumped parameter models they can             vious studies considered age dating tracers to quantify water
be used to quantify groundwater infiltration rates (Vogel,        movement and flow velocity within the EMA and associated
1967; Solomon et al., 1995; IAEA, 2006). Especially in karst      aquifers. Paul et al. (1986) and Yechieli et al. (1996) studied
aquifers, wide ranges of residence times are observable due       36 Cl / Cl to detect very old groundwater brines in the Dead

to the strongly heterogeneous hydraulic system, allowing wa-      Sea area. In contrast young-age dating tracers such as tritium
ter to rapidly flow through conduits and fractures and very       or anthropogenic trace gases (CFCs and SF6 ) were used to
slowly flow through the small pores of the matrix. That leads     quantify the duration of water flow from recharge areas to
to large heterogeneities in the groundwater age distribution,     the springs (Lange, 2011). Environmental tracer investiga-
hence requiring the application of multiple tracers to con-       tions of the main Cretaceous aquifers (Upper Cenomanian
strain the age distribution, especially in karst. We define       and Albian) in the western Dead Sea catchment attempted to
young groundwater as having measurable concentrations of          quantify the duration of water flow from the recharge area to
anthropogenic tracers, thus a mixing component recharged          the springs in the mountain region uphill of the Dead Sea
after about 1950, while in old groundwater these tracers are      coast. The young-age dating tracers demonstrated a large
not detectable (e.g. Plummer et al., 1993; Cook and Herczeg,      young groundwater fraction with a mean residence time of
2000). The atmospheric tracer CFC-11 (chlorofluorocarbon),        less than 30 years in the springs of the mountain region and
CFC-12, CFC-113, SF6 (sulfur hexafluoride) and 36 Cl / Cl         fast connections to the recharge area. All previous studies
and tritium from bomb tests or anthropogenic organic trace        together show large heterogeneities in the groundwater age
pollutants like pesticides, sweeteners or drugs are increas-      distribution (Avrahamov et al., 2018).
ingly used as tracers of young groundwater (IAEA 2006).              In this study we combine for the first time in this area
Gas tracers like CFCs and SF6 move through the unsaturated        bomb-derived 36 Cl, anthropogenic organic trace substances
zone primary by diffusion, leading to a time lag at the water     and environmental tracers like tritium, CFCs, SF6 in combi-
table compared to the atmosphere (Cook and Solomon, 1995;         nation with lumped parameter models to interpret the distri-
Cook et al., 1995). A time lag is also possible for the water     bution of these tracers to quantify recharge. Małoszewski and
bound tracers tritium and 36 Cl, since the advection through      Zuber (1982, 1993, 1996) have shown that LPMs are a use-
the unsaturated zone may take decades (Suckow et al., 1993;       ful tool for interpreting tracer data obtained at separate sam-
Lin and Wei, 2006), and in infiltration areas dominated by        pling sites when it is not possible to use distributed parameter
sand or clay, water-bound tracers are generally slower than       models, as the latter require more detailed and often unavail-
gas tracers (Solomon et al., 1992; Cook et al., 1995). This can   able knowledge about distributed parameters for the investi-
be very different in karst systems, where preferential flow in    gated system. In detail this work aims (i) to validate young
karst “tubes” allows for a fast recharge to the groundwater       rainwater input and short groundwater travel times via karst
table, and fluctuations of groundwater level may allow for        conduits, related to rapid flow paths from the recharge area;
further gas exchange thereafter.                                  (ii) to quantify the time lag of gas tracers in the unsaturated
   The deconvolution of measured tracer concentrations into       zone; (iii) to quantify groundwater mixing of groundwater
recharge rates therefore needs modelling. If the age of water     components with different ages via lumped parameter mod-
would be known as function of depth, any flow model could         els; and (vi) to estimate groundwater recharge and support
be directly constrained, and the recharge rates could be de-      calculations of future groundwater resource development.
duced. However, the “idealized groundwater age”, which is
often understood as the time span an imaginary water par-         1.1   Study area
cel needs between infiltrating at the groundwater surface and
being sampled at a well or spring (Suckow, 2014a) is not          The study area, which represents the western surface
directly measurable. In addition, groundwater mixes both          drainage basin of the Dead Sea, is embedded in a region that
along its natural flow through the aquifer and during sam-        is morphologically and geologically dominated by the tec-
pling in the well. Therefore, simple lumped parameter mod-        tonic processes associated with the Jordan–Dead Sea rift, ac-
els (LPMs) are used to interpret the measured tracer con-         tive since the late Oligocene (Garfunkel et al., 1981; Rosen-
centrations as mean residence times (MRTs) via a convolu-         feld and Hirsch, 2005). The western rift fault separates the
tion integral, which in combination with the underlying as-       Cretaceous aquifer formations that form the graben shoulder
sumptions on the flow system allow for deducing recharge          from the deeply subsided graben and its Quaternary filling.
rates. We applied the piston flow model (PM), the dispersion      In addition, rift tectonics induced a series of faults within the
model (DM) and the partial exponential model (PEM) to ap-         western graben shoulder, resulting in down-faulted blocks,
proximate the age distribution in our groundwater samples.        which find their surface expression in a strong morphologi-

Hydrol. Earth Syst. Sci., 24, 249–267, 2020                                      www.hydrol-earth-syst-sci.net/24/249/2020/
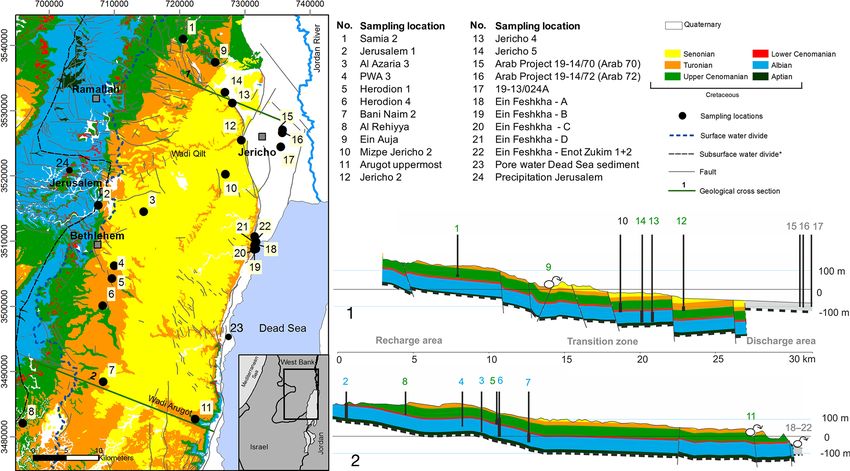
C. Wilske et al.: A multi-environmental tracer study to determine groundwater residence times and recharge                      251

Figure 1. The location of the study site including geological information based on Begin (1974), Mor and Burg (2000), Raz (1986),
Roth (1973), Shachnai (2000), Sneh and Avni (2011), and Sneh and Roth (2012). Universal Transverse Mercator (UTM) coordinates:
UTM WGS84 Z36N.

cal gradient. Within less than 25 km, the land surface drops        two regional aquifers occurs through springs at the base
from +800 m m.s.l. in the west to sea level at the rift margin,     of the graben shoulders, where the groundwater leaves the
with a terminal step to −430 m m.s.l. at the Dead Sea in the        aquifers and approaches the prevalently impervious Quater-
east (Fig. 1).                                                      nary graben filling.
   The semi-arid-to-arid Mediterranean climate leads to pre-           Subsequently, groundwater emerges along the shore in
cipitation during the winter season, with a strong decline          spring clusters, forming ecologically important oases such
from west to east due to which the study area can be di-            as Ein Feshkha. Where groundwater can percolate into the
vided into three hydrological zones: (i) the recharge area in       Quaternary sediments; they intensely dissolve the evaporite
the upland that receives annually up to 580 mm of precipita-        minerals contained within (halite, anhydrite and aragonite)
tion; (ii) the transition zone occupying the hillsides of the up-   and get saline on their flow path to the lake shore. In addi-
land down to the rift margin, receiving 100–400 mm yr−1 and         tion, the chemical and isotopic composition of approaching
(iii) the major discharge area of groundwater in the lower Jor-     fresh groundwaters is systematically modified by an admix-
dan Valley–Dead Sea area, receiving less than 100 mm yr−1           ing of brines, already in the vicinity of the major rift fault
of precipitation.                                                   (Katz and Kolodny, 1989; Stein et al., 1997; Ghanem, 1999;
   The graben shoulder hosts a thick aquifer system that is         Yechieli, 2000; Klein-BenDavid et al., 2004; Khayat et al.,
mainly built of fractured and layered karstified Upper Ceta-        2006a, b; Möller et al., 2007; Siebert et al., 2014; Starin-
ceous limestone and dolostone, which are overlain by a              sky and Katz, 2014). Groundwater recharge rates are con-
Senonian chalky aquitard. A marly aquiclude (Lower Ceno-            trolled by climate conditions and have been investigated ear-
manian) divides the system into a lower aquifer (Albian) and        lier to force regional groundwater models (Guttman et al.,
upper aquifer (Upper Cenomanian). Impervious beds in the            2004; Yellin-Dror et al., 2008; Gräbe et al., 2013; Schmidt
upper aquifer permit the development of a perched and lo-           et al., 2014), which allowed for a detailed insight into the re-
cally important aquifer (Turonian), being built of homoge-          gional groundwater flow dynamics (Laronne Ben-Itzhak and
nous and fissured limestones and holding springs, which             Gvirtzman, 2005; Sachse, 2017).
emerge in deeply incised valleys within the transition zone            Human groundwater abstraction takes place mainly in the
(e.g. Wadi Qilt springs; Fig. 2). While all aquifer units are       mountain ridge inside the recharge area and along the tran-
recharged in the mountain area, the natural discharge of the        sition to the Jordan Valley. This unequal distribution of the

www.hydrol-earth-syst-sci.net/24/249/2020/                                          Hydrol. Earth Syst. Sci., 24, 249–267, 2020
252 C. Wilske et al.: A multi-environmental tracer study to determine groundwater residence times and recharge
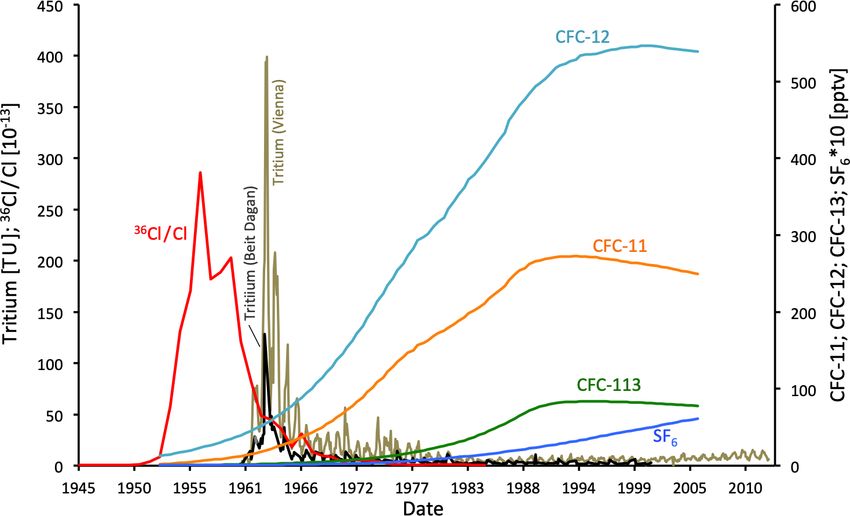
Figure 2. Atmospheric input curves of 36 Cl / Cl (36 Cl obtained from Dye-3 ice core; Synal et al., 1990), SF6 and CFCs (Plummer et al.,
2006) and decay-corrected Tritium in rain water of Beit Dagan and Vienna (IAEA/WMO, 2019).
sampling possibilities led to a data scarcity for the entire cen- latter. The rain water salinity was set to 0 ‰ since rain water
tral area of the aquifer, which is also visible in Fig. 1. is low mineralized.
Tritium (3 H) is the naturally occurring isotope of hydro-
gen and is mainly produced by fast secondary neutrons from
cosmic radiation. It decays to 3 He with a half-life of 12.32 ±
2 Materials and methods 0.02 years (Lucas and Unterweger, 2000), making 3 H usable
for groundwater age dating in a time frame of < 40 years
2.1 Fundamentals of the method (e.g. Schlosser et al., 1988; Solomon et al., 1992; Cook and
Solomon, 1997; Sültenfuß and Massmann, 2004), including
Age distributions of young groundwater can be characterized quantifying changes of measured 3 He /4 He ratios in ground-
by applying anthropogenic trace gases like CFC-11, CFC-12, water. At the study area, observations of tritium in precipi-
CFC-113 and SF6 in lumped parameter models if an input tation (Global Network of Isotopes in Precipitation stations
function is available. For the last 6 decades, that function has Beersheba, Beit Dagan and Tirat Yael; GNIP; IAEA/WMO,
been derived for gas tracers from (i) their known concen- 2019) were available only for 1960–2001, while input data
trations in the atmosphere (Fig. 2), (ii) the observation that are required until 2014. We therefore applied tritium data
they are well mixed in the atmosphere and (iii) the obser- from the Vienna station, Austria (IAEA/WMO, 2019), which
vation that their solubility at the temperature of recharge is are adjusted to the longitudinal and latitudinal difference by
known from Henry’s law (Plummer and Busenberg 2000). a factor of 0.4 to match the stations in Israel (Fig. 2). For the
The large-scale production of CFC-11 and CFC-12 (both synoptic tracer plots the decay correction is set to 31 Octo-
used as cooling fluid) started in the early 1940s, while the ber 2013. The pre-bomb input value for tritium was set to a
production of CFC-113 only started in the 1960s. Inevitably mean tritium concentration of 3 TU obtained from the GNIP
they leaked into the environment, with atmospheric con- database (IAEA/WMO, 2019).
centrations rising until the 1990s, when their moratorium 36 Cl is produced naturally via cosmic-ray and solar pro-
took effect. Another industrial gas SF6 , widely used as an tons induced by nuclear reactions of argon in the atmosphere
electrical insulator, has been detectable in the atmosphere and 35 Cl in marine aerosols (Alvarado et al., 2005). However,
since 1960s with still exponentially rising concentrations. comparable to 3 H, the atmospheric concentration of “bomb”
Atmospheric concentrations of SF6 and the CFCs for the 36 Cl peaked during the 1950s as an effect of nuclear weapon
period 1953–2006 (Fig. 2) are derived from Plummer et tests and was washed out from the atmosphere by the end
al. (2006). Since gas solubility in recharging precipitation de- of the 1960s. The 36 Cl bomb peak precedes the tritium peak
pends on temperature and atmospheric pressure, the average by half a decade. The 36 Cl input curve for our study area
air temperature of the winter season in the study area (15 ◦ C) (Fig. 2) was obtained from Iceland ice core measurements
was used for the former and an altitude of 700 m m.s.l., which from Synal et al. (1990), which were corrected to the loca-
is the average altitude of the infiltration area, was used for the tion of the study area by applying a latitudinal correction with
Hydrol. Earth Syst. Sci., 24, 249–267, 2020 www.hydrol-earth-syst-sci.net/24/249/2020/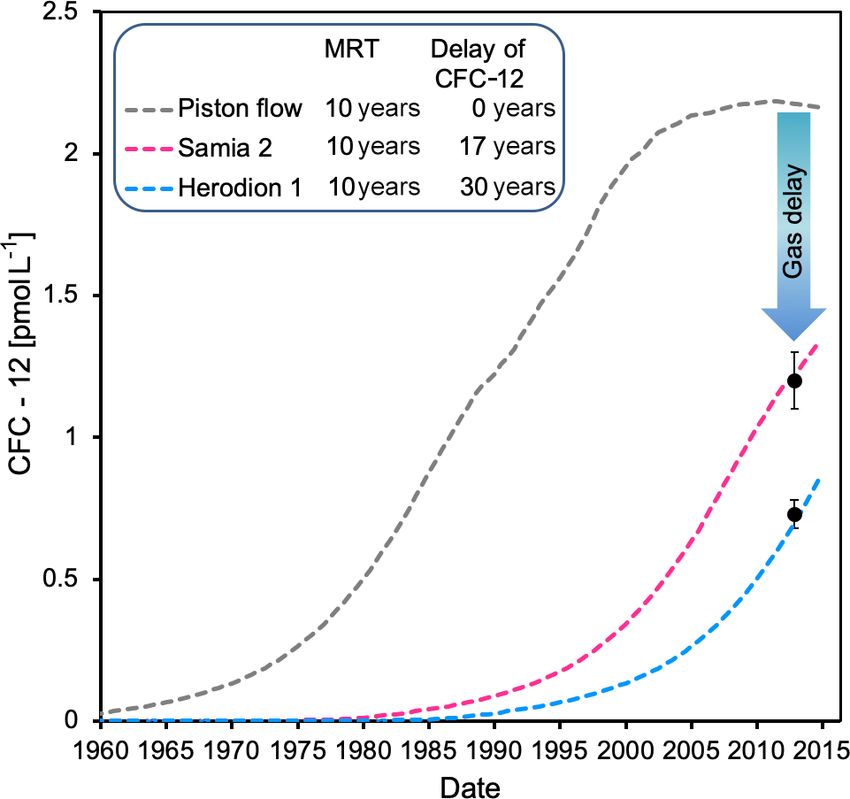
C. Wilske et al.: A multi-environmental tracer study to determine groundwater residence times and recharge                     253

a factor of 3, according to Heikkilä et al. (2009), who mod-       scribed in Oster et al. (1996), sampling for CFCs and SF6
elled 36 Cl fallout for different latitudes. Natural “pre-bomb”    was performed using glass bottles fully submerged in tins,
concentrations of 36 Cl / Cl were assumed to be 10−14 , which      filled with sampling water. Tritium samples were collected
is based on 36 Cl / Cl in rainwater, sampled during the winter     in 500 mL HDPE bottles. Organic trace elements were sam-
of 2014–2015 with an average value of 36 Cl / Cl = 8×10⁻¹⁵ .       pled in pre-cleaned, methanol-flushed 1000 mL brown glass
   Most studies to estimate groundwater age with a 36 Cl base      bottles with the use of a glass microfiber filter (0.7 µm).
with a half-life of 36 Cl (0.301 ± 0.015 Myr) (Nica et al.,            Major element analyses in water samples were performed
2012) consider time frames > 100 000 years (Davis et al.,          at the Helmholtz Centre for Environmental Research (UFZ)
1983; Bentley et al., 1986; Love et al., 2000; Mahara et al.,      by using matrix-adjusted inductively coupled plasma optical
2012; Müller et al., 2016). Studies using 36 Cl from the at-       emission spectroscopy (ICP-AES, Spectro Arcos) for Na+ ,
mospheric bomb peak to estimate the groundwater age of the         K+ , Ca2+ , Mg2+ and Sr2+ and by using ion chromatogra-
last decades are much less frequent (Alvarado et al., 2005;        phy (ICS-2000, Dionex) for Cl− , Br− and SO2−     4 . Bicarbon-
Tosaki et al., 2007, 2010; Lavastre et al., 2010; Rebeix et al.,   ate was determined in situ by titration. Analyses of 36 Cl were
2014).                                                             carried out in the Helmholtz-Zentrum Dresden-Rossendorf
   Anthropogenic organic trace pollutants in groundwater are       at the accelerator mass spectrometry (AMS) facility DREs-
associated with nutrition, medication, or agricultural and         den AMS (DREAMS) (Akhmadaliev et al., 2013). The main
industrial development. During the last decades, artificial        preparation steps consist of (i) the precipitation of chloride
sweeteners have played an important role as a surrogate in         by adding an AgNO3 solution (10 %) and subsequent dis-
the nutrition industry. Particularly acesulfame K (ACE-K)          solution of the AgCl in NH4aq ; (ii) the separation of chlo-
has been used since the 1990s and is stable against wastew-        rides from sulfates by co-precipitation of BaSO4 with BaCO3
ater treatment (WWT) processes, making it an ideal tracer          (CO2 from air) using a saturated BaNO3 solution and filtra-
for domestic wastewater. A second chemical marker for hu-          tion through a syringe filter made of polyvinylidene fluoride
man intake is naproxen (NAP), widely applied as an anti-           (pore size: 0.45 µm); and (iii) the re-precipitation of AgCl
inflammatory drug since the 1980s. Though NAP is partly            in the filtrate with nitric acid. 36 Cl is measured with AMS
eliminated during WWT and may be adsorbed along flow               relative to the stable Cl isotopes, 35 Cl and 37 Cl (Pavetich
paths to sediments (Chefetz et al., 2008; Yu et al., 2008;         et al., 2014; Rugel et al., 2016), and is given as the ratio
Teijón et al., 2013), it occurs in effluents of sewage plants      of 36 Cl/(37 Cl+35 Cl) (termed 36 Cl / Cl in the text). All data
and increasingly in natural waters (Arany et al., 2013). Con-      are normalized to the standards of SM-Cl-12 and SM-Cl-13
trasting that, ACE-K is hydrophilic (e.g. Buerge and Poiger,       (Merchel et al., 2011).
2011) and inert against degradation, which makes it a valu-            Tritium sample preparation and measurement were con-
able substance to trace transport from the recharge towards        ducted by the isotope hydrology group at UFZ, following the
the discharge area. In addition to the urban indicators, pesti-    preparation steps of Trettin et al. (2002) by first enriching
cide traces in groundwater were used to identify the agricul-      a 400 mL water sample electrolytically and measuring it via
tural contributions to the water resources. Simazine, which        liquid scintillation counting with a detection limit of 0.5 TU.
has been available since the 1950s, is one of the most applied         CFCs and SF6 were analysed in the Spurenstofflabor
herbicides and absorbs into soil where it may be eliminated        Dr. Harald Oster (Wachenheim, Germany) by gas chro-
though bacterial degradation. However, the use of simazine         matography (Bullister and Weiss, 1988; Oster et al., 1996).
has been phased out in Israel since 2012–2014 (Berman et al.,      Measurements of organic trace elements were conducted
2014). Nitrate is another indicator for anthropogenic input,       with high-pressure liquid chromatography mass spectrom-
whose distribution in groundwater originates from the nitrifi-     etry (HPLC-MS) at the UFZ. To transport the samples to
cation of NH4 during WWT and fertilizer excess in agricul-         the lab, organic components were stabilized by solid phase
ture.                                                              extraction (SPE) on cartridges containing a polar-modified
                                                                   polystyrene–divinylbenzene copolymer (Chromabond Easy,
2.2   Sampling and analytical methods                              Macherey-Nagel). At the lab, analytes were eluted with
                                                                   methanol and measured with HPLC-MS/MS (Agilent 1000,
In the study area, 22 groundwater samples were taken from          Agilent Technologies, Germany; coupled with an API2000
springs and active wells (sampling locations in Fig. 1 and Ta-     mass spectrometer, AB Sciex, Germany). Limits of detec-
ble 1) after reaching stable conditions for temperature, elec-     tions are 1, 0.6 and 0.3 µg L−1 for naproxen, acesulfame K
trical conductivity and pH. Major anion samples were filled        and simazine, respectively. Analytical results are given in Ta-
into high-density polyethylene (HDPE) bottles after passing        ble 1.
a 0.45 µm cellulose acetate filter. Samples for cations were
acidified using HNO3 . Samples for 36 Cl analyses are filled       2.3   Lumped parameter model “LUMPY”
into 500 mL HDPE bottles, which have been specifically pre-
cleaned using ultrapure HNO3 . Samples for 36 Cl analyses          LPMs are pre-defined analytical solutions of simplified flow
were acidified with HNO3 . Following the methodology de-           systems. They describe the tracer output mathematically with

www.hydrol-earth-syst-sci.net/24/249/2020/                                         Hydrol. Earth Syst. Sci., 24, 249–267, 2020
C. Wilske et al.: A multi-environmental tracer study to determine groundwater residence times and recharge
www.hydrol-earth-syst-sci.net/24/249/2020/
Table 1. Sampling locations and analytic results. USZ: unsaturated zone (thickness); Eh: redox potential; T : temperature; EC: electrical conductivity.
No Station ID Sampling x y z USZ pH Eh T EC NO3 Cl 36 Cl / Cl CFC-11 CFC-12 CFC-113 SF6 3H Simazine Acesul- Napro-
date (UTM) (UTM) (m m.s.l.) (m) (mV) (◦ C) (µS cm−1 ) (mg L−1 ) (mg L−1 ) (10−13 ) (pmol L−1 ) (pmol L−1 ) (pmol L−1 ) (fmol L−1 ) (TU) (ng −1 ) fame K xene
(ng L−1 ) (ng L−1 )
Wells – recharge zone (Cenomanian)
1 Samia 2 12/513 10 Nov 2012 720 608 3 541 490 420 175 7.5 429 22.3 476 16.5 38.0 1.57 ±0.08 2.3 ±0.3 1.2 ±0.1 0.19 ±0.05 1.0 ±0.2 2.1 ±0.5 3.8 0.4
Samia 2 13/504 22 May 2013 7.5 349 23.6 479 16.3 34.8 4.9 13.7 137
5 Herodion 1 12/505 8 Nov 2012 710 448 3 504 543 597 254 7.5 431 21.0 491 14.7 27.6 1.41 ±0.07 1.7 ±0.2 0.73 ±0.05 0.1 ±0.05 1.0 ±0.2 1.2 ±0.26 0.2
8 Al Rehiyya 13/515 24 May 2013 697 253 3 482 073 698 7.3 352 25.5 599 4.71 44.1 0.17 ±0.02 4.4 5.6
Wells – recharge zone (Albian)
2 Jerusalem 1 13/487 10 Feb 2013 708 126 3 515 719 701 121 7.3 280 20.4 679 19.5 64.3 8.91 ±0.4 1.7 ±0.25 149 5.6
Jerusalem 1 13/505 23 May 2013 708 126 3 515 719 7.2 305 20.6 692 25.2 67.4 4.4 13.0 169
Wells – transition zone (Albian)
3 Al Azaria 3 12/507 9 Nov 2012 715 119 3 514 901 498 7.3 424 24.1 607 21.6 45.0 0.96 ±0.06 180 5.2 ±0.3 0.9 ±0.1 2.9 ±0.3 < 0.5 2.2
Al Azaria 3 12/511 24 May 2013 7.3 335 25.0 569 16 35.8 1.7 7.5 62.3
4 PWA 3 13/513 24 May 2013 710 746 3 506 529 630 7.4 346 24.6 514 7.95 22.7 0.49 ±0.03 1.5 6.5
6 Herodion 4 13/510 23 May 2013 709 107 3 500 349 774 459 7.2 350 24.1 548 4.86 23.2 0.32 ±0.03 5.5 66.1
7 Bani Naim 2 12/510 9 Nov 2012 709 445 3 488 704 541 464 7.3 415 26.7 551 5.64 22.7 0.19 ±0.02 0.02 ±0.05 < 0.01 < 0.01 0.5 ±0.1 < 0.5 0.4
Wells – transition zone (Cenomanian)
10 Mitzpe Jericho 2 12/518 12 Nov 2012 727 516 3 520 896 −20 329 7.3 509 24.5 758 43.3 74.4 0.80 ±0.05 25 ±5 2.7 ±0.2 4 ±1 0.1 ±0.1 1.4 ±0.3 1.4 3.3
Mitzpe Jericho 2 12/520 28 May 2013 7.2 377 24.7 761 42.7 73.5 9.2 22.1 0.0
Springs – transition zone N (Cenomanian)
9 Ein Auja 13/470 4 Feb 2013 725 617 3 538 000 32 7.2 387 20.9 618 21 39.0 0.64 ±0.04 2.9 ±0.35 25.7 6.4
Ein Auja 13/518 27 May 2013 7.2 500 21.3 561 15.9 34.5 33.3 11.8
Springs – transition zone S (Cenomanian)
11 Arugot uppermost 12/341 27 Oct 2012 723 664 3 483 268 −153 7.3 413 27.3 835 19 117.0 2.5 ±0.3 1.4 ±0.1 0.21 ±0.05 1.8 ±0.2 0.5 ±0.3 0.4 1.3
Wells – discharge zone (Cenomanian)
12 Jericho 2 13/479 7 Feb 2013 729 844 3 526 155 −169 329 7.1 290 24.7 1307 12.9 234 0.20 ±0.02 2.0 ±0.28 73.0 4.4
Jericho 2 13/522 28 May 2013 7.0 295 25.1 1805 < 46 361 129 136 11.8
Wells – discharge zone (Albian)
13 Jericho 4 13/523 28 May 2013 728 379 3 531 816 −116 368 7.2 335 27.3 1067 6.6 208 0.15 ±0.01 < 0.6 7.2 56.4 13.5
14 Jericho 5 13/524 28 May 2013 727 200 3 533 467 −45 456 7.1 339 25.1 1369 < 46 224 0.10 ±0.02 < 0.5 6.2 14.3 13.7
Wells – discharge zone (Quaternary)
15 Arab Project 19-14/70 (Arab 70) 13/497 16 Feb 2013 736 108 3 527 441 −309 6.9 308 26.3 4860 22.2 1303 0.24 ±0.03 0.4 ±0.32 0.3 2.0
Arab Project 19-14/70 (Arab 70) 13/526 1 Jun 2013 6.9 357 26.2 4300 < 46 1202 12.9 26.3
16 Arab Project 19-14/72 (Arab 72) 13/498 16 Feb 2013 736 124 3 527 875 −307 7.3 246 26.6 3300 22.6 926 0.26 ±0.04 3.4 1.2
Arab Project 19-14/72 (Arab 72) 13/527 1 Jun 2013 7.1 291 27.0 4040 < 46 1086 2.8 7.8 34.5
Hydrol. Earth Syst. Sci., 24, 249–267, 2020
17 19-13/024A 13/500 16 Feb 2013 735 921 3 525 245 7.3 463 24.8 1527 10.7 234 0.23 ±0.02 < 0.6 0.7 0.5
Springs – discharge zone (Quaternary)
18 Ein Feshkha – A 12/354 1 Nov 2012 732 218 3 510 111 7.3 337 26.3 12 620 1.54 4428 0.11 0.02 0.9 ±0.25
19 Ein Feshkha – B 12/355 1 Nov 2012 732 412 3 509 538 7.8 364 26.8 5860 8.18 1935 0.10 ±0.01 0.7 ±0.25
20 Ein Feshkha – C 13/489 11 Feb 2013 732 195 3 509 480 6.9 520 27.6 4680 4.13 1536 0.13 ±0.02 0.8 ±0.25 0.3
Ein Feshkha – C 13/531 7 Jun 2013 7.0 534 27.5 4670 < 46 1381 3.8 11.3 40.0
21 Ein Feshkha – D 13/476 5 Feb 2013 732 432 3 510 612 7.5 107 24.6 4230 < 2.3 1326 0.15 ±0.03 0.8 ±0.25 0.3 2.9
Ein Feshkha – D 13/502 22 May 2013 7.8 244 26.5 4250 < 46 1194 0.15 ±0.03 3.3 12.5 170.3
22 Ein Feshkha – Enot Zukim 1 + 2 12/356 2 Nov 2012 732 201 3 511 443 6.8 418 29.2 3650 20.45 1112 0.15 ±0.02 1.0 ±0.3
Ein Feshkha – Enot Zukim 1 + 2 13/474 5 Feb 2013 7.2 444 25.2 3520 9.02 1058 0.10 ±0.02 0.7 ±0.25 0.4
Ein Feshkha – Enot Zukim 1 + 2 13/532 7 Jun 2013 7.2 392 28.1 3720 < 46 965 8.9 29.9 35.7
Precipitation
23 Precipitation Jerusalem 14/517 24 Nov 2014 709 690 3 519 284 6.2 6.4 0.13 ±0.02
Precipitation Jerusalem 14/518 26 Nov 2014 709 690 3 519 284 6.1 21.4 0.30 ±0.03
Precipitation Jerusalem 14/519 15 Dec 2014 709 690 3 519 284 6.5 5.0 0.55 ±0.04
Precipitation Jerusalem 14/520 13 Dec 2014 709 690 3 519 284 6.3 10.1 0.26 ±0.02
Precipitation Jerusalem 14/521 4 Jan 2014 709 690 3 519 284 6.1 10.3 0.21 ±0.02
Precipitation Jerusalem 14/522 8 Jan 2014 709 690 3 519 284 6.3 29.5 0.18 ±0.02
Pore water from Dead Sea sediments
24 Pore water A 13/600 21 Nov 2013 733 170 3 510 300 −340 5.4 35.6 182 700 14 754 1.16
Pore water B 13/601 21 Nov 2013 733 170 3 510 300 −340 5.4 35.6 182 700 237 441 1.08
Pore water C 13/602 21 Nov 2013 733 170 3 510 300 −340 5.4 35.6 182 700 238 248 1.41
254C. Wilske et al.: A multi-environmental tracer study to determine groundwater residence times and recharge 255
a convolution integral that combines the tracer input history, Table 2. Summary of DM, PM and PEM parameters for the wells
weighed with the age distribution valid for the flow system Samia 2 and Herodion 1. Schematic graphs illustrate parameters
in question (Maloszewski and Zuber, 1982, 2002). and their individual levels in metres m.s.l. along both boreholes; the
Mathematically all lumped parameter models for steady- water-filled (saturated) part of the aquifer is indicated in blue; the
state flow systems with a time-variable tracer input are con- screen section is indicated by a checkered pattern; and the aquitard
is indicated by a striped pattern.
volution integrals (Eq. 1).
Z∞ Samia 2 well Herodion 1 well
Cout (t) = Cin (t − t 0 ) exp(−λt 0 )g(t 0 )dt 0 , (1) Surface elevation (m m.s.l.) 420 570
Groundwater level (m m.s.l.) 220 330
0 Start filter section (m m.s.l.) 245 316
End filter section (m m.s.l.) 174 237
where t is the calendar time, t 0 is the transit time of the tracer, Aquifer base (m m.s.l.)
Cout is the output concentration, Cin is the input concentra- LUMPY parameters
tion and g(t 0 ) is the weighting function or system response Distance of screen top below 0 14
function. All weighting functions of all models are normal- water table
Z1 (m)
ized, following Eq. (2). Distance of screen bottom 46 93
below water table
Z∞ Z2 (m)
g(t 0 )dt 0 = 1 (2) Saturated aquifer thickness 70 110
L (m)
0
The mean residence time is the main fitting parameter, while
some models (e.g. dispersion model) require additional pa-
2.3.1 Parameterization and model setup of LUMPY
rameters like the (i) Péclet number, (ii) top and bottom of the
screened section or (iii) saturated thickness of the aquifer. In- To parameterize the unsaturated (vadose) zone in the
put data are (i) regional atmospheric tracer input curves and recharge area, characteristic wells (Samia 2 and Herodion 1)
(ii) selected hydrogeological characteristics such as the infil- were used (Table 2).
tration temperature and elevation.
In this study the LPM code LUMPY (Suckow, 2012) was Influence of a thick unsaturated zone
used to implement the convolution integral for flow systems
that can be described by the piston flow model, the exponen- Gas tracers like CFCs and SF6 predominantly pass the unsat-
tial model (including the partial exponential model) and the urated (vadose) zone in the gas phase, posing certain prob-
dispersion model. lems for their interpretation. In unsaturated zones of less than
The PM describes the movement of a water parcel along a 5m thickness, the gas composition of soil air resembles that
defined flow path from the aquifer surface towards the spring of the atmosphere (Cook and Solomon, 1995; Engesgaard et
or well filter, neglecting any mixing, dispersion or diffusion. al., 2004). However, a time lag may occur for the diffusive
The DM characterizes transport influenced by dispersion and transport of CFCs and SF6 through thick unsaturated zones
advective flow. The relative magnitude of both is expressed of porous aquifers (Cook and Solomon, 1995). This time lag
as the Péclet number Pe (Eq. 3). is a function of the tracer diffusion coefficients, tracer sol-
P e = l · ν/D, (3) ubility in water and moisture content (Weeks et al., 1982;
Cook and Solomon, 1995). A time lag always results in a
where l is the flow length of the system under consideration, gas tracer age older than the time of groundwater recharge.
ν is the velocity and D is the dispersion constant (Huysmans In fractured (or karstic) aquifers, however, the time lag may
and Dassargues, 2005). In our model approach, best fits were be much shorter (e.g. Darling and Gooddy, 2007; Gooddy et
obtained by applying a Péclet number of 30, characterizing a al., 2006) resulting in ages of CFCs or SF6 measurements
dominantly advective transport. obtained from groundwater which effectively represent res-
The PEM is related to the exponential model (EM). Based idence time of groundwater since recharge approached the
on homogenous infiltration into a homogeneous aquifer as groundwater table, without a time lag and as if the tracer
in Vogel (1967), the PEM describes mixing of those flow were transported within the saturated zone only. The present
lines reaching the filter screen of a well. In the special case study aims to estimate travel times in the thick unsaturated
where the filter screen extends over the whole thickness of zone (Cook and Solomon, 1995; Plummer et al., 2006) by
the aquifer the PEM is equivalent to the exponential model, estimating the time lag as the relative difference in mean
and the MRT (mean residence time of the sample) is the only residence time between gas and water-bound tracers, apply-
fitting parameter. The mathematical equation of DM, EM and ing both, water-bound tracers (3 H and 36 Cl) and gas tracers
PEM are described in Maloszewski and Zuber (1982, 2002) (CFCs and SF6 ). In particular, the wells Samia 2 and Hero-
and Jurgens et al. (2016), respectively. dion 1 of the Upper Cenomanian are selected in order to con-
www.hydrol-earth-syst-sci.net/24/249/2020/ Hydrol. Earth Syst. Sci., 24, 249–267, 2020256 C. Wilske et al.: A multi-environmental tracer study to determine groundwater residence times and recharge
sider wells close to the recharge area with a thick unsaturated et al., 2013; Crosbie et al., 2018) and which assumes Cl in-
zone of 200–240 m (Table 2). They are in the eastern part of put to groundwater originates from Cl concentration in pre-
the recharge zone (Fig. 1), where the limestone is intensely cipitation, which becomes enriched due to evaporation only
fissured vertically and partly karstified. (Eq. 7).
2.3.2 Well construction, aquifer data and the P · ClP
RCMB = (7)
calculation of recharge rates ClGW
The convolution integral of the partial exponential model can The formula consists of the mean annual precipitation P and
be further constrained by the well construction data like (sat- the chloride concentrations in precipitation ClP and ground-
urated) depth to the top of the screen, the screen length and water ClGW in mg L−1 . The mean annual precipitation in the
saturated aquifer thickness (Jurgens et al., 2016). These data recharge area is about 550 mm. The average long-term Cl
were taken from the construction logs of the investigated pro- content in rain water is ca. 5 mg L−1 (Herut et al., 1992),
duction wells (Table 2). while it reaches 28 and 35–38 mg L−1 in the groundwaters
Based on the estimated MRT of the applied lumped pa- of wells Herodion 1 and Samia 2, respectively.
rameter models DM, PM and PEM, recharge rates can be
estimated. However, the formulas to apply differ slightly be- 3 Results
tween the different models. The following Eq. (4) allows for
calculating the recharge rate R for the PEM (Vogel, 1967; The 36 Cl / Cl ratios in precipitation, which fall in the recharge
Jurgens et al., 2016): area, are assumed to have been stable since the 1980s, as
indicated by rainwater samples collected during the winter
ϕ ·L
R= , (4) of 2014–2015, which show 36 Cl / Cl ratios of 1.3 × 10⁻¹⁴ to
MRT 5.5 × 10⁻¹⁴ , resembling results from the early 1980s (Herut
where φ is the porosity of the aquifer, L is the saturated et al., 1992). Contrastingly, the tritium concentration in
aquifer thickness and the MRT is valid for the whole aquifer precipitation continuously declined to about 4–6 TU today
(which is an output in LUMPY derived from the fitted MRT (IAEA/WMO, 2019). Fitting the hydrogeological trichotomy
for the sample and using the well parameters Z1 , Z2 and L of the study area well, analytical results (Table 2) resemble
in Table 2). the regional situation and group according to the individual
As for the DM and PM, L is the distance from the ground- aquifers (Fig. 3).
water surface to the depth of the centre of the screened sec-
tion of the well. Depth to the centre of the water-filled screen 3.1 Recharge area
section from groundwater level is 23 m for Samia 2 and
53.5 m for Herodion 1 (Table 2). As for the DM, not the MRT In the wells Samia 2 and Herodion 1, representative for
but the peak time, is used, which is also an output of LUMPY, the recharge area of the Upper Cenomanian aquifer, tritium
being calculated by applying Eq. (5) (Suckow, 2014b). concentrations of 2.1 and 1.2 TU as well as 36 Cl / Cl val-
q ues of 1.41 × 10⁻¹³ and 1.57 × 10⁻¹³ , respectively, are ob-
MRT 2 servable. Further south, in the well Al Rehiyya, ground-
Peak Time = 9 + Pe − 3 (5)
Pe water in the aquifer show lower 36 Cl / Cl and 3 H val-
ues of 1.73 × 10⁻¹⁴ and < 0.5 TU, respectively. The gas
Tracer transport in karst areas is influenced by double poros- tracer concentration in that part of the aquifer is low
ity effects, particularly a retardation of the tracer can be as- but detectable and showed SF6 = 1 ± 0.2 fmol L−1 , CFC-
sumed due to diffusive loss into the adjacent limestone of the 11 = 2.3 ± 0.3 pmol L−1 , CFC-12 = 1.2 ± 0.1 pmol L−1 and
fissures. A correction of calculated MRTs and recharge rates CFC-113 = 0.19±0.05 pmol L−1 in Samia 2 and comparable
may be possible applying a retardation factor (Eq. 6) (Mal- values in Herodion 1 (Table 1). The well Jerusalem 1, which
oszewski et al., 2004; Purtschert et al., 2013). represents the Lower Cenomanian aquifer extract groundwa-
∅tot ter, showed 3 H concentrations (1.7 TU) as low as those ob-
Retardation = , (6) servable in the upper aquifer, but it had much higher 36 Cl / Cl
∅eff
values (8.9 × 10⁻¹³ ).
where ∅tot ist the total porosity and ∅eff is the effective
porosity. An assumed porosity in the carbonate karst aquifers 3.2 Transition zone
may vary between < 2 % (representing the open fissures and
solution pipes) to 20 % (total pore space in the aquifer rock). Groundwater, emerging from the perched Turonian aquifer
Groundwater recharge was also estimated using the chlo- (Ein Auja) and from the Upper Cenomanian aquifer
ride mass balance (CMB) method, which was successfully (Mizpe Jericho 2), shows a low 36 Cl / Cl ratio of 6.35 ×
applied elsewhere (Eriksson and Khunakasem, 1969; Alli- 10−14 and 7.99 × 10⁻¹⁴ and 3 H concentrations of 2.9 and
son and Hughes, 1978; Wood and Sanford, 1995; Purtschert 1.4 TU, respectively. The well Mizpe Jericho 2 stands
Hydrol. Earth Syst. Sci., 24, 249–267, 2020 www.hydrol-earth-syst-sci.net/24/249/2020/C. Wilske et al.: A multi-environmental tracer study to determine groundwater residence times and recharge 257
Figure 3. Results of 36 Cl / Cl vs. chloride concentrations in the investigation area in log scale.
out due to its high CFC contents, reaching values of nary sediment, get leached by approaching fresh groundwa-
CFC-11 = 25 pmol L−1 and CFC-113 = 4 pmol L−1 , higher ters and cause the lowest observable 36 Cl / Cl values of 1.01–
than possible in equilibrium with the atmosphere (4.5 and 1.51 × 10⁻¹⁴ .
0.5 pmol L−1 , respectively). Further south, the Arugot spring Brackish groundwaters from the Arab wells 19-13/24A,
discharges in the upper Arugot Valley, about 300 m above the 19-14/70 and 19-14/72, which are drilled in the graben sed-
Dead Sea from the Upper Cenomanian aquifer, closely to the iments east of Jericho, show 36 Cl / Cl values of 2.29–2.57 ×
brim of the graben flank but within the transition zone. The 10−14 , higher than the ratios in (i) fresh groundwaters from
emerging groundwater is high in SF6 (2.1 fmol L−1 ), CFC-11 both Cretaceous aquifers (Jericho 2, 4 and 5) and (ii) Ein
(3.8 pmol L−1 ) and CFC-12 (1.8 pmol L−1 ) but contains very Feshkha, and hence, these refer to a different source of salin-
low 3 H (0.5 TU), suggesting a well-developed karst network ization.
which allows for sufficient gas exchange of older groundwa- In general, the following patterns can be extracted from
ter with recent atmosphere along its flow path. the hydrochemical and tracer data:
Groundwater in the Albian aquifer (wells PWA 3, Hero-
i. spring water of the Upper Cenomanian (Ein Auja) con-
dion 4 and Bani Naim 3) has a low concentration regarding
tains groundwater infiltrated after the era of atmospheric
CFCs, SF6 and 3 H (< 1 TU) and shows low 36 Cl / Cl ratios of
bomb testing, indicated by tritium and 36 Cl / Cl values
1.9–4.9 × 10⁻¹⁴ . An exception is well Azaria 3, at the edge
comparable with recent rain water;
between the recharge and transition zones, which shows a
higher 36 Cl / Cl value (9.59 × 10⁻¹⁴ ) than recent precipita- ii. groundwater of the Upper Cenomanian close to the
tion, much less tritium (0.5 TU) and high concentrations of recharge area shows 36 Cl / Cl ratios higher than recent
CFC-12 (5.2 pmol L−1 ), which are again, well above values rain combined with low tritium contents, possibly refer-
in equilibrium with the atmosphere (max 2.3 pmol L−1 ). ring to admixtures of water from the early fission bomb
testing but before thermonuclear devices;
3.3 Discharge area
iii. along the flow path and in the lower aquifer 36 Cl / Cl
Groundwater from the Upper Cenomanian aquifer (Jeri- values are shifted to lower ratios due to admixture of
cho 2) shows similarly low 36 Cl / Cl ratios of 2.04 × 10⁻¹⁴ saline water, with the end-member being brine similar
and 2 TU similar to groundwater upstream in the transition to the Dead Sea probably admixed as pore water from
zone. In groundwaters pumped in Jericho 4 and 5 from the earlier higher sea-levels;
Albian aquifer, 36 Cl / Cl and 3 H contents are even lower: iv. the lower aquifer shows detectable admixtures of young
1.03–1.15 × 10⁻¹⁴ and < 0.6 TU, respectively. These low water only in the vicinity of Jerusalem and Bethlehem,
36 Cl / Cl values might result from admixing brines, which are
demonstrated by tritium and 36 Cl / Cl;
abundant within the rift. It becomes evident in the ground-
water of Ein Feshkha, where interstitial brines (36 Cl / Cl = v. springs in the south (Ein Feshkha and Arugot) are free
1.08 × 10⁻¹⁴ ) hosted in the interstitial space of the Quater- of tritium and show background 36 Cl / Cl ratios indicat-
www.hydrol-earth-syst-sci.net/24/249/2020/ Hydrol. Earth Syst. Sci., 24, 249–267, 2020258 C. Wilske et al.: A multi-environmental tracer study to determine groundwater residence times and recharge
Figure 4. Cross plots of (a) NO3 and simazine in sampled waters, suggesting different sources of both pollutants; the blue and green lines
respectively bracket coloured spaces and indicate the fields in which samples from Upper Cenomanian and Albian aquifer plot are taken; and
(b) acesulfame K and naproxen are indicators for wastewater (treated and untreated) in the sampled waters. Legend for both figures is given
in (b).
ing no recent recharge, although SF6 and CFC values lations between nitrate and simazine, while there is no clear
are high, as recent gas exchange in karst structures may systematic trend observable that is specific for one of the
have reset the SF6 and CFC “clocks”. aquifers nor a specific region. Studying the samples accord-
ing to aquifers suggests that groundwater in the Upper Ceno-
Anthropogenic organic trace substances simazine, NAP and manian aquifer is more strongly influenced by wastewater in-
ACE-K are detectable in trace concentrations in nearly all flow than groundwaters in the Albian aquifer. Groundwater
sampled wells of the upper and lower aquifer (Fig. 4), indi- from Mizpe Jericho 2, with high NO− −1
3 (43 mg L ) values at
cating input younger than 40 years. Combining nitrate con- comparably low simazine concentrations clearly underlines
tents with concentrations of the herbicide simazine in the the contribution of wastewater. Contrastingly, groundwaters
sampled groundwaters allows for distinguishing between the from Jericho 2 and Jerusalem 1 may refer to a higher contri-
origin of NO− 3 , either from domestic wastewater or from bution from agriculture.
agriculture (Fig. 4a). All groundwaters show positive corre-
Hydrol. Earth Syst. Sci., 24, 249–267, 2020 www.hydrol-earth-syst-sci.net/24/249/2020/C. Wilske et al.: A multi-environmental tracer study to determine groundwater residence times and recharge 259
Looking at ACE-K and NAP as pure wastewater indica- detection in groundwater samples from Albian aquifer at the
tors (Fig. 4b), two distinctly opposite trends are distinguish- wells PWA 3, Herodion 4 and Bani Naim 3, indicating no
able. Trend 1 is characterized by very low NAP concentra- freshwater input from the last decades and travel times longer
tions and high concentrations of ACE-K as observable in the than 70 years. A similar figure results from taking these three
wells Jericho 4 (56 ngL˙−1 ) and Jericho 2 (136 ng L−1 ). The wells and forming a N–S transect through the Albian aquifer
opposite trend is found in Ein Feshkha spring D, Jerusalem 1 in the mountain range: their low 36 Cl / Cl ratios, which are
and Samia 2, with high NAP concentrations (170, 168 and well within the range of recent precipitation, decrease from
137 ng L−1 , respectively) at low ACE-K concentrations (< north to south, while chloride remains stable. Since the 3 H
20 ng L−1 ). If one excludes Ein Feshkha, NAP concentra- content is below the limit of detection (< 0.5 TU), the ob-
tions decrease from the recharge area (Jerusalem 1 and served groundwaters are considered to be mainly pre-bomb
Samia 2) to the discharge area (Jericho 2 and 4), most prob- water and hence older than 6–7 decades.
ably due to adsorption onto the aquifer matrix along the flow In the southern part of the study area, survey stations are
path. As for Ein Feshkha D, the NAP contamination here is even rarer. However, the well Al Rehiyya shows very low
comparably high in the recharge area and much larger than 36 Cl / Cl and low 3 H values, indicating either unmixed pre-
the NAP contents in Ein Feshkha C and Enot Zukim. This bomb water or the dilution of recent precipitation with much
suggests a significantly shorter residence time of the con- older water possibly originating from aquifer parts even fur-
taminant in the aquifer, which requires a source much closer ther southwards. The latter is promoted by results from nu-
to the spring, probably a leakage in the treated wastewa- merical flow modelling, which indicate an SW–NE-directed
ter (TWW) pipeline, passing the area just upstream of the upstream flow (Laronne Ben-Itzhak and Gvirtzman, 2005;
spring. The only groundwater without any anthropogenic Gräbe et al., 2013). Negligible concentrations of NAP, ACE-
contamination is the Arugot spring. K and simazine in Arugot spring water, which emerges at
the furthest end of the southern transition zone, show no an-
thropogenic contamination by wastewater. This leads to the
4 Discussion assumption that open karst conduits allow for efficient ex-
change with the atmosphere along the subsurface flow of
The patterns observed for the different measured substances the spring water, resulting in CFC-11 and CFC-12 content
deliver a heterogenous picture of the study area. Starting at in equilibrium with the atmosphere.
the top, a shallow perched aquifer system with short resi- Groundwaters from the Albian (Jericho wells 4 and 5) and
dence times is indicated for the Ein Auja spring based on a from Upper Cenomanian (Jericho 2) in the discharge area
high 36 Cl / Cl ratio (6.35 × 10⁻¹⁴ ), tritium content (2.9 TU) are characterized by 36 Cl / Cl < 2 × 10⁻¹⁴ values. While the
and low mineralization like recent precipitation. former are free of tritium, Jericho 2 shows 2 TU, indicat-
In the recharge area of the Cenomanian and Albian ing at least a fraction of younger water. Since the well Jeri-
aquifers, clear indications for a contribution of recharge cho 2 is drilled directly at the mouth of the Qilt Valley, we
enriched with 36 Cl from nuclear-bomb tests is observable assume that the young water fraction may reach the well
in freshwater wells (Cl content260 C. Wilske et al.: A multi-environmental tracer study to determine groundwater residence times and recharge
time, lake level was at −390 m m.s.l. and higher (Hassan
and Klein, 2002). At the time, Dead Sea brine infiltrated into
the shallow lake bed, where nowadays the observed springs
emerge, at an elevation of −392 to −395 m m.s.l. However,
the Ein Feshkha springs C and D and Enot Zukim receive
young water fractions, since NAP and ACE-K contents in
the former are as high as in groundwater in the recharge zone
(Jerusalem 1) and in the latter at least enhanced.
The next section will exemplify a more detailed mod-
elling of mean residence times with transient tracers where
the data allow for this approach. This was possible only on
two wells. The wells of the Albian aquifer in the transition
zone are not interpreted using LPM due to contamination
with CFCs (e.g. Al Azaria 3 and Table 1) or very low con-
centrations of anthropogenic gases (e.g. Bani Naim 3). If
the measured concentrations of the anthropogenic trace gases
CFCs and SF6 are much higher than expected from the sol-
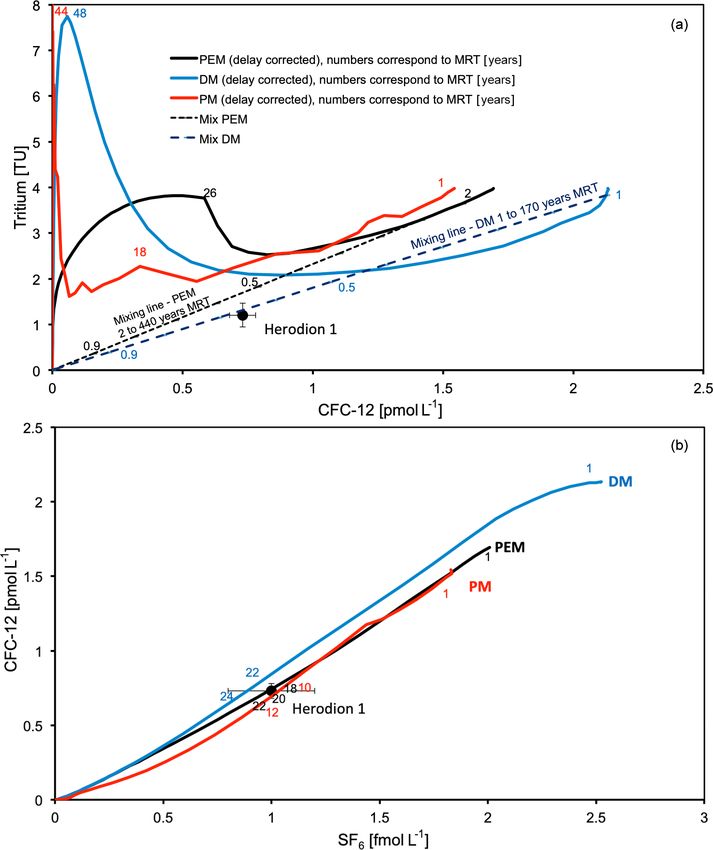
Figure 5. In a CFC-12 vs. time plot, a piston flow model with an
ubility equilibrium with the atmosphere, this is regarded as
MRT of 10 years obtained from the water-bound tracer tritium and
contamination (e.g. Mizpe Jericho 2). The tritium concentra- 36 Cl / Cl fits the CFC-12 measurements with a gas delay of 17 years
tions of 1.5 and 2 TU in Mizpe Jericho 2 and Jericho 2, re- for Samia 2 and 30 years for Herodion 1.
spectively, indicate a reasonable fraction of recent rain. Due
to the continuous outflow of the springs along the coastline
and chemical mixing patterns of the spring water, it is as- sistent data set for all tracers (Table 1). Earlier interpreta-
sumed that there is also a connection to the water resources tion of groundwater hydraulics based on groundwater level
of the Lower Cretaceous aquifer, which could provide wa- measurements determined a very fast transfer velocity of the
ter with longer residence times. All springs in the discharge water phase through karst holes to the groundwater table
area (e.g. Ein Feshkha) have values less than 0.5 TU and a (Jabreen et al., 2018). LPM was therefore done in several
36 Cl / Cl value of < 1.5 × 10⁻¹⁴ . However, the organic trac-
steps. First a mean residence time in agreement with mea-
ers ACE-K, simazine and NAP are also detectable also in sured values for tritium and the bomb spike of 36 Cl / Cl val-
these springs. Their values in Ein Feshkha are between 5 to ues was derived. Then a delay for the gas tracers CFCs and
30 times above the detection limit (Table 1 and Sect. 2.2). SF6 was derived assuming a simple piston flow transport to
Since the input function of the organic tracers, cannot be describe the residence time of these tracers in the unsatu-
quantified, the fraction of young water, representing that con- rated zone. Once the delay created an agreement between
centration cannot be calculated. This discrepancy (no tritium the water-bound tracer tritium and 36 Cl / Cl values with the
and no anthropogenic 36 Cl but including organic tracers) can gas tracers CFC-11, CFC-12, CFC-113 and SF6 , the mean
be understood by quantifying the detection limit of “young residence time in the saturated zone was investigated using
water” that tritium allows: recent rain in the area has 4 TU, so the PM, DM and PEM to describe flow in the saturated zone.
a value of < 0.5 TU is equivalent to less than 12 % of recent From the MRT in the saturated zone, groundwater recharge
rain. This implies the young end-member in the mixture must was estimated in a final step and compared with results from
have a concentration of ACE-K, simazine and NAP > 10 the CMB method and earlier numerical groundwater models.
times higher than that measured in the groundwater samples. Results for tritium and 36 Cl / Cl values fit to MRT of about
A more precise quantification of the young water fraction in 10 years in the saturated zone using the PM, the dispersion
these springs is only possible with either a lower detection model results for a 20-year MRT and for the partial exponen-
limit for tritium (e.g. determination of 3 H via ingrowth with tial model 16- and 20-year MRTs are estimated (Table 4).
a detection limit of 0.005 TU) (Bayer et al., 1989; Beyerle et These estimated MRT values of the water-bound tracers then
al., 2000; Sültenfuß et al., 2009) or a precise quantification allowed for determining the gas delay in the unsaturated
of the input of ACE-K, simazine and NAP. Both are beyond zone. For every applied model (PM, PEM and DM) the gas
the scope of the present study. delay is estimated using the calculated model curve of the
water-bound tracers and using the delay as a parameter to
4.1 Lumped parameter modelling: delay of gas tracer fit the gas tracer measurements of Samia 2 and Herodion 1.
in the unsaturated zone This resulted in specific gas delays for every concentration
of the CFCs and SF6 , exemplified for CFC-12 in Fig. 5 and
The detailed lumped parameter modelling of tritium, provided for all gas tracers in Table 3.
36 Cl / Cl and the gas tracers was performed only for the wells
Samia 2 and Herodion 1 since only for these there is a con-
Hydrol. Earth Syst. Sci., 24, 249–267, 2020 www.hydrol-earth-syst-sci.net/24/249/2020/C. Wilske et al.: A multi-environmental tracer study to determine groundwater residence times and recharge 261
Table 3. Summary of gas delay in the unsaturated zone for each gas tracer and the different models. PM: piston flow model; DM: dispersion
model; PEM: partial exponential model. For the parameters of the PEM, see Table 2.
Model PM DM PEM
parameters Samia 2 Herodion 1 Samia 2 Herodion 1 Samia 2 Herodion 1
CFC-11 24 28 14 18 20 25
CFC-12 17 30 14 20 20 28
CFC-113 23 22 9 14 17 22
SF6 8 8 0 0 7 6
Table 4. Summary of modelled MRTs of Samia 2 and Herodion 1 extracted from different tracer combinations. PM: piston flow model; DM:
dispersion model; PEM: partial exponential model. ∗ Estimated fit.
Sampled well Samia 2 Herodion 1
Model PEM DM PM PEM DM PM
CFC-11 vs. CFC-113 31–44 20–23 10–14 17–22 no fit 11–13
CFC-11 vs. SF6 31–44 21–25 9–13 21–23 17–22 10–12
CFC-12 vs. SF6 38–46 21–23 10–13 18–20 22–24 10–11
36 Cl / Cl vs. SF 36–37 20–22 9–15∗ 17–18 19–20 9–15
6
36 Cl / Cl vs. CFC-113 36–38 21–22 11–15∗ 16–28 no fit 9–18
36 Cl / Cl vs. CFC-12 36–38 21–23 11–14∗ 17–18 20–21 11–12
Mixing ratios of 3 : 7 to 4 : 6
36 Cl / Cl vs. Tritium 36–38∗ 20–22 9–29
(1-year MRT and 170-year MRT)
Mixing ratios of 3 : 7 to 4 : 6
Tritium vs. SF6 26–44 18–23 10–15
(1-year MRT and 170-year MRT)
Mixing ratios of 3 : 7 to 4 : 6
Tritium vs. CFC-12 38–45∗ 21–23 10–14
(1-year MRT and 170-year MRT)
Estimates for every model result in different gas delays 4.2 Lumped parameter modelling: mean residence
are related to the MRT of water-bound tracers in the wells times in the saturated zone
Samia 2 and Herodion 1 (Table 3). The delays of the CFCs
are comparable to each other and differ from 14 to 24 years
for Samia 2 (Fig. 5) and from 14 to 30 years for Herodion 1 In the next step, the determined gas delays of the gas trac-
over all calculated models. The gas delay in Samia 2 is lower ers (Table 3) in the unsaturated zone were used to estimate
than in Herodion 1, which is reasonable regarding the thicker the MRT of the water-bound tracers and the gas tracers in
unsaturated zone in Herodion 1 (Table 2). Ideally the trans- the saturated zone. Only the gas delay allowed for a fit to the
port of gas tracers in the subsurface would result in similar measurement combination of the gas tracer concentrations
delays for all gas tracers (Cook and Solomon, 1995). The and the water tracer results of Samia 2 in the time range of
delay determined for SF6 was significantly lower than for 10 to 15 years for the MRT for the piston flow model, 17 to
the CFCs (Table 3), indicating higher concentrations of SF6 28 years for the MRT for the dispersion model and 26 to
as compared to the expectation from the CFC model results. 46 years for the partial exponential model (Table 4). Com-
This could be a result of biological degradation of the CFCs paring the different model approaches, estimates of the satu-
in the upper part of the unsaturated karst zone or from consid- rated MRT systematically increase in the sequence of PM to
erable excess air, which influences SF6 much more than the DM to PEM in both wells, which is a result of the increasing
CFCs. A decision between these two processes is possible amount of dispersion and mixing in these models.
determining excess air independently measuring the concen- In contrast to Samia 2, it was not possible to fit the re-
trations of all noble gases, which were not available in the sults of Herodion 1 without an admixture of tracer-free old
present study. water. With and without delay the lumped parameter curves
do not fit the measurements of the lower tritium concentra-
www.hydrol-earth-syst-sci.net/24/249/2020/ Hydrol. Earth Syst. Sci., 24, 249–267, 2020You can also read