Integrated energy-water-land nexus planning to guide national policy: an example from Uruguay - IOPscience
←
→
Page content transcription
If your browser does not render page correctly, please read the page content below
Environmental Research Letters

LETTER • OPEN ACCESS

Integrated energy-water-land nexus planning to guide national policy: an
example from Uruguay
To cite this article: Zarrar Khan et al 2020 Environ. Res. Lett. 15 094014

View the article online for updates and enhancements.

                                 This content was downloaded from IP address 176.9.8.24 on 26/09/2020 at 04:35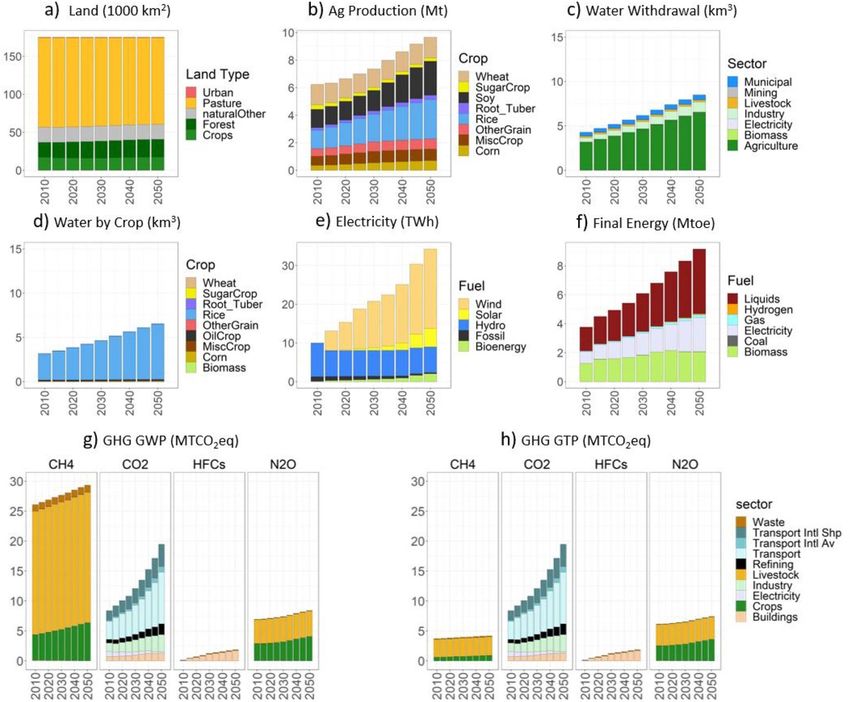
Environ. Res. Lett. 15 (2020) 094014 https://doi.org/10.1088/1748-9326/ab9389
Environmental Research Letters
LETTER
Integrated energy-water-land nexus planning to guide national
OPEN ACCESS
policy: an example from Uruguay
RECEIVED
14 February 2020 Zarrar Khan1,7, Thomas B Wild1,2, Maria Eugenia Silva Carrazzone3, Rossana Gaudioso3,
REVISED María Pía Mascari4, Fabiana Bianchi3, Federico Weinstein3, Federico Pérez5, William Pérez5,
6 May 2020
Fernando Miralles-Wilhelm2, Leon Clarke1, Mohamad Hejazi1, Chris R Vernon1, Page Kyle1,
ACCEPTED FOR PUBLICATION
15 May 2020 Jae Edmonds1 and Raul Muñoz Castillo6
1
PUBLISHED Joint Global Change Research institute, Pacific Northwest National Laboratory (PNNL), College Park, MD 20740,
18 August 2020 United States of America
2
Earth System Science Interdisciplinary Center (ESSIC), University of Maryland, College Park, MD 20740, United States of America
3
Original content from
National Secretary of the Environment, Water and Climate Change, Presidencia República Oriental, Uruguay
4
this work may be used National Planning Directorate, Planning and Budget Office, Presidencia República Oriental, Uruguay
5
under the terms of the Universidad de la Republica, Montevideo, Uruguay
Creative Commons 6
Inter-American Development Bank (IDB), Washington DC, United States of America
Attribution 4.0 licence. 7
Author to whom any correspondence should be addressed.
Any further distribution
of this work must E-mail: zarrar.khan@pnnl.gov
maintain attribution to
the author(s) and the title Keywords: energy, water, land, integrated, nexus
of the work, journal
Supplementary material for this article is available online
citation and DOI.
Abstract
Despite broad consensus on the benefits of a nexus approach to multi-sector planning, actual
implementation in government and other decision-making institutions is still rare. This study
presents an approach to conducting integrated energy-water-land (EWL) planning, using Uruguay
as an example. This stakeholder-driven study focuses on assessing the EWL nexus implications of
actual planned policies aimed at strengthening three of Uruguay’s key exports (beef, soy, and rice),
which account for more than 40% of total national export revenue. Five scenarios are analyzed in
the study: a reference scenario, a climate impacts scenario, and three policy scenarios. The three
policy scenarios include measures such as increasing the intensity of beef production while
simultaneously decreasing emissions, increasing irrigated soybean production, and improving rice
yields. This study supplements previous sector-specific planning efforts in Uruguay by conducting
the first stakeholder-driven integrated multi-sector assessment of planned policies in Uruguay
using a suite of integrated modeling tools. Key insights from the study are: as compared to a
reference scenario, improving beef productivity could lead to cropland expansion (+30%) and
significant indirect increases in water requirements (+20%); improving rice yields could lead to
increases in total emissions (+3%), which may partially offset emissions reductions from other
policies; expanding irrigated soy could have the least EWL impacts amongst the policies studied;
and climate-driven changes could have significantly less impact on EWL systems as compared to
human actions. The generalizable insights derived from this analysis are readily applicable to other
countries facing similar multi-sector planning challenges. In particular, the study’s results reinforce
the fact that policies often have multi-sector consequences, and thus policies can impact one
another’s efficacy. Thus, policy design and implementation can benefit from coordination across
sectors and decision-making institutions.
1. Introduction population is concentrated in urban areas, and more
than half of the population lives in the capital city
Uruguay (figure 1(a)) is one of the smallest countries of Montevideo [1] (figure 1(b)). Uruguay’s relatively
in Latin America, both by population (3.5 million in small, export-oriented economy is tightly connec-
2018) and land area (176 000 km2 ). About 96% of the ted to international markets. This strong dependency
© 2020 The Author(s). Published by IOP Publishing Ltd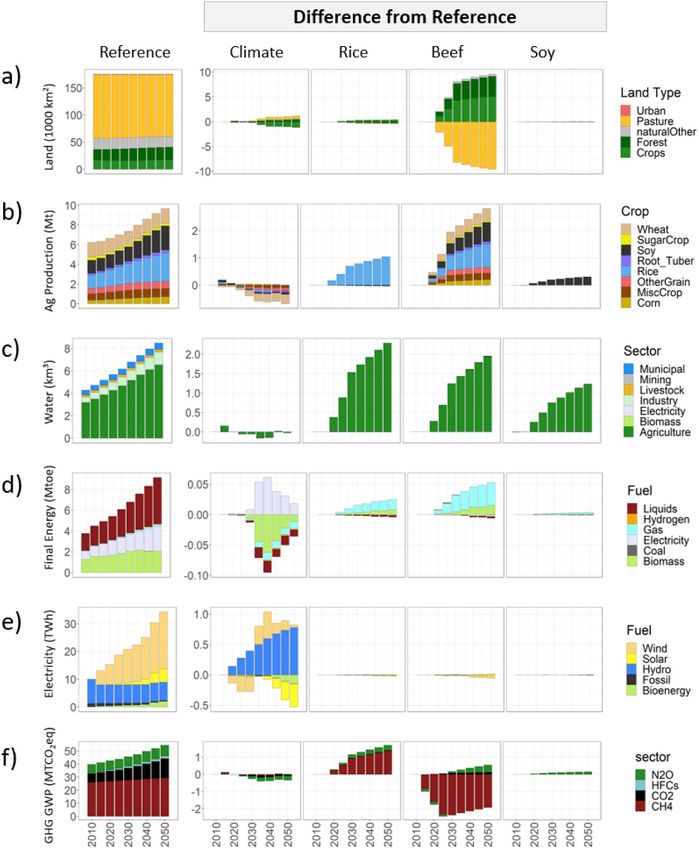
Environ. Res. Lett. 15 (2020) 094014                                                                   Z Khan et al

became strikingly clear when the economic crisis of         crop mixes in response to global food, agriculture,
2002 in neighboring Argentina reduced Uruguay’s             and bioenergy markets; and subsequent impacts on
GDP by 10.8%, exchange rate by 90%, and aver-               forest, pasture, and other land-use changes [18–28].
age household income by 20% relative to 1998 levels         Numerous studies have holistically analyzed EWL
[2]. In the nearly two decades following this crisis,       interactions, from regional to global scales [29–36].
Uruguay has become a regional economic power with           Together these studies highlight several key issues
the highest per capita Gross National Income in Latin       that we seek to address in this analysis. Land has
America [3] as a result of prudent macroeconomic            been pointed out as a critical factor that is often
policies in combination with a diversification of its       ignored in nexus analysis, despite the land sector’s
markets. Uruguay reduced its regional trade with            critical interconnections with water and energy, as
other Latin American countries from 45% of total            well as the rapid degradation of land resources cur-
trade to 26% between 2000 and 2017, and increased           rently taking place in many regions [32]. Capturing
trade with China and Europe to make up the differ-          global dynamics in international commodity markets
ence [4, 5].                                                is also highlighted as essential to better understand
     However, while it expanded its markets,                socioeconomically-driven EWL resource demands, as
Uruguay’s mix of export products has become                 well as the transfer of interconnected virtual EWL
increasingly concentrated in a few key products over        resources [29, 33, 37]. Some studies call for the need
the years [6, 7]. From 2000 to 2017, beef-related           to address EWL nexus issues at decision-relevant
exports increased from 15% of total export revenue          scales, which can require both co-developing insights
to greater than 25%, soybean exports increased from         with stakeholders and flexibly conducting analysis
0.06% to 7%, and rice exports have remained at about        at variable spatial resolution [35, 38]. Finally, sev-
5% (figure 1(c)). Together these three products (beef,      eral studies project that climate change mitigation
soybeans, and rice) accounted for about 40% of all          strategies aimed at energy decarbonization may result
export revenue in 2017. At the same time, all three         in unexpected impacts on water and land that require
products are heavily dependent on the availability of       further evaluation [31, 39, 40]. Our study addresses
accessible and affordable water and land resources,         these key elements by analyzing the implications of
together accounting for more than 75% of the coun-          relevant national policies across multiple economic
try’s land use [8], water use [9], and greenhouse           sectors (including land) and spatial scales (from sub-
gas (GHG) emissions [10, 11]. On a national scale           regional to national), while at the same time captur-
Uruguay has more than sufficient water resources            ing global dynamics.
(170 km3 yr−1 ) to meet demands (4.5 km3 yr−1 in                The LAC region in particular bears further invest-
2015) [9, 12], with a large reservoir storage capacity of   igation with respect to the factors described above
17.3 km3 concentrated in four main reservoirs [13].         because it faces strong EWL nexus challenges as a
However, the uneven spatial distribution of water [9]       result of its abundant but often unevenly distrib-
and its quality [14] pose infrastructure planning and       uted resources, strong connection to the global eco-
management challenges. Thus far, Uruguay has not            nomy through agricultural trade, and potential for
faced serious challenges meeting energy demands.            climate change impacts on EWL systems. Willaarts
Hydropower generation from Uruguay’s large mul-             et al (2014) [41] describe the links between water
tipurpose reservoirs have traditionally accounted for       and food security in LAC, finding that globaliza-
the largest share (>75%) of electricity generation          tion and expanding international trade could greatly
[15]. In recent years Uruguay has made strong efforts       intensify water and food security challenges, which
to increase non-hydropower renewables in its electri-       must be addressed by rapidly evolving governance
city mix. With 30% of electricity generated from wind       of the region’s complex, inter-connected natural and
in 2017, Uruguay is now ranked along with Denmark           human capital. Muñoz-Castillo et al (2019) [42]
as a world leader in wind energy generation. Land           investigate broader EWL and climate impacts in the
in Uruguay is dominated by natural pastures, which          LAC region and find that water-scarcity will evolve
cater to Uruguay’s large grass-fed livestock sector and     unevenly across LAC, and is heavily driven by water
account for about 70% of total land [8]. Agriculture,       withdrawal pathways, which are in turn determined
forests, and other non-pasture natural land occupy          by shifting socio-economic, agricultural, and energy
about 10% each of total land, with urban land-use           trends. Santos Da Silva et al (2019) [36] evaluate the
accounting for less than 1%.                                EWL nexus implications of the Paris climate accord
     Although traditionally managed independently,          pledges in Argentina, Colombia, Brazil, and Mexico,
there is a growing consensus on the benefits of hol-        and point to areas of concern such as the increased
istically planning EWL resources together in order          pressure that decarbonization efforts will place on
to better account for linkages and trade-offs between       land and water resources for biomass and electricity
sectors that evolve in response to a range of possible      production. This paper expands on these studies and
socio-economic, climatic, and technological drivers         explores EWL dynamics in Uruguay’s key export sec-
[16, 17]. These linkages include water competition          tors, which drive its economy, while at the same time
for residential, agricultural, and energy use; changing     weighing the relative implications of climate change

                                               2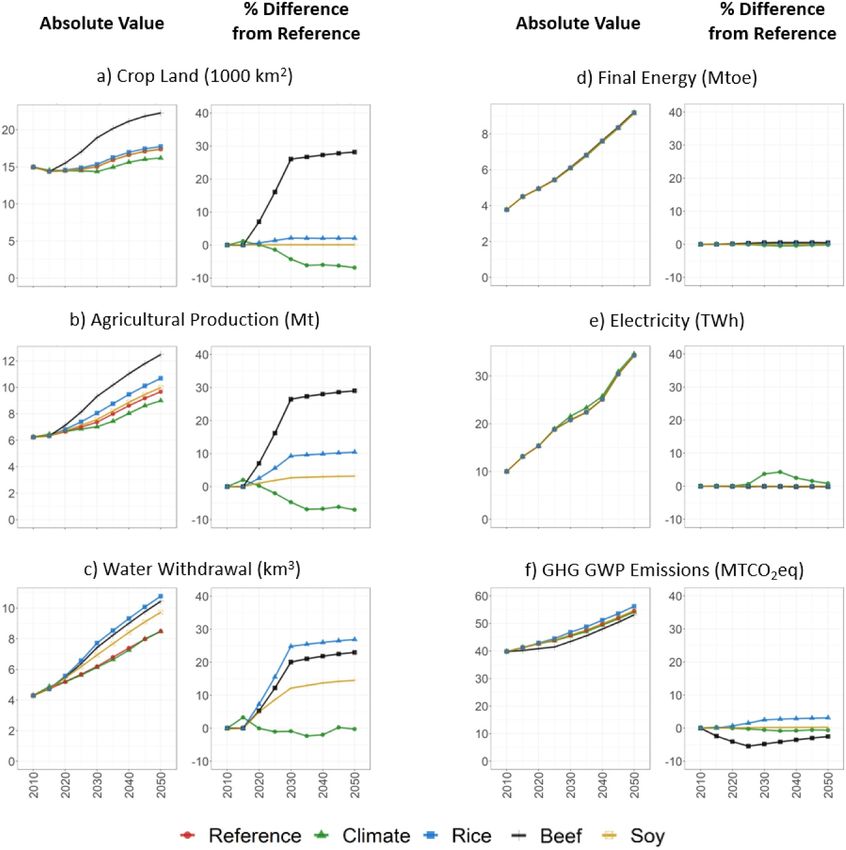
Environ. Res. Lett. 15 (2020) 094014                                                                     Z Khan et al

impacts versus socio-economic drivers, all in a local      stakeholders representing multiple sectors, we
governance context led by in-country stakeholders.         designed several representative scenarios. Each scen-
     Building on all these previous efforts in LAC and     ario was investigated using an integrated assessment
elsewhere, our study is the first we are aware of that     modeling (IAM) framework comprised of a suite of
analyzes EWL nexus interactions and implications in        tools, with a global IAM at its core, and a constel-
Uruguay. We believe this study can serve as a valu-        lation of interconnected downscaling models that
able example, not just in LAC but in other regions         interact with the IAM to capture finer-resolution
globally, for how to conduct a stakeholder-driven          EWL dynamics.
study of the multi-scale EWL nexus implications of             A conceptual schematic of the modeling frame-
policies and investments being planned in a particu-       work used in this study is shown in figure 2.
lar region, while also embedding the analysis of that      The Global Change Analysis Model (GCAM) [47]
region within the context of broader (i.e. global) EWL     is a dynamic-recursive IAM that combines rep-
dynamics. Our stakeholder-driven study begins with         resentations and interactions of the global eco-
a baseline model that captures national and global         nomy, energy, climate, agriculture, water, and land
EWL dynamics, but supplements these global data            use systems. GCAM has been used extensively for
sets with local data, models, and sector-specific expert   stakeholder-driven exploration of technology invest-
knowledge in evaluating the implications of specific       ments, national and international policy approaches,
policies [38].                                             and the implications of changes in key driving forces
     Given Uruguay’s small economy and relat-              such as technology and economic growth [48–53].
ively concentrated export mix, the indirect multi-         The standard version of GCAM represents the global
sector feedbacks that occur through shared EWL             economy by disaggregating the world into 32 geo-
resources cannot be ignored in national plans seek-        political energy-economy regions, 235 river basins,
ing to strengthen Uruguay’s position in global mar-        and 384 land-use regions. In this particular study,
kets. Additionally, Uruguay is well-positioned to          Uruguay is broken out as a distinct (i.e. 33rd) energy-
undertake integrated multi-sector planning precisely       economy region. GCAM operates as a market equi-
because of the country’s relatively small population       librium model with representative agents from vari-
coupled with its coordinated government structure          ous aggregated representations of economic sectors
[43, 44]. Along with traditional sector-specific min-      making resource allocation decisions based on relev-
istries, an active overarching planning department         ant information such as prices and elasticities. Sec-
(Oficina de Planeamiento y Presupuesto [45]) is            tors interact via regional and global markets (e.g. elec-
capable of facilitating the implementation of cross-       tricity, agricultural goods, land), and GCAM iterat-
sector nexus insights across its various sectors. In       ively searches for equilibrium between supply and
this stakeholder-driven study, we evaluate policies        demand across the markets for all goods and services.
in the livestock, soybean, and rice sectors from an        The model is calibrated based on historical EWL sys-
integrated perspective, considering the implications       tem behavior using a discrete choice formulation that
of long-term global and regional socio-economic,           takes into account both price information and pref-
climatic, water, energy and land related changes. We       erences. This calibrated model is then carried into
seek to answer the following three research ques-          the future. The discrete choice methodology limits
tions: (1) To what degree are the energy, water, and       winner-take-all behavior (e.g. cost minimization in
land systems in Uruguay interconnected? (2) How            energy, or profit maximization in land management).
do existing policy plans made in one of these sectors      Further details are available in the extensive online
impact the availability and consumption of resources       documentation for GCAM [54].
in the other sectors? (3) How do these human-driven            A constellation of other tools designed to inter-
impacts compare to changes driven by the climate?          act with GCAM provide insight into EWL dynam-
     The remainder of this paper is organized as fol-      ics at more detailed spatiotemporal resolution. We
lows. Section 2 describes the novel methodology            use a global hydrologic model (Xanthos) and a grid-
used to analyze policies related to livestock, soybean,    ded crop model (PDSSAT) to provide information
and rice production. Section 3 presents model out-         to GCAM, while we use downscaling tools (Tethys
puts together with an analysis of the results. Sec-        and Demeter) to downscale GCAM EWL dynam-
tion 4 provides a summary of the paper, addresses          ics for visualization at finer spatiotemporal resolu-
the study’s limitations and lessons for other planning     tion. The Xanthos global hydrologic model [55, 56]
contexts, and describes planned future extensions of       supplies GCAM with information regarding water
the work.                                                  availability and hydropower production at the scale
                                                           of 235 large river basins globally. Xanthos simulates
2. Methodology                                             the impacts of climate change by receiving temper-
                                                           ature, precipitation, and other climate inputs from
Over the course of two years, in collaboration             Global Climate Models (GCMs). Xanthos is a com-
with Uruguay’s National Planning Directorate,              putationally efficient hydrologic emulator that is cal-
the Inter-American Development Bank, and local             ibrated to perform similarly to the physically-based

                                              3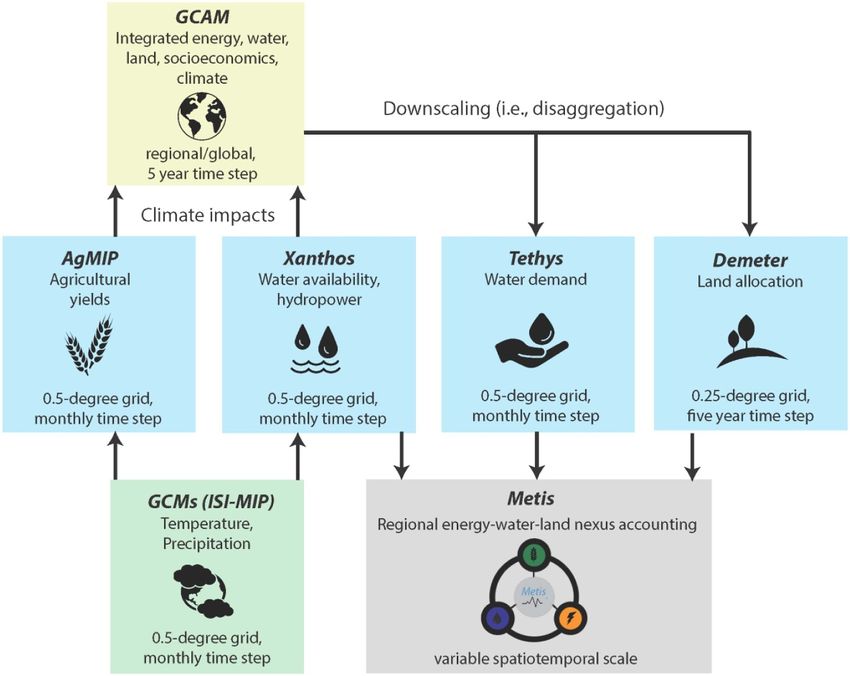
Environ. Res. Lett. 15 (2020) 094014                                                                                      Z Khan et al

   Figure 1. (a) Location of Uruguay in Latin America, (b) Population density in Uruguay in 2015 [46], and (c) Percentage of
   Uruguay’s total export revenue in 2017 by selected sectors (Data from [5]).

       Figure 2. Modeling framework used to analyze energy-water-land dynamics at relevant spatiotemporal scales in Uruguay.

Variable Infiltration Capacity (VIC) model globally                 before feeding these exogenous values into GCAM at
[57]. The gridded crop model PDSSAT [58], one of                    5-year intervals. GCAM in turn applies these rates
seven crop models that participated in the Agricul-                 to crop yields, which changes the relative profit rates
tural Model Inter-comparison Project (AGMIP) [59],                  across each of GCAM’s 14 crops and 235 global
is used to supply GCAM with estimates of changes                    basins. Uruguay is covered by portions of two of
in global crop yields in response to the same cli-                  these 235 large river basins. Across these climate
mate drivers (e.g. temperature and precipitation) to                impacts categories (runoff, hydropower, and agricul-
which Xanthos is exposed. PDSSAT produces annual                    tural yields), we evaluate impacts on a global scale,
changes in agricultural productivity (% change rel-                 not just in Uruguay. This captures important global
ative to the previous time step), which we smooth                   dynamics. For example, reduced availability of water

                                                      4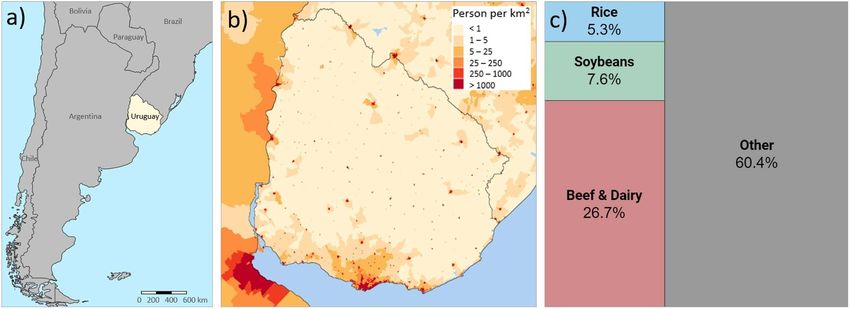
Environ. Res. Lett. 15 (2020) 094014                                                                             Z Khan et al

                                          Table 1. Summary of scenarios used in study.

Scenario            Description

Reference           Uses an agreed upon set of assumptions for key drivers such as population and GDP growth in
                    Uruguay. For the rest of the world, the scenario is roughly consistent with the Shared Socioeconomic
                    Pathway 2 (SSP2). The SSP2 scenario represents costs, prices, elasticities and preferences in a “middle-
                    of-the-road” narrative in which social, economic, and technological trends do not shift markedly from
                    historical patterns [64–66]. The Climate and policy scenarios below employ the same basic socioeco-
                    nomic assumptions built into the Reference scenario
Climate             Evaluates the impacts of climate change on three key parameters: hydro-electric power production,
                    agricultural yields, and water availability (i.e. runoff) for five bias-corrected Global Climate Models
                    (GCMs) from the Inter-Sectoral Impacts Model Intercomparison Project (ISI-MIP) [67] and four
                    Representative Concentration Pathways (RCP) [68]. This range of models and climate forcing scen-
                    arios are used to explore uncertainty surrounding future climate conditions. From among this range
                    of Climate scenarios, we selected one to be used in the Climate scenario, which consists of the GFDL
                    GCM run with the RCP8.5 climate forcing trajectory. This results in the following outcomes, which
                    are fed into GCAM:
                     • Hydropower increases by 20% by 2050 from the Reference scenario
                     • Runoff increases by 3% by 2050 from the Reference scenario
                     • Irrigated Soy yield increases by about 4% by 2050 from the Reference scenario within Uruguay,
                       though significant changes also take place in global markets
                     • Irrigated Rice yield fluctuates between ± 4% by 2050 from the Reference scenario within Uruguay,
                       though significant changes also take place in global markets

Beef                Increases the productivity by weight of beef production, and decreases the CH4 and N2 O emissions
                    intensity of beef production in line with the National Adaptation Plan for Agriculture (NAP-Ag) [8,
                    69] and the Nationally Determined Contributions (NDCs) of emissions outlined in Uruguay’s com-
                    mitment as part of the Paris Agreement [70].
                     • Increase production (kg beef/kg feed) by 40% by 2030 relative to 2015 values, then hold this pro-
                       duction efficiency constant through 2050
                     • Decrease emission intensity (emissions/kg) of CH4 by 40% by 2030 relative to 1990 values, then
                       hold this production efficiency constant through 2050
                     • Decrease emission intensity (emissions/kg) of N2 O by 40% by 2030 relative to 1990 values, then
                       this production efficiency hold constant through 2050

Soy                 Increases irrigated area of soybean crops to gain higher yields in line with the National Plan to
                    Improve Irrigated Agriculture [71, 72].
                     • Increases share of irrigated soybean area as compared to rainfed soybean area, so that irrigated
                       soybean area is 600% of the 2015 values in 2030. Shares of irrigated vs rainfed soybean area are
                       then held constant through 2050

Rice                Improves the yield of rice based on recommended best-practices from Uruguay’s Ministry of Agricul-
                    ture to close the national rice yield gap [73, 74].
                     • Adjusts annual rice yield growth to increase yields (tons/ha) by 20% by 2030 relative to 2015 values,
                       and then maintain reference growth in yields through 2050

or production of crops in other parts of the world               low scarcity (0.1 ≤ WSI < 0.2), moderate scarcity
can affect Uruguay through shifting agricultural trade           (0.2 ≤ WSI < 0.4), and severe scarcity (WSI ≥ 0.4).
patterns.                                                            A summary of the five scenarios chosen for this
    Tethys [60] is used to downscale GCAM water                  study is provided in table 1, with further descrip-
demands (onto a 0.5-degree grid globally) using                  tions of each provided in SI1. The five scenarios
gridded irrigated area and population datasets. The              include: a reference scenario (Reference), a climate
Demeter model [61] is used to downscale GCAM                     impacts scenario (Climate), and three policy scen-
land use (onto a 0.25-degree grid globally) using                arios (Beef, Rice, and Soy). The Beef policy seeks to
Demeter’s base MODIS global gridded landcover data               increase the intensity of beef production while sim-
sets. Downscaled gridded data is re-aggregated to                ultaneously decreasing emissions. The Soy and Rice
relevant spatial boundaries using the Metis model                policies seek to increase irrigated soybean produc-
[38]. We employ a gridded Water Scarcity Index                   tion, and improve rice yields, respectively. The policy
(WSI) in this study that is calculated as the ratio              scenarios we explore in this study are ‘stylized’, in
of total water withdrawals (produced by Tethys) to               that they provide simplified but strategy-relevant rep-
total water supply (produced by Xanthos), divided                resentations of real policies. Real policies often con-
into four categories [62, 63]: no scarcity (WSI < 0.1),          sist of numerous components, some of which can

                                                   5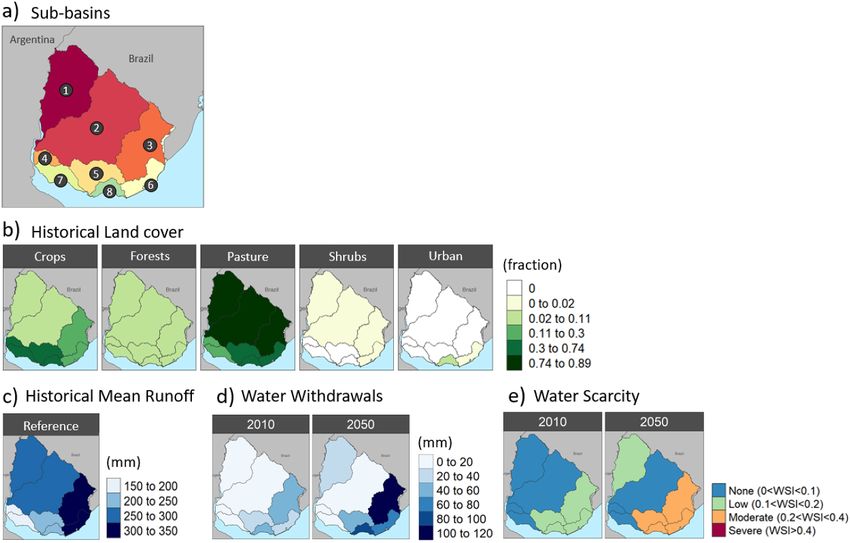
Environ. Res. Lett. 15 (2020) 094014                                                                                   Z Khan et al

   Figure 3. Nexus overview of the Reference scenario. (a) Land-use (1000 km2 ) (b) Agricultural Production (Mt) (c) Water
   withdrawals (km3 ) (d) Water use by Crop (km3 ) (e) Electricity generation (TWh) (f) Final Energy (Mtoe) (g) GHG emissions
   GWP (MTCO2 eq) by gas and sector (h) GHG emissions GTP (MTCO2 eq) by gas and sector (HFCs = Hydrofluorocarbons).

be difficult to account for in the modeling frame-                 SI2. Pasture land remains the largest land-use type
work described earlier. For example, in Uruguay this               in Uruguay through 2050 to support the country’s
includes rotating crops to improve soil management,                large livestock and beef industry (figure 3(a)). Crops
optimizing irrigation and drainage patterns, improv-               occupy about 10% of national land area (figure 3(a)),
ing seed cultivation, and protecting harvested grain.              with a slight increase through 2050 in response to
Through an extensive and iterative process, local                  agricultural production growth. Agricultural produc-
stakeholders involved in the design and implement-                 tion increases by 40% by 2050 (relative to 2015) as
ation of the policies explored in this study guided                a result of increased cropland area and crop yields.
the selection of: GCAM model parameters to imple-                  Wheat, rice, and soy account for the largest crop
ment the stylized policy representations, GCAM out-                shares by production and land area in 2010, with rice
put metrics used to evaluate policy outcomes across                and soy showing the largest increases in production,
multiple sectors, and the spatial scale of analysis. The           almost doubling by 2050 (relative to 2015), in line
policies explored here are closely tied to the water sec-          with national plans and projections [8, 69, 71] (fig-
tor, so hydrological units (i.e. river sub-basins) were            ure 3(b)). The evolution of the agricultural system has
selected as a common spatial analysis unit.                        important implications for the water sector.
                                                                       The agricultural sector is currently the largest
3. Results & discussion                                            user of water (75%) (figure 3(c)), for purposes of
                                                                   irrigation, demanding about 3.2 km3 of total water
3.1. Reference scenario                                            (4.3 km3 ) in 2010, and more than doubling that usage
A nexus overview of projected developments across                  by 2050 (6.5 km3 of the total 8.5 km3 ). Figure 3(d)
EWL sectors in the Reference scenario is provided                  shows the distribution of agricultural water with-
in figure 3. Uruguay sees considerable growth across               drawals (i.e. the green bars in figure 3(c)) by crop.
the EWL sectors in response to population and GDP                  Rice accounts for almost all of the water withdrawals
growth. Details regarding the baseline socioeconomic               in the agricultural sector (figure 3(d)), with its share
drivers that set the scale of economic activity across             of total water withdrawals steadily increasing through
all scenarios (including the Reference) is provided in             2050. This underscores the potential value of policies

                                                     6
Environ. Res. Lett. 15 (2020) 094014 Z Khan et al
Figure 4. Sub-regional analysis of Reference scenario. (a) Sub-basins in Uruguay (1. Uruguay alta 2. Negro 3. Merín 4. Uruguay
Baja 5. Santa Lucía 6. Atlántico 7. Río de la Plata Oeste 8. Río de la Plata Este) (b) Historical land-cover (2010) (c) Mean historical
runoff depth (mm) (2010) (d) Total water withdrawal depth (mm) in 2010 and 2050, and (e) Water scarcity (ratio of withdrawals
to runoff) in 2010 and 2050.
focused on increasing rice yields without increased Total GHG emissions in Uruguay in 2015 were
water requirements (table 1). about 42 Mega Tons of CO2 equivalent (MTCO2 eq.),
In the energy sector (figure 3(f)), total final which amounts to < 0.07% of global emissions and
energy demand is projected to more than double 0.8% of Latin American emissions [10, 11] when
from 2010 to 2050. The fuel mix shifts toward more considering the 100 year Global Warming Potential
electricity and oil, and less biomass. (From 2010 (GWP). (Total GHG emissions are only about 20
to 2050, the share (%) of electricity, biomass, and MTCO2 eq. when considering the Global Temperat-
oil in final energy shift from 22% to 26%, 42% to ure change Potential (GTP). Further details on the
49%, and 36% to 22%, respectively). This shifting GWP and GTP metrics are provided in SI3)). The
energy fuel mix has limited implications for total majority of emissions resulted from CH4 emissions
water withdrawals, particularly given the electricity from livestock, as seen in figure 3(g). CO2 emissions
mix is dominated by non-water intensive renewables come mostly from the transport sector and show
(e.g. wind power). Electricity increases threefold from considerable growth, doubling from 2010 to 2050 in
2015 to 2050. Hydropower currently accounts for the response to transportation demand growth.
majority of electricity generation (figure 3(e)), with Our integrated modeling framework allows us
Uruguay already using 85% of total national hydro- to investigate the distribution of water and land
power potential, the highest national usage of hydro- resources at flexible and stakeholder-relevant spatial
power capacity in Latin America [75]. With lim- scales, in this case by river sub-basins (figure 4(a))
ited growth potential in hydropower, planned wind given the focus on agriculture and water resources.
energy expansion is projected to supply the majority Figure 4 displays the spatial distribution of land and
of new electricity demand (60% in 2050). This expan- water availability and usage in Uruguay for the Refer-
sion will reduce the percentage of fossil fuel-based ence scenario, using downscaled GCAM outputs. Fig-
power generation from 8% in 2015 to about 1% in ure 4(a) demarcates the eight sub-basins used for spa-
2050. The Reference scenario for Uruguay in figure tial analysis in this study. Each land allocation sub-
3(e) projects about 5 TWh of solar production annu- figure within figure 4(b) shows the fraction of land
ally in Uruguay, which would amount to as much as in each of the eight sub-basins that corresponds to
120 km2 of land required (using the land use require- each of five dominant land use types. Water supplies
ments of about 3–6 acres per GWh/yr from Ong et al and demands in figures 4(c) and (d) are reported in
(2013) [76]). This represents a relatively small per- units of depth (mm) to facilitate comparison across
centage of the national total land area of 176 000 km2 unequally sized regions. The majority of Uruguay’s
shown in figure 3(a). land is currently (in 2015) dedicated to pasture land
7Environ. Res. Lett. 15 (2020) 094014 Z Khan et al
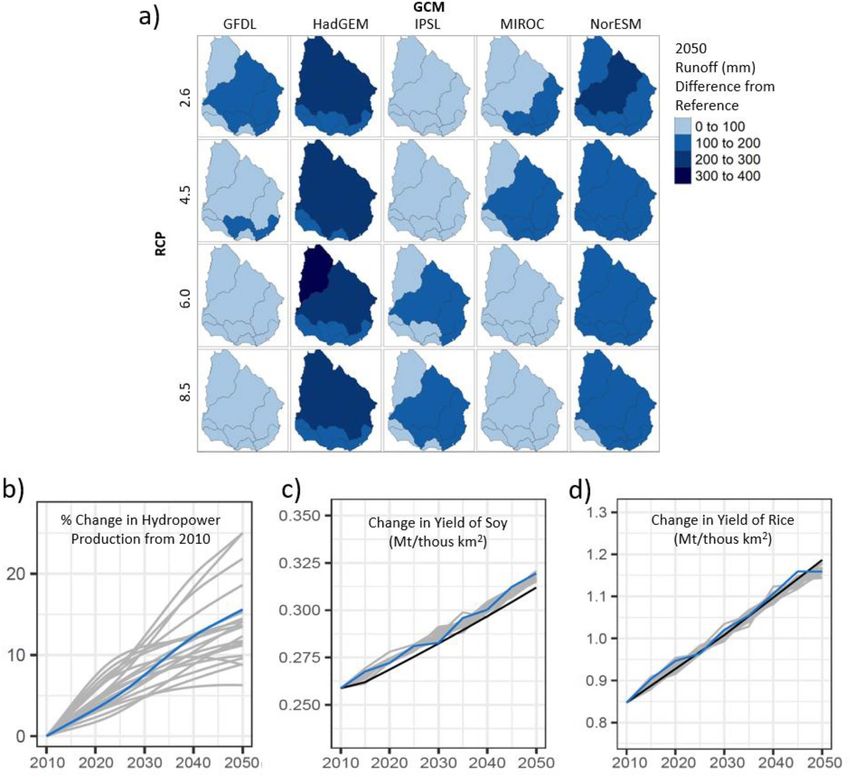
Figure 5. Climate scenario inputs. Projected changes for combinations of five different GCMs and four RCPs for (a) absolute
difference between 2050 and reference runoff (mm) (b) % change in hydropower (c) change in yield of soy (Million tons per
thousand square kilometers) (d) change in yield of rice (Million tons per thousand square kilometers). For illustration: black lines
correspond to the Reference scenario, blue lines correspond to the chosen climate scenario for this study (GFDL_RCP8p5), while
the grey lines show all other GCM/RCP combinations. Note: 1 Mt/thous km2 = 10 ton/hectare.
with agriculture concentrated in the south (figure (%) in hydropower production, relative to 2010 pro-
4(b)). Agriculture, particularly rice, accounts for the duction, that is projected to occur in Uruguay across
large water demand in the south east (figure 4(d)). 20 simulations which are combinations of four RCPs
Despite low water scarcity (ratio of water demands to and five GCMs. We smoothed out the variability in
runoff) at the national level in 2010, moderate water hydropower production projections from Xanthos to
stress may develop in several basins across the coun- generate long-term trends useful in the context of
try by 2050 (figure 4(e)) in response to the socio- GCAM. The projected relative changes in figure 5(b)
economic and human-driven evolution of global are entirely a result of altered runoff patterns resulting
EWL dynamics explored in the Reference scenario. from future climate change. The twenty GCM/RCP
scenarios are shown in gray, while a single selected
scenario from among those 20 scenarios is shown in
3.2. Climate impact scenarios and policy scenarios blue to reflect the Climate scenario. Both runoff and
In this section, a climate impact scenario (GCM: potential hydropower are projected to increase as a
GFDL, RCP: 8.5) and three policy scenarios (Beef, result of climate change across the suite of GCM and
Soy, and Rice) described in section 2 are explored to RCP scenarios. In this paper we select one of the 20
understand their broad EWL nexus implications. Fig- climate scenarios to serve as the Climate scenario,
ure 5 shows the results of climate impacts analysis on GFDL-RCP 8.5. This scenario represents a relatively
water and agriculture run externally to GCAM. Figure smaller increase in runoff compared to the reference
5(a) is a map of climate impacts on runoff (mm), as long-term mean (figures 5(a)) and a median increase
measured by the difference between the Climate and in potential hydropower (figure 5(b)) as compared to
Reference scenarios. Figure 5(b) shows the change the other climate scenarios.
8Environ. Res. Lett. 15 (2020) 094014 Z Khan et al
Figure 6. Comparison across scenarios and chosen nexus parameters. (a) Crop land allocation (1000 km2 ), (b) Agricultural
Production (Mt), (c) Water withdrawals (km3 ), (d) Final energy (Mtoe), (e) Electricity (TWh), and (f) GHG emissions
(MTCO2 eq).
Figures 5(c) and (d) show the evolution of crop by climate change could affect Uruguay both directly
yields, as estimated by the gridded crop model and indirectly [77]. For example, increased soy and
PDSSAT. Yields differ across Uruguay’s two large river rice production in other regions globally as a result
basins and 14 GCAM crops, each of which can be of climate change-induced crop yield effects could
either irrigated or rainfed. Thus, to provide a repres- affect global prices and demands for these commod-
entative sample of crop yield trends, we focus discus- ity exports from Uruguay. Multiple factors can inter-
sion here on two crops (rice and soy) important in act in complex and nonlinear ways in the context of
the context of the policies considered in this study. GCAM. Thus, the absence of clear climate impacts on
Crop yields are increasing for all crops in the Refer- crop yields for rice and soy within Uruguay does not
ence scenario, including the sample of crops shown indicate the absence of global crop yield impacts on
in figure 5, to reflect increased access to technology, Uruguay.
cultivar improvements, etc, along the lines of Shared The policy scenarios, which were run independ-
Socioeconomic Pathway 2 (SSP2) [66]. The impacts ently of the Climate scenario, were designed to
of climate change on crop yields within Uruguay are address particular aspects of each chosen export sec-
projected to be relatively smaller than the changes tor. Figure 6 shows a scenario comparison of the evol-
seen in runoff and hydropower across the different ution of a set of EWL metrics through 2050, while
climate scenarios. Importantly, the global connectiv- figure 7 shows the sub-sector details for the values
ity established through agricultural trade in GCAM from figure 6. The following paragraphs summarize
means that factors such as altered crop yields posed key nexus insights from these two figures.
9Environ. Res. Lett. 15 (2020) 094014 Z Khan et al
Figure 7. Nexus comparison across scenarios. First column shows sub-sector details for the Reference scenario, and the second
through fifth columns show the differences between the Reference scenario and the Climate, Rice, Beef, and Soy scenarios,
respectively. (a) Land allocation (1000 km2 ), (b) Agricultural Production (Mt), (c) Water withdrawals (km3 ), (d) Final energy
(Mtoe), (e) Electricity (TWh), and (f) GHG emissions GWP (MTCO2 eq).
Nexus insight 1: Improving beef production increase) (figure 6(a)) and agricultural production
efficiency and emissions intensity could indirectly (a 30% increase) (figure 6(b)) relative to the Ref-
impact land, crops, and water. The Beef policy is erence scenario. This occurs because improving the
designed to increase the efficiency of beef produc- productivity of livestock results in less need for pas-
tion (i.e. to produce larger cattle (kg/head) with the ture land to produce the same amount of beef. Land
same amount of feed), as well as to lower the emis- previously used for pasture then becomes available
sions intensity of beef production (i.e. emission/kg) for other uses such as forests and crops. This substi-
(section 2) (figure 6(f)). Emissions as a result of the tution is seen figure 7(a) and is driven by the prof-
policy decrease relative to the reference by about 6% itability of each type of land-use. The new crops, in
in 2050. Despite the policy’s confinement to the beef particular rice, demand additional water, resulting in
sector, it significantly increases crop land area (25% a 22% increase in total water withdrawals relative to
10Environ. Res. Lett. 15 (2020) 094014 Z Khan et al
the Reference scenario. While other studies such as policies examined. The Climate scenario increased
Ran et al [78] serve an important purpose by focus- electricity production by 4% relative to the Refer-
ing in detail on particular sectoral interactions, our ence scenario (figure 6(e), figure 7(e)) as a result of
modeling approach allows stakeholders to see new increased hydropower potential. Crop yield impacts
effects by capturing a broad range of sectoral inter- resulting from climate change also had effects, redu-
connections. Thus, we see that a policy targeted at cing total agricultural production by about 6% by
improving the productivity of beef can have signific- 2050 (figure 6(b), figure 7(b)), with corresponding
ant impacts on water, agriculture, and land resources. decreases in cropland area (figure 6(a), figure 7(a)).
Nexus Insight 2: Increased emissions from These EWL climate-induced changes are compar-
rice yields could offset decreased emissions from able in magnitude to the changes resulting from the
enhancing beef production efficiency and emissions policies explored in this paper, and are significantly
intensity. The Rice policy is designed to close the wide less impactful than the overall changes across the
gap in rice yields across Uruguay by improving rice EWL systems as a result of socio-economic drivers
growing practices. An important consideration in rice (figure 3). As governments make plans to adapt to the
irrigation is the associated CH4 emissions from rice potentially devastating impacts of climate change [84,
paddies, which conflicts with national climate mit- 85], studies such as this one can help planners under-
igation and adaptation goals [73, 74]. Globally, rice stand the relative importance of key human (e.g.
paddies account for 20% of total agricultural CH4 socioeconomic) and natural (e.g. climatic) drivers of
[79]. Improving the yield of rice makes it more prof- change.
itable, thus slightly expanding the production of rice
and its land footprint (figure 7(a)). Given the water- 4. Conclusions
intensity of rice irrigation, a corresponding increase
in water withdrawals (about 25%) (figure 6(c), fig- Uruguay has made steady progress since recovering
ures 7(b) and (c)) is expected. In addition, the policy from the regional economic crisis in 2002, rising
also results in a significant increase in GHG emis- to the status of a ‘high income’ nation by 2012.
sions (about a 5% increase relative to the Reference To improve resiliency to economic shocks, Uruguay
scenario in 2050) (figures 6(f) and 7(f)). This has the diversified its export markets to Europe and China.
potential to offset emission reductions gains made However, its export products have remained concen-
by other climate-related policies, including efforts trated in a few key sectors such as beef, soy, and
to increase beef production efficiency and emissions rice, which accounted for a combined 40% of total
intensity. This result highlights the benefits of jointly exports in 2017 [6, 7]. The process of designing and
evaluating multiple policies that may interact and evaluating policies to improve Uruguay’s perform-
conflict in unintentionally ways. ance in these key sectors has traditionally focused
Nexus insight 3: Soy irrigation expansion policy on a limited set of sector-specific parameters directly
is the least disruptive to EWL systems. The pur- related to each commodity, without consideration of
pose of the Soy policy is to increase soy yields. This broader multi-sector implications. This study presen-
improves the economic competitiveness of soy, which ted the first energy-water-land (EWL) nexus study in
increases total soy production by about 4%. Since Uruguay that analyzes multiple policies from a hol-
almost all soy cultivation in Uruguay is rain-fed, a istic perspective using a suite of integrated human-
shift to irrigating 600% more land for soy produc- earth system modeling tools. The project was conduc-
tion also increases water-withdrawals, as shown in fig- ted over the course of two years in collaboration with
ures 6(c) and 7(c). The increase is about 15% by 2050 Uruguay’s National Planning Directorate, the Inter-
relative to the Reference scenario. (By comparison, American Development Bank, and local stakeholders
the Beef and Rice scenarios individually increased representing multiple sectors to guide the develop-
water demands by over 20%). Apart from these expec- ment of the research in line with local needs.
ted increases, the Soy policy has minimal impacts on Results from the Reference scenario showed
other EWL sectors. This lack of unintended nexus that socio-economic change in Uruguay could drive
conflicts makes the Soy policy an attractive potential growth across all sectors, with the greatest increases
area for future investment. projected in electricity generation (three-fold from
Nexus insight 4: The human dimension of 2010 to 2050), followed by total final energy and
change may exceed climate change with respect to water withdrawals (increasing about two-fold each),
EWL nexus impacts. Climate change is often the and finally agricultural production and emissions
focus of numerous nexus assessments and planning (increasing by about 50%). While traditionally the
efforts in the literature [80–83]. However, a grow- electricity sector has been predominantly fueled by
ing body of literature is suggesting that the human hydropower (>75%), Uruguay has made concen-
dimension of change can rival or exceed physical trated efforts to expand wind generation (30% in
change factors in some sectors [50]. In our study, the 2017), making Uruguay a recognized world leader in
electricity sector is the only one in which the Climate renewable power supply. Future projections reflect
scenario had a bigger impact than any of the other continued growth of wind and solar generation
11Environ. Res. Lett. 15 (2020) 094014 Z Khan et al
to meet new demands since existing hydropower peak electricity demands, and agricultural yields, this
potential has already been almost completely tapped. modeling framework would highlight the need for
Agriculture is dominated by rice, soy, and wheat, more adaptive planning to optimize the use of lim-
with rice accounting for the majority of total water ited shared resources across sectors[86–89]. Multiple
demands, other crops being predominantly rain-fed. interacting and conflicting stressors may be worth
While water resources in Uruguay are sufficient at considering in integrated planning efforts such as the
a national scale today, certain regions of Uruguay one undertaken here.
are projected to develop moderate water stress in Feedback from the extensive interaction with local
future years in response to increased agricultural stakeholders helped identify key areas to address
activity. in future work. These include analyzing the wood
In collaboration with local stakeholders, several pulp industry, which is also one of Uruguay’s major
key policies were identified for analysis in the rice, soy, exports; tracking the impacts of pollution from agri-
and beef sectors. Rice yields in Uruguay are uneven culture and livestock activities and corresponding
across the country, with policy measures aimed at deterioration of water quality; climate policies; shifts
closing the yield gap; Soy policy measures encour- in international diets away from meat; investigating
age shifting from rain-fed to irrigated practices to droughts, which have had a major impact on the agri-
expand growing seasons and improve yields; and culture and livestock industry in recent years; and
several methods have been identified for simultan- understanding the implications of monoculture agri-
eously improving the productivity and lowering the culture as Soy continues to expand. Additionally, the
emissions intensity of the beef industry. An integ- land-use implications of the extensive wind and solar
rated analysis of these policies showed several insights expansion projected in this study’s Reference scenario
across multiple sectors. Emissions in the beef industry should be further explored.
are a substantial concern in Uruguay since the sector In conclusion, this study presented a holistic
accounts for the largest share of sectoral GHG emis- assessment of multiple scenarios and sectors in
sions. Beef policies were seen to have multiple bene- a single, consistent modeling framework. This
fits, including allowing expansion of forests and crops approach allows planners to both understand inter-
into pasture land that was previously used for cattle sectoral dynamics as well as identify key areas of con-
grazing. However, as a result, Beef policies could cre- flict and synergies at multiple spatial scales, while at
ate unintended consequences, such as a 22% increase the same time readily weighing the impacts of envir-
in total water withdrawals relative to the Reference onmental factors versus policy decisions to guide
scenario. Similarly, the Rice policy, while success- long-term strategies. While the benefits of integ-
fully increasing production, also results in increased rated analysis have been demonstrated in many
emissions from the associated water-logging prac- studies [18, 19, 22, 23], applications of nexus ana-
tices, which could offset savings made by improv- lysis in practice remain scarce as a result of con-
ing beef sector emissions. Thus, it could be strategic- tinuing sectoral independence and lack of facilitat-
ally advantageous for Uruguay to design and eval- ing bodies to oversee holistic development across
uate multiple policies jointly in a nexus context, as sectors. This study provides an example of how to
policies may interact and conflict in unintentionally overcome some of these challenges by combining
ways. The Soy policy was the least impactful of the integrated multi-sector analysis with extensive stake-
three policies, as switching to irrigated soy cultivation holder interactions to guide identification of relev-
had the least comparative impacts on water demands ant scenarios and solutions to explore. Such studies
and emissions. can be particularly useful in other regions that may
Climate scenarios explored in this study pro- be more exposed to both local and transboundary
jected increased runoff and hydropower potential resource conflicts, higher vulnerability to climate-
in Uruguay, with smaller climate-induced changes driven changes, and areas with a strong dependence
in agricultural yields within Uruguay. Changes in on international markets. This work opens the door
hydropower directly impacted the electricity mix with to future opportunities for similar analysis across sec-
corresponding shifts in wind and solar. Results show tors and scales to identify unique regional, national
that impacts of climate change were comparable to and sub-national conflicts and synergies across
those resulting from the Beef, Soy, and Rice policies, the globe.
and were significantly less impactful than the changes
resulting from socio-economic drivers such as pop-
ulation, income, and GDP growth. This underscores Acknowledgments
the importance of accounting for the human dimen-
sions of change in EWL nexus-focused planning The authors wish to thank the Inter-American Devel-
efforts. In other regions, such as the Indus Basin, opment Bank for sponsoring this effort under con-
Spain or the Western United States, where climate- tract C0260-16. Additionally, this material is based
driven changes are projected to have more severe upon work supported by the National Science Found-
impacts on water availability, temperature-driven ation under Grant No. 1855982.
12Environ. Res. Lett. 15 (2020) 094014 Z Khan et al
Data availability statement service provision in Pampas and Campos grasslands of
southern South America Environ. Res. Lett. 11 113002
[15] IEA 2019 Electricity Generation by Source, Uruguay
All data that support the findings of this study are
1990-2017 - Data and Statistics IEA https://www.iea.org/
included as part of the supplementary information. data-and-statistics?country=URUGUAY&fuel=Energy%
20supply&indicator=Electricity%20generation%20by%
20source (Accessed 20 December 2019)
ORCID iDs [16] Bazilian M et al 2011 Considering the energy, water and food
nexus: towards an integrated modelling approach Energy
Zarrar Khan https://orcid.org/0000-0002-8147- Policy 39 7896–906
[17] Miralles-Wilhelm F and Muñoz R 2017 An analysis of the
8553
water-energy-food nexus in Latin America and the
Thomas B Wild https://orcid.org/0000-0002- Caribbean Region: identifying synergies and tradeoffs
6045-7729 through integrated assessment modeling Int. J. Eng. Sci.
Page Kyle https://orcid.org/0000-0002-1257-8358 7 8–24
[18] Cremades R et al 2019 Ten principles to integrate the
water-energy-land nexus with climate services for
References co-producing local and regional integrated assessments Sci.
Total Environ. 693 133662
[1] CIA 2019 South America: Uruguay — The World Factbook - [19] Johnson N et al 2019 Integrated solutions for the
Central Intelligence Agency https://www.cia.gov/library/ water-energy-land nexus: are global models rising to the
publications/the-world-factbook/geos/print_uy.html challenge? Water 11 2223
(Accessed 18 December 2019) [20] Simpson G B and Jewitt G P W 2019 The development of the
[2] World Bank 2004 Uruguay poverty update 2003 water-energy-food nexus as a framework for achieving
http://documents.worldbank.org/curated/en/2625214687 resource security: a review Front. Environ. Sci. 7 8
61674646/Uruguay-Poverty-Update-2003 (Accessed 18 [21] Nauditt A 2018 Discussion of “Challenges in
December 2019) operationalizing the water–energy–food nexus” Hydrol. Sci.
[3] World Bank 2019 GNI per capita, atlas method (current J. 63 1866–7
US$) - Uruguay, Argentina, Chile Data [22] Albrecht T R, Crootof A and Scott C A 2018 The
https://data.worldbank.org/indicator/NY.GNP.PCAP.CD? water-energy-food nexus: A systematic review of methods
locations=UY-AR-CL (Accessed 18 December 2019) for nexus assessment Environ. Res. Lett. 13 043002
[4] CEPII 2019 CEPII - BACI – presentation [23] Endo A, Tsurita I, Burnett K and Orencio P M 2017 A review
http://www.cepii.fr/CEPII/en/bdd_modele/presentation. of the current state of research on the water, energy, and food
asp?id=37 (Accessed 18 December 2019) nexus J. Hydrol.: Reg. Stud. 11 20–30
[5] OEC 2019 OEC - Uruguay (URY) exports, imports, and [24] Wallington K and Cai X 2017 The food–energy–water nexus:
trade partners, observatory of economic complexity (OEC) a framework to address sustainable development in the
https://oec.world/en/profile/country/ury/ (Accessed 18 tropics Trop. Conserv. Sci. 10 194008291772066
December 2019) [25] de Strasser L, Lipponen A, Howells M, Stec S and Bréthaut C
[6] World Bank 2015 Uruguay Systematic Country Diagnostic - 2016 A methodology to assess the water energy food
June 2015 (Washington, DC: World Bank Group) ecosystems nexus in transboundary river basins Water 8 59
http://documents.worldbank.org/curated/en/914791468 [26] Scott C A, Kurian M and Wescoat J L 2015 The
187801159/Uruguay-Systematic-country-diagnostic water-energy-food nexus: enhancing adaptive capacity to
[7] Alberto P, Jose-Daniel R and Gonzalo V 2015 Uruguay - complex global challenges Governing the Nexus ed M Kurian
Trade Competitiveness Diagnostic (Washington, DC:World and R Ardakanian (Berlin: Springer) pp 15–38
Bank Group) http://documents.worldbank.org/ [27] Ringler C, Bhaduri A and Lawford R 2013 The nexus across
curated/en/336461468179662552/Main-report water, energy, land and food (WELF): potential for improved
[8] MGAP 2019 Plan nacional de adaptación a la variabilidad y resource use efficiency? Curr. Opin. Environ. Sustainability 5
el cambio climático para el sector agropecuario http://www. 617–24
mgap.gub.uy/sites/default/files/pna-agro-digital_0.pdf [28] Khan Z, Linares P and García-González J 2017 Integrating
[9] MVOTMA 2017 Plan nacional de aguas http://www.mvotma. water and energy models for policy driven applications. A
gub.uy/politica-nacional-de-aguas/plan-nacional-de-aguas review of contemporary work and recommendations for
[10] MVOTMA 2016 Uruguay´s fourth national communication future developments Renewable Sustainable Energy Rev. 67
to the conference of the parties in the United Nations 1123–38
framework convention on climate change - executive [29] Ibrahim M D, Ferreira D C, Daneshvar S and Marques R C
summary https://www.mvotma.gub.uy/component/ 2019 Transnational resource generativity: efficiency analysis
k2/item/download/7051_b570719f5ec3fb28e448849cf0 and target setting of water, energy, land, and food nexus for
c24074 OECD countries Sci. Total Environ. 697 134017
[11] MVOTMA 2016 Primera contribución determinada a nivel [30] Kahil T et al 2017 A continental-scale hydroeconomic model
nacional de Uruguay al acuerdo de París http://www. for integrating water-energy-land nexus solutions Water
mvotma.gub.uy/politica-planes-y-proyectos/contribucion- Resour. Res. 7511–33
determinada-a-nivel-nacional/item/download/11506_ [31] Lechón Y, De La Rúa C and Cabal H 2018 Impacts of
e92380d420bcc9dffe464877c86fb30d decarbonisation on the water-energy-land (WEL) nexus: a
[12] FAO 2019 Water resources - country profile - Uruguay - case study of the spanish electricity sector Energies
AQUASTAT https://storage.googleapis.com/fao- 11 1203
aquastat.appspot.com/countries_regions/factsheets/water_ [32] Gober P 2018 Hidden vulnerabilities in the
resources/en/URY-WRS.pdf (Accessed 20 December 2019) water-energy-land-food (WELF) nexus Building Resilience
[13] FAO 2015 AQUASTAT Perfil De País – Uruguay, Organización for Uncertain Water Futures ed P Gober (Berlin: Springer) pp
De Las Naciones Unidas Para La Alimentación Y La 61–89
Agricultura (Roma, Italia) (Accessed 20 December 2019) [33] White D J, Hubacek K, Feng K, Sun L and Meng B 2018 The
http://www.fao.org/3/ca0442es/CA0442ES.pdf water-energy-food nexus in east asia: A tele-connected value
[14] Modernel P, Rossing W A H, Corbeels M, Dogliotti S, Picasso chain analysis using inter-regional input-output analysis
V and Tittonell P 2016 Land use change and ecosystem Appl. Energy 210 550–67
13Environ. Res. Lett. 15 (2020) 094014 Z Khan et al
[34] Saladini F et al 2018 Linking the water-energy-food nexus [52] Calvin K and Fisher-Vanden K 2017 Quantifying the indirect
and sustainable development indicators for the impacts of climate on agriculture: an inter-method
Mediterranean region Ecol. Indic. 91 689–97 comparison Environ. Res. Lett. 12 115004
[35] Wada Y et al 2019 Co-designing indus water-energy-land [53] Clarke L, Eom J, Marten E H, Horowitz R, Kyle P, Link R,
futures One Earth 1 185–94 Mignone B K, Mundra A and Zhou Y 2018 Effects of
[36] Santos Da Silva S R et al 2019 The Paris pledges and the long-term climate change on global building energy
energy-water-land nexus in Latin America: exploring expenditures Energy Econ. 72 667–77
implications of greenhouse gas emission reductions PLoS [54] JGCRI 2020 GCAM v5.2 documentation: table of contents,
One 14 e0215013 joint global change research institute https://jgcri.github.
[37] Turner S W D, Hejazi M, Calvin K, Kyle P and Kim S 2019 A io/gcam-doc/toc.html (Accessed 31 January 2020)
pathway of global food supply adaptation in a world with [55] Vernon C R, Hejazi M I, Turner S W D, Liu Y, Braun C J, Li X
increasingly constrained groundwater Sci. Total Environ. 673 and Link R P 2019 A global hydrologic framework to
165–76 accelerate scientific discovery https://openresearchsoftware.
[38] Khan Z et al 2020 Metis – A tool to harmonize and analyze metajnl.com/articles/10.5334/jors.245/ (Accessed 23
multi-sectoral data and linkages at variable spatial scales J. December 2019)
Open Res. Softw. 8 [56] Li X, Vernon C R, Hejazi M I, Link R P, Feng L, Liu Y and
[39] Luderer G et al 2019 Environmental co-benefits and adverse Rauchenstein L T 2017 Xanthos – A global hydrologic model
side-effects of alternative power sector decarbonization J. Open Res. Softw. 5 21
strategies Nat. Commun. 10 1–13 [57] Liu Y, Hejazi M, Li H, Zhang X and Leng G 2018 A
[40] Wu G C, Leslie E, Sawyerr O, Cameron D R, Brand E, Cohen hydrological emulator for global applications – HE v1.0.0
B, Allen D, Ochoa M and Olson A 2020 Low-impact land use Geosci. Model Dev. 11 1077–92
pathways to deep decarbonization of electricity Environ. Res. [58] Elliott J, Kelly D, Chryssanthacopoulos J, Glotter M,
Lett. 15 074044 Jhunjhnuwala K, Best N, Wilde M and Foster I 2014 The
[41] Willaarts B, Stefano L D, Garrido A, Llamas R, Custodio E, parallel system for integrating impact models and sectors
Villarroya F, Martínez-Santos P and Aldaya M M 2014 Water (pSIMS) Environ. Model. Softw. 62 509–16
and food security in Latin America and the Caribeean: [59] Rosenzweig C et al 2014 Assessing agricultural risks of
regional opportunities to cope with global challenges, in: climate change in the 21st century in a global gridded crop
water for food and wellbeing in Latin America and the model intercomparison PNAS 111 3268–73
Caribbean Soc. Environ. Implications Glob. [60] Li X, Vernon C R, Hejazi M I, Link R P, Huang Z, Liu L and
Econ. 23 Feng L 2018 Tethys – A python package for spatial and
[42] Muñoz-Castillo R, Miralles-Wilhelm F and Machado K 2019 temporal downscaling of global water withdrawals J. Open
A CLEWS nexus modeling approach to assess water security Res. Softw. 6 9
trajectories and infrastructure needs in Latin America and [61] Vernon C R, Page Y L, Chen M, Huang M, Calvin K V,
the Caribbean Inter-Am. Dev. Bank https://doi.org/ Kraucunas I P and Braun C J 2018 Demeter – A land use and
10.18235/0001650 land cover change disaggregation model J. Open Res. Softw.
[43] BTI 2018 BTI 2018 Country report — uruguay, bertelsmann 6 15
stiftung https://www.bti-project.org/fileadmin/files/BTI/ [62] Falkenmark M, Lundqvist J and Widstrand C 1989
Downloads/Reports/2018/pdf/BTI_2018_Uruguay.pdf Macro-scale water scarcity requires micro-scale approaches
(Accessed 4 February 2020) Nat. Resour Forum 13 258–67
[44] Vammalle C and Rivadeneira A M R 2019 Budgeting in [63] Rockström J 2008 Balancing water for humans and nature:
Uruguay towards modern budgeting practices in Uruguay the new approach in ecohydrology https://www.sei.org/
OECD J. Budgeting 19 171–97 publications/balancing-water-humans-nature-new-
[45] OPP 2019 Oficina de planeamiento y presupuesto - approach-ecohydrology/
presidencia de la república oriental del Uruguay, oficina de (Accessed 23 December 2019)
planeamiento y presupuesto - presidencia de la república [64] Riahi K et al 2017 The shared socioeconomic pathways and
oriental del Uruguay https://www.opp.gub.uy/es (Accessed their energy, land use, and greenhouse gas emissions
17 January 2020) implications: an overview Glob. Environ. Change 42 153–68
[46] SEDAC 2018 Gridded Population of the World, Version 4 [65] Fricko O et al 2017 The marker quantification of the Shared
(Gpwv4): Population Density, Revision 11, Center for Socioeconomic Pathway 2: A middle-of-the-road scenario
International Earth Science Information Network - CIESIN - for the 21st century Glob. Environ. Change 42 251–67
Columbia University. 2018 (Palisades, NY: NASA [66] O’Neill B C et al 2017 The roads ahead: narratives for shared
Socioeconomic Data and Applications Center (SEDAC)) socioeconomic pathways describing world futures in the 21st
(Accessed 19 December 2019) century Glob. Environ. Change 42 169–80
[47] Calvin K et al 2019 GCAM v5.1: representing the linkages [67] Warszawski L, Frieler K, Huber V, Piontek F, Serdeczny O
between energy, water, land, climate, and economic systems and Schewe J 2014 The inter-sectoral impact model
Geosci. Model Dev. 12 677–98 intercomparison project (ISI–MIP): project framework
[48] Hejazi M I, Edmonds J, Clarke L, Kyle P, Davies E, PNAS 111 3228–32
Chaturvedi V, Wise M, Patel P, Eom J and Calvin K 2014 [68] van Vuuren D P et al 2011 The representative concentration
Integrated assessment of global water scarcity over the 21st pathways: an overview Clim. Change 109 5
century under multiple climate change mitigation policies [69] FAO 2016 Integrating agriculture in national adaptation
Hydrol. Earth Syst. Sci. 18 2859–83 plans (NAP-Ag) - Uruguay, food and agriculture
[49] Hejazi M, Edmonds J, Clarke L, Kyle P, Davies E, Chaturvedi organization of the United Nations http://www.fao.org/
V, Wise M, Patel P, Eom J and Calvin K 2014 Long-term 3/a-c0199e.pdf
global water projections using six socioeconomic scenarios [70] República Oriental del Uruguay 2017 Primera contribución
in an integrated assessment modeling framework Technol. determinada a nivel Nacional al Acuerdo de París, república
Forecast. Soc. Change 81 205–26 oriental del Uruguay https://www4.unfccc.int/sites/
[50] Graham N et al 2019 Humans drive future water scarcity ndcstaging/PublishedDocuments/Uruguay%20First/
changes across all shared socioeconomic pathways Environ. Uruguay_Primera%20Contribuci%C3%B3n%
Res. Lett. 15 014007 20Determinada%20a%20nivel%20Nacional.pdf
[51] Cui R Y, Calvin K, Clarke L, Hejazi M, Kim S, Kyle P, Patel P, (Accessed 3 April 2020)
Turner S and Wise M 2018 Regional responses to future, [71] MGAP 2015 Estrategia de fomento del desarrollo de la
demand-driven water scarcity Environ. Res. Lett. agricultura regada en Uruguay, ministerio de ganadería,
13 094006 agricultura y pesca http://www.mgap.gub.uy/sites/
14You can also read