Contribution of Excitatory and Inhibitory Neuronal Activity to BOLD fMRI - Oxford Academic Journals
←
→
Page content transcription
If your browser does not render page correctly, please read the page content below
Cerebral Cortex, September 2021;31: 4053–4067

                                                                             https://doi.org/10.1093/cercor/bhab068
                                                                             Advance Access Publication Date: 24 April 2021
                                                                             Original Article

ORIGINAL ARTICLE

Contribution of Excitatory and Inhibitory Neuronal

                                                                                                                                                         Downloaded from https://academic.oup.com/cercor/article/31/9/4053/6248484 by guest on 28 September 2021
Activity to BOLD fMRI
Hyun Seok Moon1,2,3 , Haiyan Jiang1,2 , Thanh Tan Vo1,2,3 , Won Beom Jung1 ,
Alberto L Vazquez4,5 and Seong-Gi Kim1,2,3
1 Center for Neuroscience Imaging Research (CNIR), Institute for Basic Science (IBS), Suwon 16419, Republic of
Korea, 2 Department of Biomedical Engineering, Sungkyunkwan University, Suwon 16419, Republic of Korea,
3 Department of Intelligent Precision Healthcare Convergence, Sungkyunkwan University, Suwon 16419,

Republic of Korea, 4 Department of Radiology, University of Pittsburgh, Pittsburgh, PA 15203, USA and
5 Department of Bioengineering, University of Pittsburgh, Pittsburgh, PA 15203, USA

Address correspondence to Seong-Gi Kim, IBS Center for Neuroscience Imaging Research, N Center, Sungkyunkwan University, Suwon 16419, Republic of
Korea. Email: seonggikim@skku.edu

Abstract
The BOLD fMRI response in the cortex is often assumed to ref lect changes in excitatory neural activity. However, the
contribution of inhibitory neurons to BOLD fMRI is unclear. Here, the role of inhibitory and excitatory activity was examined
using multimodal approaches: electrophysiological recording, 15.2 T fMRI, optical intrinsic signal imaging, and modeling.
Inhibitory and excitatory neuronal activity in the somatosensory cortex were selectively modulated by 20-s optogenetic
stimulation of VGAT-ChR2 and CaMKII-ChR2 mice, respectively. Somatosensory stimulation and optogenetic stimulation of
excitatory neurons induced positive BOLD responses in the somatosensory network, whereas stimulation of inhibitory
neurons produced biphasic responses at the stimulation site, initial positive and later negative BOLD signals, and negative
BOLD responses at downstream sites. When the stimulation duration was reduced to 5 s, the hemodynamic response of
VGAT-ChR2 mice to optogenetic stimulation was only positive. Lastly, modeling performed from neuronal and
hemodynamic data shows that the hemodynamic response function (HRF) of excitatory neurons is similar across different
conditions, whereas the HRF of inhibitory neurons is highly sensitive to stimulation frequency and peaks earlier than that
of excitatory neurons. Our study provides insights into the neurovascular coupling of excitatory and inhibitory neurons and
the interpretation of BOLD fMRI signals.

Key words: BOLD, excitatory neurons, inhibitory neurons, neurovascular coupling, optogenetic fMRI

Introduction                                                                 (deactivation) in excitatory neural activity (Logothetis et al.
Blood oxygenation level-dependent (BOLD) functional MRI                      2001; Logothetis 2008), respectively, because excitatory neurons
(fMRI) is widely used to noninvasively map brain function                    constitute 80–90% of all neurons in the cortex (Meyer et al. 2011).
in humans and animals. However, BOLD fMRI is an indirect                     The remaining neurons transmit γ -aminobutyric acid (GABA) to
index of neuronal activity (Kim and Ogawa 2012), and thus                    inhibit postsynaptic neurons, playing a critical role in cortical
understanding its neural correlates is critical to the proper                processing. Because inhibitory neurons also connect to nearby
interpretation of fMRI. Increases and decreases in the BOLD                  arterial vasculature (Vaucher et al. 2000; Kocharyan et al. 2008),
response are often assumed to reflect increases and decreases                they are involved in evoked hemodynamic regulation (Cauli et al.

© The Author(s) 2021. Published by Oxford University Press. All rights reserved. For permissions, please e-mail: journals.permission@oup.com.
This is an Open Access article distributed under the terms of the Creative Commons Attribution Non-Commercial License (http://creativecommons.org/
licenses/by-nc/4.0/), which permits non-commercial re-use, distribution, and reproduction in any medium, provided the original work is properly cited.
For commercial re-use, please contact journals.permissions@oup.com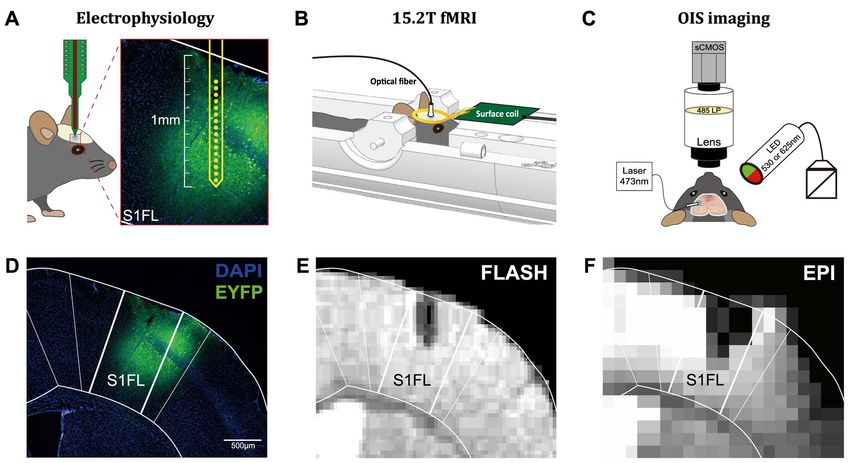
4054      Cerebral Cortex, 2021, Vol. 31, No. 9

2004; Cauli and Hamel 2010). Thus, it is crucial to examine how         Materials and Methods
inhibitory neurons affect hemodynamic responses and BOLD
                                                                        Animal Subjects
fMRI.
    Hemodynamic responses to inhibitory neural activity have            Inhibitory neuron-specific VGAT-ChR2-EYFP (B6.Cg-Tg(Slc32a1-
been investigated in GABAergic neuron-rich brain regions                COP4∗ H134R/EYFP)8Gfng/J) transgenic mice (20–29 g, both sexes,
(Mathiesen et al. 1998; Poplawsky et al. 2015; Poplawsky et al.         9–15 weeks old; n = 17), and wild-type C57BL/6 mice (22–31 g, both
2021) or by selectively activating inhibitory neurons (Anenberg         sexes, 8–20 weeks old, n = 11) were used (Table 1). All transgenic
et al. 2015; Uhlirova et al. 2016; Vazquez et al. 2018; Dahlqvist       mice were bred in-house from breeding pairs originally acquired
et al. 2020; Krawchuk et al. 2020; Lee, Stile, et al. 2021; Lee,        from Jackson Laboratory (Bar Harbor). Animals were housed
Boorman, et al. 2020). Synaptically activated inhibitory neurons        in cages under a 12-h dark–light cycle, and food and water
induce a blood flow increase in inhibitory neuron-rich regions,         were provided ad libitum. All procedures were approved by the
such as the cerebellar cortex (Mathiesen et al. 1998) and olfactory     Institutional Animal Care and Use Committee of Sungkyunkwan
bulb (Poplawsky et al. 2015; Poplawsky et al. 2021), indicating         University in accordance with standards for humane animal

                                                                                                                                              Downloaded from https://academic.oup.com/cercor/article/31/9/4053/6248484 by guest on 28 September 2021
that inhibitory neuronal activity induces a positive BOLD               care from the Animal Welfare Act and the National Institutes
response. Alternatively, in the cortical area, where excitatory         of Health Guide for the Care and Use of Laboratory Animals.
and inhibitory neurons are intermingled, optogenetics can
be used to selectively stimulate inhibitory neurons (Zhao               Virus Injection, Optical Fiber Implantation,
et al. 2011). After light-sensitive channelrhodopsin-2 (ChR2)           and Thinned Skull Preparation
ion channels were genetically targeted to inhibitory neurons,
                                                                        Fiber implantation and virus injection were performed under
hemodynamic responses to increased inhibitory activity were
                                                                        ketamine (100 mg/kg) and xylazine (10 mg/kg) >2 weeks
examined with intrinsic optical imaging or laser Doppler
                                                                        before the experiments. Meloxicam (1 mg/kg) was additionally
flowmetry (Anenberg et al. 2015; Uhlirova et al. 2016; Vazquez
                                                                        administered subcutaneously to relieve pain and reduce
et al. 2018; Dahlqvist et al. 2020; Krawchuk et al. 2020; Lee, Stile,
                                                                        inflammation. Mice were fixed to a stereotaxic frame, and the
et al. 2021; Lee, Boorman, et al. 2020). In general, activating
                                                                        scalp was cut out in a large oval shape to expose the whole
interneurons that target the vesicular GABA transporter (VGAT)
                                                                        skull. Then, craniotomy and durotomy (∼0.5-mm diameter)
increased cerebral blood flow (CBF) and cerebral blood volume
                                                                        were performed on the right primary somatosensory cortex,
(CBV) (Anenberg et al. 2015; Uhlirova et al. 2016; Vazquez
                                                                        forelimb area (S1FL; 0.05-mm posterior from the bregma and
et al. 2018; Krawchuk et al. 2020), which would be expected
                                                                        2.2-mm lateral). We injected AAV5-CaMKIIα-hChR2(H134R)-
to induce positive BOLD signals. However, because inhibitory
                                                                        EYFP (6 mice for the CaMKII optogenetic experiments) or AAV9-
and excitatory neurons interact closely within the same region
                                                                        CaMKII-GCaMP6f-WPRE-SV40 (one animal for testing OISI)
(Taniguchi 2014), an increase in inhibitory activity decreases
                                                                        (obtained from the University of North Carolina Vector Core)
nearby excitatory neuronal activity. Thus, interpreting the
                                                                        into the wild-type mice. We loaded the virus into a glass pipette
hemodynamic responses induced by optogenetic stimulation of
                                                                        (BF-120-60-10, Sutter Instrument) and connected it to a pressure
inhibitory neurons is complicated. Additionally, BOLD fMRI has
                                                                        injector (PICOSPRITZER III, Parker Hannifin). Then, we attached
a complex dependency on changes in the CBF, CBV, and cerebral
                                                                        them to a micromanipulator (SMX, Sensapex) in the stereotaxic
metabolic rate of oxygen metabolism (CMRO2 ) (Kim and Ogawa
                                                                        arm. After placing the glass pipette at the target point, we slowly
2012). Thus, CBF or CBV responses measured by optics (Anenberg
                                                                        inserted the pipette to a depth of 500 μm and injected 500 nl of
et al. 2015; Uhlirova et al. 2016; Vazquez et al. 2018; Dahlqvist
                                                                        the virus at a pressure of 20 psi.
et al. 2020; Krawchuk et al. 2020; Lee, Stile, et al. 2021; Lee,
                                                                           For the fMRI animal groups, an optical fiber cannula with
Boorman, et al. 2020) might not be directly translatable to BOLD
                                                                        a core diameter of 105 μm and a numerical aperture of 0.22
fMRI. Consequently, it is important to clarify how inhibitory and
                                                                        (CFMLC21L02, Thorlabs), chosen to minimize MRI distortion, was
excitatory neurons affect BOLD fMRI signals.
                                                                        implanted at a depth of 0.5 mm. The fiber was fixed using a
    In this study, we examined the effects of inhibitory and
                                                                        small amount of bio-compatible silicone adhesive (Kwik-Cast,
excitatory neuronal activity on neurovascular coupling and
                                                                        World Precision Instrument). Then, dental cement (Super-Bond,
BOLD fMRI using inhibitory and excitatory ChR2 mouse models.
                                                                        Sun Medical) was thinly spread over the whole skull to fix the
First, neuronal activity was measured using electrophysiological
                                                                        fiber cannula onto the skull.
recordings from the primary somatosensory cortex during ChR2
                                                                           For wide-field OISI of VGAT-ChR2 mice, thinned skull mice
stimulation of transgenic VGAT-ChR2 and CaMKII-ChR2 mice. To
                                                                        were prepared 1 week before the experiment under 2% isoflu-
modulate the magnitude of inhibitory and excitatory neuronal
                                                                        rane anesthesia. Similar to the virus injection procedure, ani-
activity via light stimulation, two different stimulation frequen-
                                                                        mals were fixed to a stereotaxic frame, and the entire dorsal
cies were chosen. Second, BOLD fMRI signals were acquired
                                                                        skull was carefully exposed with forceps and surgical scissors.
at an ultrahigh field of 15.2 T to observe local and distant
                                                                        After removing the thin periosteum, the skull was thinned with
responses to the optogenetic stimulation with a high signal-
                                                                        a handheld drill, and then a thin layer of cyanoacrylate glue
to-noise ratio, and then they were compared with those from
                                                                        (Loctite 401, Henkel) was applied to the entire skull surface to
forepaw stimulation. To enable a comparison with published
                                                                        achieve optical clarity.
optical imaging data with a relatively short stimulation duration
(1–4 s) and examine the stimulation-duration dependency, CBV-
and BOLD-weighted optical intrinsic signal imaging (OISI) was
                                                                        Experimental Design and Stimulus Paradigms
performed for 5 and 20-s optogenetic stimulation in VGAT-ChR2
mice. Last, modeling of the hemodynamic response function               The mice were initially anesthetized with 4% isoflurane in oxy-
(HRF) was performed from neuronal and hemodynamic data of               gen, and then a mixture of ketamine (100 mg/kg) and xylazine
the somatosensory cortex.                                               (10 mg/kg) was injected intraperitoneally (IP) to induce anesthe-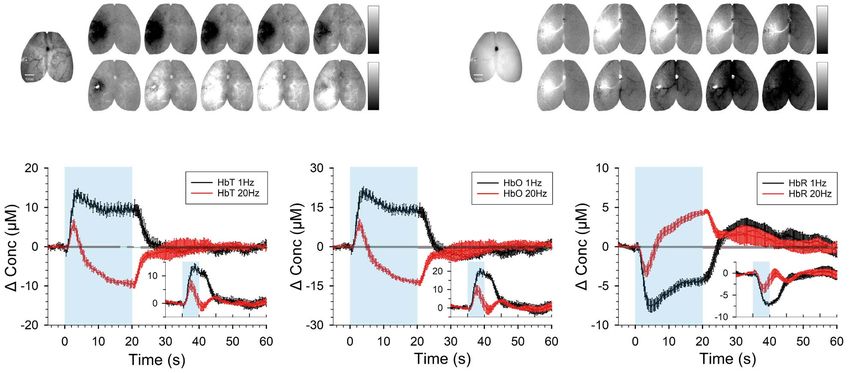
Excitatory versus Inhibitory Activity to fMRI Moon et al.                       4055

Table 1 Summary of animal groups and associated experiments

Group                       # of animals used           Stimulation (frequency in Hz)                                     Experiment

VGAT-ChR2                   N = 17                      Optogenetic frequency-dependence (1/4/10/20/40)                   Electrophysiology
                                                        Optical (1/20)                                                    Electrophysiology/fMRI/OISI
                                                        Forepaw (4)                                                       Electrophysiology
CaMKII-ChR2                 N=6                         Optical (1/20)                                                    Electrophysiology/fMRI
                                                        Forepaw (4)                                                       fMRI
Control                     N=5                         Optical (1/20)                                                    fMRI or OISI

Note: The number of animals used in each group is shown with corresponding experiments and stimulation types. fMRI, functional magnetic resonance imaging; OISI,
optical intrinsic signal imaging.

                                                                                                                                                                   Downloaded from https://academic.oup.com/cercor/article/31/9/4053/6248484 by guest on 28 September 2021
sia. Supplementary anesthesia (25 and 1.25 mg/kg for ketamine                     parameters: 1/200 and 20 Hz/10 ms. 3) For the OISI studies of
and xylazine, respectively) was delivered repeatedly via an IP                    1/200 and 20 Hz/10 ms stimulation of VGAT-ChR2 mice, the stim-
line as needed, based on physiological monitoring (Shim et al.                    ulation paradigms consisted of 5 (baseline), 5 or 20 (stimulation),
2018). For the neuronal recording and OISI studies, each mouse’s                  and 20 or 40 s (rest). Control experiments were performed on one
head was fixed in a stereotaxic frame (SR-10R, Narishige). For                    wild-type mouse and one CaMKII-GCaMP6f mouse.
the fMRI studies, each animal was positioned in a customized
mouse cradle, and the head was fixed with ear and bite bars.
                                                                                  Electrophysiology
Silicone adhesive (Kwik-Cast, World Precision Instrument) was
used to cover the eyes and dental cement on the head to prevent                   Each mouse scalp was removed to expose the skull. After clean-
light leakage. During the experiments, body temperature was                       ing the skull, two holes with diameters of ∼0.3 mm were made
kept at ∼37 ◦ C using an electric or hot-water heating pad.                       using a dental drill to insert ground and reference screws. A
Supplementary oxygen was delivered continuously via blow-by                       craniotomy was performed over the right S1FL (2.2-mm lateral,
at a rate of 0.35 L/min, or oxygen-rich air (a mixture of oxygen                  0.05-mm anterior from the bregma) in a diameter of ∼2 mm
and air at a 1:4 ratio) was ventilated at a rate of 1 L/min through               and a wall (∼3-mm diameter) centering the right S1FL was
a tightly fitted nose cone using a small animal ventilator (SAR-                  made with dental composite resin (Charmfil Flow, Dentkist). We
1000, CWE or TOPO, Kent Scientific Corporation) to maintain                       then performed the CBV-weighted OISI (Imager 3001, Optical
an oxygen saturation level of >90% (Shim et al. 2020). The                        Imaging Ltd.) in response to left forepaw stimulation to precisely
animals’ heart and respiration rates were continuously moni-                      determine the right S1FL. For simultaneous recording and light
tored throughout the experiments with an animal monitoring                        stimulation, a 16-channel opto-electrode with 50-μm spacings
system (Physiosuite, Kent Scientific Corporation or Model 1030,                   between channels (A1x16-5 mm-50-177-OA16LP, NeuroNexus)
Small Animal Instruments) and recorded with a data acquisition                    was placed at the center of the predetermined S1FL and driven
system (Acknowledge, Biopac Systems).                                             down at a speed of 1 μm/s until the electrode tip reached a depth
    The stimulation parameters were controlled by a pulse stim-                   of 1 mm (Fig. 1A). Then, the wall was filled with saline. After
ulator (Master 9, World Precision Instruments). For optical stim-                 we waited >10 min to allow the tissue to settle, electrophysi-
ulation, the light was delivered to the brain via an optical fiber                ological recording was performed at a sampling rate of 30 kHz
cable connected to the fiber cannula (105 μm for fMRI/electro-                    using a neural data acquisition system (Cerebus™, Blackrock
physiology, 200 μm for optical imaging). The optical stimulus                     Microsystems).
was generated by a blue laser (MBL-III-473, Changchun New
Industries Optoelectronics Tech.) with a wavelength of 473 nm
                                                                                  MRI Experiments
and a laser power of 3 mW at the tip of the fiber, as measured
with a power meter (PM100D, Thorlabs). The duty cycle was                         All MRI data were acquired on a 15.2 T/11 cm MR scanner (Bruker
fixed to 20% for every stimulation paradigm to keep the total                     BioSpec) with an actively shielded 6-cm gradient coil operating
amount of light power deposition consistent (equivalent to 69.3                   with a maximum strength of 100 G/cm and a rise time of 110 μs.
or 15.8 mW/mm2 ). For forepaw stimulation, a pair of 30 G needle                  A customized single-loop elliptic surface coil (15 × 12 mm2 ) was
electrodes was inserted beneath the skin of the left forepaw.                     placed on top of each mouse head and used for RF transmission
The electrical stimulus was controlled by a current generator                     and reception (Fig. 1B). Anatomical images were acquired using
(ISO-Flex, AMPI); it had a current intensity of 0.5 mA and was                    the fast low-angle shot (FLASH) sequence with the following
delivered at 4-Hz frequency with a 0.5-ms pulse width (Shim                       parameters: field-of-view (FOV) = 16 (readout, x-axis)× 8 (phase
et al. 2018).                                                                     encoding, y-axis) mm2 , matrix size = 256 × 128, in-plane resolu-
    Three experimental designs were used (Table 1). 1) To deter-                  tion = 62.5 × 62.5 μm2 , 21 contiguous coronal slices with a slice
mine the stimulation frequencies for the fMRI studies of opto-                    thickness of 250 μm, sampling bandwidth = 50 kHz, repetition
genetic stimulation in VGAT-ChR2 mice, electrophysiological                       time (TR) = 310 ms, echo time (TE) = 3 ms, and flip angle (FA) = 30◦ .
recordings were performed for 10 (baseline), 10 (stimulation),                    For BOLD fMRI, we used the single-shot gradient-echo echo-
and 10 s (rest). The light stimulus was delivered with the fol-                   planar imaging (GE-EPI) sequence with the following param-
lowing parameters: 1 (frequency)/200 (pulse width), 4/50, 10/20,                  eters: FOV = 15 (readout, x-axis)×7.5 (phase encoding, y-axis)
20/10, and 40 Hz/5 ms. 2) For the rest of the electrophysiology and               mm2 , matrix size = 96 × 48, in-plane resolution = 156 × 156 μm2 ,
fMRI studies, the stimulation paradigm consisted of five blocks:                  9 contiguous coronal slices with a slice thickness of 500 μm,
40 (baseline), 20 (stimulation), 60 (rest), 20 (stimulation), and                 sampling bandwidth = 300 kHz, TR = 1000 ms, TE = 11.5 ms, and
60 s (rest). The light stimulus was delivered with the following                  FA = 50◦ . The FOV was placed to cover the somatosensory-related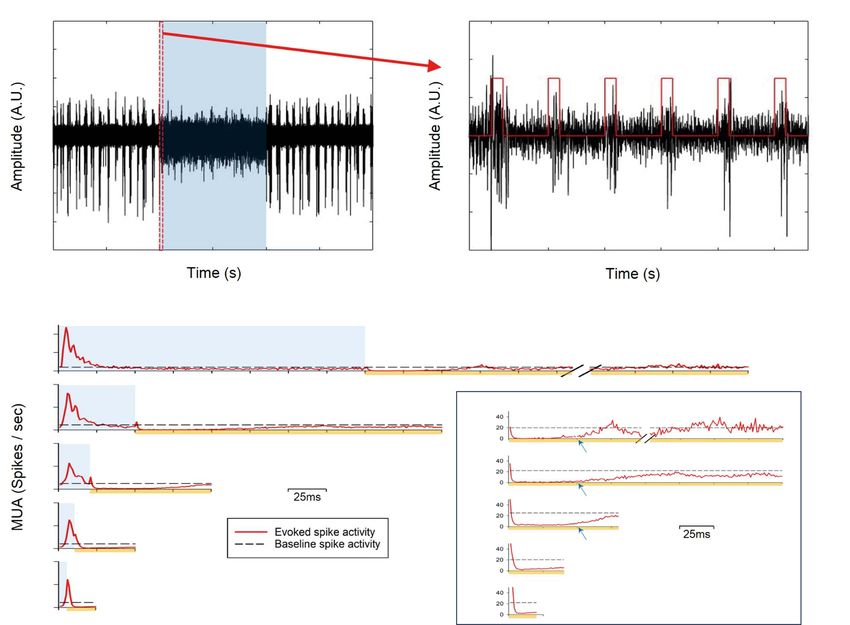
4056       Cerebral Cortex, 2021, Vol. 31, No. 9

                                                                                                                                                                         Downloaded from https://academic.oup.com/cercor/article/31/9/4053/6248484 by guest on 28 September 2021
Figure 1. Experimental schemes and plans. (A–C) Schematic of the 16-channel electrode, fMRI, and OISI setups, respectively. (D) Fluorescence microscopic image showing
the expression of ChR2-EYFP in S1FL (blue: DAPI; green: EYFP). (E) A representative anatomical MR image obtained with the FLASH sequence. (F) A representative
functional MR image obtained with the EPI sequence.

areas, and then local shimming was performed based on the                             Histology
field map to minimize field inhomogeneity within the elliptic
                                                                                      To determine whether virus-injected ChR2 with yellow fluores-
shim volume inside the brain. To alleviate aliasing effects along
                                                                                      cent proteins was expressed in S1FL of the CaMKII-ChR2 mice,
the phase encoding direction, slab saturation was performed at
                                                                                      histological confirmation was performed. After the completion
the ventral side of the brain with a thickness of 5 mm before
                                                                                      of all necessary experiments, the mice were deeply anesthetized
each volume acquisition.
                                                                                      with ketamine/xylazine. Saline solution and 4% formaldehyde
                                                                                      (PFA) were transcardially perfused, and then the brain was
                                                                                      extracted and postfixed in 4% PFA overnight at 4 ◦ C. The
Multi-Wavelength OIS Imaging                                                          brains were stabilized with 30% sucrose in 0.1 M phosphate-
                                                                                      buffered saline (PBS; pH 7.4) for 3 days. Then, the brains were
OISI under optogenetic stimulation was performed with a home-                         sectioned coronally with a cryostat (CM1950, Leica Biosystems)
built system (Fig. 1C), similar to that of Bauer et al. (2018). Two                   at a 40-μm thickness, and the sections containing the fiber
TTL-controlled light-emitting diodes centered at 530 nm (the                          implantation sites were preserved in 0.1 M PBS for fluorescence
isosbestic point of hemoglobin; CBV-weighted) and 625 nm                              imaging. Sections were mounted with DAPI (4 6-diamidino-2-
(sensitive to deoxyhemoglobin; BOLD-weighted) (M530L4 and                             phenylindole)-containing mounting medium (VECTASHIELD
M625L4 coupled with LEDD1B) alternatively illuminated the                             H-1500, Vector Laboratories), which labels all cellular nuclei
thinned-skull and were interleaved with the optogenetic                               regardless of cell type. Images were acquired using a fluores-
stimulation. An sCMOS digital camera (Andor Zyla 4.2, Oxford                          cence microscope (DMi8, Leica Microsystems).
Instruments) was mounted on an epi-fluorescence microscope
equipped with a 1× (0.25 NA) objective (MVX-10; Olympus).
To prevent the saturation of the camera by the reflected                              Data Analysis
photo-stimulus at 473 nm, a dichroic mirror with a cutoff
                                                                                      Multi-Unit Activity Analysis
wavelength of 485 nm (DM485, Olympus) was placed in front of
the camera. Hardware was controlled via a data acquisition card                       Electrophysiological data were analyzed using Matlab (Math-
(Arduino board) and a personal computer running home-written                          works). The raw data were bandpass filtered (0.3–6 kHz) first.
software.                                                                             The common noise level across 16 channels was determined
   For the OISI studies, the left primary forelimb area was found                     at each time point, and then data from the 8 channels closest
by acquiring OISs in response to right forepaw stimulation;                           to the mean value were averaged at each time point (MATLAB
530- and 625-nm reflected optical images were acquired over a                         trimmean) (Guo et al. 2014). The filtered time course after sub-
13 × 13 mm2 FOV with a 2048 × 2048 matrix size at 10 frames per                       traction of the common noise time course was obtained for
second. For each stimulation paradigm, at least 15 trials were                        each channel, and its temporal mean and standard deviation
obtained.                                                                             (SD) were computed for each channel. Peaks exceeding 5 SD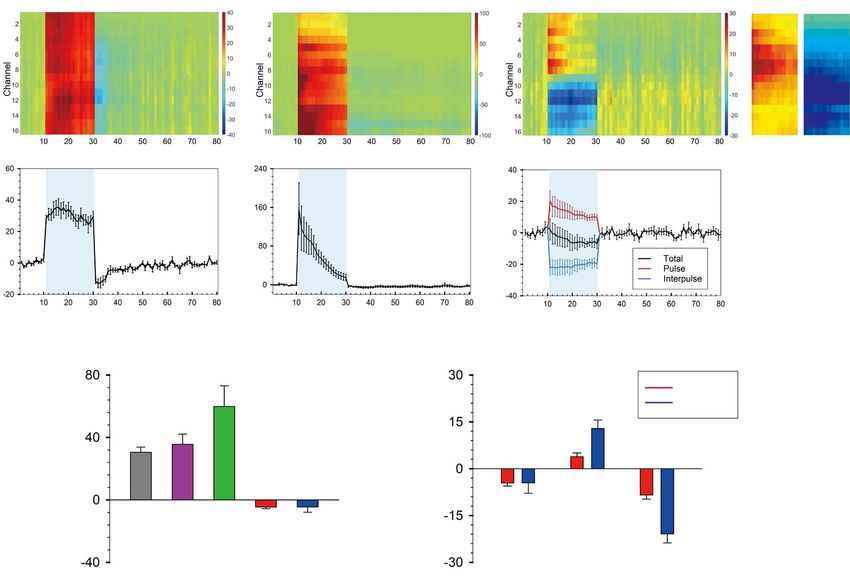
Excitatory versus Inhibitory Activity to fMRI Moon et al.           4057

from the mean for each channel were considered to be spikes.           area (S1FL), supplementary somatosensory area (S2), and pos-
The number of spikes was quantified and converted into spike           terior complex of the thalamus (PO). BOLD time courses were
frequency.                                                             calculated as percent changes relative to the baseline period and
    To characterize the neuronal activity generated by different       extracted from defined ROIs for each subject. Two stimulation
frequency-dependent stimuli in VGAT-ChR2 mice, the number              blocks, with 10-s prestimulus and 50-s poststimulus periods,
of spikes was quantified over 1-ms bins. The neuronal activity         were averaged for further analysis, resulting in time courses that
induced by each light stimulus pulse was obtained by averaging         had a 10-s baseline, 20-s stimulation, and 50-s rest.
the multi-unit activity (MUA) data over repeated interstimulus
periods (from one stimulus onset to the next stimulus onset).
Thus, one averaged MUA time course was obtained in each                OISI Analysis
frequency.                                                             To accelerate postprocessing, 4 × 4 binning was performed on
    To match the neuronal data with the fMRI temporal resolu-          the images. Repeated trials were averaged for each stimulation
tion, the number of spikes was quantified over 1-s bins. 1) In the     condition. To generate activation maps, a baseline image (R)

                                                                                                                                             Downloaded from https://academic.oup.com/cercor/article/31/9/4053/6248484 by guest on 28 September 2021
VGAT-ChR2 studies, optogenetic stimulation induced increased           was obtained by averaging images over the 5-s period prior to
inhibitory activity, which reduced the excitatory activity. There-     stimulation. Differential images (R) were then calculated by
fore, the MUA activity during the “pulse” period was considered        subtracting the baseline image from each image in time. Lastly,
to reflect mostly inhibitory activity. After the light pulse ended,    activation maps (R/R) were generated by dividing the differen-
the suppression of excitatory activity was prolonged. Thus, MUA        tial images by the baseline image. To remove the contribution
activity during the “inter-pulse” period was computed separately       of fluorescent signals to OISI for 1-Hz optogenetic stimulation,
after excluding the initial 10 ms of data immediately after pulse      we excluded data points to be acquired during optogenetic light
to avoid measuring residual inhibitory activity. During the 20-s       exposure. Although the acquisition of OISI (10-Hz sampling rate)
stimulation periods, three neuronal time courses were obtained:        was interleaved with 20-Hz optogenetic stimulation, stimulus-
the pulse period, the interpulse period, and the entire period. 2)     induced artifacts persisted at the center of illumination at 20 Hz.
For the studies of forepaw stimulation and optogenetic stimu-          Hence, we extracted OIS time courses from a c-shaped ROI (outer
lation of excitatory neurons, only total MUA time courses were         diameter: 1 mm and inner diameter: 0.5 mm) excluding the
obtained for entire stimulation periods. To compare the MUA            location of artifacts and the optic fiber in control and VGAT-
with the BOLD fMRI signals in the somatosensory cortical region        ChR2 mice. Then, the magnitude of the residual artifact was
of interest (ROI), all 16 channels were averaged.                      estimated from the subtraction of two consecutive time points
                                                                       right at stimulus onset and at stimulus end assuming that
                                                                       the hemodynamic change was minimal, and was subtracted
BOLD fMRI Analysis
                                                                       from the raw time courses. Then, CBV- and BOLD-weighted OIS
All fMRI data were preprocessed and analyzed using readily             time series were converted into concentration changes of total
available software packages: Analysis of Functional NeuroIm-           hemoglobin (HbT), deoxyhemoglobin (HbR), and oxyhemoglobin
ages (Cox 1996), FMRIB Software Library (Smith et al. 2004),           (HbO) using the following equation based on the Modified Beer–
Advanced Normalization Tools (Avants et al. 2011), and Matlab.         Lambert Law:
Each functional image volume was preprocessed with slice tim-
ing correction and motion correction by aligning every image                  μ(t, λ1 )      εHbR (λ1 ) εHbO (λ1 )       cHbR (t)
                                                                                          =                           ×              ,
to the first image of each first volume. To generate group-                   μ(t, λ2 )      εHbR (λ2 ) εHbO (λ2 )       cHbO (t)
averaged datasets, preprocessed data in the same session were
averaged, and linear detrending was performed to reduce signal         where μ(t, λ) is the change in pathlength-corrected absorption
drift. Then, spatial smoothing was performed using a Gaus-             coefficient between time t0 and t at wavelength λ, εHbR or HbO (λ)
sian kernel with an FWHM of 0.156 mm. Spatial normalization            is the molar extinction coefficient of HbR or HbO, and
was conducted using the following procedure. First, multislice         cHbR or HbO (t) is the change in HbR or HbO concentration.
functional EPI images were co-registered to the anatomical T2 ∗ -      We used a pathlength value of 0.57 and 2.50 mm for 530 and
weighted images from the same subject using an affine trans-           625 nm, respectively, and molar coefficients of 39 707 and
formation. Second, the T2 ∗ -weighted images of all subjects were      39 016 cm−1 M−1 for HbO and HbR at 530 nm, and 952.8 and
normalized and averaged while applying linear- and nonlinear           6633.7 cm−1 M−1 for HbO and HbR at 625-nm wavelength,
transformations to generate a mouse brain template. Third, all         respectively (Dunn et al. 2005).
EPI images co-registered in the first step were normalized to
the mouse brain template using the co-registration parameters
                                                                       Relationship between Neuronal Activity
obtained in the second step. The Allen Mouse Brain Atlas was
                                                                       and the BOLD/OIS Response in the S1FL ROI
registered to the brain template.
   We excluded one animal from the forepaw data and one                The HRF was obtained using MUA data as input and correspond-
from the CaMKII data due to a lack of BOLD responses in the            ing BOLD fMRI and OISI data as output. The HRF was modeled
S1FL, resulting in five animals each for the forepaw and opto-         as a 2-pole and 1-zero Laplace function that is able to accom-
genetic stimuli. Group-averaged activation maps were made by           modate overshoot and undershoot response characteristics. An
a GLM analysis using a stimulation paradigm convolved with a           amplitude coefficient was also included in the HRF to best match
gamma-variate function. Activation voxels were decided using           the amplitude and constrain the pole-zero space. The HRF model
a threshold of the t-value (P < 0.05, family-wise error corrected      parameters were estimated with a squared-error minimization
with the Bonferroni post-hoc test) and clusters with >102 voxels       procedure in the hemodynamic response prediction, using the
(equivalent to 0.1 mm3 ).                                              MUA data as input convolved with the estimated HRF. For the
   For the quantitative analyses, ROIs were defined based on the       optogenetic hemodynamic data from the VGAT-ChR2 mice, we
Allen Brain Atlas: the upper limb in the primary somatosensory         also explored a model with two inputs (excitatory and inhibitory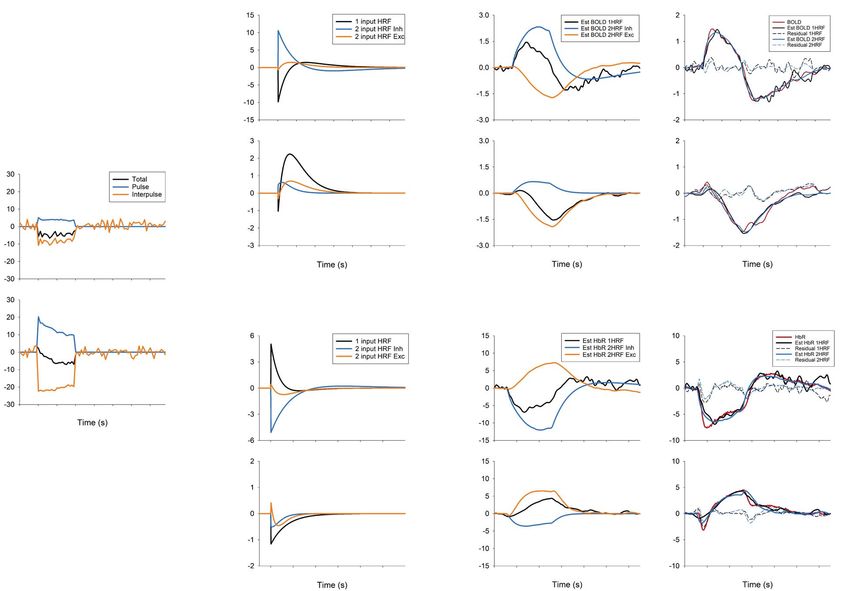
4058      Cerebral Cortex, 2021, Vol. 31, No. 9

neuronal activity) and two HRFs with the individual amplitude          prestimulus baseline level when the interstimulus interval was
coefficients that best predicted the observed response. To avoid       less than 50 ms (e.g., 20 and 40 Hz). Therefore, we presume that 1)
potential interactions between HRFs when fitting the 2 HRF             spikes during the pulse periods are induced by ChR2 activation
model, we constrained the HRF fit parameters to be positive and        and represent the activity of inhibitory GABAergic neurons, and
the first HRF to peak within the first 6 s.                            2) spikes detected in the baseline period and between stimulus
                                                                       pulses represent mostly excitatory neuronal activity (Li et al.
Statistical Analysis                                                   2019). Based on our frequency-dependent neuronal data, we
                                                                       chose frequencies of 1 and 20 Hz to modulate excitatory and
All time courses and bar graphs in this study are presented as         inhibitory neuronal activity in further studies.
mean values and standard errors of the mean (SEMs). Statistical            Next, we compared the changes in neuronal activity modu-
tests were conducted by paired t-test for two sets or one-way          lated by sensory (forepaw) stimulation and optogenetic stimu-
repeated analysis of variance (ANOVA) with the Bonferroni post-        lation targeting excitatory or inhibitory neurons. Channel-wise
hoc test to quantify the statistical significance of multiple com-     MUA time series in response to forepaw 4-Hz, CaMKII 20-Hz, and
parisons (P < 0.05 was considered to be statistically significant).

                                                                                                                                                Downloaded from https://academic.oup.com/cercor/article/31/9/4053/6248484 by guest on 28 September 2021
                                                                       VGAT 20-Hz stimulation are shown in Figure 3A–C. Forepaw and
                                                                       excitatory stimulation-induced MUA increases in every channel
Results                                                                (Fig. 3A,B). However, inhibitory stimulation-induced increased
                                                                       activity in the upper channels (Ch 1–8) and decreased activity in
Confirmation of ChR2 Expression                                        the deeper channels (Ch 9–16; Fig. 3C), likely due to differential
and Fiber Implantation                                                 contributions from the excitation of inhibitory neurons and sup-
We first verified ChR2 expression in the S1FL area after inject-       pression of excitatory neurons. Therefore, we separated the MUA
ing AAV5-CaMKIIα-hChR2(H134R)-EYFP. A fluorescence image               responses into two components, pulse and interpulse spikes
showed yellow fluorescence (EYFP) locally in the right S1FL            (Fig. 3C; right panels). Clearly, during 20-Hz optogenetic stimu-
(Fig. 1D), which exhibited a pattern similar to that found in          lation in VGAT-ChR2 mice, an increase and a decrease in MUA
a previous study (Watakabe et al. 2015). The location of the           were visible in the pulse and interpulse periods, respectively.
implanted fiber cannula was confirmed in MR images, T2 ∗ -                 When the responses from all channels were averaged,
weighted anatomical (FLASH), and functional images (EPI), from         the forepaw and CaMKII 20-Hz responses exhibited a clear
the same animal. The tip of the fiber was placed at a depth            increase in spike frequency (Fig. 3D,E), whereas the VGAT 20-
of 500 μm, as confirmed in the FLASH image (Fig. 1E). In the           Hz response was somewhat ambiguous (Fig. 3F, black line).
EPI image, the depth and size of the fiber were overestimated          During stimulation, changes in MUA were 30.50 ± 3.27 spikes/s
because of EPI-induced blurring effects (Fig. 1F), but our high-       for the forepaw (n = 5), 35.58 ± 6.54 spikes/s for CaMKII 1 Hz
quality images of mouse brains with fiber implantation demon-          (n = 3), 59.85 ± 13.30 spikes/s for CaMKII 20 Hz (n = 3), −4.55 ± 1.04
strated that BOLD responses can be obtained in the S1FL without        spikes/s for VGAT 1 Hz (n = 5), and −4.51 ± 3.36 spikes/s for
significant image distortions.                                         VGAT 20 Hz (n = 5; Fig. 3G). The VGAT 1- and 20-Hz stimulations
                                                                       (Fig. 3H) did not make much difference in the total number of
                                                                       evoked spikes, but 20-Hz optogenetic stimulation-induced more
Characterization of MUA Activity in Response
                                                                       spikes during the pulse period (12.83 ± 2.76 spikes/s for 20 Hz
to Optogenetic Stimulation of Inhibitory and Excitatory
                                                                       vs. 3.86 ± 1.19 spikes/s for 1 Hz; P = 0.0074, paired t-test) and
Neurons and Forepaw Stimulation                                        fewer spikes during the interpulse period than 1-Hz stimulation
Electrophysiological recordings were made in the S1FL of               (−20.88 ± 2.88 spikes/s for 20 Hz vs. −8.46 ± 1.28 spikes/s for
VGAT-ChR2-EYFP mice, and all data from 16 channels (at a               1 Hz; P = 0.0024, paired t-test; Fig. 3H). Together with the results
depth of 200–950 μm) were averaged to determine the general            from CaMKII-ChR2 stimulation, these results indicate that
property of frequency dependency. During 10 s of optogenetic           optogenetic stimulation at a higher frequency elicits a larger
stimulation of GABAergic neurons, spontaneous spike activity           neuronal response.
was suppressed by repeated 20-Hz 10-ms light pulses (Fig. 2A;
blue background period), though spikes with smaller amplitudes
                                                                       BOLD fMRI Responding to Optogenetic Stimulation
appeared (Fig. 2A). Spikes were evoked in response to each light
                                                                       of Inhibitory and Excitatory Neurons and Forepaw
pulse (red trace) with a few milliseconds of delay, and they were
suppressed after the light pulse ended (Fig. 2B).
                                                                       Stimulation
   To observe the temporal pattern of neuronal activity between        Based on the neuronal activity findings, we obtained BOLD fMRI
optogenetic light pulses in detail, group-averaged MUA data            signals at 15.2 T. Although our stimulation protocol did not
from 4 mice were obtained for averaged segments from one               induce any significant BOLD signals at the site adjacent to the
pulse onset to the next pulse onset for each optogenetic stimula-      light stimulus in wild-type naive mice (Supplementary Fig. 1),
tion frequency (Fig. 2C). Regardless of frequency, the evoked MUA      20-Hz light stimulation elicited robust BOLD responses at the
peaked at 5–7 ms after the pulse onset and then adapted rapidly.       lateral geniculate nuclei (LGd and LGv; Fig. 4A, ROI), which
Spike activity diminished to slightly below the prestimulus base-      are involved in the visual pathway, in both hemispheres
line level with a pulse duration of 50–200 ms (blue background         (Fig. 4A, Control). These stimulation-induced artifacts were
in Fig. 2C; 1–4 Hz). After the pulse ended, neuronal activity          also observed with 20-Hz optogenetic stimulation. Group BOLD
decreased slowly to close to zero (see the right panel in Fig. 2C      fMRI maps were obtained for 20-Hz optogenetic stimulation of
for an expanded view of the postpulse period), implying that           VGAT-ChR2 (n = 5) and CaMKII-ChR2 mice (n = 5) and for forepaw
spontaneous spike activity (likely excitatory activity) was sup-       stimulation (n = 5). In general, 20-Hz optogenetic stimulation of
pressed completely while the light was on. Spike activity started      excitatory neurons induced a strong positive BOLD response
to rebound noticeably ∼50 ms after the pulse ended (see blue           at the stimulation site and ipsilateral downstream sites (Fig. 4A,
arrows in the right panel of Fig. 2C), so MUA did not recover to the   Excitatory), whereas 20-Hz optogenetic stimulation of inhibitory
Excitatory versus Inhibitory Activity to fMRI Moon et al. 4059
Downloaded from https://academic.oup.com/cercor/article/31/9/4053/6248484 by guest on 28 September 2021
Figure 2. Stimulation frequency-dependent neuronal activity changes via optogenetic stimulation of VGAT-expressing inhibitory neurons. (A) A representative MUA
time course with 20-Hz optogenetic stimulation. The blue shade indicates the stimulation period, and the section between the red dashed lines was expanded for
better visualization of MUA activity with each light pulse (red trace) in (B). Appearance of negative skewed neural activity during the stimulation period (blue shade in
A) is due to increased inhibitory neuronal activity (red trace in B). (C) Mean MUA responses (averaged across all channels; n = 4 mice) modulated by different stimulation
frequencies, represented as red solid lines, each of which shows one pulse period from the onset of one stimulus to the onset of the next stimulus. The blue shade
here represents the single stimulus pulse period for each condition, and the black dashed horizontal line is the mean baseline spike activity. The right panel shows
only the poststimulus period (indicated by yellow lines) for better visualization of neuronal activity recovery. Blue arrows: time of MUA recovery. In the case of 1 Hz,
an arbitrary duration within the postpulse period was omitted.
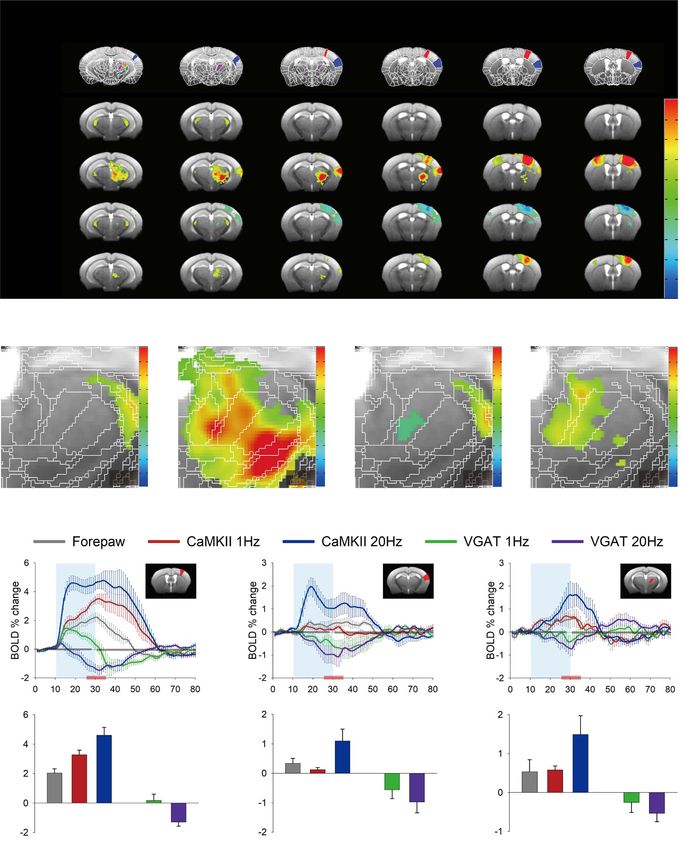
neurons resulted in negative responses in the somatosensory Time courses were extracted from three anatomical ROIs that
network (Fig. 4A, Inhibitory). Electrical forepaw stimulation are commonly activated by forepaw and optogenetic stimula-
elicited positive BOLD responses in the somatosensory network tion: S1FL, S2, and PO (Fig. 4C). In general, in S1FL, a directly
(Fig. 4A, Forepaw), which is consistent with our previous stimulated region, forepaw and CaMKII stimulation elicited pos-
mouse fMRI study (Jung et al. 2019). Optogenetic stimulation of itive BOLD responses in the ROIs (Fig. 4C, top panels). Mean-
excitatory neurons at 20 Hz elicited analogous activation sites, while, VGAT stimulation elicited a distinct biphasic response.
but they were higher and more extended than those seen with The initial positive response was more prominent at 1 Hz than
forepaw stimulation (Fig. 4A, Forepaw and Excitatory). at 20 Hz, and 1-Hz stimulation showed a delayed negative BOLD
To better visualize the activation sites of the BOLD responses, response, whereas the 20-Hz stimulation induced a negative
the thalamic region was expanded (Fig. 4B). Notably, stimulation BOLD peak around the time the stimulus ended. Since MUA
of excitatory neurons evoked broad responses in the subcortical showed a clear difference between superficial and deep lay-
area, including the lateral and ventral groups of the thalamus ers, cortical depth-dependent BOLD responses to VGAT-ChR2
and zona incerta, which have anatomical connections with the stimulation were also obtained (Supplementary Fig. 2). However,
S1FL in rodents (Zakiewicz et al. 2014). A response in the ventral the BOLD responses did not exhibit any depth dependency, and
posterior complex was prominent with excitatory neural stim- thus, S1FL ROI data were used for further analyses. In S2 and
ulation but was barely detected in other conditions; forepaw PO, which are projection sites from S1FL, positive and negative
stimulation-induced activity in the medial and posterior groups responses were observed with forepaw/CaMKII-ChR2 and VGAT-
of the thalamus, including PO. ChR2 stimulation, respectively.4060 Cerebral Cortex, 2021, Vol. 31, No. 9
Downloaded from https://academic.oup.com/cercor/article/31/9/4053/6248484 by guest on 28 September 2021
Figure 3. Neuronal activity induced by sensory and optogenetic stimulation of excitatory or inhibitory neurons. (A–C) Depth-dependent MUA responses measured by
the 16-channel electrode, and (D–F) averaged MUA responses across channels evoked by forepaw (A and D), excitatory (CaMKII, B and E), and inhibitory (VGAT, C and
F) optogenetic stimulation. In (C), MUA activity in the pulse and interpulse periods is separately shown in the right panel, and the averaged mean time courses (n = 5
animals) are plotted in (F). (G) Change in MUA during the 20-s stimulation period for each condition. (H) Changes in Total, Pulse, and Interpulse spike activity induced
by inhibitory (VGAT) 1- and 20-Hz stimulation. Error bars, SEM; ∗ , P < 0.05; ∗∗ , P < 0.01; ∗∗∗ , P < 0.001; n.s., not significant (one-sample t-test in G); ++, P < 0.01; n.s., not
significant (paired t-test in H).
To quantitatively compare BOLD responses, the mean Investigation of a Distinctive Biphasic Response
amplitude of the 10-s block centered at the stimulus end when to VGAT Stimulation
the peak occurred in most cases was calculated (Fig. 4C, bottom
Our BOLD fMRI on VGAT-ChR2 mice displayed a distinctive
panels). In S1FL, forepaw stimulation elicited a smaller response
biphasic response that was not reported in previous optical
than CaMKII stimulation, and 20 Hz induced a greater response
imaging studies that stimulated VGAT-expressing neurons
than 1 Hz (2.04 ± 0.30% for forepaw; 3.29 ± 0.30% for CaMKII
(Anenberg et al. 2015; Uhlirova et al. 2016; Vazquez et al. 2018;
1 Hz; 4.60 ± 0.54% for CaMKII 20 Hz). In S2 and PO, the CaMKII
Krawchuk et al. 2020). To examine whether the difference
1 Hz and forepaw responses were comparable, and CaMKII
between the BOLD and OIS data was due to different depth
20 Hz had the greatest response (S2: 0.34 ± 0.17% for forepaw,
contributions or duration-dependency, CBV (530 nm)- and
0.13 ± 0.07% for CaMKII 1 Hz, and 1.09 ± 0.40% for CaMKII 20 Hz;
BOLD (625 nm)-weighted OISI was measured with two different
PO: 0.53 ± 0.31% for forepaw, 0.57 ± 0.10% for CaMKII 1 Hz, and
stimulus durations, 5 and 20 s. Optogenetic stimulation of
1.49 ± 0.48% for CaMKII 20 Hz). The VGAT responses in the
inhibitory neurons initially induced increases in CBV (negative
projection sites decreased, and the 20 Hz response was larger
reflectance) and BOLD (positive reflectance) at the stimulation
than the 1 Hz response, albeit without statistical significance
site (5-s time in Fig. 5A,B). Then, the response to 1-Hz stimulation
(S2: −0.56 ± 0.30% for VGAT 1 Hz and −0.97 ± 0.37% for VGAT
remained local, whereas the response to 20-Hz stimulation
20 Hz; PO: −0.25 ± 0.26% for VGAT 1 Hz and −0.53 ± 0.22% for
spread to almost entire the hemisphere with reversing polarity
VGAT 20 Hz).
(darkening to whitening in CBV-weighted OIS and vice versa inExcitatory versus Inhibitory Activity to fMRI Moon et al. 4061
Downloaded from https://academic.oup.com/cercor/article/31/9/4053/6248484 by guest on 28 September 2021
Figure 4. BOLD fMRI responses evoked by somatosensory and optogenetic stimulation. (A) ROIs defined based on the Allen Mouse Brain Atlas, and 15.2 T BOLD activation
maps from the control opto-fMRI experiment, 20-Hz excitatory and inhibitory optogenetic stimulation, and forepaw stimulation are shown (n = 3 for control and 5 for
each conditions). Activation maps were overlaid on the custom-made brain template. Scale bar: 2 mm. (B) Expanded maps in the subcortical area marked by red dashed
boxes in (A). Scale bar: 0.5 mm. (C) Time courses extracted from three selected ROIs (top panel), and mean BOLD responses during the 5 s before and after the stimulus
end time (bottom panel; indicated as red horizontal lines in the time course panel). Error bars: SEM (n = 5). Repeated measures ANOVA (∗ , P < 0.05; ∗∗ , P < 0.01) with
Bonferroni post-hoc analysis or paired t-test (++, P < 0.01) was performed. S1FL, primary somatosensory area, upper limb; S2, supplementary somatosensory area;
MH, medial habenula; LH, lateral habenula; MD, mediodorsal nucleus of thalamus; DG, dentate gyrus; CL, central lateral nucleus of the thalamus; VM, ventral medial
nucleus of the thalamus; LP, lateral posterior nucleus of the thalamus; PO, posterior complex of the thalamus; VPM, ventral posteromedial nucleus of the thalamus;
VPL, ventral posterolateral nucleus of the thalamus; ZI, zona incerta; LGd, dorsal part of the lateral geniculate complex; LGv, ventral part of the lateral geniculate
complex; RT, reticular nucleus of the thalamus.4062 Cerebral Cortex, 2021, Vol. 31, No. 9
Downloaded from https://academic.oup.com/cercor/article/31/9/4053/6248484 by guest on 28 September 2021
Figure 5. CBV-weighted and BOLD-weighted OIS measurements with VGAT-ChR2 stimulation. (A and B) Time-dependent 530-nm CBV-weighted (A) and 625-nm BOLD-
weighted OIS images (B) in response to 20-s optogenetic stimulation of VGAT-ChR2 in one representative animal (gray bar: ΔR/R). Location of the fiber optic and red
c-shaped ROI overlaid on the baseline image are shown in the left panel, and the red time stamps indicate stimulation duration. A small bright spot in 20-Hz stimulation
OISI is caused by the stimulus-induced light leakage artifact (see Supplementary Fig. 3). (C–E) Averaged time courses (n = 5) of HbT (C), HbO (D), and HbR (E) OISI induced
by 20- and 5-s stimulation (inset). Blue shade, stimulation period.
BOLD-weighted OIS; Fig. 5A,B). Light artifact was observed at the showed a negative phase (Fig. 6A, black line in Estimated HRF),
optogenetic stimulation site (bright spots for 20-Hz stimulation), indicating that a single MUA was insufficient to predict the
and its contribution was corrected in OIS time courses obtained BOLD responses. On the other hand, the 2-HRF model provided
from the c-shape ROI, based on control experiments (see a better prediction of the original BOLD response. Although the
Supplementary Fig. 3 for details). inhibitory and excitatory MUA responses were larger with a 20-
CBV- and BOLD-weighted OIS time courses were converted Hz stimulation, the predicted excitatory hemodynamic response
into HbT, HbO, and HbR changes (Fig. 5C–E). In 20-s stimulation was comparable for both frequencies, and the predicted
data, increases in HbT and HbO for 1-Hz stimulation were turned inhibitory hemodynamic response was much smaller at 20 Hz.
into biphasic responses (initial increase followed by decrease) The excitatory HRF for 1-Hz VGAT-ChR2 stimulation had a
for 20-Hz stimulation (Fig. 5C,D). The HbR response exhibited a similar shape, but it was ∼2 times larger in magnitude than
decrease during the 20-s stimulation period followed by a post- that with 20-Hz stimulation (Supplementary Fig. 4C). However,
stimulus overshoot for 1-Hz stimulation, and an initial decrease the inhibitory HRF from a 1-Hz VGAT-ChR2 stimulation has a
right after the stimulus onset followed by an increase during biphasic shape and is ∼20 times larger in magnitude than that
the stimulation period for 20-Hz stimulation (Fig. 5E), which are of 20-Hz stimulation (Supplementary Fig. 4B). Besides, the time
consistent with BOLD fMRI, in the opposite polarity (Fig. 4C). to peak of the inhibitory HRF precedes that of the excitatory HRF,
In contrast, with 5-s stimulation, HbT, HbO, and HbR response which is highly important potentially for explaining BOLD fMRI
exhibited a monotonic increase or decrease at both frequen- responses. The predicted HRFs of HbR also displayed the same
cies (Insets in Fig. 5C–E). For both stimulus durations, the 1- features as that of BOLD but with reversed polarity as expected
Hz response was larger, more positive, and lasted longer than (Fig. 6B).
the 20-Hz response. Our OIS data show that stimulus duration
is a key determinant of the hemodynamic response shape,
especially for 20-Hz optogenetic stimulation of VGAT-ChR2 mice. Discussion
Using multimodal measurements with electrophysiology,
BOLD fMRI, and OISI, we found several important issues
The HRF of Excitatory and Inhibitory Neuronal Activity
associated with neurovascular coupling, especially when
To obtain insights into the BOLD and OIS responses, HRFs inhibitory neurons are selectively activated. First, activation
were modeled from the measured MUA response. When of excitatory neurons via sensory and optogenetic stimulation
HRFs from the BOLD responses to forepaw and CaMKII induces positive BOLD responses with increased MUA, whereas
stimulation were obtained from the 1-input/1-HRF model activation of inhibitory neurons elicits a biphasic BOLD response
(Supplementary Fig. 4A), the excitatory HRFs showed similar at the stimulated site, with increased inhibitory and decreased
amplitudes and patterns with variations of response width. excitatory activity. Second, the magnitude and polarity of hemo-
However, when the 1-input/1-HRF model was used for VGAT- dynamic responses at the stimulated site closely depend on the
ChR2 mice, the HRF obtained from VGAT 1-Hz stimulation stimulation frequency and duration. Third, the response ofExcitatory versus Inhibitory Activity to fMRI Moon et al. 4063
Downloaded from https://academic.oup.com/cercor/article/31/9/4053/6248484 by guest on 28 September 2021
Figure 6. Estimation of the HRF by deconvolution of MUA from the BOLD and the HbR response. HRFs were generated in two ways: 1) one HRF (1 input HRF; black
line) was generated from 1 MUA input (Total; black line), and 2) two HRFs (2 input HRF Inhibitory, light blue; 2 input HRF Excitatory, orange) were generated from 2
MUA inputs (Pulse and Interpulse). For 2 HRFs, the estimated BOLD (A) and HbR (B) responses are shown separately as the inhibitory component (Est BOLD/HbR 2HRF
Inh; convolution of pulse MUA and 2 input HRF Inh), and excitatory component (Est BOLD/HbR 2HRF Exc; convolution of inter-pulse MUA and 2 input HRF Exc). In the
rightmost panel, the estimated and measured BOLD responses are plotted together. Est BOLD/HbR 1HRF is the same as that in the third column; Est BOLD/HbR 2HRF
is an addition of 2HRF Inh and Exc in the third column. The coefficient of determination R2 : 0.9562 (1 Hz 1HRF), 0.9866 (1 Hz 2HRF), 0.8961 (20 Hz 1HRF), and 0.9269
(20 Hz 2HRF) for BOLD; 0.8157 (1 Hz 1HRF), 0.9345 (1 Hz 2HRF), 0.8659 (20 Hz 1HRF), and 0.846 (20 Hz 2HRF) for HbR.
deoxyhemoglobin content measured by OISI closely resembles Thy1-ChR2 mice (Kahn et al. 2011); hemodynamic responses to
that of BOLD fMRI. Fourth, hemodynamic responses to inhibitory excitatory neural stimulation correlated to spiking activity more
neuronal activity can be explained by a combination of fast strongly than to change in local field potential (LFP) (Ji et al.
inhibitory HRF and slightly slower excitatory HRF. Overall, we 2012; Kahn et al. 2013); and BOLD response functions in the rat
provide insights into the neurovascular coupling properties of somatosensory cortex were similar upon forepaw stimulation
excitatory and inhibitory neurons. and optogenetic stimulation of excitatory cells (Iordanova et al.
2015). Measured BOLD fMRI was compared with calcium activity
during optogenetic stimulation of excitatory neurons (Schmid
Optogenetic fMRI of Excitatory or Inhibitory Neurons
et al. 2016), and the dynamics of fMRI responses were exam-
Optogenetic fMRI (opto-fMRI) has opened a new window to ined with optogenetic stimulation (Yu et al. 2016). Our BOLD
examine cell-type-specific neural circuits and neurovascular fMRI studies of CaMKII-ChR2 mice showed extensive functional
coupling in the cortex and throughout the brain (Lee et al. 2010; connections from the primary somatosensory cortex due to the
Desai et al. 2011). However, most studies have been restricted to increased sensitivity of the 15.2 T scanner (Fig. 4), which sup-
the BOLD responses initiated by excitatory neural stimulation, ports many previous studies of optogenetic fMRI obtained at 7.0–
whereas opto-fMRI in response to stimulation of other neuronal 11.7 T in response to the stimulation of excitatory cells (Lee et al.
types is somewhat limited. Initially, Desai et al. (2011) inves- 2010; Desai et al. 2011). Optogenetic fMRI scans were performed
tigated the effects of anesthesia using opto-fMRI of CaMKII- during the stimulation of inhibitory neurons in the GABAergic
ChR2 mice at 9.4 T and found that anesthesia with 0.7% isoflu- neuron-dominant striatum, and positive BOLD responses at the
rane reduced BOLD activity by about 3 times compared with stimulated site were found (Bernal-Casas et al. 2017). However, to
the awake condition (Fig. 4 in Desai et al.). Afterward, stud- the best of our knowledge, there is no previous opto-fMRI report
ies proceeded to the characteristics of the response: the BOLD investigating the effect of inhibitory neurons on BOLD fMRI in
response had temporal linearity to optogenetic stimulation in the cortex, where excitatory neurons are dominant.4064 Cerebral Cortex, 2021, Vol. 31, No. 9
Characterization of the Neuronal Response data under ketamine/xylazine anesthesia, which is likely due to
Evoked by Activating GABAergic Neurons the use of α2-adrenergic agonist xylazine. When a 20-s train of
100-ms pulses at 1 Hz was applied to VGAT-ChR2, CBV increased
To examine neurovascular coupling properties, it is necessary to
quickly and reached a steady-state, and then, it decreased below
measure neuronal activity. According to the previous literature,
the baseline after the stimulus ended (see Supplementary Fig. 4
hemodynamic responses induced by sensory stimulation
in Desjardins et al. 2019), which is reasonably similar to our OIS
correlate better with the LFP than MUA (Logothetis et al. 2001),
and BOLD data in response to 1-Hz optogenetic stimulation.
whereas those induced by optogenetic stimulation can be better
An important observation in our studies is that deoxy-
explained by MUA than by LFP activity (Ji et al. 2012; Kahn et al.
hemoglobin OIS changes and BOLD fMRI responses to VGAT
2013). Therefore, we measured MUA with a depth electrode at
optogenetic stimulation remarkably resemble each other at both
the stimulated site (S1FL). Across the cortical depth, a rapid
stimulation frequencies. Oxyhemoglobin and total hemoglobin
increase in MUA was followed by slow adaptation during a
response curves are also similar to that of deoxyhemoglobin
20-s optogenetic stimulation of CaMKII-ChR2 mice, whereas
responses with the opposite polarity (see Fig. 5). This suggests
sustained MUA was observed during forepaw stimulation (Fig. 3).
Downloaded from https://academic.oup.com/cercor/article/31/9/4053/6248484 by guest on 28 September 2021
that hemodynamic findings with optical imaging tools are
Optogenetic stimulation of VGAT-expressing interneurons
directly translatable to BOLD fMRI. When HRFs were determined
showed depth-dependent responses: an increase in MUA at
from MUA and hemodynamic responses to VGAT optogenetic
the upper cortical layers close to the optogenetic stimulation
stimulation, inhibitory HRF peaks earlier than excitatory HRF for
light source and a decrease at the lower cortical layers (Fig. 3).
both frequencies. Inhibitory HRF of 1-Hz stimulation has a large
This depth-dependent observation is consistent with responses
positive component followed by a negative response, while that
to optogenetic stimulation of somatostatin (SOM)-expressing
of 20-Hz stimulation has a much less positive response without
inhibitory neuron ChR2 mice (Lee, Boorman et al. 2020).
a negative change. The large difference in inhibitory HRFs for 1-
When VGAT-expressing interneurons are activated by
versus 20-Hz stimulation could be due to different contributions
optogenetic stimulation, cortical interneurons induce action
from different sub-types of GABAergic neurons, which could be
potentials that prevent nearby cells from producing sponta-
altered by different stimulation frequencies.
neous activity, which was confirmed by current-clamp recording
According to brain slice studies (Cauli et al. 2004), nitric oxide
(Zhao et al. 2011) and single-unit recording (Guo et al. 2014;
(NO) and vasoactive intestinal polypeptide (VIP) neurons dilate
Li et al. 2019). To understand how inhibitory neurons affect
microvessels, and neuropeptide Y (NPY) and SOM-expressing
hemodynamic responses, inhibitory and excitatory neuronal
neurons constrict vessels. Recently, the effects of sub-types
activity must be separated. When cortical depth-dependent
of interneurons on neurovascular regulation have been exam-
MUA was separated into pulse and interpulse periods (Fig. 3C),
ined in vivo. More specifically, among the sub-types of GABAer-
increases in inhibitory activity and concomitant decreases in
gic neurons, 1) NOS-expressing neurons are a key component
excitatory activity were consistently observed across the cortical
responsible for vasodilation (Vazquez et al. 2018; Krawchuk et al.
depth, suggesting that our approach for separating excitatory
2020), and 2) the activation of VIP-expressing neurons does not
and inhibitory activity is reasonable. We averaged neuronal
change blood flow (Krawchuk et al. 2020). On the other hand,
activity across all channels to correlate it with the BOLD fMRI
3) NPY has been shown to induce vasoconstriction (Uhlirova
data because the tip of the fiber optic for optogenetic stimulation
et al. 2016). 4) SOM-expressing neurons were reported to produce
was located at a different depth (the surface of the cortex
a biphasic hemodynamic response (Krawchuk et al. 2020; Lee,
for electrophysiology vs. middle of the cortex for fMRI), and
Boorman et al. 2020) that consisted of an initial CBF increase and
the BOLD response is considered not to have cortical laminar
poststimulus undershoot. Because SOM neurons also express a
specificity as shown in our data (see Supplementary Fig. 2).
variety of molecular markers, including NOS and NPY (Perre-
noud et al. 2012; Yavorska and Wehr 2016), the biphasic hemo-
dynamic response can be explained by the possibility that early
Hemodynamic responses of GABAergic neurons
vasodilation by NOS is followed by late vasoconstriction by NPY.
The activity of GABAergic neurons is known to induce a hemo- 5) Parvalbumin (PV) neurons, the most abundant GABAergic
dynamic response by releasing diverse vasoactive substances neurons in the cortex (Rudy et al. 2011), are assumed to have
(Cauli et al. 2004; Cauli and Hamel 2010). Due to advances indirect influence through the inhibition of pyramidal cells,
in optogenetics, the effect of inhibitory neurons on vascular resulting in vasoconstriction (Urban et al. 2012; Lee, Stile, et al.
responses has been examined in vivo using optical imaging 2021), although their exact contribution is complicated by the
and laser Doppler flowmetry. The initial studies attempted to use of different anesthesia in different studies (Dahlqvist et al.
modulate all sub-types of interneurons with optogenetic stimu- 2020; Lee, Stile et al. 2021). Our observation of negative BOLD
lation of VGAT-ChR2 (Anenberg et al. 2015; Uhlirova et al. 2016; responses during 20-Hz optogenetic stimulation of VGAT-ChR2
Vazquez et al. 2018; Krawchuk et al. 2020); 100-Hz stimulation for is somewhat similar to that of deoxyhemoglobin changes to 20-
1 s induced an increase in CBF without causing glutamatergic Hz optogenetic stimulation of PV interneurons (Lee, Stile et al.
synapsing (Anenberg et al. 2015); 5-Hz stimulation for 4 s sim- 2021). To find out the exact cause of the frequency dependency,
ilarly induced increases in CBF and CBV (Vazquez et al. 2018); further studies with mouse models for specific interneuron
and a single light pulse (150–400 ms duration) on VGAT-ChR2 sub-types are warranted.
induced a biphasic arterial vessel response: initial dilation with The projection sites from S1FL showed negative BOLD
later constriction (Uhlirova et al. 2016). These positive CBV and responses when inhibitory neurons were active. Considering
CBF responses during short optogenetic stimulation of VGAT- that most GABAergic neurons have local axonal projections,
ChR2 are consistent with our 5-s OIS data (Fig. 5). Note that our except for a few long-range projecting GABAergic neurons in
previous optogenetic stimulation of VGAT-ChR2 with 5 Hz under the mouse brain (Tamamaki and Tomioka 2010), the reduction
ketamine anesthesia (Vazquez et al. 2018) induces slightly pro- in the output spiking activity of excitatory neurons in S1FL
longed CBV response compared with current 1-Hz stimulation reduces synaptic input to downstream sites, which can beYou can also read