Drivers and constraints on offshore foraging in harbour seals - Nature
←
→
Page content transcription
If your browser does not render page correctly, please read the page content below
www.nature.com/scientificreports
OPEN Drivers and constraints on offshore
foraging in harbour seals
H. M. Vance1*, S. K. Hooker1, L. Mikkelsen3, A. van Neer2, J. Teilmann3, U. Siebert2 &
M. Johnson4
Central place foragers are expected to offset travel costs between a central place and foraging areas
by targeting productive feeding zones. Harbour seals (Phoca vitulina) make multi-day foraging trips
away from coastal haul-out sites presumably to target rich food resources, but periodic track points
from telemetry tags may be insufficient to infer reliably where, and how often, foraging takes place.
To study foraging behaviour during offshore trips, and assess what factors limit trip duration, we
equipped harbour seals in the German Wadden Sea with high-resolution multi-sensor bio-logging
tags, recording 12 offshore trips from 8 seals. Using acceleration transients as a proxy for prey capture
attempts, we found that foraging rates during travel to and from offshore sites were comparable to
offshore rates. Offshore foraging trips may, therefore, reflect avoidance of intra-specific competition
rather than presence of offshore foraging hotspots. Time spent resting increased by approx. 37 min/
day during trips suggesting that a resting deficit rather than patch depletion may influence trip length.
Foraging rates were only weakly correlated with surface movement patterns highlighting the value
of integrating multi-sensor data from on-animal bio-logging tags (GPS, depth, accelerometers and
magnetometers) to infer behaviour and habitat use.
Central place foragers must access food resources that compensate the cost of travel between feeding areas and
the central place. As travel distance increases, extra energy must be obtained by either foraging for longer or
by targeting sites with denser or richer p rey1. The need to access rewarding food resources can drive aquatic
central place foragers, such as pinnipeds, to make lengthy trips away from coastal haul-out sites. Ross seals
(Ommatophoca rossii) and southern elephant seals (Mirounga leonina) famously travel 1000’s of km in multi-
month foraging t rips2,3. Antarctic fur seals (Arctocephalus gazella) that travel to more distant patches have more
high-energy prey in their diet than those foraging closer to their haul-out sites4. Likewise, distance travelled
during foraging trips is positively correlated with estimated mass gain in male northern elephant seals (Mirounga
angustirostris), indicating that travel costs are more than recouped by energetic returns5.
Harbour seals (Phoca vitulina) are primarily a coastal species but also travel offshore for days at a time,
often journeying > 100 kms from haul-out s ites6–8. However, some individuals target resources closer to the
haul-out6,8,9, raising the question: why do some individuals accept the extra travel costs associated with foraging
further offshore? Indeed, it has been suggested that some populations, such as the Wadden Sea harbour seals,
feed almost exclusively at offshore sites suggesting that these sites provide a resource which is not available closer
to the haul-out6,8,10,11.
The Wadden Sea World Heritage Area (henceforth Wadden Sea), located off the north-west coasts of the
Netherlands, Germany and south-west Denmark, extends some 12 nautical miles into the North Sea. It is char-
acterised by a flat, mainly sandy seabed reaching depths of 10–20 m12 and is home to a regionally important
population of harbour s eals13. This shallow sea is fringed by tidal mudflats and a highly productive estuarine
habitat14. Although the apparent homogeneity of this environment seems at odds with the idea of rich offshore
prey patches that could attract harbour seals away from the coast and into the North Sea, fisheries research sug-
gests that the distribution of resources here may not be uniform. Coastal waters of the Wadden Sea are important
nursery grounds for prey species such as flatfish and sand eel15,16, with larger individuals moving offshore as
they mature. There has also been a shift in the distribution of fish assemblages into deeper water with increasing
sea temperatures17, suggesting that more and larger prey may be available offshore. Increased predation close to
haul-out sites may also reduce prey abundance around coastal sites. Such zones of depletion, known as Ashmole’s
halo18, have been observed around seabird colonies and drive predators further offshore to forage.
1
SMRU (Sea Mammal Research Unit), University of St Andrews, St Andrews, Fife KY16 8LB, UK. 2Institute for
Terrestrial and Aquatic Wildlife Research, University of Veterinary Medicine Hannover, Foundation, Werftstraße
6, 25761 Büsum, Germany. 3Marine Mammal Research, Department of Bioscience, Aarhus University, Roskilde,
Denmark. 4Aarhus Institute of Advanced Studies and Department of Biology, Aarhus University, Aarhus C,
Denmark. *email: hmv@st-andrews.ac.uk
Scientific Reports | (2021) 11:6514 | https://doi.org/10.1038/s41598-021-85376-2 1
Vol.:(0123456789)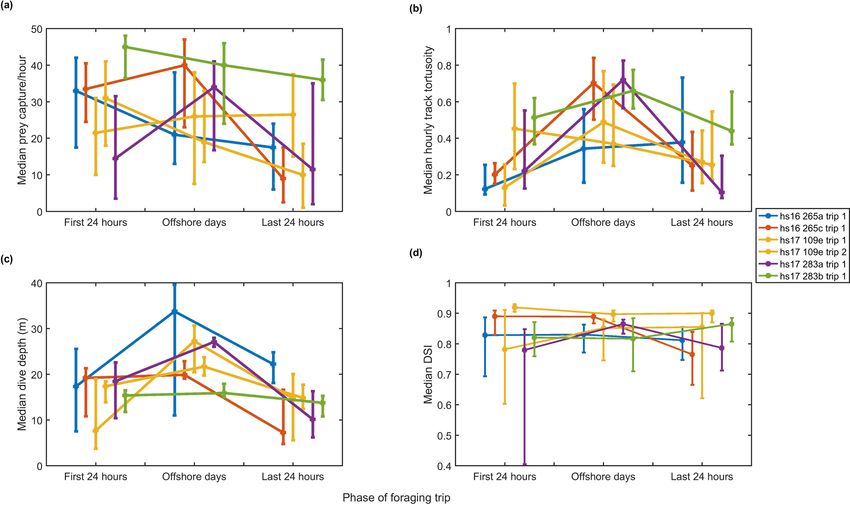
www.nature.com/scientificreports/
Optimal foraging models predict that animals travelling further should forage longer to recoup travel costs,
but trip length is likely constrained by other factors e.g., the need for sleep, digestion and/or social interaction.
Indeed, the haul-out must provide important resources for harbour seals for them to give up valuable foraging
opportunities having invested the costs of traveling offshore. However, as harbour seals are able to both rest and
digest whilst at sea19–22, it is unclear what factors limit the duration of these trips outside of the breeding and
moulting season. Thus, despite the ubiquity of harbour seals around populated northern European coastlines,
relatively little is known about what drives and constrains their offshore foraging.
Harbour seal behaviour has generally been studied with telemetry tags that transmit low-resolution dive depth
and position data over periods of months to years23. To infer intervals of foraging from these data, it is assumed
either that animals produce more tortuous surface tracks when foraging (i.e., by turning to remain within a prey
patch24, or that their dive profiles correspond to shapes which are suggestive of foraging e.g., U-shaped dives
imply more time invested in a presumed prey layer located at the base of the dive as compared to V-shaped dives
which may represent travel25. However, both metrics have limitations for classifying behaviours: U-shaped dive
profiles are obtained if an animal remains stationary on the bottom, such as during r esting21,22 and so can be
confused with foraging when using low resolution data. Likewise, infrequent location data risks under-sampling
tortuosity thereby placing a lower limit on the patch size that can be detected. For these and other reasons, e.g.,
inaccuracy of location data and insufficient validation of foraging indicators (for a review see Carter et al.23),
inferences based on low resolution data may not provide reliable information on activity budgets and foraging
rates. For harbour seals, behavioural categorisation based on telemetry data has received sparse independent
validation making it difficult to assess reliability. Dive shape behavioural categorisation, validated via stomach
temperature telemetry26 and video a nalysis27, has given mixed results. Lesage, Hammill and K ovacs26 suggest
that all dive shapes are employed during foraging while Baechler et al.27 found that dive shape was less reliable as
a foraging indicator for males in the breeding season. Behavioural inferences from surface tracks have yet to be
validated for harbour seals to the best of our knowledge. For another phocid, the southern elephant seal, several
studies have shown tortuosity of surface tracks to be a good predictor of foraging b ehaviour28,29, but one study
reported extensive foraging during both directed travel and intensive search modes30.
In recent years, archival multi-sensor bio-logging tags have been used increasingly to investigate fine-scale
behaviour of pinnipeds22. Low-power movement sensors, such as accelerometers and magnetometers can track
the orientation of animals as well as faster actions such as swim strokes and prey s trikes31–35. Accelerometers
have been employed on a number of pinniped species to detect prey capture a ttempts33,36,37 and sharp changes in
acceleration appear to be reliable indicators of both suction and raptorial feeding in harbour seals37, making this
a useful sensor to quantify foraging rates. Combining data from multiple sensors can provide a more definitive
picture of an animal’s fine-scale movements and the context within which they are p erformed8,38–40.
Here we use multi-sensor bio-logging tags, incorporating GPS, depth sensors, accelerometers and mag-
netometers to study offshore foraging in harbour seals of the Wadden Sea at a fine temporal and spatial scale.
Specifically we test the hypotheses that: (1) animals travel offshore to access rich foraging patches not available
closer to shore, (2) the need for rest influences the decision to return to the haul-out, and (3) low-resolution
location and dive data provide reliable inferences of foraging behaviour in harbour seals.
Results
Of the ten seals tagged, eight (three in 2016 and five in 2017) made 12 offshore foraging trips during 6–30 days
of individual tracking (Fig. 1a,b, Table 1). The two additional seals (both in 2017) remained inshore performing
only short foraging trips (< 1 day) and were thus excluded from analysis. In half of the offshore trips, tag record-
ings ended before the animal returned to the haul-out. Therefore, these were only analysed in part. Of the 6
complete foraging trips, from five individuals, the mean trip length was 7 days (SD 2.3 days). Over all trips, seals
performed a mean of 13 foraging dives per hour (SD 1.6) with an average duration of 3.3 min. Comparison with
local bathymetry indicated that the majority of dives were to the seabed, signifying benthic foraging (Fig. 1c).
Hypothesis 1 Harbour seals travel offshore to access rich prey resources.
As expected, the tracks of tagged seals showed intervals of largely straight-line travel as animals moved away
from, and back to, the coast (Fig. 1a,b). Once offshore, the tracks became more varied with intervals of strong
tortuosity (Figs. 1d and 2b). GPS outages occurred to the same extent during periods of travel as during offshore
periods indicating that these do not explain differences in tortuosity within foraging trips (Supplementary
Table S1). Despite the lower track tortuosity, median foraging rates inferred from jerk transients during 24-h
intervals encompassing travel to and from offshore sites were within the range of median foraging rates during
days spent offshore (Fig. 2a and Table 2). This suggests that the rate of foraging offshore is broadly comparable
to the rate of foraging during travel to and from foraging sites and that harbour seals are continuously foraging
even during what appears to be directed travel. This result is supported by harbour seals adopting a pitched-down
body posture at the bottom of dives in all trip phases consistent with prey searching (Fig. 3). Prey capture attempts
(PCAs) detected during the outward travel days alone were equivalent to 0.6–1.8 days of offshore foraging making
the travel days significant contributors to the total intake in the trip. PCA detection rates are influenced by the
blanking time chosen for the detector. This sets a trade-off between over-counting long interactions with single
prey versus under-counting rapid series of short prey encounters. Using a reduced blanking time (10 s instead
of 20 s) increased overall PCA rates but confirmed that foraging rates in travel days were comparable to those
during days spent offshore (Supplementary Fig S1).
Short dives that ended in an acceleration transient suggesting capture and surface handling of high-value prey
(HVP) were detected throughout foraging trips including travel days (Figs. 3 and 4a). Indeed, for most animals
Scientific Reports | (2021) 11:6514 | https://doi.org/10.1038/s41598-021-85376-2 2
Vol:.(1234567890)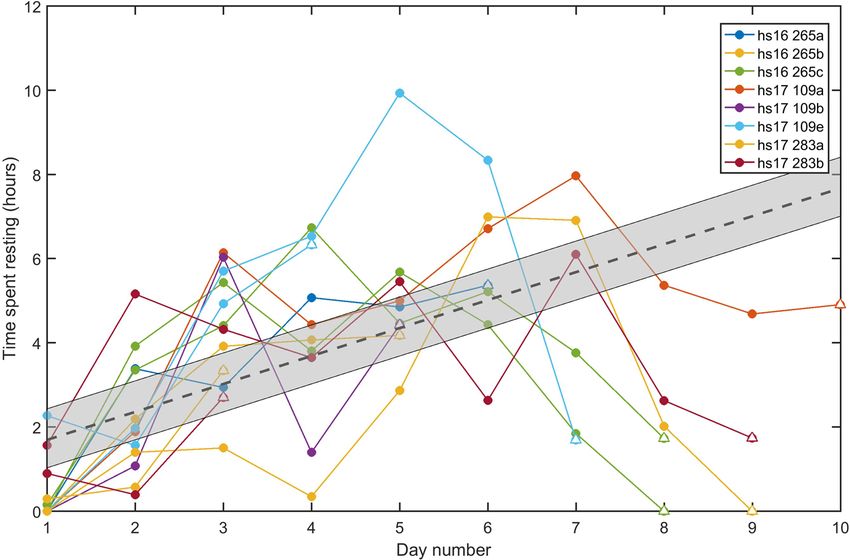
www.nature.com/scientificreports/
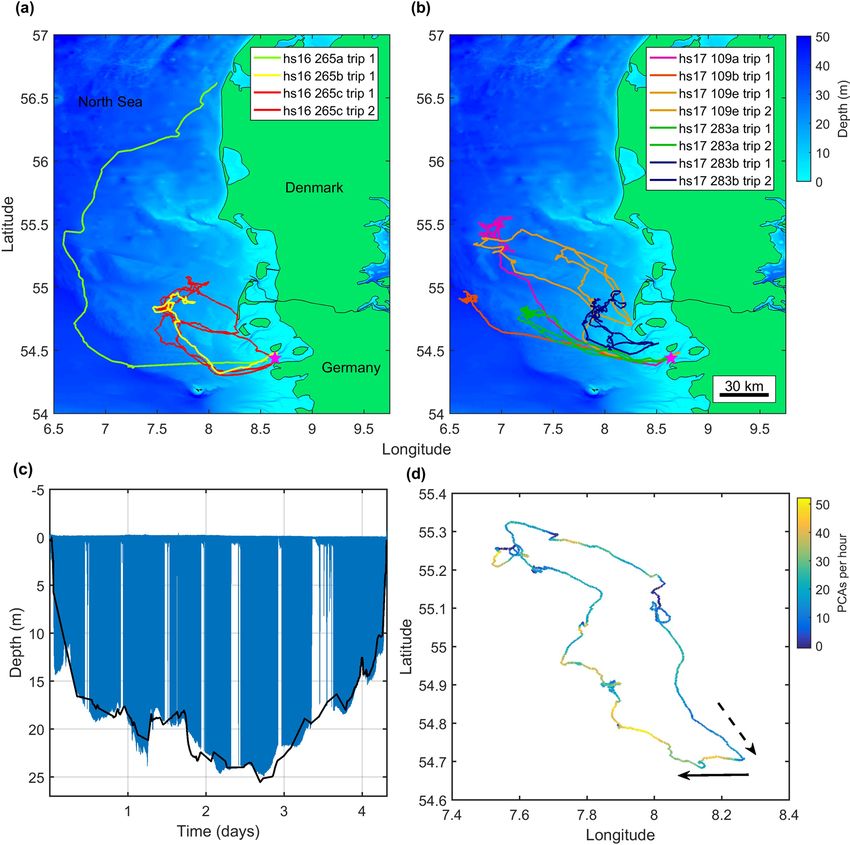
Figure 1. (a) GPS surface tracks of animals tagged in 2016. These represent 4 multi-day foraging trips by 3
individuals. One seal (hs16_265a) did not return to the same haul-out site but rather travelled north to Limfjord
in Denmark. (b) GPS surface tracks of animals tagged in 2017. These represent 8 multi-day foraging trips
performed by 5 animals. In six of these offshore trips (2016 and 2017), the tags stopped recording before the
seal returned to shore. The tagging site is represented in both (a) and (b) by a purple star. (c) Dive profile of
hs17_109e trip2 with the black line indicating bathymetry interpolated from www.emodnet.eu/bathymetry.
(d) Dead-reckoned horizontal track of hs17_109 trip 2, coloured by the hourly rate of presumed prey capture
attempts (PCAs), inferred from acceleration, showing continuous foraging during both straight-line travel to
and from offshore prey patches and during more tortuous movements while offshore. The continuous arrow
indicates the track of the animal moving away from the haul-out towards offshore areas, while the broken arrow
indicates the track of the animal returning to the haul-out.
the highest proportion of HVPs occurred in the last days of the trip including the return journey (Fig. 4b). To
control for potential bias in HVP counts due to shorter dives as animals approach shallower coastal waters dur-
ing return travel, we repeated this test excluding dives shallower than 10 m and found a similar result. Typically,
15–25 large prey captures were detected per day but considerably higher rates were found in two offshore trips
(hs17_109a trip 1: 115 HVPs/day and hs17_283b trip 1: 50 HVPs/day). While hs17_109a did not perform a
subsequent foraging trip with which to aid comparison, hs17_283b did not have similar success in their next
foraging trip indicating that perhaps larger prey have an unpredictable distribution or that seals do not target
them consistently.
The median distance made good between PCAs (i.e., the straight-line distance between PCA locations)
across all animals was 44.2 m. However, the inter-quartile range (IQR) for each animal was large, reflecting a
high variability in prey distribution (Table 1). The median distance travelled between prey encounters (i.e., the
sum of distances between samples in the dead-reckoned tracks) was 67.9 m also with a high IQR indicating
Scientific Reports | (2021) 11:6514 | https://doi.org/10.1038/s41598-021-85376-2 3
Vol.:(0123456789)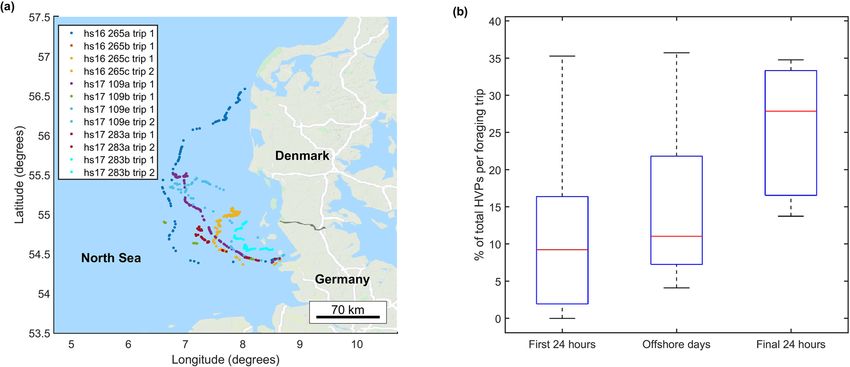
www.nature.com/scientificreports/

                                                                                                                                                            Median
                                                                                                                                                            distance
                                                                                                                                              Median        travelled
                                                                                                                                              distance      (m)
                                     No. offshore                 Length of                             Mean max                              made good     between
                                     foraging       Recording     foraging trip                         dive depth    Mean PCAs   Mean HVPs   (m) between   PCAs
           Animal I.D   Tagging date trips          length (days) (days)        Sex (m/f)   Age class   (m) (SD)      per day     per day     PCAs (IQR)    (IQR)
           hs16_265a    21-Sept-2016 1               6.4         6              m           Adult       25 (12.7)     566         28          64.8 (95.5)   82.7 (112.1)
           hs16_265b    21-Sept-2016 1i             23.2         >5             f           Adult       19.6 (5.3)    821         19          42.6 (41)     62 (60.4)
                                     1                           8                                      18.6 (5.7)    756         18          46.2 (44.2)   63.9 (74.4)
           hs16_265c    21-Sept-2016 ii             21.7                        f           Adult
                                     2                           >8                                     17.5 (5.6)    845         14          40.4 (36.7)   59 (66.2)
           hs17_109a    19-Apr-2017   1i            27.1         > 10           m           Adult       25.6 (9.2)    556         115         46 (61.6)     73 (78.3)
           hs17_109b    19-Apr-2017   1i            30.6         >5             m           Adult       33.1 (12.6)   390         10          45.7 (63.5)   80 (87.8)
                                      1                          7                                      20.3 (11.1    582         23          48.9 (58.6)   70.4 (77)
           hs17_109e    19-Apr-2017                 26.8                        m           Adult
                                      2                          4                                      18.4 (5.1)    508         14          50.2 (66.8)   75.3 (86.1)
                                      1                          9                                      22.4 (8.4)    628         17          39.3 (41.7)   66 (78.9)
           hs17_283a    10-Oct-2017                 25.2                        f           Adult
                                      2ii                        >3                                     19.8 (8.5)    728         28          38.4 (42.9)   66.3 (79.2)
                                      1                          10                                     15.3 (3.5)    812         50          34.9 (36.9)   58.8 (54.4)
           hs17_283b    10-Oct-2017                 21.6                        f           Sub-adult
                                      2ii                        >4                                     16.5 (4.8)    806         24          33.3 (35.8)   57.2 (54.9)

                                             Table 1.  Summary of tagged individuals performing multi-day foraging trips. PCAs are presumed prey
                                             capture attempts inferred from acceleration transients. HVPs are ‘high value prey’ captures in which prey
                                             appear to be brought to the surface for handling. Distance made good is the straight-line distance between
                                             successive PCAs. Distance travelled is the total distance travelled by the animal between successive PCAs.
                                             i
                                               First foraging trip incomplete, ii second foraging trip incomplete.

                                             Figure 2.  Median of (a) hourly PCA count, (b) hourly track tortuosity; (c) dive depth and (d) dive shape index
                                             (DSI) over the three phases of each foraging trip, with error bars representing upper and lower quartiles. ‘First
                                             24 h’ encompasses the trip offshore from the haul-out. ‘Last 24 h’ encompasses the return trip to shore. ‘Offshore
                                             days’ encompasses all times in between. Colours represent individual foraging trips and six complete trips from
                                             five individuals are shown.

                                             variable search time for prey (Table 1). The median and IQR of these two inter-PCA distances were within the
                                             same range across all phases of the foraging trip for all animals (Fig. 5a,b) indicating that prey were not found
                                             in denser aggregations off-shore than during travel days.

          Scientific Reports |   (2021) 11:6514 |                     https://doi.org/10.1038/s41598-021-85376-2                                                           4

Vol:.(1234567890)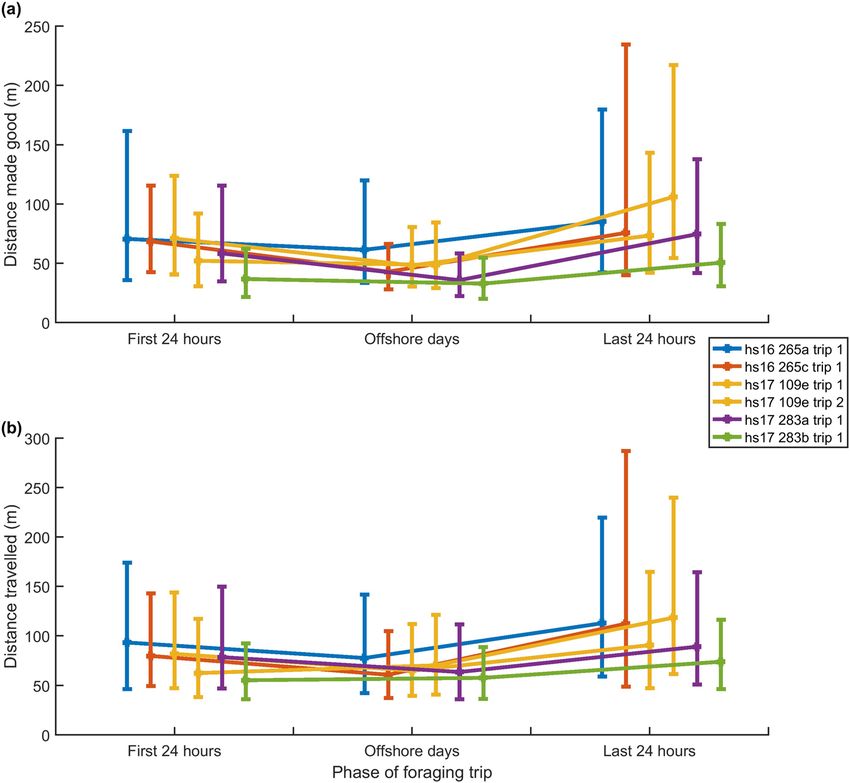
www.nature.com/scientificreports/
Foraging trip ID First 24 h PCA count No. of complete offshore days Offshore days PCA count Last 24 h PCA count
hs16_265a trip 1 703 4 881;696;453;318 391
hs16_265b trip 1 813 4 874; 841; 772;855 –
hs16_265c trip 1 749 6 855;827;737;890;801;827 342
hs16_265c trip 2 925 7 830;862;927;813;883;837;710 –
909;631;512;392;387;438;438;4
hs17_109a trip 1 918 9 –
06;558
hs17_109b trip 1 406 4 407;308;365;461 –
hs17_109e trip 1 533 5 760;753;599; 491;461 639
hs17_109e trip 2 702 2 583;427 271
hs17_283a trip 1 436 7 797;686;751;710;601;549;762 422
hs17_283a trip 2 594 2 677;791 –
hs17_283b trip 1 973 7 696;829;833;879;888;666;920 754
hs17_283b trip 2 732 2 813;863 –
Table 2. Number of presumed prey captures (PCA) during each 24-h period of the foraging trip. The first and
last 24 h encompass travel to and from an offshore site. For trips in which the tag recording ended early, the
final 24 h is included in the offshore days.
Hypothesis 2 Time spent resting increases over the course of an offshore foraging trip.
Tagged seals rested for a median of 205.8 min/day, both at the surface and during distinctive low activity
dives. Excluding the return travel day in which seals may postpone resting until they reach the haulout, a linear
mixed effects model indicated a significant relationship between day number of the foraging trip and the length
of time spent resting (p < 0.0001). The model fit showed an increase in resting time of 36.9 (SE 6.6) mins per day
from the start of each foraging trip (Fig. 6) (marginal R 2 = 0.38, conditional R2 = 0.46). Daily PCA count was not
a significant covariate in the resting model (p = 0.06) indicating that foraging success may not be a substantial
contributor to time dedicated to rest in a foraging trip.
Perhaps as a consequence of increased resting, daily PCA counts decreased by 24.8 (SE 6.5, p = 0.0003, mar-
ginal R2 = 0.08, conditional R2 = 0.62) for each day of the foraging trip. However, while the model was significant,
the large difference between marginal and conditional R 2 indicates that much of the variance in PCA rate stems
from individual differences rather than linear changes with day number. While there was no significant relation-
ship between day number and HVP count (p = 0.1), there was a trend for the lowest proportion of HVPs to occur
on the outward journey and the highest proportion to occur on the return journey (Fig. 4b).
Hypothesis 3 Track tortuosity and dive shape are robust indicators of foraging behaviour.
A linear mixed effects model showed a significant but weak relationship between PCA rate and tortuosity
during offshore days when analysed across all time intervals (30 min interval: p = 0.0001, marginal R2 = 0.04,
conditional R2 = 0.2; 15 min interval: p = 0.02, marginal R2 = 0.01, conditional R2 = 0.16; Dive interval: p = 0.002,
marginal R2 = 0.01, conditional R2 = 0.16) suggesting that tortuosity is a weak predictor of foraging behaviour
when animals are offshore.
In general, dive depth increased as animals went offshore and decreased as they returned to the coast (Fig. 2c),
consistent with a gently sloping seabed away from the coast. The dive shape index however stayed relatively con-
stant and high throughout all phases of the foraging trip (Fig. 2d), consistent with continuous benthic foraging.
U-shaped dives occurred both when animals were foraging and resting making it difficult to differentiate these
behaviours with dive data alone, but as resting dives comprised only 7.5% (SD 3.6) of total dives their impact on
the hourly mean dive shape index was minimal. Thus, the prevalence of U-shaped dives in our data supports a
high time investment in foraging but has little value for predicting PCA rates.
Discussion
Our understanding of harbour seal foraging behaviour has largely been drawn from inferences based on surface
movement patterns and dive shape acquired at low sampling rates from biotelemetry t ags23. Although fine-scale
movement sensors (accelerometers and magnetometers) have previously been used on harbour seals in the
German Wadden S ea8, sampling rates were too low (maximum of 1 Hz) to detect the fast movements associated
with prey capture attempts37. Here we combine high-resolution bio-logging data from GPS, depth, accelerometer
and magnetometer sensors to examine fine-scale harbour seal foraging and resting behaviour during multi-day
offshore foraging trips. In other pinniped species, offshore provisioning trips are performed to target more
abundant or higher quality r esources2–5,41. However, using distinctive acceleration transients as a proxy for prey
capture attempts (PCA)37, we found that harbour seals forage almost continuously throughout the trip including
on the outbound and return journeys, suggesting that offshore patches are not so rich as to make opportunistic
foraging during travel inefficient.
Scientific Reports | (2021) 11:6514 | https://doi.org/10.1038/s41598-021-85376-2 5
Vol.:(0123456789)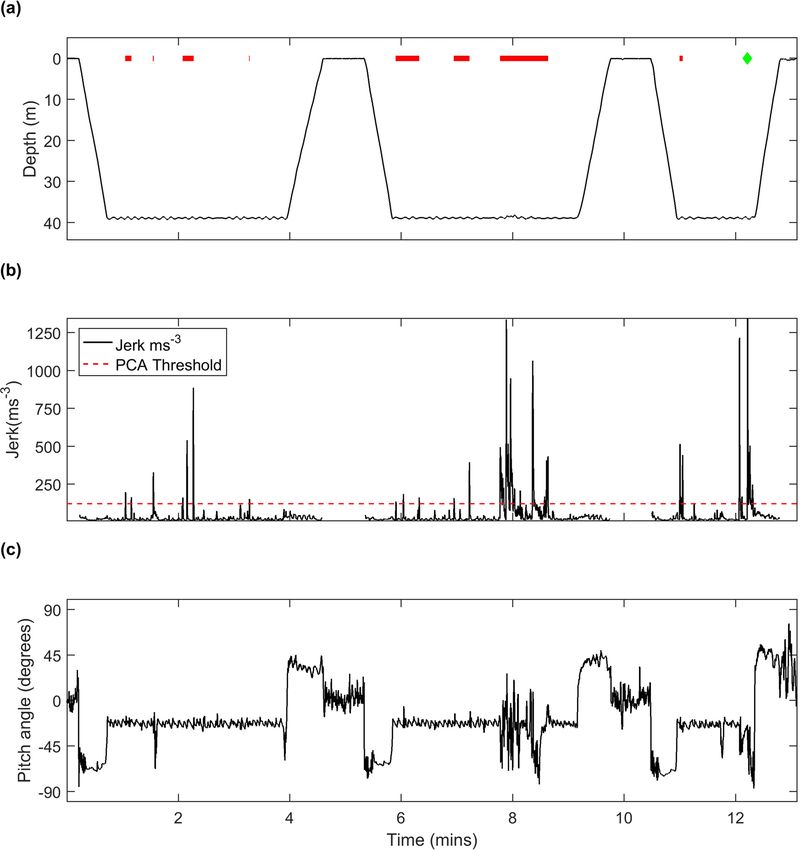
www.nature.com/scientificreports/
Figure 3. (a) Sequence of foraging dives from hs16_265a trip 1 showing the duration of detected prey capture
events (PCAs) as red horizontal lines. The green diamond indicates a potential large prey capture (HVP) due to
the jerk transient occurring near the end of an atypically short dive suggesting handling at the surface. (b) Root
mean square of the norm jerk (200 Hz sampling rate, 0.4 s averaging time) over the same interval from which
prey captures were inferred. The PCA detection threshold is indicated by the red dashed line. A blanking time
of 20 s between PCA detections means that multiple jerks separated by less than this interval are interpreted as a
single PCA, represented by individual horizontal red lines in (a). Gaps in jerk indicate where the signal has been
blanked to prevent false PCA detections when the animal is at the surface. (c) Pitch angle of the animal over the
same time interval. A negative pitch angle indicates a head-down posture and when this occurs at the base of
dives benthic prey are likely being targeted.
Indicators of foraging behaviour. Our interpretations are dependent on the assumption that PCAs can
be identified from acceleration transients and, as with any proxy of behaviour, this metric is prone to error.
Prey strikes and handling involve rapid motion of relatively small cranial muscles, leading us to choose a high
acceleration sampling rate (200 Hz) along with a processing method (the RMS jerk) that emphasises high fre-
quency components37. This resulted in discrete high magnitude peaks in jerk during presumed foraging dives
that are clearly distinguishable from the much lower jerk levels during active swimming (Fig. 3b), reducing the
possibility of confounding prey interactions with other activities. Nonetheless, the choice of detection threshold
and blanking time will inevitably lead to under-counting of PCAs that are close together or that require little
head movement. However, the primary goal of this study was to identify relative foraging rates as a function of
location and so, for our interpretations to be incorrect, there would need to be a strong correlation between prey
Scientific Reports | (2021) 11:6514 | https://doi.org/10.1038/s41598-021-85376-2 6
Vol:.(1234567890)www.nature.com/scientificreports/
Figure 4. (a) Map showing the geographic location of potential high value prey captures (HVPs, i.e., a jerk
transient occurring at the end of an atypically short dive). These events are not restricted to offshore sites but
appear to occur across the foraging range. Map was generated in Matlab R2016a (http://www.mathworks.com/)
using plot_google_map version 1.5 (https://au.mathworks.com/matlabcentral/fileexchange/27627-zoharby-plot-
google-map). (b) % of total HVPs which occur at each stage of the foraging trip in 6 complete trips by 5 seals.
Figure 5. (a) Median distance made good between successive PCA locations over each phase of the foraging
trip. (b) Median distance travelled between successive PCA locations over each phase of the foraging trip. Error
bars in both plots represent lower and upper quartiles.
Scientific Reports | (2021) 11:6514 | https://doi.org/10.1038/s41598-021-85376-2 7
Vol.:(0123456789)www.nature.com/scientificreports/
Figure 6. Rest time in hours during each complete 24-h period of the foraging trip starting when the seals
leave the haul-out (incomplete 24-h periods at the end of the deployment are excluded). The dashed black
line indicates the global mean model output, while the grey patch shows the range of model predictions for
individual means across all animals. The return travel days, indicated with an open triangle, were not included
in the regression as seals may postpone rest when they are returning to the haul-out.
attack behaviour and location. The uniformity of foraging posture (i.e., pitched down to accommodate search-
ing along the bottom) throughout our data (e.g., Fig. 3) suggests that there should be little spatial variation in
the detectability of PCAs. We therefore argue that jerk transients offer a consistent indication of where and
when harbour seals encounter prey, independent of larger-scale movement patterns, as has been found for other
marine mammal species31,33,34.
Foraging occurs throughout offshore trips. Assessments of where harbour seals forage have largely
come from low resolution position and dive d ata10,19,42. An underlying assumption is that foraging occurs pri-
marily during area restricted movements at the surface, and that straight-line movements must therefore rep-
resent travelling19,42. Whilst the possibility of opportunistic feeding during travel has been considered23,42, the
contribution to total intake has been assumed small leaving the notion that offshore feeding trips serve to access
a distant valuable food resource. Using acceleration transients to infer foraging reveals a different picture. Ani-
mals in our study encountered prey during both tortuous and straight track segments, giving only a weak asso-
ciation between tortuosity and the rate of PCAs at all timescales tested (Figs. 1d and 2). This suggests that prey
were encountered, not in ‘hot spots’ but sporadically across the entire foraging range. Thus, the conventional
decomposition of low resolution movement data into mutually exclusive travel and foraging episodes based
purely on straightness of track may be overly simplistic for harbour seals at this site. Dive shape appears to be a
similarly imprecise predictor of foraging rates in our data because of near-continuous foraging and low variety
in dive shape (Fig. 2d). Moreover, the one behavioural state in which foraging does not occur, resting, involves
dive shapes which can easily be confused with foraging in low-resolution depth data.
Our results suggest that whilst harbour seals intend to travel offshore directly, as evidenced by relatively
straight-line movement, this is done in a way that maximises the opportunity for foraging along the way. The
majority of dives during the outward and return trips are benthic and seals adopt the same pitch-down posture
at the base of these dives that they use during offshore foraging dives, consistent with searching for benthic prey
(Fig. 3). This posture and depth are less than optimal for travel so foraging along the way appears to be important
enough to sacrifice some travel efficiency, suggesting in turn that offshore prey patches are not so dense as to
make opportunism inefficient while underway. Thus, continual patch assessment may be an important strategy
in multi-day foraging trips rather than a reliance on predictable rich offshore locations.
Why do harbour seals travel so far offshore to find food? If prey are available throughout their
foraging range, why do animals endure the extra costs of travelling further from haul-outs? One suggestion is
that prey captured offshore are larger. The shallow waters of the Wadden Sea provide nursery grounds for the
juveniles of many fish species in spring and summer with most of these migrating into deeper offshore waters in
autumn and w inter15,16. To test if seals took larger prey offshore, we detected short dives that ended with a PCA
interpreting these as indicative of a high-value prey (HVP) being brought to the surface. These detections likely
underestimate the number of HVPs taken but provide a relative indication of where and how often such prey is
encountered.
Scientific Reports | (2021) 11:6514 | https://doi.org/10.1038/s41598-021-85376-2 8
Vol:.(1234567890)www.nature.com/scientificreports/
Although HVPs were found throughout foraging trips, there was a trend for the lowest proportion of HVPs
to occur on the outward journey and the highest proportion of HVPs to occur on the return journey with many
individuals having the largest daily count in the final 24 h when they are returning to the haul-out (Fig. 4b).
Shorter dives in the shallow waters near the coast may lead to an over-estimation of HVP detections in the travel
days but a similar result was found when these dives were excluded. It therefore appears that larger prey are
available across the foraging range but that less time is dedicated to their pursuit during outward trips, possibly
because the handling time make them a less efficient food source when balancing travelling to more distant food
resources with foraging along the way. Taken together, these results lead us to conclude that harbour seals do
not appear to be encountering more or larger prey further offshore and therefore cannot explain why they travel
as far from the coast as they do.
For most individuals the mean rate of HVPs was 15–25/day (compared to ~ 600 PCAs/day), and so these
may not represent a significant portion of the diet. However, for two individuals encounter rates of large prey
were much higher (50–115/day) but inconsistent between consecutive foraging trips, suggesting that if there are
individual tactics to target these prey, they are not uniformly successful.
If prey are distributed relatively uniformly, this does not necessarily make it optimal to forage close to the
haul-out. Whilst harbour seals congregate in large numbers at haul-out sites, they are solitary h unters43. Prey
resources closer to the haul-out will be depleted quickly due to conspecific competition in an Ashmole’s halo
phenomenon that has been reported for other colonial species18,44,45 . For harbour seals, access to nearby resources
may be controlled by dominant animals while subordinate individuals may choose to forage further from the
haul-out to avoid competition. However, larger individuals that are better able to afford the transport costs of
travelling further offshore would also be rewarded with patches that are less exploited by conspecifics. Indeed,
some studies show for both harbour and grey seals that the largest individuals travel the farthest and spend
the longest time away from the haul-out7,46. Indeed, these larger individuals tend to be males leading to sexual
segregation in foraging a reas8. However, studies in other locations have shown opposite r esults47 suggesting that
resource partitioning may be site specific. We found no clear pattern in our own data to support either of these
suggestions. In either case, our data does not provide evidence for a single rich offshore foraging zone. Therefore,
we posit that harbour seals performed multi-day foraging trips to access widely distributed prey and to reduce
competition with conspecifics.
The role of rest in deciding to return to the haul‑out. Our results show that resting time at sea
increases over the course of a foraging trip by some 37 min per day, possibly indicating an accumulating need
for rest (Fig. 6). Increased resting comes at the expense of foraging time and we found a daily decrease of about
25 PCAs. Over a 5-day foraging trip this equates to ~ 17% reduction in intake between the first and final days,
assuming an average first day PCA rate of ~ 700 and that prey size and quality remain constant. Whilst resource
depletion also reduces foraging efficiency, this is less likely to be a factor due to the large area covered during
foraging trips.
Rest may serve several functions including sleep, digestion, lactate processing and vigilance. Brasseur et al.48
showed that when prevented from hauling out, harbour seals compensated by later increasing time spent hauled
out suggesting that resting in the water is not equivalent to hauling out. Other pinniped species show uni-
hemispheric sleep while in the water with an almost complete absence of R.E.M sleep49. Therefore, harbour seals
may compensate for a lesser quality of rest at sea by devoting more time to it throughout a foraging trip, until
it eventually becomes more economical to return to the haul-out. Thus, although other factors likely influence
the length of foraging trips, we suggest that loss of foraging time due to increased time spent resting could be a
major driver in the decision to end a multi-day foraging trip.
Perspectives. Taken together, we show that the harbour seals assessed in this study did not rely on specific
rich offshore foraging zones. Instead, animals appear to travel offshore to access broadly distributed prey and
potentially avoid intra-specific competition. Our study includes sub-adult and adult animals of both sexes and
covers two seasons (spring and autumn) but the relatively small sample size precludes the exploration of tempo-
ral variability or whether specific life history events such as breeding and pupping influence foraging behaviour.
While previous studies have looked at the effect of sex on space utilisation by harbour seals in the Wadden Sea8,
they have not looked at how life history and age influence fine-scale behaviour. This should be a consideration in
future fine-scale behavioural studies, in order to identify key foraging areas associated with life cycle stages e.g.,
pregnant females and juveniles.
The harbour seal population in the German Wadden Sea has expanded considerably since a ban on hunting
in the mid-1970s as well as the establishment of national parks43, despite two outbreaks of phocine distemper
virus50 and one die-off due to Influenza A virus51. But even though harbour seals in the Wadden Sea appear to
be doing well52, it is pressing to understand how planned expansion of offshore renewables could impact these
animals. Given the broadly distributed resources exploited by animals in our study, harbour seals may be rela-
tively resilient to disturbances at fixed locations such as offshore construction sites. However, our results also
indicate that seals feed nearly continuously during offshore trips and therefore may be vulnerable to cumulative
effects of brief disturbances such as ship passes22 or of intense noise sources that have large zones of impact53.
Moreover, the re-colonisation of grey seals in the area54 may add further resource competition. These factors are
compounded by intensive fishing in the North Sea since the 1960s, leading to changes in the structure of food
webs55 as well as providing direct competition for resources. Studies have hinted at decreases in the size of North
Sea fish over the last half century56 with further decreases projected due to the effects of warming s eas57. These
pressures likely apply to harbour seals across many locations raising the importance of collecting comparable
data in other study sites and populations. We argue that bio-logging tags that collect high-resolution data from
Scientific Reports | (2021) 11:6514 | https://doi.org/10.1038/s41598-021-85376-2 9
Vol.:(0123456789)www.nature.com/scientificreports/
a greater range of movement sensors offer important advantages when interpreting the behaviour and forag-
ing performance of harbour seals. Such detailed behavioural data could potentially lead to more informed and
effective conservation measures for this species.
Materials and methods
Fieldwork. Ten seals were tagged in September 2016, and in April and October 2017. Adult and sub-adult
harbour seals (Table 1) were captured at low tide adjacent to haul out sites at Lorenzensplate (54.44°N, 8.64°E),
Germany. Capture and handling were carried out in accordance with relevant guidelines and regulations and
followed the methods in Hasselmeier et al.58. The study was approved under animal experiment ethical permit
number Az V312- 72241.121-19 (70-6/07) and V244-3986/2017 (17-3/14) of the Ministry of Energy, Agricul-
ture, Environment and Rural Areas of Schleswig–Holstein, Germany.
Each animal was instrumented with a DTAG-4 joined with an Argos transmitter (SPOT-6), floatation and
timed release with a combined weight of 206 g (see Mikkelsen et al. for details22). The DTAG-4 is an archival tag
containing synchronously sampled sensors for sound (not used here), motion and position, with a recording
duration of up to 30 days. The depth sensor and tri-axial magnetometer were sampled at 50 Hz while the tri-
axial accelerometer was sampled at 200 Hz. A snapshot GPS59 acquired up to three positions every 3 min when
the animal was at the surface.
Data processing. Processing was carried out using custom tools (www.animaltags.org) in Matlab R2016a
(The Mathworks, Natick, MA, USA). Data were divided into individual offshore foraging trips (i.e., intervals
of > 24 h without hauling out) extending from departure to the return to haul-out (or the end of the recording if
that occurred first). Tagged seals also performed short inshore foraging trips between regular daily haul-outs but
these data were excluded from our analyses as previous work suggested that most foraging in this area occurred
on multi-day trips10,11.
Pressure, accelerometer and magnetometer data were decimated to 5 Hz to calculate dive profile, posture
and dead-reckoned tracks within each foraging trip. Dives deeper than 2 m were analysed for dive shape and
bottom time. A dive shape index was computed by dividing the sum of all depths sampled within the dive by
the product of the maximum depth and the total number of depth samples (i.e. giving values between 0 and 1,
with values closer to 1 indicating a more U-shaped profile). The bottom time of each dive was defined as the
time spent within 70% of the maximum depth. Posture, parameterised by pitch, roll and heading angles, was
estimated following Johnson and Tyack60.
The conventional dead-reckoning procedure which assumes that animals move in the direction of their
longitudinal axis8,40 was not appropriate here as seals frequently moved horizontally at the base of dives (as
inferred from dive depth) but with a downwards pitched posture consistent with searching for prey on the
seafloor. To avoid errors due to the mismatch between pitch angle and movement direction, we adopted a
2-dimensional dead-reckoning method in which the horizontal track was calculated by integrating the heading
vector of the animal (i.e., [cos(h), sin(h)] in a North-East frame, where h is the true heading) multiplied by an
estimated horizontal speed. As the tag does not include a speed sensor, we used a horizontal speed estimate of
1.42 − depthrate2 where 1.4 m/s is the typical forward speed for harbour s eals8, and depth rate, constrained to
a maximum value of 1.4 m/s, is computed from the differential of the depth data. The dead-reckoned track was
then corrected to match GPS positions at the surface by adding a constant vector to each track point between
pairs of GPS positions, effectively correcting for swim speed, heading errors and water currents.
To detect potential prey capture attempts (PCA), the norm jerk37 (i.e., the vector magnitude of the acceleration
differential) was calculated from 200 Hz accelerometer data. The root-mean-squared (RMS) of the norm jerk
was then taken over 0.4 s intervals with 50% overlap to give an RMS jerk measure with a sampling rate of 5 Hz.
A peak detector was used to locate transients in the RMS jerk that may indicate PCAs, requiring selection of a
blanking time and detection threshold. The blanking time specifies the minimum time between detections to
avoid making multiple detections during prolonged prey capture and handling. The histogram of time between
jerk peaks for our data did not indicate a simple two-process m odel61 from which a blanking time could be
inferred. Harbour seals forage on a range of prey sizes and while small fish can be captured within a few seconds,
larger prey such as flat fish require longer handling. We accordingly used pursuit, capture and handling times of
harbour seals feeding on sand eels and fl ounder62, weighted by the approximate relative occurrence of these in the
diet to calculate a blanking time of 20 s. Using a fixed blanking time risks under-counting sequential aggregated
small prey while over-counting prey that require extensive handling, and so will likely not give accurate absolute
PCA counts. However, this method is suitable for assessing relative prey encounter rates across foraging trips
provided that the proportion of prey types does not change greatly with time. To ensure the robustness of our
results to this assumption analyses were repeated with a shorter blanking time of 10 s.
As the magnitude of RMS jerk is affected by tag placement as well as potentially by animal size63, a detection
threshold was chosen for each seal based on the RMS jerk during dive descents and ascents when seals are less
likely to be chasing prey. A gamma distribution was fit to the squared RMS jerk during these periods and the
square-root of the value corresponding to a cumulative probability of 0.9999 was used as the threshold above
which RMS jerk peaks were considered prey capture attempts. This threshold implies a false detection on aver-
age every 33 min of active swimming (i.e., 1 false alarm per 10,000 samples at the data rate of 5 Hz) which is
much lower than the typical prey encounter rate. Jerk transients can arise for a number of reasons unrelated to
foraging: wave action at the surface, collisions of the tag with the seabed and possibly as a startle response to
disturbance. Harbour seals typically target benthic and mid-water prey and so to reduce detection of splashes
at the surface, peak detection was disabled at depths of < 1 m. Given the dorsal location of the tag on the body,
contact with the seafloor requires that the animal is upside down. Such postures occurred rarely in foraging dives
Scientific Reports | (2021) 11:6514 | https://doi.org/10.1038/s41598-021-85376-2 10
Vol:.(1234567890)www.nature.com/scientificreports/
but were frequent during resting. To eliminate false detections due to seafloor contact, jerk peaks detected when
the accelerometer ventro-dorsal axis was negative were ignored.
andling64 whereas smaller prey are
Harbour seals are known to bring large prey to the surface to facilitate h
ingested on-the-go during dives. Examination of our data showed that while most foraging dives were longer than
150 s and contained several PCAs, a subset of dives to similar depths were notably shorter and contained a strong
jerk transient just prior to the ascent. We interpreted these short dives (i.e., with duration < 150 s and a PCA
within 20 s of the end of the bottom time) as indicative of high-value prey (HVP) captures that required surface
handling. This method will under-estimate large prey captures, as some will occur at the end of dives with typical
duration. However, this bias should be independent of foraging trip phase making it a useful relative measure.
The instantaneous stroking rate, a proxy for swimming effort, was calculated by detecting individual strokes
in the magnetometer d ata65. The dominant stroking frequency (DSF, sensu Sato et al.66) for each animal was first
calculated and the magnetometer lateral axis data were then high-pass filtered with a cut off frequency of 0.5
DSF for each animal to remove low frequency postural changes35. A hysteretic detector with a 3 μT threshold
was used to detect swim-strokes in the filtered signal.
Behavioural states. Although a previous study identified rest, travel and foraging states in at-sea data from
harbour seals21, we found few dives with active swimming that seemed solely for travel. In comparison, resting
was readily distinguishable from active behaviours (i.e., foraging/travel) and data were therefore divided into
two ethographic states. Periods of rest were identified from dive and stroking rate data and comprised either
escents21 and exceptionally low stroking rates
extended intervals at the surface or sequences of dives with slow d
at the bottom. Resting dives often also contained distinctive slow rolling movements at the base of the d ive22.
Data analysis. To compare times spent mostly travelling to and from offshore sites versus time spent off-
shore, foraging trips were divided into two travel phases (i.e., the first and last 24-h period of each trip) and an
offshore phase comprising the remainder of the data. The predominantly straight-line movements away from/
to shore tended to last about 24 h for all animals but this interval was chosen primarily from the need to average
over diel changes in prey and predator behaviour. For animals with incomplete foraging trips (i.e., the recording
ended before the animal reached the haul-out), the final 24 h were subsumed in the offshore phase. To quantify
changes in resting behaviour during offshore trips we used a linear mixed effects model using the R (R Develop-
ment Core Team, 2019) package nlme, to predict hours spent resting per day as a function of trip day number
and number of daily PCAs. The return travel days (i.e., the final 24 h) were not included in the regression as seals
may postpone rest when they are returning to the haul-out. Trip number (1 or 2) was nested in animal ID (1-8)
as random intercepts. The model was validated using tests for normally distributed residuals, homoscedasticity
and serial correlation. Goodness of fit was assessed using conditional and marginal R 2 values, computed using
67 2
the R package MuMIn . Marginal R evaluates the variance in the data explained by the fixed effects alone, while
conditional R2 evaluates the variance explained by both fixed and random effects.
To compare foraging inferences from our high-bandwidth acceleration data to those taken from movement
patterns and dive shapes, we computed hourly median and max dive depth values as well as hourly median and
max dive shape indices across the three phases of each offshore trip. Track tortuosity was also compared over
the three phases. Tortuosity was calculated on an hourly basis as: (distance travelled − distance made good)/
distance travelled, where distance made good is the straight-line distance between the first and last track point
of each hour and distance travelled is the stretched-out track travelled by the seal. Gaps in GPS data can occur
when the tag does not clear the surface for long enough or when the sea-state is high. To assess the potential
impact of these outages on tortuosity during each phase of the foraging trip, median time differences between
GPS outages were evaluated at each phase.
To evaluate in more detail the use of track tortuosity as an indicator of foraging behaviour during the offshore
phases of trips, tortuosity was calculated over 3 timescales: 30 min, 15 min and over individual dives. The result-
ing tortuosity values, as well as the PCA counts over the same time intervals, were subsampled to reduce serial
correlation (every 6th 30 min interval, every 10th 15 min interval, and every 20th dive were used). Linear mixed
effects models were then constructed in R to predict track tortuosity from PCA count with a separate model
for each timescale. Trip number (1 or 2) was nested in animal ID (1-8) as random intercepts in each model and
models were validated as described previously.
Data availability
Data is available at https://doi.org/10.6084/m9.figshare.14171315.
Received: 17 August 2020; Accepted: 5 February 2021
References
1. Orians, G. H. & Pearson, N. E. On the theory of central place foraging. Analysis of ecological systems. In Analysis of ecological
systems Vol. 2 (eds Horn D. J., Mitchell R. D. & Stairs G. R.) 155–177 (Ohio State Univ. Press, 1979).
2. Biuw, M. et al. Variations in behavior and condition of a Southern Ocean top predator in relation to in situ oceanographic condi-
tions. Proc. Natl. Acad. Sci. 104, 13705–13710 (2007).
3. Arcalís-Planas, A. et al. Limited use of sea ice by the Ross seal (Ommatophoca rossii), in Amundsen Sea, Antarctica, using telemetry
and remote sensing data. Polar Biol. 38, 445–461 (2015).
4. Staniland, I. J., Boyd, I. L. & Reid, K. An energy–distance trade-off in a central-place forager, the Antarctic fur seal (Arctocephalus
gazella). Mar. Biol. 152, 233–241 (2007).
5. Le Boeuf, B. et al. Foraging ecology of northern elephant seals. Ecol. Monogr. 70, 353–382 (2000).
Scientific Reports | (2021) 11:6514 | https://doi.org/10.1038/s41598-021-85376-2 11
Vol.:(0123456789)www.nature.com/scientificreports/
6. Adelung, D., Kierspel, M. A., Liebsch, N., Müller, G. & Wilson, R. P. Distribution of harbour seals in the German bight in relation
to offshore wind power plants. In Offshore Wind Energy: Research on Environmental Impacts (eds Köller, J., Köppel J. & Peters, W.)
65–75 (Springer, 2006).
7. Thompson, P. M., Mackay, A., Tollit, D. J., Enderby, S. & Hammond, P. S. The influence of body size and sex on the characteristics
of harbour seal foraging trips. Can. J. Zool. 76, 1044–1053 (1998).
8. Wilson, R. P. et al. Options for modulating intra-specific competition in colonial pinnipeds : the case of harbour seals (Phoca
vitulina) in the Wadden Sea. PeerJ 4, e957 (2015).
9. Sharples, R. J., Moss, S. E., Patterson, T. A. & Hammond, P. S. Spatial variation in foraging behaviour of a marine top predator
(Phoca vitulina) determined by a large-scale satellite tagging program. PLoS ONE 7, e37216 (2012).
10. Liebsch, N., Wilson, R. P. & Adelung, D. Utilisation of time and space by harbour seals (Phoca vitulina vitulina) determined by
new remote-sensing methods. In Progress in Marine Conservation in Europe (eds von Nordheim, H., Boedeker, D. & Krause, J.C.)
179–188 (Springer, 2006).
11. Tougaard, J., Teilmann, J. & Tougaard, S. Harbour seal spatial distribution estimated from Argos satellite telemetry: overcoming
positioning errors. Endanger. Species Res. 4, 113–122 (2008).
12. Common Wadden Sea Secretariat. Report on the State of Conservation of the World Heritage property “ The Wadden Sea ( N1314
)” (2016).
13. Brasseur, S. M. J. M. et al. Echoes from the past: regional variations in recovery within a harbour seal population. PLoS ONE 13,
1–21 (2018).
14. Wolff, W. J. Ecology of the Wadden Sea (Balkema, 1983).
15. Baumann, H., Malzahn, A. M., Voss, R. & Temming, A. The German Bight (North Sea) is a nursery area for both locally and
externally produced sprat juveniles. J. Sea Res. 61, 234–243 (2009).
16. Tulp, I., Bolle, L. J. & Rijnsdorp, A. D. Signals from the shallows: in search of common patterns in long-term trends in Dutch
estuarine and coastal fish. J. Sea Res. 60, 54–73 (2008).
17. Dulvy, N. K. et al. Climate change and deepening of the North Sea fish assemblage: a biotic indicator of warming seas. J. Appl. Ecol.
45, 1029–1039 (2008).
18. Birt, V., Birt, T., Goulet, D., Cairns, D. & Montevecchi, W. Ashmole’s halo: direct evidence for prey depletion by a seabird. Mar.
Ecol. Prog. Ser. 40, 205–208 (1987).
19. Russell, D. J. F. et al. Intrinsic and extrinsic drivers of activity budgets in sympatric grey and harbour seals. Oikos 124, 1462–1472
(2015).
20. Sparling, C. E., Fedak, M. A. & Thompson, D. Eat now, pay later? Evidence of deferred food-processing costs in diving seals. Biol.
Lett. 3, 94–98 (2007).
21. Ramasco, V., Biuw, M. & Nilssen, K. T. Improving time budget estimates through the behavioural interpretation of dive bouts in
harbour seals. Anim. Behav. 94, 117–134 (2014).
22. Mikkelsen, L. et al. Long-term sound and movement recording tags to study natural behavior and reaction to ship noise of seals.
Ecol. Evol. 9(5), 2588–2601 (2019).
23. Carter, M. I. D., Bennett, K. A., Embling, C. B., Hosegood, P. J. & Russell, D. J. F. Navigating uncertain waters: a critical review of
inferring foraging behaviour from location and dive data in pinnipeds. Mov. Ecol. 4, 1–20 (2016).
24. Boyd, I. L. Temporal scales of foraging in a marine predator author. Ecology 77, 426–434 (1996).
25. Bjorge, A. et al. Habitat Use and Diving Behaviour of Harbour Seals in a Coastal Archipelage in Norway 211–223 (Elsevier, 1995).
26. Lesage, V., Hammill, M. O. & Kovacs, K. M. Functional classification of harbor seal (Phoca vitulina) dives using depth profiles,
swimming velocity, and an index of foraging success. Can. J. Zool. 77, 74–87 (1999).
27. Baechler, J., Beck, C. A. & Bowen, W. Dive shapes reveal temporal changes in the foraging behaviour of different age and sex classes
of harbour seals (Phoca vitulina). Can. J. Zool. Can. Zool. 80, 1569–1577 (2002).
28. Dragon, A. C., Bar-Hen, A., Monestiez, P. & Guinet, C. Comparative analysis of methods for inferring successful foraging areas
from Argos and GPS tracking data. Mar. Ecol. Prog. Ser. 452, 253–267 (2012).
29. Dragon, A. C., Bar-Hen, A., Monestiez, P. & Guinet, C. Horizontal and vertical movements as predictors of foraging success in a
marine predator. Mar. Ecol. Prog. Ser. 447, 243–257 (2012).
30. Thums, M. T., Bradshaw, C. J. A. & Hindell, M. A. In situ measures of foraging success and prey encounter reveal marine habitat-
dependent search strategies. Ecology 92, 1258–1270 (2011).
31. Volpov, B. L., Hoskins, A. J., Battaile, B. C. & Viviant, M. Identification of prey captures in Australian fur seals (Arctocephalus pusil-
lus doriferus) using head-mounted accelerometers: Field validation with animal-borne video cameras. PLoS ONE 10, e0128789
(2015).
32. Gallon, S. et al. Identifying foraging events in deep diving southern elephant seals, Mirounga leonina, using acceleration data log-
gers. Deep. Res. Part II Top. Stud. Oceanogr. 88–89, 14–22 (2013).
33. Viviant, M., Trites, A. W., Rosen, D. A. S., Monestiez, P. & Guinet, C. Prey capture attempts can be detected in Steller sea lions and
other marine predators using accelerometers. Polar Biol. 33, 713–719 (2010).
34. Watanabe, Y. Y. & Takahashi, A. Linking animal-borne video to accelerometers reveals prey capture variability. Proc. Natl. Acad.
Sci. U.S.A. 110, 2199–2204 (2013).
35. Martín Lopez, L. M., Miller, P. J. O., Aguilar de Soto, N. & Johnson, M. Gait switches in deep-diving beaked whales: biomechanical
strategies for long-duration dives. J. Exp. Biol. 218, 1325–1338 (2015).
36. Naito, Y., Bornemann, H., Takahashi, A., McIntyre, T. & Plötz, J. Fine-scale feeding behavior of Weddell seals revealed by a mandible
accelerometer. Polar Sci. 4, 309–316 (2010).
37. Ydesen, K. S. et al. What a jerk: prey engulfment revealed by high-rate, super-cranial accelerometry on a harbour seal (Phoca
vitulina). J. Exp. Biol. 217, 2239–2243 (2014).
38. Johnson, M., De Soto, N. A. & Madsen, P. T. Studying the behaviour and sensory ecology of marine mammals using acoustic
recording tags: a review. Mar. Ecol. Prog. Ser. 395, 55–73 (2009).
39. Goldbogen, J. A., Friedlaender, A. S., Calambokidis, J., McKenna, M. F. & Simon, M. Integrative approaches to the study of baleen
whale diving behavior, feeding performance, and foraging ecology. Bioscience 63, 90–100 (2013).
40. Wilson, R. P. et al. All at sea with animal tracks; methodological and analytical solutions for the resolution of movement. Deep.
Res. Part II(54), 193–210 (2007).
41. Baylis, A. M. M., Page, B. & Goldsworthy, S. D. Effect of seasonal changes in upwelling activity on the foraging locations of a wide-
ranging central-place forager, the New Zealand fur seal. Can. J. Zool. 789, 774–789 (2008).
42. McClintock, B. T., Russell, D. J. F., Matthiopoulos, J. & King, R. Combining individual animal movement and ancillary biotelemetry
data to investigate population-level activity budgets. Ecology 94, 838–849 (2013).
43. Siebert, U., Müller, S., Gilles, A., Sundermeyer, J. & Narberhaus, I. Chapter VII species profiles marine mammals authors: harbour
porpoise red lists, conservation status and assessment. In Threatened Biodiversity in the German North and Baltic Seas-Sensitivities
Towards Human Activities and the Effects of Climate Change (eds Narberhaus, I. & Krause, J.) 448–495 (Naturschutz und Biologische
Vielfalt, 2012).
44. Ashmole, N. P. The regulation of numbers of tropical oceanic birds. Ibis (Lond. 1859) 103, 458–473 (1963).
45. Gaston, A. J., Ydenberg, R. C. & Smith, G. E. J. Ashmole’s halo and population regulation in seabirds. Mar. Ornithol. 35, 119–126
(2007).
Scientific Reports | (2021) 11:6514 | https://doi.org/10.1038/s41598-021-85376-2 12
Vol:.(1234567890)You can also read