Trade Policy Uncertainty Effects on Macro Economy and Financial Markets: An Integrated Survey and Empirical Investigation - MDPI

Page created by Frederick Conner
 
CONTINUE READING
Trade Policy Uncertainty Effects on Macro Economy and Financial Markets: An Integrated Survey and Empirical Investigation - MDPI
Journal of
               Risk and Financial
               Management

Article
Trade Policy Uncertainty Effects on Macro Economy
and Financial Markets: An Integrated Survey and
Empirical Investigation
Nikolaos A. Kyriazis

                                          Department of Economics, University of Thessaly, 38333 Volos, Greece; knikolaos@uth.gr

                                          Abstract: This paper conducts a review on theoretical and empirical findings on the increasingly
                                          popular measure of trade policy uncertainty (TPU) in economics and finance. Moreover, an empirical
                                          investigation takes place in order to find the impact that TPU exerts on Bitcoin market values by
                                          employing a spectrum of Generalized Autoregressive Conditional Heteroskedasticity (GARCH)
                                          specifications. Existing studies support that trade policy uncertainty leads to lower-quality and more
                                          expensive products and weak participation in international trade. Moreover, it contributes to lower
                                          democratic sentiment, hesitant internal migration and lesser socio-economic mobility and higher
                                          fluctuations in profitable assets. Moreover, our econometric findings reveal that TPU positively
                                          affects Bitcoin prices while crude oil values negatively influence this major cryptocurrency. Thereby,
                                          higher trade policy uncertainty is found to increase demand and favorite investments into risky
                                          assets in order to ameliorate the risk-return trade-off in investors’ portfolios. This study provides a
                                          compass for investing during turmoil due to trade wars and tariffs.

                                          Keywords: trade policy uncertainty; survey; macro economy; financial markets; Bitcoin


Citation: Kyriazis, Nikolaos A. 2021.
Trade Policy Uncertainty Effects on       1. Introduction
Macro Economy and Financial
                                               One of the major tiers of economic and financial growth throughout the centuries has
Markets: An Integrated Survey and
                                          been international trade. Trade agreements between counterparties enable the exchange of
Empirical Investigation. Journal of
                                          products that each part can acquire at lower prices than if needed to produce them. This
Risk and Financial Management 14: 41.
                                          benefits economic development and leads to wealth increases. Thereby, uncertainty as
https://doi.org/10.3390/jrfm14010041
                                          regards trade conditions includes a lot of noise in international markets and prevents the
                                          creation of a favorable environment for developing irreversible and large-scale investments.
Received: 5 January 2021
Accepted: 14 January 2021
                                          Fears about uncertainty concerning future trade policies may block the participation of
Published: 18 January 2021
                                          firms into foreign markets. This would impede the optimal allocation of resources at a
                                          worldwide level and impose the burden of high sunk costs to financially healthy and
Publisher’s Note: MDPI stays neutral
                                          potentially sustainable investment projects.
with regard to jurisdictional claims in
                                               A debate about whether tariffs, quotas or subsidies would be most appropriate to
published maps and institutional affil-   protect an infant industry has been at the heart of discussions about trade policy uncer-
iations.                                  tainty (Bhagwati and Ramaswami 1963). Discussion about whether free trade is a better
                                          policy than no trade for price-taker countries and whether this leads to higher welfare
                                          has generated high-quality academic work and an ongoing exchange of opinions among
                                          economists (Samuelson 1939, 1962; Myint 1954; Burstein and Cravino 2015; Edmond et al.
Copyright: © 2021 by the author.
                                          2015). Production across importing and exporting competing goods is considered to be
Licensee MDPI, Basel, Switzerland.
                                          tightly connected with economic development (Krueger 1980, 1997) and income distribu-
This article is an open access article
                                          tion (Edwards 1997). These issues are pertinent to the development policy debate.
distributed under the terms and                Trade wars can result in inflation—especially, manufactured goods can render much
conditions of the Creative Commons        more expensive—this boosts prices in domestic economies. A voluminous bulk of academic
Attribution (CC BY) license (https://     research has focused interest on tariffs and quotas and their effects as the most popular
creativecommons.org/licenses/by/          forms of trade protectionism. Dasgupta and Stiglitz (1977) supported that the optimum
4.0/).                                    fixed tariff is preferable in order to maximize consumer’s surplus in relation to the optimum

J. Risk Financial Manag. 2021, 14, 41. https://doi.org/10.3390/jrfm14010041                                    https://www.mdpi.com/journal/jrfm
Trade Policy Uncertainty Effects on Macro Economy and Financial Markets: An Integrated Survey and Empirical Investigation - MDPI
J. Risk Financial Manag. 2021, 14, 41                                                                                           2 of 20

                                        fixed quota in a competitive world with no uncertainty. Moreover, Findlay and Wellisz
                                        (1982) argue that welfare losses do not increase monotonically with tariff levels. They also
                                        support that free trade constitutes the first-best social optimum in the absence of national
                                        monopoly power over the terms of trade. Kimbrough (1985) argues that adjustment costs
                                        in a monetary union are lower under a tariff than under a quota. It is supported that
                                        trade liberalization combined with favorable monetary policy leads to beneficial results for
                                        the economy. Furthermore, Rodriguez and Rodrik (2000) analyzed the linkage between
                                        trade barriers and economic growth and cast doubt on the view that they are strongly and
                                        negatively connected.
                                             Notably, the hot topic of free trade agreements (FTAs) is connected to trade policy
                                        uncertainty and has spurred increasing interest. Feenstra (1992) analyzed that US protec-
                                        tionism has burdened foreign countries with substantial costs. Free trade agreements have
                                        led to greater discrimination and losses for the countries excluded, and this urges the latter
                                        to participate in alternative FTAs. Moreover, according to Grossman and Helpman (1993),
                                        conditions that favorited the viability of a potential free trade agreement between regions
                                        also increased the probability that this agreement would result in lower aggregate social
                                        welfare. Krugman (1991) found that free trade areas are quite harmful for countries outside
                                        them as trading blocs pursue more aggressive trade policies. He supports that trade war
                                        leaves each side worse off while Levy (1997) argued that bilateral free trade agreements
                                        could never increase political support for multilateral free trade. Baier and Bergstrand
                                        (2004) argue that potential welfare gains deriving from a free trade agreement between
                                        a pair of countries are higher when these two regions are close in distance, have similar
                                        economies and possibilities in exploiting economies of scale. Moreover, benefits from FTA
                                        increase when there is a great difference in capital-labor endowment ratios because of gains
                                        in comparative advantages. The concept of FTAs is tightly connected to liberalization of
                                        trade and trade negotiations. Ben-David (1993) explained that liberalization of trade could
                                        contribute to income convergence among members of the European Economic Community.
                                        Additionally, Foellmi and Oechslin (2010) document that less-developed countries suffer
                                        widening of income disparities caused by free trade. This is because liberalization leads to a
                                        surge in top-income shares. Moreover, Ossa (2014) estimated that the possible government
                                        welfare gains from future multilateral trade negotiations would be small (0.5% on average).
                                             The advantages and disadvantages of trade wars that generate trade policy uncertainty
                                        have also been at the core of serious economic debate. Lindé and Pescatori (2019) argue
                                        that trade wars can lead to permanently lower income and trade volumes. Li et al. (2018)
                                        provide evidence that China would be significantly hurt by the China–US trade war, but
                                        the damages would not be detrimental. Such wars would hurt most countries regarding
                                        GDP and manufacturing employment but would prove beneficial as concerns their welfare
                                        and trade. Moreover, Li et al. (2020) revealed that mainly Asian economies would be
                                        benefited in terms of welfare when US–China trade wars occurred.
                                             A large portion of the empirical literature on trade policy uncertainty is based on
                                        the embryonic but rapidly popular measure of Trade Policy Uncertainty constructed by
                                        Caldara et al. (2020). The trade policy uncertainty (TPU) index hinges on automated text
                                        searches of the electronic archives of seven newspapers: Boston Globe, Chicago Tribune,
                                        Guardian, Los Angeles Times, New York Times, Wall Street Journal and Washington Post.
                                        The calculation of this index takes place by counting the monthly frequency of articles
                                        discussing trade policy uncertainty for each newspaper.1
                                             This paper adds to trade literature in a three-fold manner. Firstly, the understanding
                                        of trade policy uncertainty and its consequences is ameliorated and a bird’s-eye view of
                                        this phenomenon on the macro economy, institutions, socio-economic matters such as
                                        migration and financial markets is laid out. Secondly, it provides an integrated survey of
                                        the high-quality academic research on trade policy uncertainty before and after the creation
                                        of the highly innovative Caldara et al. (2020) index. Moreover, empirical estimations by

1   https://www.policyuncertainty.com/trade_uncertainty.html.
Trade Policy Uncertainty Effects on Macro Economy and Financial Markets: An Integrated Survey and Empirical Investigation - MDPI
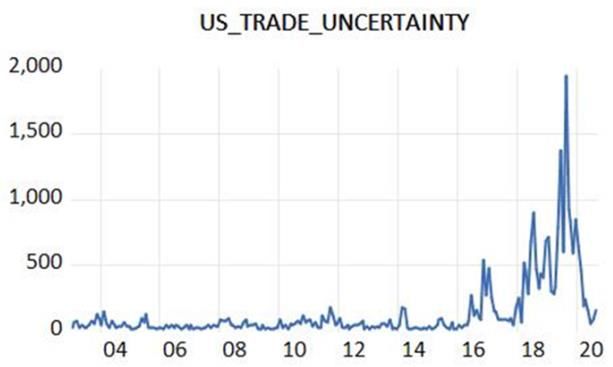
J. Risk Financial Manag. 2021, 14, 41                                                                                           3 of 20

                                        traditional as well as innovative ARCH and GARCH specifications take place in order to
                                        evaluate the impact of trade policy uncertainty and crude oil on the market values of the
                                        highly risky Bitcoin asset. Thereby, the strenuous task of casting light on every aspect of
                                        trade policy effects is undertaken.
                                             The remainder of this study is structured as follows. Section 2 furnishes an analysis
                                        of the theoretical and empirical academic literature concerning trade policy uncertainty.
                                        The analysis is conducted as regards a range of recipients of trade policy uncertainty
                                        impacts. Moreover, Section 3 provides the data and methodologies employed for the
                                        purposes of econometric estimations. Section 4 displays the empirical outcomes and
                                        analyzes the economic implications of findings related to portfolio construction and welfare
                                        maximization. Finally, Section 5 concludes and suggests avenues for further research. It
                                        should be noted that Table A1 displays the basic characteristics of studies investigating
                                        trade policy uncertainty and Figures A1–A3 in the Appendix A capture the level of diffusion
                                        of these studies to interested readers.

                                        2. Studies about Trade Policy Uncertainty
                                              Academic work on trade policy uncertainty has been based on high-quality academic
                                        papers that have provided a thorough and in-depth analysis of how uncertainty about free
                                        trade affects the macro economy, institutions, socio-economic phenomena and financial
                                        markets. It should be underlined that the benchmark separating latest academic work from
                                        more modern research has been the highly innovative measure of trade policy uncertainty
                                        by Caldara et al. (2020) that measures newspaper-based information about trade condi-
                                        tions. The TPU index has been constructed regarding three major economies: US, China
                                        and Japan.
                                              To be more precise, Caldara et al. (2020) constructed three measures of trade policy
                                        uncertainty in the US economy. The first one is a firm-level measure while the second
                                        is based on newspaper coverage of news related to trade policy uncertainty. The third
                                        measure is derived from the estimation of a stochastic volatility model for US import tariffs.
                                        Findings based on firm-level and aggregate macroeconomic data support that higher TPU
                                        results in lower US business investment by 1% while vector autoregressive (VAR) results
                                        reveal even greater reduction. The two-country general equilibrium model employed
                                        indicates that higher tariffs and uncertainty about future tariffs impede investments as
                                        non-exporters accumulate more capital than exporters.
                                              Moreover, Steinberg (2020) provided a comment on Caldara et al. (2020) and argues
                                        that the US input–output accounts matter for the nexus between TPU and US economic
                                        activity. Moreover, by employing a simple model of price-setting under nominal rigidities
                                        the modeling assumptions of the empirical outcomes in Caldara et al. (2020) are tested.
                                        According to Steinberg (2020), industry-level measures of trade exposure are not perfect
                                        measures. Moreover, it is argued that the mechanisms underlying firms’ concerns about
                                        TPU do not indispensably mean that the mechanisms have similar economic impacts. Some
                                        critical issues arise concerning whether tariff shocks are unilateral or whether domestic
                                        import tariffs have no direct impacts on domestic marginal cost. Furthermore, the issue of
                                        whether sticky prices indeed mitigate rather than amplify the expected macroeconomic
                                        contraction emerges.

                                        2.1. Linkages between Trade Policy Uncertainty and the Macro Economy
                                             A number of influential studies have investigated the linkage between trade policy
                                        uncertainty and the overall economy in a macroeconomic level. In order to acquire the
                                        findings by these related papers by the aforementioned strand of the literature, we dwell
                                        on four specific academic studies that examined impacts on exports, consumption and
                                        welfare in economies. The papers of Handley (2014); Feng et al. (2017); Steinberg (2019)
                                        and Imbruno (2019) made use of dynamic models or panel methodologies in order to trace
                                        effects on the real economy.
Trade Policy Uncertainty Effects on Macro Economy and Financial Markets: An Integrated Survey and Empirical Investigation - MDPI
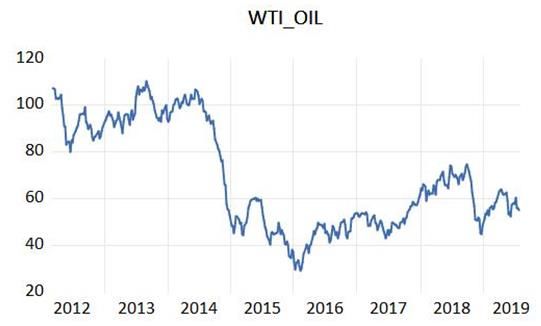
J. Risk Financial Manag. 2021, 14, 41                                                                                           4 of 20

                                             Handley (2014) employed a dynamic, heterogeneous firms’ model and considers
                                        trade policy uncertainty that delays the entry of exporters into new markets and renders
                                        them less sensitive to tariff reductions. It is argued that reducing trade uncertainty with
                                        multilateral commitments at the World Trade Organization (WTO) leads to higher entry
                                        into markets. Additionally, it is supported that reliability about the severity of punishments
                                        for deviations is crucial for preserving product entry in Australia. Estimations indicate that
                                        without the WTO binding commitments in 1996 the growth of Australian exporter-product
                                        varieties would have been lower by 7%. Moreover, if no tariffs and bindings existed in
                                        Australia more than 50% of predicted product growth would rely on uncertainty.
                                             In a similar mentality, Steinberg (2019) made use of a dynamic general equilibrium
                                        model with heterogeneous firms, endogenous export participation and stochastic trade
                                        costs in order to measure the effect of trade policy uncertainty on UK trade after the Brexit.
                                        Input–output data since 2011 was adopted and soft as well as hard Brexit scenarios were
                                        considered. Calibration was employed for estimations and a number of sensitivity analyses
                                        take place. It was predicted that the Brexit effect on the UK economy would be substantial,
                                        especially in the long-run. Trade flows with the European Union would decrease by
                                        8.2%–44.8% and consumption would fall by 0.5%–1.3%. Moreover, UK households would
                                        face welfare losses of about 7000–19,000 GBP. Nevertheless, the macroeconomic impacts
                                        are not predicted to be large. It should be noted that Brexit-induced uncertainty is small
                                        in comparison with other macroeconomic uncertainties. Namely, the total consumption-
                                        welfare equivalent welfare cost of Brexit ranges from 0.4% to 1.2% but less than 25% of this
                                        impact is attributed to Brexit uncertainty.
                                             In a somewhat similar vein, Feng et al. (2017) developed a model of heterogeneous
                                        firms that incorporates trade policy uncertainty. A firm–product level dataset about Chinese
                                        exports to the US and the European Union around China’s WTO accession was adopted.
                                        Findings document that the reduction in trade policy uncertainty led to firms entering and
                                        exiting export activity within fine product-level markets. To be more precise, firms with
                                        higher quality products at lower prices entered the market while firms with the opposite
                                        characteristics left the market. Thereby, Chinese tariff policy uncertainty decreases were
                                        determinants of aggregate reallocation of Chinese exports and encouraged participation by
                                        exporters with higher-quality and lower-price products.
                                             By a different perspective, Imbruno (2019) uses Chinese import data at the coun-
                                        try/product/firm level and panel regressions so as to detect how Chinese imports react
                                        to tariff binding due to China’s accession to the WTO. Evidence is provided that lower
                                        TPU allows access to a larger spectrum of foreign goods that are also characterized by
                                        higher quality. Tariff binding is found to prove beneficial for China in terms of imports as
                                        Chinese producers and trade intermediaries start importing and this results in potential
                                        gains for consumers. It is also emphasized that foreign firms that are located in China
                                        present more intense market seeking in China rather than seeking for resources when trade
                                        policy uncertainty becomes lower because of tariff binding.

                                        2.2. The Nexus between Trade Policy Uncertainty and Institutions
                                              Apart from studies focusing on the macro economy, an embryonic strand of literature
                                        about trade policy uncertainty has emerged that investigates impacts on institutions,
                                        such as democracy. Up to the present, only the study of Tian et al. (2020) has appeared.
                                        Nevertheless, this constitutes a highly promising topic and could spur a proliferating bulk
                                        of relevant research.
                                              More specifically, Tian et al. (2020) look into how income variations driven by trade
                                        uncertainty influence democratic transitions during the 1960–2013 period by using a large
                                        sample of countries. The Polity2score (Marshall et al. 2015) is employed as a measure of
                                        democracy and trade uncertainty is estimated in a gravity model framework. Moreover,
                                        ordinary least squares (OLS) and generalized method of moments (GMM) procedures are
                                        adopted for estimations. Outcomes provide evidence that higher income leads to transi-
                                        tion to democracy and this is more evident in developing regions rather than advanced
Trade Policy Uncertainty Effects on Macro Economy and Financial Markets: An Integrated Survey and Empirical Investigation - MDPI
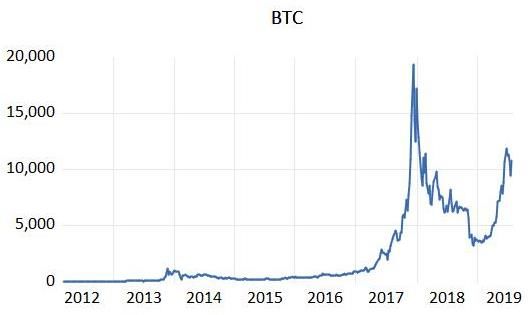
J. Risk Financial Manag. 2021, 14, 41                                                                                           5 of 20

                                        countries. It is argued that significantly higher levels of democracy are traced when GDP
                                        growth increases by 1%. These findings are robust to using different measures of GDP
                                        and uncertainty.

                                        2.3. Trade Policy Uncertainty and Migration
                                             The nexus of socio-economic phenomena with uncertainty regarding economic con-
                                        ditions constitutes another highly promising strand of literature. This is the reason why
                                        the adoption of sophisticated indices measuring economic, monetary, geopolitical or trade
                                        conditions have given a significant boost to relevant empirical estimations. The connection
                                        between trade policy and migration was studied in the paper of Facchini et al. (2019)
                                        and provides a compass for the development of a significantly larger avenue for research
                                        connecting trade policy uncertainty and socio-economic phenomena.
                                             Thereby, Facchini et al. (2019) investigated the level by which trade policy uncertainty
                                        concerning Chinese exporters in the US has influenced internal worker migration in China.
                                        The difference-in-difference specification employed in order to capture variation among
                                        prefectures provides evidence that higher migration emerged due to lower trade uncer-
                                        tainty. More specifically, empirical outcomes reveal higher migration by 24%. The migrants
                                        most responsive to this effect of trade policy uncertainty are “non-hukou”, skilled and in
                                        their prime working age. Moreover, it is argued that “native” unskilled workers in these
                                        prefectures were occupied for more working hours and that internal migrants found a job
                                        in the places they migrated to during lower trade policy uncertainty periods.

                                        2.4. The Connection between Trade Policy Uncertainty and Financial Markets
                                              A highly growing strand of literature about trade policy uncertainty consists of aca-
                                        demic work investigating the impacts of uncertainty on trade in traditional or modern
                                        financial markets. Crowley et al. (2018); Gozgor et al. (2019); He et al. (2020) and Karabulut
                                        et al. (2020) examine the impacts of TPU on financial markets in general, cryptocurrencies
                                        and commodities, respectively. These could put the basis for generating a series of influen-
                                        tial papers that would cast light on how financial markets respond to tariffs, quotas and
                                        other generators of trade uncertainty.
                                              More specifically, Crowley et al. (2018) examine how higher trade policy uncertainty
                                        influences entry or exit decisions of Chinese firms regarding export markets. By being based
                                        on the model of Handley and Limao (2015) three distinct cases of entry are investigated.
                                        Findings indicate that high levels of trade policy uncertainty urge Chinese firms to exit
                                        established foreign markets and render them more hesitant towards entering new foreign
                                        markets. The imposition of antidumping duties in a market is considered as a measure of
                                        rising trade policy uncertainty. Analysis is based on the “tariff echoing” phenomenon (a
                                        firm that did not face tariff hikes is less likely to enter a new market when its neighboring
                                        firms did face one). It is revealed that the potential of tariffs in the future has a minor
                                        effect on Chinese entry into foreign markets. Furthermore, He et al. (2020) examine how
                                        international trade policy uncertainty influences stock markets. The time-varying VAR
                                        (TVP-SV-VAR) methodology is adopted. Evidence indicates that TPU has heterogeneous
                                        impacts on the US and Chinese equity markets. To be more precise, trade conflicts between
                                        these countries generate positive effects on the US stock market whereas exert negative
                                        impacts on the Chinese stock market.
                                              As concerns the study of Gozgor et al. (2019), they explore the nexus between Bitcoin
                                        returns and the TPU index in the US by employing the wavelet power spectrum (WPS),
                                        the wavelet coherency (WTC) and the cross-wavelet (XWT) methodologies. The period
                                        examined spans from July 2010 until August 2018. Econometric results provide evidence
                                        of the existence of significant regime alterations in Bitcoin returns as well as the TPU
                                        index during the first couple and the last couple of years investigated. More specifically, a
                                        negative causal linkage is found from TPU towards Bitcoin during these periods. Thereby,
                                        evidence reveals that trade policy uncertainty is very influential concerning this major
                                        cryptocurrency when regime changes take place.
J. Risk Financial Manag. 2021, 14, 41                                                                                          6 of 20

                                              When it comes to Karabulut et al. (2020), they investigate the connection between
                                        commodity prices and US trade uncertainty spanning the period from January 1996 to
                                        September 2019. The continuous wavelet transform (CWT), WTC and WPS methodologies
                                        are employed for estimations. Moreover, frequency-based Granger causality and con-
                                        ventional vector autoregression techniques are used. It is revealed that strong noises are
                                        detected concerning world trade uncertainty between 2009–2010 and 2015–2016 as well
                                        as for the commodity price index (CPI) between 2008–2009 and 2015–2016 and between
                                        2008–2009 and 2017–2018. Positively correlated and significant co-motional predictions
                                        emerge. Outcomes from wavelet estimations indicate that these co-movements are linked
                                        with important political and economic events in a worldwide level.
                                              In an overall perspective, these four strands of literature reveal that trade policy is
                                        influential on a large range of economic and financial aspects. Evidence indicates that
                                        Australia has significantly benefited in terms of exporter-product varieties and GDP from
                                        tariffs and bindings that lowered trade policy uncertainty. On the other hand, it is revealed
                                        that the United Kingdom has not been largely affected by TPU in the advent of shocks
                                        such as the Brexit. As regards China, it is shown that lower trade policy uncertainty has
                                        brought about significant benefits related to as it has favorited high-quality imports in low
                                        prices, the reallocation of exports, and has allowed potential wealth benefits for Chinese
                                        producers, intermediaries and consumers.
                                              Lower uncertainty as regards trade in a worldwide level is also found to be beneficial
                                        for the development of democratic institutions by a modest extent. This effect takes
                                        place through achieving levels of higher output due to beneficial trading conditions. It is
                                        noteworthy that better conditions for trade lead to social and spatial mobility that result
                                        in higher employment for migrants in different Chinese prefectures. Emphasis should be
                                        put in that the most productive workers prove to be receivers of large positive impacts by
                                        reductions in trade uncertainty in China.
                                              Apart from that, lower levels of trade uncertainty are drivers of stronger incentives
                                        concerning Chinese firms to remain in established foreign markets and become entrants in
                                        new foreign markets. Moreover, it is supported that higher trade policy uncertainty leads
                                        to higher volatility in the market values of Bitcoin. Similar findings come to the surface
                                        regarding commodity prices.
                                              All in all, it can be argued that high trade policy uncertainty is at the root of a
                                        number of malfunctions in the real economy and the financial sector in a global context.
                                        Worse reallocation of resources, lower-quality and expensive products, weak incentives for
                                        participation in international trade, erosion of democratic sentiment, inability of internal
                                        migration and impediment to socio-economic mobility, higher fluctuations in profitable
                                        assets would be brought about by deterioration in trade conditions. Overall, effects of
                                        uncertainty as regards trade activities are found to be modest and cover a wide spectrum
                                        of social, economic and financial domains.

                                        3. Data and Methodology
                                             Apart from conducting a survey on the theoretical and empirical papers that in-
                                        vestigate the nexus between trade policy uncertainty and the macro economy as well
                                        as financial assets, this study undertakes the strenuous task of employing a number of
                                        GARCH specifications in order to investigate how TPU and crude oil market values af-
                                        fect Bitcoin prices. The period examined starts from 4 March 2012 (when data about
                                        Bitcoin trades was available for the first time and sizeable trading volume of Bitcoin
                                        appeared). Data covers until late July 2019 (the latest date when data about TPU was
                                        available). Thereby, we investigate whether TPU and crude oil exert impacts on returns
                                        and volatility of the most important cryptocurrency during its existence. Data about the
                                        highly innovative index of trade policy uncertainty in the US has been extracted from
                                        www.policyuncertainty.com/trade_uncertainty.html. Furthermore, weekly data about
                                        Bitcoin closing prices is used based on the series downloaded from the coinmarketcap.com
                                        database and weekly market values of the West Texas Intermediate (WTI) oil have been
peared). Data covers until late July 2019 (the latest date when data about TPU was
                                           available). Thereby, we investigate whether TPU and crude oil exert impacts on returns
J. Risk Financial Manag. 2021, 14, 41      and volatility of the most important cryptocurrency during its existence. Data about the 7 of 20
                                           highly innovative index of trade policy uncertainty in the US has been extracted from
                                           www.policyuncertainty.com/trade_uncertainty.html. Furthermore, weekly data about
                                           Bitcoin closing prices is used based on the series downloaded from the coinmar-
                                           ketcap.com
                                        extracted       database and weekly
                                                   by Datastream.       Data are market  values of into
                                                                                   transformed     the West  Texas Intermediate
                                                                                                        logarithms    and become   (WTI)  oil
                                                                                                                                       stationary in
                                           have been extracted by Datastream. Data are transformed into logarithms and become
                                        order to conduct estimations.
                                           stationary in order to conduct estimations.
                                             Figure 1 displays the values of the TPU index concerning the US, China and Japan,
                                                Figure 1 displays the values of the TPU index concerning the US, China and Japan,
                                        respectively.
                                           respectively. It  canbe
                                                          It can  beobserved
                                                                      observed thatthat
                                                                                    JapanJapan  exhibits
                                                                                           exhibits         large fluctuations
                                                                                                    large fluctuations              in trade
                                                                                                                        in trade policy  un- policy
                                        uncertainty   throughout      the  entire last  decade   while  the  US  and   China
                                           certainty throughout the entire last decade while the US and China present high tradepresent  high trade
                                        uncertainty
                                           uncertaintyonly
                                                        onlysince
                                                               since 2016  (thelaunch
                                                                     2016 (the  launch ofof Trump’s
                                                                                          Trump’s      administration
                                                                                                    administration  in thein  the US).
                                                                                                                           US).

                                            Figure
                                         Figure 1. 1. Tradepolicy
                                                   Trade    policyuncertainty
                                                                  uncertainty ininthe
                                                                                   theUS,
                                                                                       US,China andand
                                                                                            China   Japan.
                                                                                                        Japan.

                                                 Figure2 2demonstrates
                                              Figure       demonstrates thethemarket
                                                                               market values of Bitcoin
                                                                                        values          and and
                                                                                                of Bitcoin  WTI WTI
                                                                                                                oil. It oil.
                                                                                                                        can be   seenbe
                                                                                                                             It can    that
                                                                                                                                         seen that
                                            Bitcoin enjoyed a skyrocketing increase of its prices during the 2017 bull market. On the
                                         Bitcoin enjoyed a skyrocketing increase of its prices during the 2017 bull market. On the
                                            other hand, oil prices plummeted during 2014 because oil’s market value was too high
                                         other hand, oil prices plummeted during 2014 because oil’s market value was too high
                                            during the early 21st century and demand from emerging countries was also high before
                                         during
                                            2014. the early 21st
                                                   Moreover,    the century  andofdemand
                                                                    appreciation           from emerging
                                                                                    the US dollar            countries
                                                                                                   during 2013 paved the  waswayalso
                                                                                                                                   for high
                                                                                                                                       this before
   J. Risk Financial Manag. 2021, 14, x FOR PEER
                                         2014.     REVIEW
                                                Moreover,      the  appreciation   of the US  dollar   during  2013   paved     the  way     8 of this
                                                                                                                                            for   23
                                            abrupt fall in oil prices.
                                        abrupt fall in oil prices.

                                                    Figure2.2.Bitcoin
                                                   Figure      Bitcoinand
                                                                       and WTI
                                                                           WTI oil
                                                                               oil market values.
                                                                                          values.

                                             WeWeproceed
                                                    proceedtotoanalyze
                                                                analyze the
                                                                         the impacts       uncertaintyin
                                                                              impacts that uncertainty intrade
                                                                                                          tradepolicy
                                                                                                                policyininthe
                                                                                                                            theUS
                                                                                                                                USand
                                                                                                                                   and oiloil
                                        prices
                                         prices(that
                                                 (thatconstitute
                                                       constituteaamajor
                                                                   major determinant
                                                                           determinant ofof economic
                                                                                            economicgrowth)
                                                                                                      growth)exert
                                                                                                               exerton
                                                                                                                     onthe
                                                                                                                         thevalues
                                                                                                                              values
                                                                                                                                   ofof
                                                                                                                                      thethe
                                         most innovative form of liquidity and investment up to the present, which is Bitcoin. For
                                         the purposes of our estimations, we employ a battery of alternative ARCH and GARCH
                                         specifications.      More     specifically,     ARCH,       GARCH,       threshold       ARCH,
                                         Glosten-Jagannathan-Runkle (GJR) form of threshold ARCH, simple asymmetric ARCH,
                                         power ARCH, non-linear ARCH, non-linear GARCH, non-linear ARCH with one shift,
J. Risk Financial Manag. 2021, 14, 41                                                                                            8 of 20

                                        most innovative form of liquidity and investment up to the present, which is Bitcoin. For
                                        the purposes of our estimations, we employ a battery of alternative ARCH and GARCH
                                        specifications. More specifically, ARCH, GARCH, threshold ARCH, Glosten-Jagannathan-
                                        Runkle (GJR) form of threshold ARCH, simple asymmetric ARCH, power ARCH, non-
                                        linear ARCH, non-linear GARCH, non-linear ARCH with one shift, non-linear GARCH
                                        with one shift, asymmetric power ARCH and asymmetric power GARCH specifications
                                        are adopted.
                                             The Dickey–Fuller and Phillips–Perron tests are used in order to test for the existence
                                        of autocorrelation. The ARCH and GARCH methodologies and their specifications are
                                        appropriate for estimating fluctuations in volatility over time and suit well in order to
                                        examine highly risky financial assets such as Bitcoin. It should also be noted that the Akaike
                                        information criterion (AIC) (Akaike 1974) and information Bayesian criterion (SBC/BIC)
                                        (Schwarz 1978) criteria are employed in order to detect which specification is more suitable
                                        for this examination.
                                             The ARCH (Engle Robert 1982) and GARCH (Bollerslev 1986) models are introduced
                                        and support that the variance of the current error is a function of the volatility of the error
                                        conditions of previous time periods. The residual effect left unexplained by other models
                                        stands for the error conditions in these models.
                                             The ARCH model can be represented by:

                                                                               h2t = ω + αu2t−1                                     (1)

                                        and the GARCH specification is given by:

                                                                          h2t = ω + αu2t−1 + βh2t−1                                 (2)

                                             Other specifications employed are given by Equations (3)–(8).
                                             Threshold ARCH based on by Zakoian (1994):

                                                                     h2t = ω + α1 |ut−1 | + γ1 I |ut−1 < 0|                         (3)

                                             GJR-Threshold ARCH based on Glosten et al. (1993):

                                                                     h2t = ω + α1 u2t−1 + γ1 I |ut−1 < 0|                           (4)

                                             Non-linear ARCH based on Higgins and Bera (1992):

                                                                             h2t = ω + α1 |ut−1 |δ                                  (5)

                                             Non-linear GARCH:
                                                                        h2t = ω + α1 |ut−1 |δ + β 1 hδt−1                           (6)
                                             Asymmetric Power ARCH by Ding et al. (1993):

                                                                       h2t = ω + α1 (|ut−1 | − γ1 ut−1 )δ                           (7)

                                             Asymmetric Power GARCH:

                                                                  h2t = ω + α1 (|ut−1 | − γ1 ut−1 )δ + βhδt−1                       (8)

                                            Simple asymmetric ARCH based on Capie et al. (2005) and power ARCH based on
                                        Ding et al. (1993) are also adopted as alternative forms of non-linear ARCH and asymmetric
                                        power ARCH, respectively.
                                            In order to select which of the aforementioned specifications is appropriate for esti-
                                        mating Bitcoin’s impacts received from TPU and crude oil, the AIC has been applied:

                                                                             AIC = 2k − 2nL Θ̂
                                                                                                 
                                                                                                                               (9)
J. Risk Financial Manag. 2021, 14, 41                                                                                            9 of 20

                                             Moreover, the SBC/BIC has been adopted:

                                                                         BIC = klnn − 2lnL Θ̂
                                                                                                
                                                                                                                                  (10)

                                            Lowest values in both criteria represent the best fit model for the estimations
                                        undertaken.

                                        4. Econometric Results
                                             A number of significant econometric results are brought about by employing a range
                                        of GARCH specifications in order to detect the nexus between Bitcoin market values and
                                        trade policy uncertainty as well as crude oil. The following Table 1a–c provides GARCH
                                        estimations about this linkage by adopting 12 different specifications. It should be noted
                                        that some alternative models could not be applied for the purposes of estimations of the
                                        specific relation between variables. Moreover, the AIC and SBC/BIC criteria have been
                                        employed in order to detect which methodology is more appropriate in this study.

       Table 1. Econometric outcomes based on (a) ARCH, GARCH, threshold ARCH, and GJR-form of threshold ARCH
       specifications; (b) simple asymmetric ARCH, power ARCH, non-linear ARCH and non-linear GARCH specifications;
       (c) non-linear ARCH with one shift, non-linear GARCH with one shift, asymmetric power ARCH and asymmetric power
       GARCH specifications.

 (a)
                                                                                                                  GJR-Form of
                                                        ARCH                GARCH           Threshold ARCH
                                                                                                                Threshold ARCH
                                                         2.2595              0.3661               0.4434              0.259
                                    TPU
                                                       (0.000) ***         (0.000) ***          (0.000) ***        (0.000) ***
                                                        −0.1069             −0.6985              −0.3336            −0.1059
       Mean equation                Oil
                                                       (0.000) ***         (0.000) ***          (0.000) ***        (0.000) ***
                                                         5.513                7.2684              5.578              5.5132
                                  constant
                                                       (0.000)***           (0.000)***          (0.000)***         (0.000) ***
                                                         1.0375              0.9683                                  0.9585
                                   Arch
                                                       (0.000) ***         (0.000) ***                             (0.005) ***
                                                                                                  0.9272
                                  Abarch
                                                                                                (0.000) ***
                                                                                                    0.0452
                                  Atarch
   Variance equation                                                                                (0.843)
                                                                                                                     0.1435
                                   Tarch
                                                                                                                     (0.746)
                                                                             0.0988
                                   Garch
                                                                             (0.224)
                                                          0.01               0.0082               0.0761             0.0099
                                 Constant
                                                       (0.000) ***           (0.145)            (0.001) ***        (0.000) ***
           AIC                                          986.262             1034.152            1014.299             987.516
           BIC                                         1006.054             1057.903                1038.05         1011.267
 (b)
                                                  Simple Asymmetric
                                                                          Power ARCH        Non-linear ARCH    Non-linear GARCH
                                                       ARCH
                                                         0.2478              0.5553               0.5477              0.501
                                    TPU
                                                       (0.000) ***         (0.000) ***          (0.000) ***        (0.000) ***
                                                        −0.0702              −1.134              −1.1087            −1.1499
       Mean equation                Oil
                                                       (0.018) **          (0.000) ***          (0.000) ***        (0.000) ***
                                                          5.42               8.0777               8.0137             8.3442
                                  constant
                                                       (0.000) ***         (0.000) ***          (0.000) ***        (0.000) ***
J. Risk Financial Manag. 2021, 14, 41                                                                                                             10 of 20

                                                                         Table 1. Cont.

 (b)
                                                     Simple Asymmetric
                                                                                     Power ARCH              Non-linear ARCH     Non-linear GARCH
                                                          ARCH
                                                              1.036
                                   Arch
                                                           (0.000) ***
                                                             0.0663
                                   Saarch
                                                             (0.147)
                                                                                         0.9905
                                   Parch
                                                                                       (0.002) ***
   Variance equation
                                                                                                                   0.9793              0.7593
                                   Narch
                                                                                                                 (0.000) ***         (0.001) ***
                                                                                                                  −0.0391            −0.0619
                                  Narch_k
                                                                                                                  (0.356)            (0.084) *
                                                                                                                                       0.2157
                                   Garch
                                                                                                                                     (0.001) ***
                                                             0.0096                       0.0341                   0.0253              0.0129
                                 Constant
                                                           (0.000) ***                    (0.601)                (0.000) ***         (0.000) ***
                                                                                          1.7719
          Power
                                                                                          (0.122)
           AIC                                               985.013                      1033.445                1032.704           1028.214
           BIC                                              1008.764                      1057.196                1056.455           1055.923
 (c)
                                                      Non-linear ARCH            Non-linear GARCH           Asymmetric Power     Asymmetric Power
                                                       with one shift              with one shift               ARCH                 GARCH
                                                             0.5476                       0.501                    0.5596              0.7517
                                    TPU
                                                           (0.000) ***                 (0.000) ***               (0.000) ***         (0.000) ***
                                                            −1.1087                     −1.1499                   −1.1351              0.7271
                                    Oil
                                                           (0.000) ***                 (0.000) ***               (0.000) ***         (0.000) ***
                                                             8.0137                      8.3442                    8.0702             0.4941
                                  constant
                                                           (0.000) ***                 (0.000) ***               (0.000) ***          (0.199)
                                                             0.9793                      0.7593
                                   Narch
                                                           (0.000) ***                 (0.001) ***
       Mean equation                                        −0.0391                       −0.0619
                                  Narch_k
                                                            (0.356)                       (0.084) *
                                                                                                                   0.9505              1.0525
                                  Aparch
                                                                                                                 (0.002) ***         (0.001) ***
                                                                                                                   0.0569             0.0368
                                 Aparch_e
                                                                                                                   (0.702)            (0.725)
                                                                                         0.2157                                       −0.0286
                                   Garch
                                                                                       (0.001) ***                                    (0.737)
                                                             0.0253                      0.0129                    0.0453             0.0472
                                 Constant
                                                           (0.000) ***                 (0.000) ***                 (0.532)            (0.423)
                                                                                                                   1.5837              2.5123
          Power
                                                                                                                    (0.1)            (0.014) **
           AIC                                              1032.704                      1028.214                1035.267           1022.707
           BIC                                              1056.455                      1055.923                1062.976           1054.374
                                Note: *, **, *** stand for 90%, 95%, and 99% levels of statistical significance, respectively.

                                             From the tables, it can be seen that according to the AIC criterion the most suitable
                                        methodology is the application of the simple asymmetric ARCH model as this presents
                                        the lowest AIC value (985.013). Nevertheless, the SBC/BIC criterion indicates that the
                                        optimal model is the GARCH because the lowest BIC value (1006.054) is estimated for this
                                        among all methodologies used. These findings provide evidence that, indeed, GARCH-
                                        type specifications are needed in order to capture the special volatility characteristics of
J. Risk Financial Manag. 2021, 14, 41                                                                                           11 of 20

                                        the variables under scrutiny. Based on the AIC criterion, Bitcoin exhibits asymmetric
                                        form volatility when examining its linkage with trade policy uncertainty. This can be
                                        attributed to the highly volatile character of this major cryptocurrency as well as the highly
                                        unexpected incidents (trade wars, tariffs) that generate trade policy uncertainty.
                                               It should be emphasized that in almost all the estimations undertaken (except for the
                                        asymmetric power GARCH methodology) evidence is provided that trade policy uncer-
                                        tainty positively influences Bitcoin prices in a statistically significant manner. Furthermore,
                                        it is revealed that crude oil market values are negative determinants of Bitcoin prices also
                                        in a statistically trustworthy manner according to all methodologies (with the exception
                                        of the asymmetric power GARCH). Notably, in the majority of estimations, the impact of
                                        trade policy uncertainty on Bitcoin market value ranges from 0.2478 to 0.5596, while the
                                        asymmetric power GARCH results present a higher coefficient (0.7517) and GARCH results
                                        display that such uncertainty is very highly influential (2.2595). As concerns findings
                                        about crude oil impacts, the coefficient estimated ranges from −1.1499 to −0.1059, with the
                                        exception of the asymmetric power GARCH estimation (0.7271). Thereby, it can be seen
                                        in an overall perspective that trade policy uncertainty exerts positive effects in a medium
                                        extent towards Bitcoin market values. Moreover, econometric outcomes suggest that oil
                                        prices have strong impacts on Bitcoin values in a negative direction.
                                               The economic implications of these findings are extremely important for policymakers
                                        and investors. Bitcoin enjoys a proliferating rhythm of popularity concerning investors’
                                        preferences and since its bull market in a skyrocketing pace during 2017 has been among
                                        the most widely used financial assets in the effort of portfolio managers to improve their
                                        risk-return trade-off. Generally, Bitcoin is considered to be a risky asset due to its bubble
                                        characteristics (for more details see: Kyriazis et al. 2020). Nevertheless, there is academic
                                        work supporting that it can be categorized somewhere between the US dollar and gold as
                                        concerns safe haven characteristics (Dyhrberg 2016; Baur et al. 2018). Notably, recent studies
                                        have shown that as the Bitcoin market matures, this renders more similar to conventional
                                        assets and its speculatory character fades out (for more details see: Kyriazis 2019).
                                               The modest and positive nexus between trade policy uncertainty and Bitcoin prices
                                        indicates that trade wars, higher tariffs and other events that hurt free trade led to the
                                        growth of speculative incentives among investors. That is, when conventional ways of
                                        wealth generating (trade) fail speculative forms of investments constitute a modestly
                                        connected alternative solution. Therefore, during financial turmoil that trade uncertainty is
                                        to blame, profit-seeking economic agents should include Bitcoin in their portfolios as this
                                        would highly likely lead to increases in their investment profits. Special emphasis should
                                        also be put in that lower oil prices negatively affect Bitcoin market values. When demand
                                        for oil is low, this means that economic activity is not vivid and investment plans are not
                                        as promising as would be desired if the economy was flourishing. Differently said, lower
                                        oil prices are significant indicators of crises, such as the COVID-19 pandemic (Sharif et al.
                                        2020). Following a similar reasoning as above, it is easily discernible that low economic
                                        activity (as revealed by low oil prices) would lead to lower income for the majority of
                                        people and would highly likely increase their incentives to invest in risky and innovative
                                        financial assets in order not to suffer losses. Thereby, Bitcoin would enjoy higher demand
                                        and consequently higher market values. This is because a large number of investors would
                                        prefer to replace conventional assets with Bitcoin in order to safeguard a respectable level
                                        of profits and not suffer a much higher level of riskiness than with conventional assets that
                                        usually are bearish during crises.
                                               For the reasons analyzed above, the innovative measure of trade policy uncertainty
                                        can offer fruitful indications to investors about how to re-arrange the synthesis of their
                                        portfolios when economic and trade conditions are not favorable for traditional investments.
                                        This would provide a roadmap for policymakers and economic agents in a worldwide
                                        level and significantly improve the perception of investors about the influence of adverse
                                        trade effects on financial markets and the macro economy.
J. Risk Financial Manag. 2021, 14, 41                                                                                            12 of 20

                                        5. Conclusions and Avenues for Further Research
                                              This study constitutes an integrated survey on the impacts of trade policy uncertainty
                                        on a range on aspects of the economy and the financial sector. More specifically, the focus
                                        of our research is made on the macro economy, institutions, socio-economic mobility in
                                        the form of migration opportunities and financial markets. Although the bulk of relevant
                                        research is still not large, it reflects in a crystal-clear manner the potential for generating a
                                        highly proliferating body of academic work based on a range of remarkably interesting
                                        trade-related strands of literature in economics and finance.
                                              Findings based on the thirteen primary studies under scrutiny provide evidence
                                        that high levels of trade policy uncertainty are responsible for a lot of failures in the real
                                        economy and the financial sector. Outcomes about the impacts of trade policy uncertainty
                                        on different facets of the economy reveal that if TPU decreases many benefits are brought
                                        about regarding major economies such as the US, China, Japan, Australia and the United
                                        Kingdom. It should be noted that the impacts on imports, exports and income in China
                                        appear to be modest and concern a large portion of the TPU academic literature. It is
                                        supported that China’s accession in the WTO has enabled easier entry into international
                                        markets and prevented exit from established markets. Moreover, it has incentivized Chinese
                                        producers and trade intermediaries and has boosted imports of high-quality and low-price
                                        products so increased potential benefits for consumers. Moreover, it is argued that lower
                                        trade uncertainty promotes higher migration by 24%. The migrants most perceptive of this
                                        impact are “non-hukou”, skilled and in their prime working age. Moreover, US–China
                                        trade conflicts cause positive impacts on the US stock market while the opposite happens
                                        regarding China.
                                              Tariffs and bindings are connected with product growth in Australia. Furthermore, it
                                        is supported that compliance with the WTO agreements is essential for preserving imports
                                        and not suffer lower exporter-product varieties. Moreover, commodity prices in the US are
                                        substantially influenced from turbulent US trade conditions. Such co-movements are also
                                        enhanced by important political and economic events in a global level.
                                              Furthermore, TPU makes an important giver of impacts towards Bitcoin when regime
                                        changes take place. This happens, especially, during the first and the last couple of Bitcoin’s
                                        trading. Another highly promising finding is that trade policy uncertainty is a positive
                                        determinant of commodity prices as significant co-motional predictions are brought to the
                                        surface. Notably, TPU also influences the strength of democratic institutions in a country
                                        as it found to strengthen democracy in a range of countries. This cast light on recently
                                        unknown aspects of political economics and offers the foundations for a highly promising
                                        new strand of literature.
                                              Almost all the estimations conducted (except for the asymmetric power GARCH
                                        methodology) reveal that trade policy uncertainty positively influences and that crude oil
                                        market values negative impact Bitcoin prices also in a statistically significant manner. In
                                        the majority of estimations, the effect of TPU on Bitcoin market value mostly ranges from
                                        0.2478 to 0.5596. By analyzing oil impacts, the coefficient estimated mostly takes values
                                        from −1.1499 to −0.1059. Therefore, trade policy uncertainty is found to exert positive
                                        and modest impacts towards Bitcoin prices whereas oil prices strongly and negatively
                                        influence Bitcoin values. The AIC and BIC criteria indicate that simple asymmetric ARCH
                                        and ARCH are the most appropriate specifications for estimations, respectively.
                                              In an overall perspective, evidence reveals that high trade policy uncertainty urges
                                        towards non-optimal allocation of resources, imports of lower-quality and expensive prod-
                                        ucts, less willingness to participation in international trade and a weakening of democratic
                                        sentiment. Moreover, instability in trade conditions impedes internal migration and con-
                                        stitutes an obstacle to socio-economic mobility. Apart from that, higher TPU is linked to
                                        higher levels of volatility in risky assets. Generally, trade policy uncertainty is a giver of
                                        impacts in a modest level but covers a wide variety of economic and financial domains.
                                        As concerns the empirical estimations undertaken in this study, it is documented that
                                        TPU strengthens speculator incentives among investors as traditional investment assets
J. Risk Financial Manag. 2021, 14, 41                                                                                         13 of 20

                                        are not profitable. The inclusion of Bitcoin in portfolios would help investors preserve a
                                        satisfactory trade-off level of risk-return. Moreover, oil prices display negative nexus with
                                        Bitcoin market values due to weak economic activity during uncertain periods.
                                              There is a threefold contribution of this study. Firstly, it helps understanding trade
                                        policy uncertainty and its impacts and provides a bird’s-eye view of its nexus with the
                                        macro economy, institutions, socio-economic matters like migration, as well as financial
                                        markets (stocks, cryptocurrencies and commodities). Secondly, it constitutes an integrated
                                        survey of advanced theoretical and empirical research on trade policy uncertainty not only
                                        after but also before the breakthrough by the Caldara et al. (2020) index took place. Fur-
                                        thermore, econometric outcomes by a large spectrum of ARCH and GARCH specifications
                                        provide insights on how trade policy uncertainty and crude oil influence prices of highly
                                        speculative assets, such as Bitcoin. Thereby, the strenuous task of casting light on every
                                        aspect of trade policy effects is undertaken.
                                              This integrated survey could provide a compass for taking safer investment decisions
                                        during periods of uncertainty in trade policies and provide a beneficial boost to literature
                                        about the highly promising strand of TPU effects in economics and finance. Avenues
                                        for further research related to trade policy uncertainty could include examination of
                                        a larger range of studies and estimation of the nexus with alternative macroeconomic
                                        variables traditional or sophisticated financial products. It would be extremely interesting
                                        to investigate deeper into the TPU linkage with social mobility and demographic or
                                        labor characteristics as well as to examine effects on other than democratic regimes. The
                                        creation of TPU indices concerning European countries or less advanced regions would
                                        significantly help towards the development of this remarkably promising domain of
                                        economics and finance.

                                        Funding: This research received no external funding.
                                        Institutional Review Board Statement: Not applicable.
                                        Informed Consent Statement: Not applicable.
                                        Data Availability Statement: Data sharing not applicable.
                                        Conflicts of Interest: The author declares no conflict of interest.
J. Risk Financial Manag. 2021, 14, 41                                                                                                                                                                  14 of 20

Appendix A

                                                                Table A1. Basic characteristics of studies investigating trade policy uncertainty.

          Authors               Journal             Variables                        Data Source                 Period               Country              Methodology                     Findings
                                                                                                                                                       Open-economy New
                                                                                                                                                      Keynesian DSGE model
                                                                            11 newspapers (Boston Globe,
                                          Three measures of US Trade                                                                                  with a discrete choice of   Higher TPU results in lower
                                                                           Chicago Tribune, Guardian, Los
                                              Policy Uncertainty                                                                                      entering and exiting the    US business investment by
                                                                           Angeles Times, New York Times,
   Caldara et al. (2020)         JME              Tariff rates                                                 1960–2018               USA                 export market           1% while VAR outcomes
                                                                           Wall Street Journal, Washington
                                           Firm-level and aggregate                                                                                         Calibration              present even greater
                                                                                         Post)
                                             macroeconomic data                                                                                             Regressions                   reduction
                                                                                      Compustat
                                                                                                                                                      Vector Autoregressions
                                                                                                                                                               (VAR)
                                                                           Chinese Customs Database (CCD)
                                                                                 by China’s General                                    China                                            High trade policy
                                                                             Administration of Customs                            33 countries (20                                 uncertainty urges Chinese
                                          Chinese trade transactions
                                                                            Global Antidumping Database                            largest export     Model based on Handley        firms to exit established
                                                    Tariffs
   Crowley et al. (2018)          JIE                                         (GAD) by Chad Bown and           2000–2009         destinations and       and Limao (2015)          foreign markets and become
                                          Macroeconomic data on real
                                                                            maintained by the World Bank                           countries with       Panel regressions            more hesitant towards
                                           GDP and exchange rates
                                                                             World Bank’s Development                           antidumping duties                                    entering new foreign
                                                                                 Indicators database                              against China)                                            markets.
                                                                           USDA Economic Research Service
                                          US Trade Policy Uncertainty
                                               Internal migration              China’s Population Census
                                            Exports (firm-level data)       China Custom Data (CCD) (also
                                                                                                                                                                                   Higher migrationin China
                                          Industry skill-intensity data    called “China Import and Export
                                                                                                                                                                                   by 24% due to lower TPU.
                                                     Tariffs                 data”) from World Integrated
                                                                                                                                       USA                                             The migrants most
   Facchini et al. (2019)         JIE     Pervasiveness of barriers to     Trading Solution (WITS) database    2000–2005                                 Panel estimations
                                                                                                                                       China                                             responsive are
                                              investment in China           2004 China’s Annual Survey of
                                                                                                                                                                                  “non-hukou”, skilled and in
                                           US Multi Fiber Agreement          Industrial Firms (CASIF) (also
                                                                                                                                                                                    their prime working age
                                                  (MFA) quota                known as “Chinese Industrial
                                           Availability of production           Enterprises Database”)
                                           subsidies to Chinese firms
                                            Firm-product level dataset                                                                                                            Lower Chinese tariff policy
                                          Fixed export costs (measured                                                                                                              uncertainty determined
                                            as fixed assets of exporting                                                                               Heterogeneous firm          aggregate reallocation of
                                                                            China’s manufacturing survey                         China connected to
                                           firms or as the intermediary                                                                               model based on Handley         Chinese exports and
     Feng et al. (2017)           JIE                                                  data                    2000–2006             USA and
                                                  share of exports)                                                                                      and Limao (2015)         encouraged participation by
                                                                                                                                  European Union
                                                       Tariffs                                                                                          Panel regressions               exporters with
                                              New entrant and exiter                                                                                                                  higher-quality and
                                                      margins                                                                                                                        lower-price products
J. Risk Financial Manag. 2021, 14, 41                                                                                                                                                        15 of 20

                                                                                                Table A1. Cont.

          Authors               Journal            Variables                      Data Source                     Period      Country          Methodology                     Findings
                                                                                                                                          Wavelet Power Spectrum
                                                                                                                                           (WPS) methodology by
                                                                                                                                            Torrence and Compo
                                                                                                                                                    (1998)
                                                                                                                                          Cross Wavelet Transform       USA TPU positively and
                                                                                                                                              (CWT) method by         significantly affects Bitcoin
                                              Bitcoin price index
                                                                            www.coindesk.com               July 2010–August                 Grinsted et al. (2004)    returns but exert a negative
    Gozgor et al. (2019)         FRL      USA Trade Policy Uncertainty                                                          USA
                                                                          www.policyuncertainty.com               2018                    Wavelet Coherency (WTC)       impact on these returns
                                                     (TPI)
                                                                                                                                          method by Grinsted et al.      during extreme events
                                                                                                                                                    (2004)                  (regime change)
                                                                                                                                            VAR-based frequency
                                                                                                                                          domain Granger causality
                                                                                                                                          by Breitung and Candelon
                                                                                                                                                    (2006)
                                                                                                                                                                      Growth of exporter-product
                                                                                                                                                                       varieties would have been
                                                                                                                                                                         7% lower if no binding
                                                                         UNCTAD TRAINS database via                                                                   commitments took place by
                                                    Tariffs                the World Integrated Trade                                                                      the WTO after 1996
                                            Bindings for Australia’s            Solution (WITS)                                                                         If no tariffs and bindings
                                                                                                                                          Dynamic heterogeneous
      Handley (2014)              JIE          Uruguay Round                WTO’s consolidated tariff         1993–2001       Australia                                    existed, over 50% of
                                                                                                                                              firms model
                                                Commitments               schedules (CTS) by the Tariff                                                                predicted product growth
                                                 Import data                Analysis On-line database                                                                     would be linked with
                                                                         Australian Bureau of Statistics                                                                        uncertainty
                                                                                                                                                                       WTO commitments could
                                                                                                                                                                       lead to lower uncertainty
                                                                                                                                                                       and higher product entry
                                                                                                                                                                       US–China trade conflicts
                                                                                                                                                                      generate positive effects on
                                                    S&P500                                                     January         USA            TVP-SV-VAR by
      He et al. (2020)           FRL                                                    -                                                                                 the US stock market
                                           Shanghai Composite Index                                        2000–April 2019     China          Nakajima (2011)
                                                                                                                                                                       whereas negative impacts
                                                                                                                                                                      on the Chinese stock market
J. Risk Financial Manag. 2021, 14, 41                                                                                                                                                                     16 of 20

                                                                                                    Table A1. Cont.

          Authors               Journal             Variables                        Data Source                      Period          Country                Methodology                     Findings
                                                                            Chinese Customs Trade Statistics                                                                       Lower Chinese TPU leads to
                                                                                        (CCTS)                                                                                       multinationals relocating
                                                Imports at the
                                                                             World Bank’s World Integrated                                                                          the downstreame stages of
                                          country/product/firm level                                                                                      Panel regression with
                                                                            Trade Solution (WITS) database                                                                         global value chains in China
      Imbruno (2019)              JCE           Applied tariffs                                                   2000–2006            China                    dummies
                                                                               WTO’s Consolidated Tariff                                                                             more than the upstream
                                                 Bound tariffs                                                                                          Linear probability model
                                                                               Schedules (CTS) database                                                                                 stages. So they are
                                            Non-tariff trade barriers
                                                                              China’s Protocol of the WTO                                                                          market-seeking rather than
                                                                                       accession                                                                                    resource-seeking in China.
                                                                                                                                                        VAR based on Breitung       Strong noises concerning
                                                                                                                                                         and Candelon (2006)         world trade uncertainty
                                                                                                                                                         Granger causality by        between 2009–2010 and
                                            World Trade Uncertainty                                                                                         Granger (1969)         2015–2016 as well as for CPI
                                                                                                                   January
                                           Index by Ahir et al. (2018)                                                                                   Continuous Wavelet          between 2008–2009 and
  Karabulut et al. (2020)        EAP                                                 IMF database              1996–September          USA
                                           US Commodity Price Index                                                                                       Transform (CWT),           2015–2016 and between
                                                                                                                     2019
                                                     (CPI)                                                                                             Wavelet Coherency (WC),      2008–2009 and 2017–2018.
                                                                                                                                                       Wavelet Power Spectrum      Co-movements linked with
                                                                                                                                                       (WPS) based on Ramsey         important political and
                                                                                                                                                                (1999)                  economic events
                                                                                                                                                           Dynamic General
                                                                             World Input Output Database                                                Equilibrium Model with                The total
                                                                                 (Timmer et al. 2015)                                                    heterogeneous firms,        consumption-equivalent
                                            Macroeconomic variables                                                                     UK
                                                                            EFIGE dataset (Altomonte and                                                  endogenous export        welfare cost due to Brexit is
      Steinberg (2019)            JIE               Prices                                                       Since 2011      European Union
                                                                                   Aquilante 2012)                                                         participation and       between 0.4% and 1.2% but
                                                                                                                                 Rest of the world
                                                                            World Bank Exporter Dynamics                                                 stochastic trade costs     uncertainty is repsonsible
                                                                            Database (Fernandes et al. 2016)                                             Regime construction       for less than 25% of this cost
                                                                                                                                                              Calibration
                                            Firm-level TPU dataset of                                                                                   DSGE model with sticky
                                          Caldara et al. (2020) linked to                                                                              prices and sunk exporting
                                                                                                                                                                                     A number of issues arise
                                          the US input–output accounts      US Bureau of Economic Analysis                                                        costs
      Steinberg (2020)           JME                                                                              1960–2018            USA                                           concerning Caldara et al.
                                             Trade exposure (export                  Compustat                                                           Simple model of price-
                                                                                                                                                                                              (2020)
                                            exposure, imported input                                                                                     setting under nominal
                                                    exposure)                                                                                                   rigidities
                                                                                                                                                         Ordinary Least Squares
                                          3-year and 5-year uncertainty                                                                                           (OLS)              Higher income leads to
                                                                            Data from Glick and Rose (2016)
                                            measures based on Jurado                                                               194 countries         Generalized Method of      democratic transitions but
     Tian et al. (2020)           EM                                        Data from Marshall et al. (2015)      1960–2013
                                                   et al. (2015)                                                                                          Moments (GMM) by            mainly in developing
                                            Polity2score (democracy)                                                                                    Blundell and Bond (1998)           countries

      Notes: EAP, EM, FRL, JCE, JIE and JME stand for Economic Analysis and Policy, Economic Modelling, Finance Research Letters, Journal of Comparative Economics, Journal of International Economics and
      Journal of Monetary Economics.
J. Risk Financial Manag. 2021, 14, x FOR PEER REVIEW                                                                           20 of 23
    J. Risk Financial Manag. 2021, 14, x FOR PEER REVIEW                                                                            20 of 23
    J. Risk Financial Manag. 2021, 14, 41                                                                                      17 of 20

1
1
2                                      FigureA1.
                                      Figure  A1.Google
                                                  GoogleScholar
                                                         Scholarcitations
                                                                  citations and
                                                                          and   Plum-X
                                                                              Plum-X    citations
                                                                                     citations (as(as
                                                                                                   of 7ofSeptember
                                                                                                          7 September 2020).
                                                                                                                   2020).
2                                      Figure A1. Google Scholar citations and Plum-X citations (as of 7 September 2020).

3
3
4                                      Figure A2. Plum-X captures (as of 7 September 2020).
4                                      FigureA2.
                                      Figure  A2.Plum-X
                                                  Plum-Xcaptures
                                                         captures(as(as
                                                                      ofof 7 September
                                                                        7 September    2020).
                                                                                    2020).
J. Risk Financial Manag. 2021, 14, 41                                                                                                                  18 of 20
     J. Risk Financial Manag. 2021, 14, x FOR PEER REVIEW                                                                                                       21 of 23

 5
 6                                            FigureA3.
                                             Figure  A3.Tweets
                                                         Tweetsper
                                                                perpaper
                                                                    paper(as(as
                                                                              ofof 7 September
                                                                                7 September    2020).
                                                                                            2020).

 7   References
 8   References
     (Ahir et al. 2018) Ahir, Hites, Nicholas Bloom, and Davide Furceri. 2018. The World Uncertainty Index. Available online:
 9          http://dx.doi.org/10.2139/ssrn.3275033
     Ahir, Hites,   Nicholas Bloom, and Davide Furceri.      (accessed
                                                                     2018. on
                                                                            The10World
                                                                                   September      2020). Index. Available online: http://dx.doi.org/10.2139/
                                                                                           Uncertainty
10         ssrn.3275033
     (Akaike                (accessed
                1974). Akaike,          on 10 September
                                   Hirotugu.    1974. A new  2020).look at the statistical model identification. IEEE Transactions on Automatic Control 19:
11   Akaike,   Hirotugu. 1974. A new look at the statistical model identification. IEEE Transactions on Automatic Control 19: 716–23. [CrossRef]
            716–23.
12   Altomonte,
     (Altomonte Carlo,       and Tommaso
                     and Aquilante       2012)Aquilante.
                                                Altomonte,    2012.
                                                                  Carlo,Theand
                                                                            EU-EFIGE/Bruegel-Unicredit
                                                                                  Tommaso Aquilante. 2012.      Dataset
                                                                                                                     The(No.  2012/13). Bruegel Working
                                                                                                                          EU-EFIGE/Bruegel-Unicredit           Paper.(No.
                                                                                                                                                              Dataset
13         Brussels:
            2012/13). Bruegel,
                        Bruegel Available
                                  Working online:
                                              Paper. https://www.bruegel.org/2012/10/the-eu-efigebruegel-unicredit-dataset/ (accessed on 10
14   (BaierSeptember      2020). 2004) Baier, Scott L., and Jeffrey H. Bergstrand. 2004. Economic determinants of free trade agreements. Journal
              and Bergstrand
15   Baier, of
             Scott L., and Jeffrey
               international               64: 29–63.2004. Economic determinants of free trade agreements. Journal of international Economics 64:
                                     H. Bergstrand.
                               Economics
16   (Baur29–63.
             et al. [CrossRef]
                    2018) Baur, Dirk G., Thomas Dimpfl, and Konstantin Kuck. 2018. Bitcoin, gold and the US dollar—A replication and
17   Baur, extension.
            Dirk G., Thomas
                          FinanceDimpfl,
                                   Researchand   Konstantin
                                              Letters  25: 103–10.Kuck. 2018. Bitcoin, gold and the US dollar—A replication and extension. Finance
18         Research1993)
     (Ben-David        Letters 25: 103–10.Dan.
                            Ben-David,      [CrossRef]
                                                 1993. Equalizing exchange: Trade liberalization and income convergence. The Quarterly Journal of
19   Ben-David,     Dan.108:
            Economics      1993.  Equalizing exchange: Trade liberalization and income convergence. The Quarterly Journal of Economics 108:
                               653–79.
20
           653–79.    [CrossRef]
     (Bhagwati and Ramaswami 1963) Bhagwati, Jagdish, and Vangal K. Ramaswami. 1963. Domestic distortions, tariffs and the theory
     Bhagwati, Jagdish, and Vangal K. Ramaswami. 1963. Domestic distortions, tariffs and the theory of optimum subsidy. Journal of Political
21          of optimum subsidy. Journal of Political Economy 71: 44–50.
           Economy 71: 44–50. [CrossRef]
22   (Blundell and Bond 1998) Blundell, Richard, and Stephen Bond. 1998. Initial conditions and moment restrictions in dynamic panel
     Blundell, Richard, and Stephen Bond. 1998. Initial conditions and moment restrictions in dynamic panel data models. Journal of
23          data models. Journal of Econometrics 87: 115–43.
           Econometrics 87: 115–43. [CrossRef]
24   (Bollerslev 1986) Bollerslev, Tim. 1986. Glossary to ARCH (GARCH). In Volatility and Time Series Econometrics Essays in Honor of Robert
     Bollerslev, Tim. 1986. Glossary to ARCH (GARCH). In Volatility and Time Series Econometrics Essays in Honor of Robert Engle. MarkWatson,
25          Engle. MarkWatson, Tim Bollerslev and Jerey. Oxford: University Press.
           Tim Bollerslev and Jerey. Oxford: University Press.
26   (Breitung and Candelon 2006) Breitung, Jörg, and Bertrand Candelon. 2006. Testing for short-and long-run causality: A
     Breitung, Jörg, and Bertrand Candelon. 2006. Testing for short-and long-run causality: A frequency-domain approach. Journal of
27          frequency-domain approach. Journal of Econometrics 132: 363–78.
           Econometrics 132: 363–78. [CrossRef]
28   (Burstein   and Cravino
     Burstein, Ariel,   and Javier2015)   Burstein,
                                    Cravino.   2015.Ariel,
                                                      Measuredand aggregate
                                                                      Javier Cravino.     2015.international
                                                                                  gains from     Measured aggregate        gains Economic
                                                                                                               trade. American    from international     trade. American
                                                                                                                                            Journal: Macroeconomics
29          Economic    Journal:
           7: 181–218. [CrossRef] Macroeconomics      7: 181–218.
30   (CaldaraDario,
     Caldara,    et al. 2020)
                         Matteo Caldara,   Dario,
                                  Iacoviello,       Matteo
                                               Patrick         Iacoviello,
                                                         Molligo,      Andrea  Patrick   Molligo,
                                                                                 Prestipino,   and Andrea     Prestipino,
                                                                                                    Andrea Raffo.    2020. and
                                                                                                                            The Andrea
                                                                                                                                 economic  Raffo.   2020.
                                                                                                                                              effects      The policy
                                                                                                                                                      of trade economic
31          effects  of trade  policy   uncertainty.    Journal    of  Monetary
           uncertainty. Journal of Monetary Economics 109: 38–59. [CrossRef]       Economics    109:  38–59.
32   (CapieForrest,
     Capie,    et al. 2005)
                        TerenceCapie,   Forrest,
                                 C. Mills,         TerenceWood.
                                            and Geoffrey        C. Mills,2005.and
                                                                                GoldGeoffrey    Wood.
                                                                                       as a hedge         2005.
                                                                                                    against      Gold as
                                                                                                             the dollar.    a hedge
                                                                                                                         Journal        against the
                                                                                                                                  of International     dollar.Markets,
                                                                                                                                                    Financial   Journal of
33          International
           Institutions     Financial
                          and  Money 15:Markets,
                                           343–52.Institutions
                                                     [CrossRef]and Money 15: 343–52.
34   (CrowleyMeredith,
     Crowley,     et al. 2018)  Crowley,
                             Ning           Meredith,
                                    Meng, and    Huasheng Ning     Meng,
                                                                Song.       and
                                                                         2018.    Huasheng
                                                                                Tariff          Song.policy
                                                                                       scares: Trade   2018. Tariff   scares:
                                                                                                               uncertainty    Trade
                                                                                                                            and        policy
                                                                                                                                 foreign       uncertainty
                                                                                                                                           market   entry by and  foreign
                                                                                                                                                              Chinese
35          marketJournal
           firms.     entry of
                             byInternational
                                 Chinese firms.     Journal114:
                                              Economics       of International    Economics 114: 96–115.
                                                                   96–115. [CrossRef]
36   (DasguptaPartha,
     Dasgupta,      and Stiglitz    1977)Stiglitz.
                            and Joseph      Dasgupta,1977.Partha,
                                                            Tariffs vs. andquotas
                                                                              Joseph as Stiglitz.
                                                                                         revenue 1977.
                                                                                                   raisingTariffs
                                                                                                            devicesvs.under
                                                                                                                        quotas   as revenue
                                                                                                                             uncertainty.   Theraising
                                                                                                                                                 American devices
                                                                                                                                                            Economicunder
37          uncertainty.
           Review           The American Economic Review 67: 975–81.
                     67: 975–81.
38   (Ding Zhuanxin,
     Ding,   et al. 1993)Clive
                            Ding,W.Zhuanxin,
                                     J. Granger,Clive
                                                   and W.     J. Granger,
                                                         Robert     F. Engle. and
                                                                                1993.Robert
                                                                                       A long F.memory
                                                                                                 Engle. 1993.   A long
                                                                                                           property      memory
                                                                                                                      of stock      property
                                                                                                                               market    returnsof and
                                                                                                                                                   stocka new
                                                                                                                                                          market  returns
                                                                                                                                                               model.
39          and a new
           Journal        model. Financ
                     of Empirical  Journal1:of83–106.
                                               Empirical    Financ 1: 83–106.
                                                         [CrossRef]
40   (DyhrbergAnne
     Dyhrberg,     2016)Haubo.
                           Dyhrberg,
                                   2016.Anne    Haubo.
                                          Bitcoin, gold and2016. theBitcoin,
                                                                       dollar—A gold  and the
                                                                                   GARCH        dollar—A
                                                                                              volatility      GARCH
                                                                                                         analysis. Finance  Research
                                                                                                                         volatility    Letters 16:
                                                                                                                                     analysis.  Finance
                                                                                                                                                    85–92.Research Letters
                                                                                                                                                           [CrossRef]
41          16: 85–92.
42   (Edmond et al. 2015) Edmond, Chris, Virgiliu Midrigan, and Daniel Yi Xu. 2015. Competition, markups, and the gains from
43          international trade. American Economic Review 105: 3183–221.
44   (Edwards 1997) Edwards, Sebastian. 1997. Trade policy, growth, and income distribution. The American Economic Review 87: 205–10.
You can also read