The nucleic acid chaperone activity of the HIV-1 Gag polyprotein is boosted by its cellular partner RPL7: a kinetic study
←
→
Page content transcription
If your browser does not render page correctly, please read the page content below
9218–9234 Nucleic Acids Research, 2020, Vol. 48, No. 16                                                                          Published online 14 August 2020
doi: 10.1093/nar/gkaa659

The nucleic acid chaperone activity of the HIV-1 Gag
polyprotein is boosted by its cellular partner RPL7: a
kinetic study
Hassan Karnib1,† , Muhammad F. Nadeem1,† , Nicolas Humbert1,† , Kamal K. Sharma1 ,
Natalia Grytsyk1 , Carine Tisné 2 , Emmanuel Boutant1 , Thiebault Lequeu1 , Eleonore Réal1 ,
Christian Boudier1 , Hugues de Rocquigny3,* and Yves Mély 1,*
1
  Laboratory of Bioimaging and Pathologies (LBP), UMR 7021, Faculty of pharmacy, University of Strasbourg, 67400

                                                                                                                                                                   Downloaded from https://academic.oup.com/nar/article/48/16/9218/5892749 by guest on 29 October 2020
Illkirch, France, 2 Expression génétique microbienne, UMR 8261, CNRS, Université de Paris, Institut de biologie
physico-chimique, 13 rue Pierre et Marie Curie, 75005 Paris, France and 3 Inserm – U1259 Morphogenesis and
Antigenicity of HIV and Hepatitis Viruses (MAVIVH), 10 boulevard Tonnellé, BP 3223, 37032 Tours Cedex 1, France.

Received July 17, 2019; Revised July 20, 2020; Editorial Decision July 21, 2020; Accepted July 29, 2020

ABSTRACT                                                                                 chinery generating the full-length viral RNA (FL RNA).
                                                                                         Once exported to the cytoplasm, the FL RNA can be re-
The HIV-1 Gag protein playing a key role in HIV-1                                        cruited by active ribosomes to direct the synthesis of Gag
viral assembly has recently been shown to interact                                       and GagPol precursors. The 55 kDa Gag polyprotein pre-
through its nucleocapsid domain with the ribosomal                                       cursors (herein after named as ‘Gag’) play a critical role in
protein L7 (RPL7) that acts as a cellular co-factor pro-                                 orchestrating the formation of new virus particles, by se-
moting Gag’s nucleic acid (NA) chaperone activity. To                                    lecting the FL RNA among the bulk of cellular RNAs, and
further understand how the two proteins act together,                                    promoting its dimerization and encapsidation into the new
we examined their mechanism individually and in                                          viral particles (1–4). Both the FL RNA that will be used
concert to promote the annealing between dTAR, the                                       as genomic RNA (gRNA) in newly assembled viruses and
DNA version of the viral transactivation element and                                     the plasma membrane of the host cell can be perceived as
its complementary cTAR sequence, taken as model                                          platforms used to promote Gag multimerization along vi-
                                                                                         ral assembly. The Gag protein plays also a key role in pro-
HIV-1 sequences. Gag alone or complexed with RPL7
                                                                                         moting the annealing of the 3 terminal 18 nucleotides (nts)
was found to act as a NA chaperone that destabi-                                         of the tRNALys 3 primer to the primer binding site (PBS)
lizes cTAR stem-loop and promotes its annealing                                          of the genomic RNA (for a review, see (5,6)) during pro-
with dTAR through the stem ends via a two-step path-                                     duction of new viruses. The Gag protein consists of the ma-
way. In contrast, RPL7 alone acts as a NA annealer                                       trix (MA), capsid (CA), nucleocapsid (NC) and p6 domains
that through its NA aggregating properties promotes                                      (2,7) that all contribute to the overall activity of Gag. The
cTAR/dTAR annealing via two parallel pathways. Re-                                       MA domain targets Gag to the plasma membrane during
markably, in contrast to the isolated proteins, their                                    virus assembly and also binds RNA (8–11). The CA do-
complex promoted efficiently the annealing of cTAR                                       main facilitates Gag multimerization through CA–CA in-
with highly stable dTAR mutants. This was confirmed                                      teraction (12,13). The NC domain is required for genomic
by the RPL7-promoted boost of the physiologically                                        RNA selection, dimerization and packaging (14,15) as well
                                                                                         as primer placement (16–18). The p6 domain facilitates the
relevant Gag-chaperoned annealing of (+)PBS RNA
                                                                                         budding of viral particles through recruitment of TSG101
to the highly stable tRNALys 3 primer, favoring the no-                                  and ALIX of the ESCRT family (2,19–21).
tion that Gag recruits RPL7 to overcome major road-                                         Proteolytic maturation of Gag leads to its various com-
blocks in viral assembly.                                                                ponents in their free form including the 55 amino acids pro-
                                                                                         tein NCp7 that can associate with nucleic acids (NAs) to
INTRODUCTION                                                                             form a variety of complexes (2,22). Through these interac-
                                                                                         tions, NCp7 can structurally rearrange NAs into their most
In human immunodeficiency type 1 (HIV-1) infected cells,
                                                                                         thermodynamically stable conformation (23–26). This NA
the integrated viral DNA is transcribed by the host cell ma-

* To
   whom correspondence should be addressed. Tel: +33 3 68 85 42 63; Fax: +33 3 68 85 43 13; Email: yves.mely@unistra.fr
Correspondence may also be addressed to de Rocquigny Hugues. Tel: +33 2 47 36 61 27; Fax: +33 2 47 36 61 26; Email: hderocquigny@univ-tours.fr
†
    The authors wish it to be known that, in their opinion, the first three authors should be regarded as Joint First Authors.


C The Author(s) 2020. Published by Oxford University Press on behalf of Nucleic Acids Research.
This is an Open Access article distributed under the terms of the Creative Commons Attribution License (http://creativecommons.org/licenses/by/4.0/), which
permits unrestricted reuse, distribution, and reproduction in any medium, provided the original work is properly cited.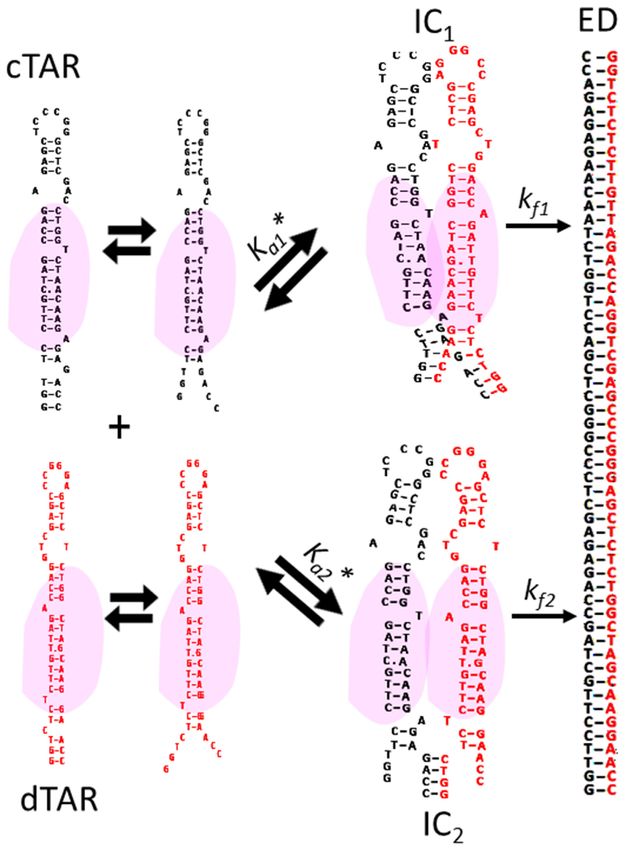
Nucleic Acids Research, 2020, Vol. 48, No. 16 9219

chaperone (NAC) activity of NCp7 and its binding speci-           MATERIALS AND METHODS
ficity mainly rely on its two highly conserved zinc fingers,
                                                                  Oligonucleotides
connected by a basic peptide. A hydrophobic plateau forms
at the top of the folded fingers, conferring to the protein the   The unlabeled and labeled cTAR and dTAR derivatives
capacity to dynamically bind and destabilize its NA targets       and the 18-oligonucleotides (+)PBS RNA were synthesized
(27–32). In addition, the numerous basic residues in the un-      by IBA GmbH Nucleic Acids product Supply (Gottingen,
folded regions of the protein account for its annealing (33)      Germany). For singly labeled oligonucleotides, the 5 ter-
and aggregating properties (34). HIV-1 NCp7 crucially con-        minus was labelled with 5(6)-carboxytetramethylrhodamine
tributes to viral DNA synthesis during reverse transcrip-         (TMR) or 5(and 6)-carboxyfluorescein (Fl). In the case of
tion by promoting its initiation as well as its two obligatory    the doubly labelled species, the 5 terminus was labeled with
strand transfers (35–39).                                         ethyl 2-[3-(ethylamino)-6-ethylimino-2,7-dimethylxanthen-
   The full-length Gag protein can associate tightly with         9-yl]benzoate hydrochloride (Rh6G) via an amino-linker
RNA and DNA via its NC domain and possibly its MA do-             with a six carbon spacer arm, while the 3 terminus was

                                                                                                                                  Downloaded from https://academic.oup.com/nar/article/48/16/9218/5892749 by guest on 29 October 2020
main (8,40–41). Its affinity for DNA was reported to be up        labelled with 4-(4 -dimethylaminophenylazo) benzoic acid
to ∼10-fold higher than that of NCp7, depending on the ex-        (Dabcyl) using a special solid support with the dye already
perimental conditions and the oligonucleotide length (42–         attached. Oligonucleotides were purified by the manufac-
45). Gag also exhibits NAC activity that is thought to be in-     turer by reverse-phase HPLC and polyacrylamide gel elec-
strumental in its interaction with FL RNA and the recruit-        trophoresis. The oligonucleotides concentration was cal-
ment of the tRNALys 3 primer during viral assembly. The           culated from the absorbance of their solutions at 260
NAC activity of Gag was inferred in vitro on a reconstituted      nm using a molar extinction coefficient of 5.56 × 10⁵
minus strand transfer reaction (43) and both in vitro and         M−1 .cm−1 , 5.775 × 10⁵ M−1 .cm−1 , 5.15 × 10⁵ M−1 .cm−1
in vivo for tRNALys 3 /PBS annealing (17,46), but its mech-       and 2.25 × 10⁵ M−1 .cm−1 for TMR-5 -cTAR, Rh6G-5 -
anism is still ill-defined. Gag’s NAC activity is mainly sup-     cTAR-3 -Dabcyl, dTAR and its derivatives and Rh6G-5 -
ported by its NC domain, since only partially processed Gag       (+)PBS RNA-3 -Dabcyl, respectively. The human recombi-
proteins and Gag mutants containing the NC domain show            nant tRNALys 3 was expressed and purified as previously de-
NAC activity (43). Nevertheless, the NAC activity of Gag          scribed (53).
is lower than that of NCp7 (17–18,42–43), suggesting that
Gag would benefit from co-factor(s) to improve its NAC
activity (47). Inositol hexakisphosphate (IP6) and inositol       Preparation of NC(1–55)
phosphate-containing lipids were identified as potential co-
                                                                  The NC(1–55) peptide that corresponds to the sequence of
factors that through their binding to the MA domain pro-
                                                                  the mature nucleocapsid protein NCp7 (Figure 1) was syn-
mote Gag’s NAC activity on the tRNALys 3 /PBS system in
                                                                  thesized and purified, as previously described (54). Its so-
vitro (10). The RNA helicase A was also reported to favor
                                                                  lution concentration was determined from the absorbance
the Gag-promoted tRNALys 3 /PBS annealing, likely by pro-
                                                                  at 280 nm, using a molar extinction coefficient of 5700
moting a viral RNA conformation susceptible to annealing
                                                                  M−1 .cm−1 . The zinc-bound form of the peptide was freshly
(47). Moreover, we recently reported that the human ribo-
                                                                  prepared by adding a 2.5-fold molar excess of zinc sulphate,
somal protein L7 (RPL7), that is part of the large ribosomal
                                                                  as described (55). All experiments were performed in 50 mM
subunit, can interact with the NC domain of Gag in cellulo
                                                                  Tris–HCl (pH 7.4), 150 mM NaCl, 1 mM MgCl2 and 1
and in vitro (48) and stimulate the Gag-promoted anneal-
                                                                  mM dithiothreitol (DTT). The rather high salt concentra-
ing of the well described system made of dTAR, the DNA
                                                                  tions mimicking the physiological salt concentrations were
version of the Trans Active Response element and its com-
                                                                  selected to limit the non-specific binding and thus, the NA
plementary cTAR strand (49–52).
                                                                  aggregating properties of both Gag and RPL7 proteins.
   In this work, we thoroughly investigated by a combi-
nation of fluorescence-based methods the mechanism by
which Gag, RPL7 and the Gag–RPL7 complex promote the
                                                                  Preparation of HIV-1 Gag and human ribosomal protein L7
annealing of cTAR with dTAR derivatives. We evidenced
                                                                  (RPL7)
that Gag but not RPL7 can destabilize the cTAR stem-loop.
Moreover, we found that both proteins either isolated or          Human RPL7 was produced as already described (56).
in complex promote the annealing reaction through mech-           TEV-cleavable HIV-1 Gag was produced as already de-
anisms involving one or two pathways. Each pathway in-            scribed (44) with a few modifications. Briefly, after loading
volves the fast formation of an intermediate complex that is      the cleared bacterial lysate onto a 5-ml His-Trap HP col-
subsequently converted into the final extended duplex (ED).       umn, the Gag-TEV-His-containing fractions were pooled
In their complex, RPL7 was observed to activate Gag’s             and desalted within PD-10 columns, then digested with
NAC properties. As a result, while Gag mainly promotes            1.2 kU of TEV protease, overnight at 4◦ C. The resulting
the annealing of moderately stable stem-loops, the complex        product was loaded on 1 ml HisTrap column to remove
can promote the annealing of much more stable sequences.          both the cleaved His-tag and the tagged enzyme. The un-
This conclusion was further illustrated by the efficient pro-     bound material was collected, concentrated and applied
motion by the Gag–RPL7 complex of the annealing of the            on a High Load 16/60 Superdex 200 size exclusion col-
stable tRNALys 3 sequence to (+)PBS RNA. Altogether, our          umn (GE Healthcare). Finally, the Gag-containing frac-
results favor the notion that Gag recruits RPL7 to boost its      tions were pooled, concentrated to 1–2 mg/ml, snap frozen
NAC activity during the late phase of HIV-1 replication.          in liquid nitrogen and stored at −80◦ C. The purity of Gag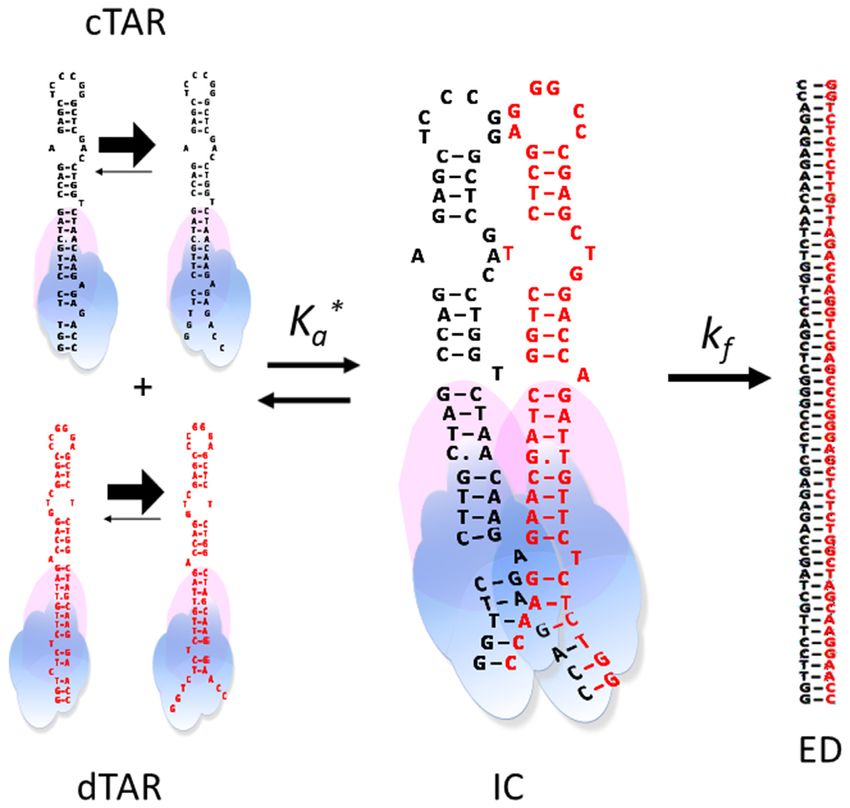
9220 Nucleic Acids Research, 2020, Vol. 48, No. 16
Downloaded from https://academic.oup.com/nar/article/48/16/9218/5892749 by guest on 29 October 2020
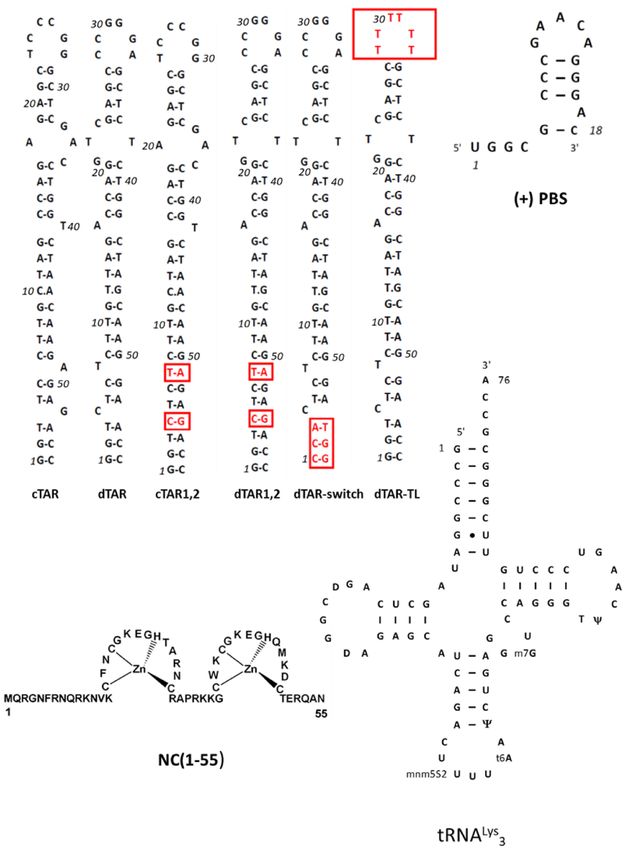
Figure 1. Sequence of the oligonucleotides and the NC(1–55) protein used in this study. The mutations of the cTAR and dTAR mutants are highlighted
in red. The base modifications of the recombinant tRNALys 3 used in this study are as in (53).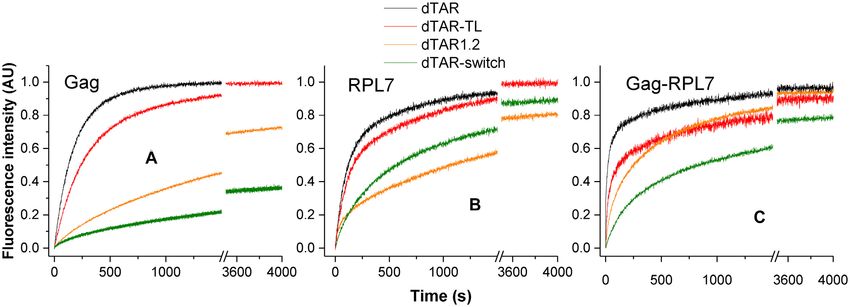
Nucleic Acids Research, 2020, Vol. 48, No. 16 9221
(Supplementary Figure S1) and RPL7 was checked by poly- formation of the protein/ Fl-5 -cTAR complex. Excitation
acrylamide gel electrophoresis. The ratios of the absorbance wavelength was 480 nm and emission wavelength was 520
at 260 nm to that at 280 nm were close to 0.6, indicating nm. The anisotropy binding curves were fitted using:
that both proteins were marginally contaminated by nucleic
S0 + Y Ra (Snt −S0 )
acids (57). Their concentration was calculated from their S= with
absorbance at 280 nm using molar extinction coefficients 1 + Y (Ran−1)
of 62 050 L.mol−1 .cm−1 and 27 390 L.mol−1 .cm−1 for Gag
1 + (Pt + nNt )K − (1 + (Pt + nNt ) K)2 − 4Pt nNt K 2
and RPL7, respectively. Y= (2)
2KNt
Fluorescence correlation spectroscopy measurements and Where S0 and St correspond to the initial and final
data analysis anisotropy values respectively, Ra the ratio of the fluores-
cence quantum yield (QY) of the free and bound species,
Fluorescence correlation spectroscopy (FCS) measure- n designates the number of binding sites, Pt and Nt corre-
Downloaded from https://academic.oup.com/nar/article/48/16/9218/5892749 by guest on 29 October 2020
ments were performed on a two-photon microscope based spond to the concentration of protein and Fl-5 -cTAR, re-
on an Olympus IX70 inverted microscope, as described pre- spectively. K is the equilibrium association constant, which
viously (58). Two-photon excitation at 850 nm is provided is then converted into a dissociation constant by: Kd = 1/K.
by an InSight DeepSee laser source (Spectra Physics, USA). Kinetic measurements were performed in pseudo first-
The experiments were performed in an 8 well lab-Tek II order conditions by reacting unlabeled wild-type or mutant
coverglass system, using a 200-l volume per well. The fo- dTAR at a concentration at least 10-fold higher than that of
cal spot was set about 20 m above the coverslip. Proteins the labeled complementary cTAR sequence. The protein to
were added to the labelled cTAR sequences at different mo- oligonucleotide molar ratio was 1:1 or 2:1 for Gag, RPL7
lar ratios. To avoid aggregation of the reagents, possibly and Gag–RPL7 and varying from 1:1 to 4:1 for NC(1–
induced by high local concentrations, the reaction media 55). The fluorescence emission of Rh6G was monitored at
were made by mixing two identical volumes of protein and 555 nm with excitation at 520 nm. All reported concentra-
oligonucleotide. Assuming that the fluorescent molecules tions correspond to those after mixing. To avoid aggrega-
diffuse freely in a Gaussian excitation volume, the nor- tion possibly resulting from high local concentrations, the
malized autocorrelation function G(τ ), calculated on-line reaction was initiated by mixing 400 l of a solution of
from the fluorescence fluctuations with a hardware correla- dTAR and protein(s) with the same volume of a solution
tor (ALV5000, ALV GmbH, Germany) was fitted according of doubly-labelled cTAR and protein(s). The fitting of the
to (59): kinetic curves was carried out with the OriginTM software
(V9.1) based on non-linear, least-square methods and the
1 τ −1 1 τ −1/2 Levenberg–Marquardt algorithm. Binding and kinetic ex-
G (τ ) = 1+ 1+ 2 (1)
N τd S τd periments were performed in 50 mM Tris–HCl (pH 7.4), 150
mM NaCl, 1 mM MgCl2 and 1 mM DTT at 20◦ C. The tem-
where, d is the diffusion time, N is the mean number of
perature dependence of the annealing kinetics was carried
diffusing species within the excitation volume and S is the
out by reacting 10 nM doubly labeled cTAR with 100 nM
ratio between the axial and lateral radii of the excitation
non-labeled dTAR derivatives at various temperatures, in
volume. The point spread function of the set-up was deter-
the presence of Gag, human RPL7 or Gag–RPL7 complex
mined from a z-scan on one fluorescent bead (20 nm in di-
added at a protein to oligonucleotide ratio of 1:1.
ameter). The measured lateral and axial resolutions were re-
spectively, 0.3 and 1 m. The data were typically recorded
during 10 min. Fifty to sixty autocorrelation curves were RESULTS
recorded for each sample. When spikes of high fluores-
cence intensity, most likely associated to aggregates, were Determining non-aggregating conditions by fluorescence cor-
observed in the fluorescence fluctuation profiles, the corre- relation spectroscopy
sponding autocorrelation curves were discarded. In all con- In order to characterize by fluorescence-based approaches
ditions, the average autocorrelation curve calculated from the NAC properties of Gag, RPL7 and Gag–RPL7 com-
the sum of the autocorrelation curves could be adequately plex, we first determined the experimental conditions un-
fitted by a single population model. der which the studied protein/DNA systems do not signifi-
cantly aggregate. To this end, we used FCS to investigate the
Fluorescence measurements effect of increasing concentrations of Gag, RPL7 or their
complex to a fixed amount of TMR- 5 -cTAR (Figure 1).
Emission spectra, fluorescence anisotropy and kinetic In this technique, fluorescence intensity fluctuations are
traces were recorded with a FluoroMax 3 or a FluoroLog measured with time in the very small volume (∼0.2 fl) pro-
spectrofluorimeter (Horiba, Jobin Yvon) equipped with a vided by a two-photon excitation. These fluctuations are
temperature-controlled cell compartment. All fluorescence
intensities were corrected for buffer emission and lamp fluc- mainly governed by the diffusion of the fluorescent species
tuations as well as for wavelength-dependent response of throughout this excitation volume. They are then converted
the optics and detectors. Binding titrations were performed into a correlation function to obtain parameters such as the
by addition of increasing concentrations of Gag, RPL7 and average number of fluorescent species within this volume
Gag–RPL7 to 10 or 30 nM Fl-5 -cTAR and monitoring the and their diffusion constant. Aggregation is thus expected
increase in the fluorescence anisotropy S resulting from the to decrease the number of fluorescent species.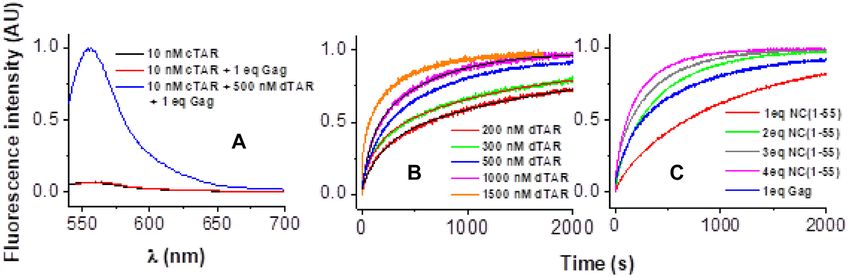
9222 Nucleic Acids Research, 2020, Vol. 48, No. 16

                                                                        was strongly quenched by Dabcyl (Figure 3A, black spec-
                                                                        trum) due to the proximity of the cTAR ends (61). During
                                                                        formation of the 55 bps ED, the distance between the probe
                                                                        and its quencher increased inducing a substantial recovery
                                                                        of Rh6G fluorescence (Figure 3A, blue spectrum).
                                                                           A set of typical progress curves for the reaction of 10 nM
                                                                        doubly labeled cTAR with increasing dTAR concentrations
                                                                        in the presence of Gag is shown in Figure 3B. Completion
                                                                        of the reaction was reached in about 30 min for [dTAR] =
                                                                        1000 nM, whereas more than 24 h was required in the ab-
                                                                        sence of protein (49). The kinetic parameters governing the
                                                                        reaction were derived by fitting the fluorescence traces to
                                                                        the following double-exponential equation which satisfac-

                                                                                                                                                Downloaded from https://academic.oup.com/nar/article/48/16/9218/5892749 by guest on 29 October 2020
                                                                        torily describes the time course of the fluorescence increase
                                                                        (Figure 3B):

Figure 2. FCS analysis of the interaction between 100 nM TMR-5 -cTAR          It = I f − I f − I0
and increasing concentrations of Gag, RPL7 or Gag–RPL7 complex.
Buffer was 50 mM Tris–HCl (pH 7.4), 150 mM NaCl, 1 mM MgCl2 and 1                    × ae(−kobs1 ×(t−t0 )) − (1 − a) e(−kobs2 ×(t−t0 ))   (3)
mM DTT at 20◦ C.
                                                                        where t0 is the dead time, kobs1,2 are the pseudo-first order
                                                                        rate constants of the reaction, a, the relative amplitude of
   Using a 100 nM TMR-5 -cTAR concentration, we found                  the fast component and It , I0 and If stand for the intensities
that in the absence of proteins, the number N of fluores-               of the actual, initial and final fluorescence intensity, respec-
cent cTAR molecules in the excitation volume was fully con-             tively.
sistent with the theoretical number of molecules calculated                Since the HIV-1 nucleocapsid protein, NC(1–55), is
from their concentration. Upon addition of increasing con-              a well-known NAC (49–50,62) that efficiently promotes
centrations of either Gag, RPL7 or Gag–RPL7, we found                   cTAR/dTAR annealing, we compared the annealing po-
only moderate changes in the number N of diffusing fluo-                tency of Gag to that of NC(1–55) (Figure 3C). Comparison
rescent species up to a protein/cTAR ratio of 1:1 (Figure               of the annealing kinetics revealed that at a protein: ODN
2, green, black and red points, respectively), as measured              molar ratio of 1: 1, Gag promotes hybridization with an effi-
from the intercept of the autocorrelation curves in Supple-             ciency similar to that of NC(1–55) at a protein: ODN molar
mentary Figure S2a, d and g. This absence of change of                  ratio of 2: 1.
N indicated that no significant aggregation occurred under                 In the presence of Gag, kobs1 and kobs2 values were linearly
these conditions. In contrast, higher ratios (1.5:1, 2:1 and            and curvilinearly dependent on [dTAR], respectively (Fig-
5:1) induced a sharp drop in N indicating the formation of              ure 4A), indicating that the annealing reaction proceeds via
aggregates (Figure 2 and Supplementary Figure S2). As a                 a two-step mechanism where the formation of the final sta-
consequence, we used a protein/DNA molar ratio of 1:1 in                ble ED is rate-limited by the slow conversion of a rapidly
the further experiments.                                                formed intermediate complex (IC) (Scheme 1):
   Having defined the aggregation conditions, we next de-
termined the binding parameters of Gag, RPL7 and Gag–
RPL7 by titrating Fl-5 -cTAR by increasing concentrations
of the proteins (Supplementary Figure S3). The titrations
could be adequately fitted by Equation (2), assuming a 1:1
stoichiometry. Dissociation constants of 4 (±1) nM, 9 (±3)              Scheme 1. Two-step annealing mechanism.
nM and 4.3 (±0.7) nM were obtained for Gag, RPL7 and
Gag–RPL7, respectively. The Kd values of Gag for cTAR                      IC formation and dissociation are governed by the sec-
were similar to those previously described for other NA tar-            ond and first order rate constants kass and kdiss , respectively.
gets of Gag (45,60).                                                    kf and kb are the first order rate constants for the IC conver-
                                                                        sion into ED and its reverse reaction, respectively. Scheme
                                                                        1 predicts that:
Promotion of the cTAR/dTAR annealing kinetics by Gag,
RPL7 and Gag–RPL7                                                                        kobs1 = kass1 [dTAR] + kdiss                    (4)
To characterize the cTAR/dTAR annealing mechanism                       and
promoted by Gag, RPL7 or their complex, we reacted un-
der pseudo-first order conditions 10 nM Rh6G-5 -cTAR-3 -                                         kf Ka∗ [dT AR]
                                                                                        kobs2 =                   + kb                   (5)
Dabcyl with, at least, a 10-fold molar excess of non-labelled                                     1 + Ka∗ [dT AR]
dTAR in the presence of protein added at a molar ratio of
1:1. Due to the high affinity of Gag, RPL7 and Gag–RPL7                 where Ka * represents the equilibrium association constant
for cTAR, more than 90% of the proteins and oligonu-                    that governs the IC stability. If kass [dTAR] + kdiss > kf , then
cleotides should be in their bound form in their mixture                IC accumulates, leading to the hyperbolic variation of kobs2
with cTAR and dTAR. At t = 0, the Rh6G fluorescence                     observed in the inset of Figure 4A. Values of (6.6 ± 0.5)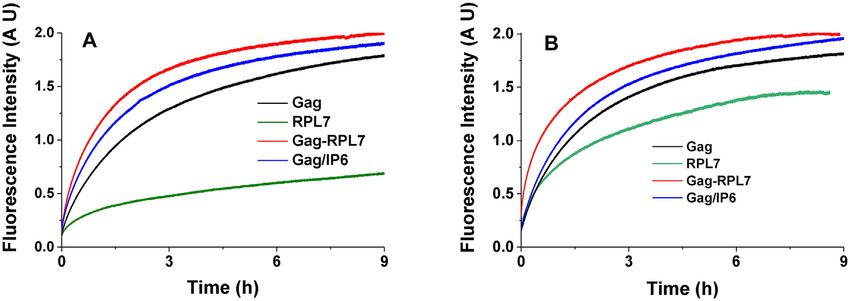
Nucleic Acids Research, 2020, Vol. 48, No. 16 9223

                                                                                                                                                                   Downloaded from https://academic.oup.com/nar/article/48/16/9218/5892749 by guest on 29 October 2020
Figure 3. Fluorescence monitoring of the Rh6G-5 -cTAR-3 -Dabcyl-dTAR annealing reaction. (A) Emission spectra with excitation at 520 nm of 10 nM
Rh6G-5 -cTAR-3 -Dabcyl (black), in the presence of Gag added at a protein/ODN molar ratio of 1 (red) and after completion of the reaction with 500
nM dTAR in the presence of Gag added at a protein/ODN molar ratio of 1 (blue). (B) Progress curves for the reaction of 10 nM doubly labeled cTAR
with 200 (red), 300 (green), 500 (blue), 1000 (magenta) and 1500 nM (orange) dTAR in the presence of Gag added at a protein/ODN molar ratio of 1.
The kinetic traces were fitted to Equation (2) to determine the kobs1 and kobs2 values. (C) Progress curves for the reaction of 10 nM doubly labeled cTAR
with 500 nM dTAR in the presence of Gag added at a protein/ODN molar ratio of 1 (blue) or NC(1–55) added at a peptide: DNA molar ratio of 1:1,
(red), 2: 1 (green), 3:1 (gray) or 4:1 (violet). Gag promotes hybridization with almost the same efficiency (kobs1 and kobs2 = 1.0 × 10⁻² and 1.6 × 10⁻³ s−1 ,
respectively) than that of NC(1–55) at a protein: ODN molar ratio of 2:1 (kobs1 and kobs2 = 1.1 × 10⁻² and 2.1 × 10⁻³ s−1 , respectively). All reported
progress curves were averaged over two to four individual traces recorded using an excitation and emission wavelength of 520 and 555 nm, respectively.
Buffer was 50 mM Tris–HCl (pH 7.4), 150 mM NaCl, 1 mM MgCl2 and 1 mM DTT at 20◦ C.

Figure 4. Dependence on dTAR concentration of the pseudo-first order rate constants, kobs1 and kobs2 , governing cTAR/dTAR annealing. The ODNs
were reacted in the presence of Gag, RPL7 and the Gag–RPL7 complex using a protein/ODN molar ratio of 1:1. The kobs1 and kobs2 values were recovered
from the fits of the kinetic traces, as described in Figure 3B, and then fitted to Equation (4) (straight red lines) or Equation (5) (red hyperboles). Each data
point represents the mean ± standard error of the mean for at least three measurements. Buffer was as in Figure 3.

× 103 M–1 s−1 and (4.1 ± 0.2) × 10−3 s–1 were determined
for the kass and kdiss rate constants, respectively (Table 1).
Moreover, a (1.2 ± 0.2) × 106 M–1 value was obtained for
Ka* , in agreement with the 1.6 × 10⁶ M–1 value calculated
from the kass /kdiss ratio. Finally, a value of (3.3 ± 0.6) ×
10−3 s–1 was obtained for the sum of the forward (kf ) and
backward (kb ) interconversion rate constants. The value of
kb , given by the intercept, was very low (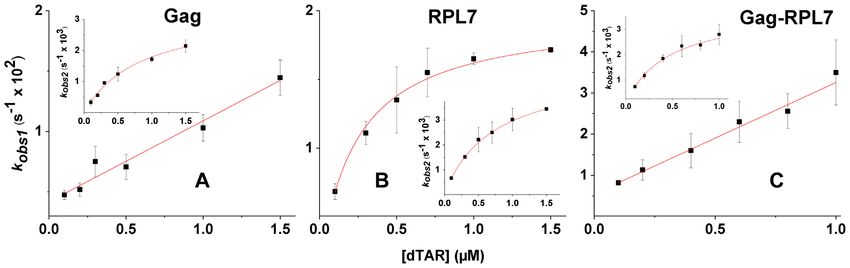
9224 Nucleic Acids Research, 2020, Vol. 48, No. 16

Table 1. Kinetic parameters for the Gag-promoted hybridization of cTAR to dTAR and its mutants

Compl Oligo              kass (M−1 s−1 × 10 -3 )          kdiss (s−1 × 10³ )     Ka * (M−1 × 10⁻⁶ )     k2 (s−1 × 10³ )       kf (s−1 × 10³ )
◦ dTAR                         6.6   ±   0.5                4.1   ±   0.2          1.2 ±    0.2                                3.3   ±   0.6
¶ dTAR                        6.40   ±   0.04               1.6   ±   0.1          4.0 ±    0.3 #                              1.4   ±   0.1
¶ dTAR-TL                      5.4   ±   0.2               1.40   ±   0.05         3.8 ±    0.3#                              0.80   ±   0.05
¶ dTAR(1,2)                    1.6   ±   0.2              0.090   ±   0.004        17.7 ±   0.6 #                             0.31   ±   0.06
¶ dTAR-switch                  4.9   ±   0.05              0.62   ±   0.02         7.9 ±    0.04#        0.52 ± 0.01          0.10   ±   0.02
◦
 Constants obtained by the analytical approach.
¶ Constants obtained with Dynafit (numerical approach).
# Calculated from k /k
                   ass diss .

in Table 2. As for Gag, a possible ED dissociation could not                   fect of the proteins added at equimolar concentration on the

                                                                                                                                                Downloaded from https://academic.oup.com/nar/article/48/16/9218/5892749 by guest on 29 October 2020
be evidenced from our data (kb < 5 × 10⁻⁵ s−1 ), suggesting                    emission spectrum of the doubly labeled cTAR or cTAR1,2,
that RPL7 is unable to dissociate ED.                                          an ∼4-fold more stable mutant lacking the terminal bulges
   As for Gag alone, we observed with the Gag–RPL7                             (64) (Figure 1). To favor the formation of the protein/ODN
complex a linear and hyperbolic variation of kobs1 and                         complexes, a 100-nM oligonucleotide concentration (10-
kobs2 , respectively, indicating that the complex also pro-                    fold higher than that used in the kinetic measurements) was
motes cTAR/dTAR annealing according to Scheme 1 (Fig-                          used. Figure 5A shows a substantial enhancement of the
ure 4C). The kinetic data are reported in Table 3. A value of                  doubly labelled cTAR emission upon addition of Gag, in
(5.3 ± 0.1) × 106 M−1 was found for Ka , in good agreement                     agreement with an increase of the inter-chromophore dis-
with the kass /kdiss ratio (5.2 × 10⁶ M−1 ).                                   tance likely due to the destabilization of the stem end. In
   To further validate both the kinetic models and rate con-                   contrast, no fluorescence increase was observed for RPL7
stants, the experimental traces were analysed with the nu-                     alone (Figure 5A), suggesting that the annealing activity of
merical solving software Dynafit (63). A typical analysis of                   RPL7 does not involve NA destabilizing properties. Similar
the Gag-assisted cTAR/dTAR kinetic traces is represented                       spectra were recorded for the cTAR/Gag and cTAR/Gag–
in Supplementary Figure S4. Examination of Tables 1–3 in-                      RPL7 mixtures (Figure 5A), indicating that Gag–RPL7
dicates that the values calculated by Dynafit from the set                     and Gag alone present the same NA destabilizing potency,
of progress curves satisfactorily agree with those obtained                    confirming the predominant role of Gag in the complex.
by the analytical approach confirming that Schemes 1 and                       In a next step, we repeated the same measurements with
2 adequately describe the reaction mechanisms. The advan-                      cTAR1,2. The spectrum of the free oligonucleotide was su-
tage of the numerical approach over the analytical one is                      perimposable to those of its mixtures with Gag, RPL7 and
that it makes no a priori on the respective values of the ki-                  Gag–RPL7 (Figure 5B), indicating that none of the proteins
netic rate constants. Moreover, this approach allows also to                   is able to melt the stable stem end of cTAR1,2.
recover the association and dissociation rate constants of
the two pathways observed with RPL7, giving a more com-                        Mutational study of the cTAR/dTAR annealing promoted by
plete picture of the reaction scheme. For these reasons, we                    Gag, RPL7 and Gag–RPL7
used the kinetic rate constants recovered from the numerical
approach to compare the effect of the proteins.                                Next, to further decipher the annealing mechanisms, we
   Comparison of the parameters governing the fastest                          investigated the impact of the sequence and stability of
pathway promoted by RPL7 (Table 2) to those of the unique                      dTAR on the Gag-, RPL7- and Gag–RPL7-promoted
pathway of Gag (Table 1) revealed that the two proteins pro-                   cTAR/dTAR annealing kinetics. To this aim, we studied,
mote the IC formation at the same velocity, but that RPL7                      as above, the reaction of the doubly labeled cTAR with a
converts the IC to the ED ∼ 13-fold faster than Gag, con-                      series of three dTAR mutants (Figure 1) in the presence of
firming that RPL7 stimulates cTAR/dTAR hybridization                           Gag, RPL7 or Gag–RPL7. The sets of progress curves were
more efficiently than Gag (48). Further comparison with                        analysed by the Dynafit software (Tables 1–3).
Gag–RPL7 (Table 3) indicates that the complex stimulates                         First, dTAR was substituted by the dTAR-TL mutant
the IC formation three to four times faster than the isolated                  where the six nucleotides of the loop were replaced by T
proteins. In contrast, the interconversion rate is only 2-fold                 residues to prevent base-pairing with the cTAR loop (Fig-
higher than that of Gag alone. As the mechanism of Gag–                        ure 1). As with the wild-type cTAR/dTAR system, we
RPL7 is similar to that of Gag and as the IC conversion rate                   found that the cTAR/dTAR-TL reaction is adequately de-
of Gag–RPL7 is close to that of Gag, this strongly suggests                    scribed by Scheme 1 in the presence of Gag and Gag–RPL7
that the mechanism of the complex is dominated by Gag.                         and by Scheme 2 in the presence of RPL7 alone. Figure 6A
                                                                               shows a slightly reduced velocity of the Gag-promoted re-
                                                                               action with dTAR-TL. From Table 1, we observe that the
Oligonucleotide destabilizing activity of Gag, RPL7 and
                                                                               loop mutation has almost no impact on the kass and kdiss val-
their complex
                                                                               ues, but reduces by ∼2-fold the kf value. This suggests that
To further characterize the mechanism by which Gag,                            the loop is marginally involved in the Gag-directed IC for-
RPL7 and Gag–RPL7 stimulate cTAR/dTAR annealing,                               mation, but contributes to its conversion into the ED. For
we determined their ability to destabilize the stems of the                    RPL7, both the progress curves (compare black curve for
bound oligonucleotides. To this aim, we examined the ef-                       cTAR/dTAR and red curve for cTAR/dTAR-TL in Figure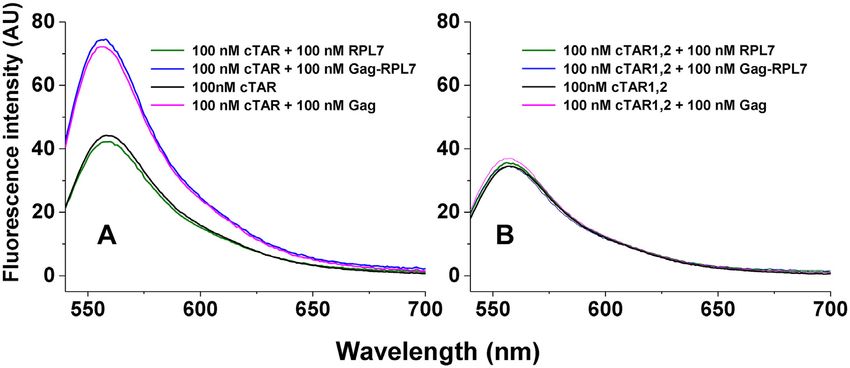
Nucleic Acids Research, 2020, Vol. 48, No. 16 9225

Table 2. Kinetic parameters for the RPL7-promoted hybridization of cTAR to dTAR and its mutants
                         kass1                  kass2                kdiss1            kdiss2             Ka * 1               Ka * 2             kf1                  kf2
Compl Oligo        (M−1 s−1 × 10 -3 )     (M−1 s−1 × 10 -3 )      (s−1 × 10³ )      (s−1 × 10³ )       (M−1 × 10⁻⁶ )        (M−1 × 10⁻⁶ )     (s−1 × 10³ )         (s−1 × 10³ )
◦
    dTAR                    nd                   nd                     nd              nd              5.2   ±   0.3        1.5 ± 0.1        19.3   ±   0.5        5.1 ± 0.2
¶ dTAR                9.9   ± 0.2            2.0 ± 0.1            2.7   ± 0.1       3.4 ± 0.5           3.7   ±   0.2#       0.6 ± 0.1#       19.3   ±   0.5        3.3 ± 0.1
¶ dTAR-TL             7.8   ± 0.2            1.0 ± 0.07           3.2   ± 0.1       2.1 ± 0.7           2.4   ±   0.1#       0.5 ± 0.2#         13   ±   2          2.9 ± 0.2
¶ dTAR(1,2)          6.20   ± 0.03                                0.8   ± 0.1                           7.6   ±   1#                          0.50   ±   0.01
¶ dTAR-switch         6.9   ± 0.9            3.0 ± 0.1             20   ± 5        0.20 ± 0.04         0.34   ±   0.1#        15 ± 3#           12   ±   1         0.85 ± 0.03
◦
 Constants obtained by the analytical approach.
nd, not determinable by this approach.
¶ Constants  obtained with Dynafit (numerical approach).
#
  Calculated from kass /kdiss .

Table 3. Kinetic parameters for the Gag–RPL7-promoted hybridization of cTAR to dTAR and its mutants

                                                                                                                                                                                   Downloaded from https://academic.oup.com/nar/article/48/16/9218/5892749 by guest on 29 October 2020
Compl Oligo                             kass (M−1 s−1 × 10 -3 )                  kdiss (s−1 × 10³ )                      Ka * (M−1 × 10⁻⁶ )                     kf (s−1 × 10³ )
◦ dTAR                                         28   ±   1                             5.3   ±   0.1                          5.3   ±   0.1                        3.8   ±   0.2
¶ dTAR                                       25.4   ±   0.2                           5.0   ±   0.4                          5.1   ±   0.4#                       3.2   ±   0.2
¶ dTAR-TL                                    17.5   ±   0.9                           4.0   ±   0.3                          4.4   ±   0.5#                      1.20   ±   0.05
¶ dTAR(1,2)                                  11.1   ±   0.1                           3.7   ±   0.2                          3.0   ±   0.2#                       2.1   ±   0.3
¶ dTAR-switch                                 4.6   ±   1                            0.57   ±   0.05                         8.0   ±   2#                         0.3   ±   0.05
◦
    Constants obtained by the analytical approach.
¶ Constants obtained with Dynafit    (numerical approach).
# Calculated from k /k
                   ass diss .

Figure 5. Destabilizing activity of Gag, RPL7 and Gag–RPL7 on cTAR (A) and cTAR1,2 (B). The destabilizing activity was evaluated by comparing the
fluorescence spectra of 100 nM doubly labelled oligonucleotide in the absence (black) and in the presence of an equimolar concentration of Gag (magenta),
RPL7 (green) or their complex (blue). Buffer was 50 mM Tris–HCl (pH 7.4), 150 mM NaCl, 1 mM MgCl2 and 1 mM DTT at 20◦ C.

6B) and the kinetic parameters (Table 2) indicate that the                                   tion of cTAR with dTAR1,2 was considerably slowed down
contribution of the loops is moderate in the two pathways                                    as compared to that with dTAR (Figure 6A and B, com-
promoted by RPL7. The mutation of the loop induces only                                      pare orange and black curves), whereas a more limited effect
a slight decrease (35%) in the stability of the IC and the kf1                               was observed for the Gag–RPL7-promoted reaction (Fig-
value in the fast pathway. For the slow pathway, the changes                                 ure 6C). Analysis of the kinetic parameters shows that in
are even less. Finally, with the Gag–RPL7 complex (Figure                                    the presence of Gag, the replacement of dTAR by dTAR1,2
6C and Table 3) as for Gag, the main effect of the loop mu-                                  does not change the reaction scheme but drastically modi-
tation is a 2.5-fold decrease in the kf value, indicating that                               fies the values of the kinetic rate constants (Table 1). This
the loop is involved in the IC conversion to ED and con-                                     replacement decreases the kass value by a factor of 4, but
firming that the mechanism of Gag–RPL7 is dominated by                                       at the same time also decreases the kdiss value by 18-fold,
Gag.                                                                                         inducing a 4-fold increase in the IC stability. Thus, the in-
   The contribution of the stems was examined by replac-                                     creased stability of dTAR1,2 slows down the Gag-promoted
ing dTAR by the dTAR1.2 mutant, which is 6-fold more                                         formation of the IC and stabilizes the IC. This strongly sug-
stable (ΔG = −12.6 kcal.mol−1 ) than dTAR (ΔG = −2.1                                         gests that similarly to NC (49,50), the Gag-promoted IC is
kcal.mol−1 ) as calculated with mFold, due to the introduc-                                  nucleated through the stem ends. The increased stability of
tion of two bases (at positions 51 and 54) conferring a per-                                 dTAR1,2 also slows down the IC conversion into ED, as
fect double stranded structure to the bottom part of dTAR                                    shown by the 5-fold decrease in the kf value. In the case of
stem (Figure 1). In the presence of Gag or RPL7, the reac-                                   RPL7, the reaction scheme with two parallel pathways was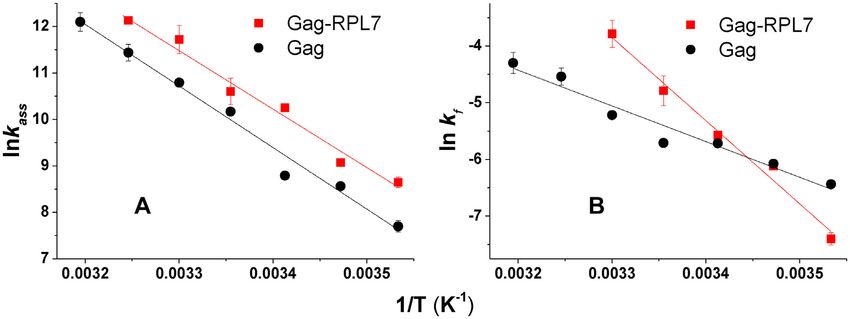
9226 Nucleic Acids Research, 2020, Vol. 48, No. 16

                                                                                                                                                         Downloaded from https://academic.oup.com/nar/article/48/16/9218/5892749 by guest on 29 October 2020
Figure 6. Effect of dTAR sequence and stability on the kinetics of its annealing with cTAR promoted by Gag (A), RPL7 (B) and Gag–RPL7 (C). Kinetic
traces for the reaction of 10 nM doubly labeled cTAR with 300 nM non-labeled dTAR (black curves), dTAR-TL (red curves), dTAR-switch (green curves)
or dTAR1.2 (orange curves) in the presence of Gag, RPL7 or Gag–RPL7. Experimental conditions were as in Figure 3. Excitation and emission wavelengths
were at 520 and 555 nm, respectively, to monitor the Rh6G emission. The traces were fitted to Equation (2), except for the trace of the Gag-promoted
cTAR/dTAR-switch reaction that was fitted to a triple-exponential function. The values of the kinetic parameters governing the different reactions are
listed in Tables 1–3. A protein/ODN molar ratio of 1:1 was used in all cases.

converted into a simple two-step mechanism when dTAR
was replaced by dTAR1,2. This suggests that one of the two
pathways became negligible as a result of the increased sta-
bility of dTAR1,2. Comparison of the kinetic parameters of
this two-step pathway with those of the fast pathway with
dTAR reveals that the cTAR/dTAR1,2 IC is stabilized by                       Scheme 3. Three-step annealing mechanism.
2-fold as a result of a 3-fold decrease in the kdiss value associ-
ated to a 1.6-fold decrease in the kass value (Table 2). More-
over, the high stability of dTAR1,2 has a major impact on                       This three-step mechanism involves the fast accumula-
the RPL7-promoted IC conversion, as can be seen from the                     tion of a pre-equilibrium intermediate complex IC, slowly
nearly 40-fold decrease of the kf value (Table 2). Thus, sim-                rearranging into a transient species IC*, which then con-
ilarly to Gag, the RPL7-promoted annealing of cTAR with                      verts into ED. The kinetic traces (Supplementary Figure
dTAR is probably nucleated through the stems and strongly                    S5) were well fitted using Scheme 3 and the kinetic param-
depends on their stability. In the presence of the Gag–RPL7                  eters in Table 1. Interestingly, the replacement of dTAR by
complex, the replacement of dTAR by dTAR1,2 decreases                        dTAR-switch does only marginally impact the formation of
by 2.5-fold the kass value, suggesting that as for the two pro-              the IC, but dramatically slows down its conversion into ED,
teins alone the annealing is initiated through the stem ends.                through two rate-limiting steps (k2 = 0.52 × 10⁻³ s−1 and
This decrease in the kass value was accompanied by a slight                  kf = 0.1 × 10⁻³ s−1 ) (Table 1).
decrease (1.35-fold) of the kdiss value, resulting in only a                    With RPL7, the replacement of dTAR by dTAR-switch
moderate change in the IC stability (Table 3). Comparison                    was found to preserve the mechanism with two parallel
of the RPL7/Gag complex with Gag in their ability to pro-                    pathways. For the fast pathway, we observed a limited 30%
mote the cTAR/dTAR1,2 reaction revealed that the com-                        decrease of the kass1 value accompanied by a strong destabi-
plex increased the kass and kf values by 7-fold and the kdiss                lization of the IC (by one order of magnitude) due to a dras-
value by 40-fold. Thus, the two proteins clearly exert a syn-                tic increase in the kdiss1 value. Moreover, the rate constant of
ergistic role by promoting the formation and dissociation of                 the IC conversion into ED was decreased by about 40% as
the IC as well as the IC conversion to ED, suggesting a key                  compared to that observed with dTAR. In contrast, for the
role of RPL7 to help Gag in annealing stable NA sequences                    slow pathway, we observed a stabilization by one order of
during viral replication.                                                    magnitude of the IC accompanied by a four-fold decrease
   The involvement of the stems in the annealing reaction                    in its conversion rate into the ED (Table 2).
was further investigated by replacing dTAR by dTAR-                             With the Gag–RPL7 complex, the kinetic rate constants
switch, a mutant where the three terminal base pairs are                     and stability of the cTAR/dTAR-switch IC are fully match-
inverted. This replacement induced a substantial decrease                    ing with those obtained with Gag, indicating that IC forma-
of the speed of the Gag-promoted annealing reaction (Fig-                    tion is governed by Gag. In contrast, the presence of RPL7
ure 6A, green curve). Surprisingly, the progress curves were                 in the protein complex allows a one-step conversion of the
best described by a triple-exponential function, which sug-                  IC into the ED, albeit with a rather slow rate constant (kf
gests that the cTAR/dTAR-switch annealing reaction likely                    = 0.3 × 10⁻³ s−1 ). Thus, RPL7 cooperates with Gag to fa-
requires an additional step, as illustrated by Scheme 3:                     cilitate the conversion step in this case. Further compari-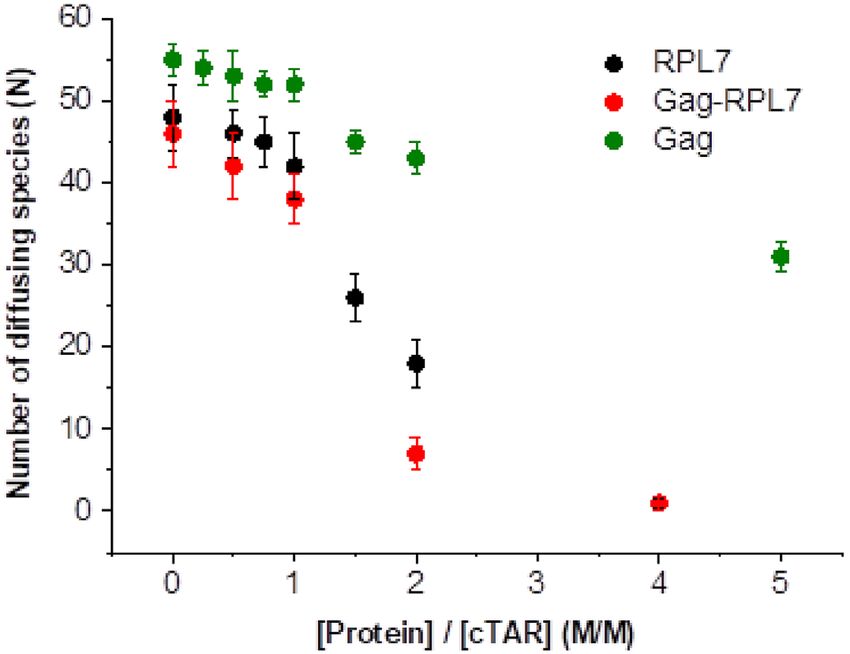
Nucleic Acids Research, 2020, Vol. 48, No. 16 9227

                                                                                                                                                                  Downloaded from https://academic.oup.com/nar/article/48/16/9218/5892749 by guest on 29 October 2020
Figure 7. Arrhenius plots for the cTAR/dTAR annealing kinetics in the presence of Gag (black), and Gag–RPL7 (red) at a protein/ODN molar ratio of
1:1. Temperature dependence of kass (A) and kf (B) for the reaction of 10 nM doubly labeled cTAR with 100 nM dTAR. The solid lines were generated
with Equation (6) and the best estimates of the activation energies Ea1 and Ea2 , respectively given in Table 4. It was checked that no aggregation occurred
on changing the temperature.

son with dTAR data revealed that the significantly slower                        Table 4. Energy of activation (Ea1,2 ) and transition state enthalpy (ΔH1,2 )
annealing process observed with dTAR-switch (Figure 6C)                          for the cTAR/dTAR annealing reactions promoted by Gag and the Gag–
is related to an ∼6- and ∼10-fold decrease in the rate of                        RPL7 complex
IC formation and conversion, respectively (Table 3). As for                      Protein              Ea1,2 * (kcal.mol−1 )              ΔH1,2 ** (kcal.mol−1 )
cTAR1,2, this confirms the key contribution of the stem
                                                                                 Gag                       26.5   ±   2                          26
ends for the Gag–RPL7-assisted reaction.                                                                   12.3   ±   1                          11.7
                                                                                 Gag–RPL7                    25   ±   2                          24.4
                                                                                                             28   ±   2                          27.4
Arrhenius analysis of the cTAR/dTAR annealing reaction
                                                                                 * Determined from the data of Figure 7.
To further investigate the two-step mechanism of Gag- and                        ** Calculated from ΔH = Ea-RT with T         = 293 K.
Gag–RPL7-promoted cTAR/dTAR annealing reaction, we
examined the temperature dependence of the kinetic rate
constants through an Arrhenius plot (Figure 7). The same                         for Gag alone and the Gag–RPL7 complex, a melting of ∼
approach could not be applied to the two parallel two-step                       5–6 bps is required for IC formation while ∼ 3 and 5–6 bps,
pathways of the RPL7-promoted reaction, due to the too                           respectively need to be melted for the IC conversion into
large number of rate constants in this case. According to                        ED.
the Arrhenius model, the thermodynamic parameters for
the transition state can be derived from the reaction rates
using:                                                                           RPL7 boosts the Gag-promoted tRNALys 3 /(+)PBS anneal-
                                                                                 ing
               ln k1,2 = −Ea1,2 /R × 1/T + ln A                        (6)
                                                                                 As RPL7 was shown above to help Gag in promoting the
where the rate constant k1,2 corresponds to kass (given by                       annealing of stable sequences, we next investigated the pos-
kobs1 /[cTAR]) and kf , respectively, A is a pre-exponential                     sible role of RPL7 in the Gag-promoted annealing of the
factor, Ea1,2 is the activation energy, R is the universal gas                   physiologically relevant tRNALys 3 /(+)PBS system. The an-
constant and T is the absolute temperature in Kelvin.                            nealing of the stable tRNALys 3 to (+)PBS RNA in the ab-
   The values of the activation energies Ea1,2 and the cor-                      sence of protein has been previously shown to be extremely
responding transition state enthalpies H1,2 are listed in                       slow both at room temperature and 37◦ C (47,68–69).
Table 4. For the two systems, the kass and kf values in-                            We first performed the annealing reaction in the same
creased with the temperature. Above 30◦ C, the kinetic traces                    conditions as with the cTAR/dTAR system, by adding Gag,
recorded with Gag–RPL7 became mono-exponential. The                              RPL7 and Gag–RPL7 at a 1/1 molar ratio to the oligonu-
slopes of the straight lines drawn through the data of Fig-                      cleotides (Figure 8A). While RPL7 alone was highly ineffi-
ure 7A (kass ) for Gag alone and its complex with RPL7 are                       cient in promoting the annealing reaction, the Gag–RPL7
close (26 kcal.mol−1 .K−1 ), indicating that the first step of                   complex was found to increase the observed kinetic rate
the annealing reactions is characterized by similar energy                       constants by a factor of 3 as compared to Gag alone (Ta-
barriers with the two protein systems, confirming the domi-                      ble 5). Since tRNALys 3 (76 nts) is significantly longer than
nant role of Gag in the first step of the Gag–RPL7-directed                      the TAR species (55 nts), we then determined whether the
annealing process. Analysis of the temperature dependence                        annealing reaction would be faster at a higher protein to
of kf (Figure 7B) indicates that the second step of the Gag–                     oligonucleotide molar ratios (Figure 8B and Table 3). In-
RPL7-stimulated reaction is characterized by a higher en-                        terestingly, the kinetic constants with Gag did not change
ergy barrier (28 kcal.mol−1 .K−1 ) than that of the reaction                     significantly when the Gag/ODN molar ratio was raised
promoted by Gag alone (12.3 kcal.mol−1 .K−1 ). From the                          from 1:1 to 2:1. In contrast, the same change in the mo-
calculated H1,2 values (Table 4), we deduced (65–67) that                       lar ratio induced an about two-fold increase in the observed
9228 Nucleic Acids Research, 2020, Vol. 48, No. 16
Downloaded from https://academic.oup.com/nar/article/48/16/9218/5892749 by guest on 29 October 2020
Figure 8. Progress curves for the reaction of 10 nM Rh6G-5 -(+)PBS RNA-3 -Dabcyl with 700 nM tRNALys 3 in the presence of Gag (black and blue),
RPL7 (green) and Gag–RPL7 (red) added at a protein/ODN ratio of 1:1 (A) and 2:1 (B). The kinetics with Gag were done either in the absence (black) or
in the presence of 20 M IP6 (blue). Buffer: 50 mM Tris–HCl (pH 7.4), 150 mM NaCl, 1 mM MgCl2 and 1mM DTT at 20◦ C. The fluorescence emission
of Rh6G was followed at 555 nm with excitation at 520 nm.
Table 5. Kinetic parameters for the hybridization of (+)PBS RNA to complementary DNA sequences, often used to investigate
tRNALys 3 promoted by Gag, RPL7, Gag–RPL7 and Gag/IP6 the chaperone properties of viral proteins (49–52,71). In the
Protein/ODN high salt and low protein/oligonucleotide ratio conditions
Proteins ratio kobs1 (s−1 × 10⁴ ) kobs2 (s−1 × 10⁵ ) used in our assay, both proteins were found to bind to cTAR
with nanomolar affinity to mainly one binding site.
Gag 1 1.5 ± 0.1 2.2 ± 0.4
2 1.6 ± 0.1 1.4 ± 0.4 The Gag-promoted reaction was found to be nucleated
RPL7 1 2.1 ± 0.9 0.7 ± 0.2 from the stem ends as a consequence of its NA destabiliza-
2 3.3 ± 0.2 1.9 ± 0.6 tion properties (Figure 5). In line with the reported prefer-
Gag–RPL7 1 4 ± 1 7.5 ± 1 ential binding of mature NC on cTAR (72) and TAR (73) to
2 9 ± 1 11 ± 1
Gag/IP6* 1 2.7 ± 0.5 4.1 ± 0.7
G residues close to mismatches in the lower part of the stem,
2 2.4 ± 0.3 3.5 ± 0.2 our data suggest that Gag preferentially binds to the same
binding site through its NC domain. The reaction then pro-
* IP6 was added at 20 M. ceeds via a two-step kinetic pathway which includes the for-
mation of a fast pre-equilibrium intermediate and its rate-
limited conversion into the final ED. As for Tat (52) and
rate constants for both RPL7 and Gag–RPL7. As a result, NCp7 (49,50), the Gag-promoted annealing pathway dif-
at a 2:1 molar ratio a 6- to 8-fold increase in the kobs1 and fers from the one in the absence of protein which proceeds
kobs2 values was observed with the Gag–RPL7 complex as through a kissing complex intermediate (50,74), indicating
compared to Gag (Table 5), clearly confirming that RPL7 that Gag modifies the annealing mechanism. The Arrhenius
can boost the Gag-promoted tRNALys 3 /(+)PBS annealing plot suggests a melting of about 5–6 bps for the fast kinetic
reaction. Finally, we compared RPL7 with IP6 that was component, suggesting that the reactive species likely corre-
previously shown to activate the Gag-promoted tRNALys 3 sponds to cTAR species where the terminal double stranded
/(+)PBS RNA annealing reaction (10). In our conditions, segment is melted. This melting has been shown to occur
IP6 was observed to promote the Gag chaperone activity spontaneously at room temperature (29,58,64), but may be
but somewhat less efficiently than RPL7. Moreover, in con- further promoted by Gag (Figure 5). This destabilizing ac-
trast to RPL7, IP6 does not induce a further increase in the tivity of Gag is likely related to its NC domain, since the
annealing speed at 2:1 Gag/ODN molar ratio compared to mature NCp7 induces a similar limited melting when added
1:1 molar ratio (Table 5), suggesting that RPL7 and IP6 may at low (2:1) ratio to cTAR (28). A more extended melting
have different mechanisms. of the cTAR stem was observed when NCp7 was added at
saturating concentrations (10:1 molar ratio) (28,64). Such
a high molar ratio could unfortunately not be tested with
DISCUSSION
Gag, as it starts precipitating cTAR molecules at molar ra-
In HIV-1 infected cells, RNA dimerization and virus assem- tios above 1:1 (Figure 2). The IC formation likely relies
bly are orchestrated by the structural polyprotein precur- also on the Gag-induced attraction between the Gag/cTAR
sor Gag. During these steps, Gag is thought to rearrange and Gag/dTAR complexes, which facilitates the diffusional
NAs into their most thermodynamically stable conforma- search for the complementary sequences. Further conver-
tion due to its NAC activity (7,14,24,43,70). However, since sion of the IC into the ED requires the melting of three
Gag exhibits limited NAC activity, it is believed that interac- additional base pairs, as suggested by the activation energy
tion with cellular partners, such as IP6 and RPL7 can com- associated to the conversion rate constant (Table 4). Inter-
pensate for this weakness (10). Here, we investigated and estingly, Gag added to cTAR and dTAR at a 1:1 molar ratio
compared the mechanisms by which Gag, RPL7 and Gag– was found to exhibit the same annealing activity than NCp7
RPL7 anneal the canonical stem-loop cTAR and dTAR added at a 2:1 molar ratio, using a similar reaction pathwayNucleic Acids Research, 2020, Vol. 48, No. 16 9229
Downloaded from https://academic.oup.com/nar/article/48/16/9218/5892749 by guest on 29 October 2020
Figure 9. Proposed reaction scheme for the Gag- and Gag–RPL7-promoted cTAR/dTAR annealing at a 1:1 protein:oligonucleotide molar ratio. In the
presence of Gag alone (represented by a blue cloud) or its complex with RPL7 (represented by a pink cloud), the reaction proceeds through a two-step
pathway, with the formation of an intermediate complex IC which is further converted into the ED. Due to the destabilizing properties of Gag and
Gag–RPL7, the equilibrium due to thermal fraying between the closed and partially opened oligonucleotides is displaced to the right, leading to the fast
formation of the IC. Its slow conversion into the final ED requires an additional melting of 3–6 bps.
mainly initiated through the stem ends and leading to an kass value) the strand exchange that nucleates the IC (75).
IC of similar stability (50). This suggests that the NC do- Then, further melting of 3 bps triggers the cTAR/dTAR
main of Gag is not the only one that contributes to Gag’s IC conversion into the ED. This step is likely facilitated
NAC activity at this molar ratio and that the MA sequence, by the cTAR bulge at position 49 and the corresponding
which was reported to bind to NAs through its basic do- bulge at position 7 in dTAR, because the replacement of
main, may also contribute to the Gag-induced attraction dTAR by dTAR1,2 where this bulge is absent leads to a
between Gag–cTAR and Gag–dTAR complexes. In con- strongly decreased conversion rate. In addition, the absence
trast, when Gag and NCp7 were used at higher molar ra- of this bulge probably hinders the base fluctuations needed
tios, the mature NCp7 protein was found to be a much more for the dissociation of the IC, explaining the high stabil-
efficient chaperone than Gag (10), indicating that the MA ity of the cTAR/dTAR1,2 IC. Since the conversion step
domain limits Gag’s chaperone activity at these ratios. This was slowed down with the dTAR-TL mutant, this step is
suggests that the role of Gag domains during viral assem- likely also facilitated by the loops, which may help to prop-
bly is finely regulated by the concentration of Gag linked to erly position the reacting species, presumably by loop-loop
its NA targets and by co-factors such as IP6 which interact contacts. For the Gag-promoted annealing of cTAR with
directly with these domains. dTAR-switch, the strong similarity of the kass value with
Based on our data, a mechanism for the Gag-promoted that of cTAR/dTAR suggests that IC nucleation is similar
cTAR/dTAR annealing can be suggested (Figure 9). Nu- in both systems, involving the nucleotides of the last double-
cleation of the IC likely requires the melting of the lower strand segment of the stem. However, as this segment is in-
double-stranded segment of cTAR and dTAR induced both verted in dTAR-switch as compared to dTAR, the upper
by temperature and the destabilization activity of Gag. The parts of the stem are not properly positioned in the IC to
simultaneous destabilization of both cTAR and dTAR se- nucleate the ED, explaining the decreased kf value observed
quences may not be compulsory, since dTAR1,2 which is with dTAR-switch as compared to dTAR. The additional
not destabilized by Gag (Figure 5) can also react with rate-limiting step for the conversion of the cTAR/dTAR-
cTAR. The destabilization of cTAR and its close proxim- switch IC into ED likely corresponds to IC rearrange-
ity with dTAR1,2 permitted by the NA aggregating prop- ments required to dissociate the base pairs between the stem
erties of Gag are likely sufficient in this case to promote ends and initiate base pairing in the upper parts of the
but with a low efficiency (as shown by the decrease in the reactants.9230 Nucleic Acids Research, 2020, Vol. 48, No. 16
Downloaded from https://academic.oup.com/nar/article/48/16/9218/5892749 by guest on 29 October 2020
Figure 10. Proposed reaction scheme for the RPL7-promoted cTAR/dTAR annealing. In the presence of RPL7 (represented by a pink cloud) added at
a 1:1 molar ratio, the annealing reaction is thought to proceed via two parallel two-step pathways. The fast pathway likely relies on a ‘zipper’ mechanism
similar to that observed for Gag alone and Gag–RPL7 (Figure 9). The slow pathway likely relies on an ‘invasion’ mechanism where a RPL7-bound cTAR
or dTAR species melted by temperature may invade a closed RPL7-bound complementary sequence. This invasion leads to the IC2 stabilized by only 4
base pairs, which converts more slowly than IC1 into the ED (Table 2).
For the RPL7-mediated cTAR/dTAR annealing, the an- larities with the Gag-promoted annealing reaction, the fast
nealing process was found to involve two parallel kinetic pathway likely corresponds to a ‘zipper’ pathway, in which
pathways which are nucleated from the ODN stem ends spatially close RPL7-bound cTAR and dTAR species are
(Figure 10) and lead to the final ED via a two-step mecha- simultaneously melted at their stem ends, so that they can
nism. For the fast pathway, the kinetic and equilibrium con- anneal their both strands. Since RPL7 does not exhibit any
stants for IC formation are very close to those of the Gag- destabilization activity (Figure 5A), the melting of the stem
promoted cTAR/dTAR annealing, suggesting the forma- ends results from their thermal fraying (58,64). Since the IC
tion of the same IC with the two proteins. The main differ- is substantially less stable in the slow pathway, we hypoth-
ence between the two proteins is their efficiency in convert- esized that in this pathway, one strand of the melted stem
ing the IC into the ED. As shown by the four-fold higher of a RPL7-bound ODN may invade the closed stem of a
kf value observed with RPL7 as compared to Gag, the for- spatially close RPL7-bound complementary species. There-
mer appears as a more efficient promoter of IC conversion, fore, only ∼4 bps can form (Figure 10) instead of 7 bps for
suggesting that the RPL7 binding site encompasses residues the IC in the fast ‘zipper’ pathway. This lower number of
of the middle of cTAR and dTAR stems involved in the base pairs is also consistent with the 6-fold slower conver-
conversion of the IC into the ED. Therefore, from the simi- sion of the IC into the ED as compared to the ‘zipper’ mech-You can also read