CHARACTERIZING SARS-COV-2 MUTATIONS IN THE UNITED STATES
←
→
Page content transcription
If your browser does not render page correctly, please read the page content below
Characterizing SARS-CoV-2 mutations in the United States

                                                Rui Wang1 , Jiahui Chen1 , Kaifu Gao1 , Yuta Hozumi 1 , Changchuan Yin2 , and Guo-Wei Wei1,3,4 *
                                                                                 1
                                                                                   Department of Mathematics,
                                                                           Michigan State University, MI 48824, USA.
                                                               2
                                                                 Department of Mathematics, Statistics, and Computer Science,
arXiv:2007.12692v1 [q-bio.GN] 24 Jul 2020

                                                                   University of Illinois at Chicago, Chicago, IL 60607, USA
                                                                    3
                                                                       Department of Electrical and Computer Engineering,
                                                                           Michigan State University, MI 48824, USA.
                                                                     4
                                                                       Department of Biochemistry and Molecular Biology,
                                                                           Michigan State University, MI 48824, USA.

                                                                                                  July 28, 2020

                                                                                                     Abstract
                                                        The severe acute respiratory syndrome coronavirus 2 (SARS-CoV-2) has been mutating since it was
                                                    first sequenced in early January 2020. The genetic variants have developed into a few distinct clusters
                                                    with different properties. Since the United States (US) has the highest number of viral infected patients
                                                    globally, it is essential to understand the US SARS-CoV-2. Using genotyping, sequence-alignment, time-
                                                    evolution, k-means clustering, protein-folding stability, algebraic topology, and network theory, we reveal
                                                    that the US SARS-CoV-2 has four substrains and five top US SARS-CoV-2 mutations were first detected
                                                    in China (2 cases), Singapore (2 cases), and the United Kingdom (1 case). The next three top US SARS-
                                                    CoV-2 mutations were first detected in the US. These eight top mutations belong to two disconnected
                                                    groups. The first group consisting of 5 concurrent mutations is prevailing, while the other group with
                                                    three concurrent mutations gradually fades out. Our analysis suggests that female immune systems are
                                                    more active than those of males in responding to SARS-CoV-2 infections. We identify that one of the top
                                                    mutations, 27964C>T-(S24L) on ORF8, has an unusually strong gender dependence. Based on the analysis
                                                    of all mutations on the spike protein, we further uncover that three of four US SASR-CoV-2 substrains
                                                    become more infectious. Our study calls for effective viral control and containing strategies in the US.

                                            Key words: COVID-19, SARS-CoV-2, spike protein, ORF8a, genotyping, persistent homology, network
                                            theory, machine learning

                                            Contents
                                            1    Introduction                                                                                                     1

                                            2    Results and Discussion                                                                                           2
                                                 2.1 Genotyping analysis . . . . . . . . . . . . . . . . . . . . . . . . . . . . . . . . . . . . . . . . . .      2
                                                     2.1.1 Cluster analysis . . . . . . . . . . . . . . . . . . . . . . . . . . . . . . . . . . . . . . . . .     2
                                                 * Corresponding   author. E-mail: weig@msu.edu

                                                                                                         i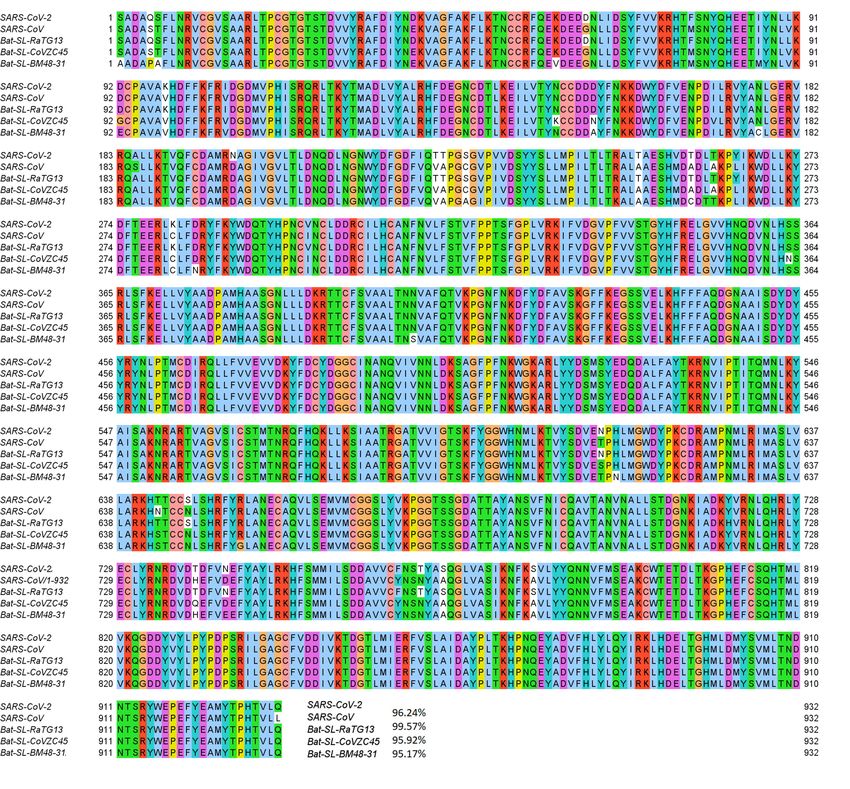
2.1.2 Top mutations in the United States         .    .   .   .   .   .   .   .   .   .   .   .   .   .   .   .   .   .   .   .   .   .   .   .   .   .   .   .   .   .    3
          2.1.3 Co-mutation analysis . . . . . . . .       .    .   .   .   .   .   .   .   .   .   .   .   .   .   .   .   .   .   .   .   .   .   .   .   .   .   .   .   .   .    4
          2.1.4 Evolutionary analysis . . . . . . .        .    .   .   .   .   .   .   .   .   .   .   .   .   .   .   .   .   .   .   .   .   .   .   .   .   .   .   .   .   .    5
          2.1.5 Gender analysis . . . . . . . . . . .      .    .   .   .   .   .   .   .   .   .   .   .   .   .   .   .   .   .   .   .   .   .   .   .   .   .   .   .   .   .    6
    2.2   Protein-specific analysis . . . . . . . . . .    .    .   .   .   .   .   .   .   .   .   .   .   .   .   .   .   .   .   .   .   .   .   .   .   .   .   .   .   .   .    6
          2.2.1 Mutation on the NSP12 protein . .          .    .   .   .   .   .   .   .   .   .   .   .   .   .   .   .   .   .   .   .   .   .   .   .   .   .   .   .   .   .    6
          2.2.2 Mutation on the Spike protein . .          .    .   .   .   .   .   .   .   .   .   .   .   .   .   .   .   .   .   .   .   .   .   .   .   .   .   .   .   .   .    7
          2.2.3 Mutation on the ORF3a protein . .          .    .   .   .   .   .   .   .   .   .   .   .   .   .   .   .   .   .   .   .   .   .   .   .   .   .   .   .   .   .    9
          2.2.4 Mutation on the NSP2 protein . .           .    .   .   .   .   .   .   .   .   .   .   .   .   .   .   .   .   .   .   .   .   .   .   .   .   .   .   .   .   .   12
          2.2.5 Mutations on the NSP13 protein .           .    .   .   .   .   .   .   .   .   .   .   .   .   .   .   .   .   .   .   .   .   .   .   .   .   .   .   .   .   .   13
          2.2.6 Mutations on the ORF8 protein . .          .    .   .   .   .   .   .   .   .   .   .   .   .   .   .   .   .   .   .   .   .   .   .   .   .   .   .   .   .   .   15
    2.3   Infectivity analysis . . . . . . . . . . . . .   .    .   .   .   .   .   .   .   .   .   .   .   .   .   .   .   .   .   .   .   .   .   .   .   .   .   .   .   .   .   17
          2.3.1 Cluster A infectivity . . . . . . . .      .    .   .   .   .   .   .   .   .   .   .   .   .   .   .   .   .   .   .   .   .   .   .   .   .   .   .   .   .   .   19
          2.3.2 Cluster B infectivity . . . . . . . .      .    .   .   .   .   .   .   .   .   .   .   .   .   .   .   .   .   .   .   .   .   .   .   .   .   .   .   .   .   .   19
          2.3.3 Cluster C infectivity . . . . . . . .      .    .   .   .   .   .   .   .   .   .   .   .   .   .   .   .   .   .   .   .   .   .   .   .   .   .   .   .   .   .   20
          2.3.4 Cluster D infectivity . . . . . . . .      .    .   .   .   .   .   .   .   .   .   .   .   .   .   .   .   .   .   .   .   .   .   .   .   .   .   .   .   .   .   21

3   Methods                                                                                                                                                                         21
    3.1 Data collection and pre-processing . . . . . . . . . . . . . . . . . . . . . . . . . . . . . . . . . .                                                                      21
    3.2 Single nucleotide polymorphism genotyping . . . . . . . . . . . . . . . . . . . . . . . . . . . .                                                                           22
    3.3 Distance of SNP variants . . . . . . . . . . . . . . . . . . . . . . . . . . . . . . . . . . . . . . . .                                                                    22
    3.4 K-means clustering . . . . . . . . . . . . . . . . . . . . . . . . . . . . . . . . . . . . . . . . . . .                                                                    23
    3.5 Topology-based machine learning prediction of protein-protein binding affinity changes fol-
        lowing mutations . . . . . . . . . . . . . . . . . . . . . . . . . . . . . . . . . . . . . . . . . . . .                                                                    24
    3.6 Topology-based machine learning prediction of protein folding stability changes following
        mutation . . . . . . . . . . . . . . . . . . . . . . . . . . . . . . . . . . . . . . . . . . . . . . . . .                                                                  24
    3.7 Graph network models . . . . . . . . . . . . . . . . . . . . . . . . . . . . . . . . . . . . . . . . .                                                                      24

4   Conclusion                                                                                                                                                                      25

                                                               ii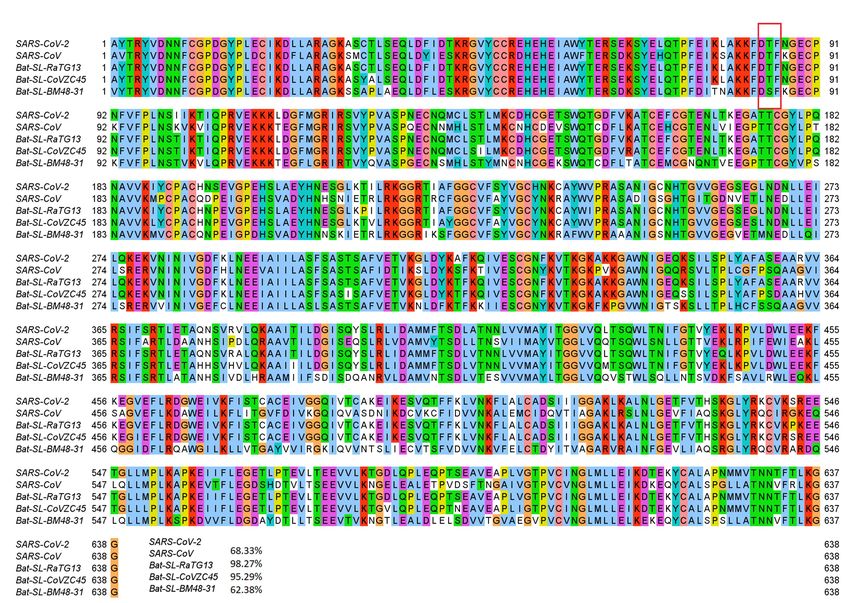
1    Introduction

The severe acute respiratory syndrome coronavirus 2 (SARS-CoV-2), a strain of β-coronavirus that causes
the respiratory illness, is responsible for the ongoing global pandemic of coronavirus disease 2019 (COVID-
19). At this stage, more than 200 countries, regions, and territories have reported positive COVID-19 infec-
tions. Among them, the United States (US) has over 4 million confirmed cases and 145 thousand deceased
cases as of July 22, 2020 [1]. The rapid spread of COVID-19 gives rise to a question of whether SARS-CoV-
2 has become more transmissible or infectious in the US. Benefiting from the vast collection of complete
genome sequencing data of SARS-CoV-2 deposited in GISAID, studies on the mutation dynamics provide
us a way to investigate the characteristics of US SARS-CoV-2 strains and understand their ramifications in
the US population health and economy.
    SARS-CoV-2 belongs to the Coronaviridae family and the Nidovirales order, which has been shown
to have a genetic proofreading mechanism in its replication achieved by an enzyme called non-structure
protein 14 (NSP14) in synergy with NSP12, i.e., RNA-dependent RNA polymerase (RdRp) [2, 3]. There-
fore, SARS-CoV-2 has a higher fidelity in its transcription and replication process than that of other single-
stranded RNA viruses, such as flu virus and HIV. Nonetheless, 4968 single mutations have been gradu-
ally detected in the 7823 US strains in the past few months compared with the first SARS-CoV-2 genome
collected on December 24, 2019 [4, 5]. The frequency of virus mutations is accumulated by the natural se-
lection, cellular environment, polymerase fidelity, random genetic drift, features of recent epidemiology,
host immune responses, gene editing, replication mechanism, etc [6, 7]. However, it is difficult to deter-
mine the detailed mechanism of a specific mutation. Additionally, the current mechanistic understanding
of SARS-CoV-2 proteins, protein-protein interactions, and their synergy with host cell proteins, enzymes,
and signaling pathways is very limited. There is an urgent need to further explore the SARS-CoV-2 struc-
ture, function, and activity. Analyzing SARS-CoV-2 genome mutations and evolution provides an efficient
means to understand viral genotyping and phenotyping. Although experimental verification is required
to ultimately determine how single mutations with high frequency have changed SARS-CoV-2 properties,
such as viral infectivity and virulence, the relationship between these single high-frequency mutations and
SARS-CoV-2 properties can still be deciphered from genotyping, protein analysis, and transmission track-
ing.
    In this work, we extract 7823 single nucleotide polymorphism (SNP) profiles from genome isolates col-
lected in the United States. We found that the US SARS-CoV-2 has developed into four substrains. To
further understand the characteristic of the US SARS-CoV-2 evolution and transmission, we investigate its
most prevalent high-frequency or top mutations. Based on genotyping results, top eight missense muta-
tions (i.e., 14408C>T-(P323L), 23403A>G-(D614G), 25563G>T-(Q57H), 1059C>T-(T85I), 28144T>C-(L84S),
17858A>G-(Y541C), 17747C>T-(P504L), and 27964C>T-(S24L)) are identified, in addition to three synony-
mous mutations (i.e., 3037C>T-(F106F), 8782C>T-(S76S), and 18060C>T-(L7L)) that do not change SARS-
CoV-2 proteins. Among them, mutations 17858A>G-(Y541C), 17747C>T-(P504L), and 27964C>T-(S24L)
were originated and prevalent mainly in the US, attributing to the unique characteristics of COVID-19 in
the US. We focus on the top eight missense mutations in the present work. Based on co-mutation and
time evolution analysis, we hypothesize that three concurrent mutations 17747C>T-(P504L), 17858A>G-
(Y541C), and 28144T>C tend to fade out, while the other five concurrent mutations can enhance the infec-
tivity of SARS-CoV-2. Moreover, by analyzing the gender disparity, we find that a US-unique mutation,
27964C>T-(S24L), shows an interesting female-dominated pattern.
    NSP2, NSP12 (RdRp), NSP13 (helicase), spike (S) protein, ORF3a, and ORF8 are six SARS-CoV-2 pro-
teins that associate with eight different missense mutations mentioned above. It is important to analyze
the impact of mutations on the structures, stabilities, and functions of these proteins. Employing the Jac-
card distance-based genotyping [8, 9], topological data analysis [10], artificial intelligence [11], flexibility-

                                                       1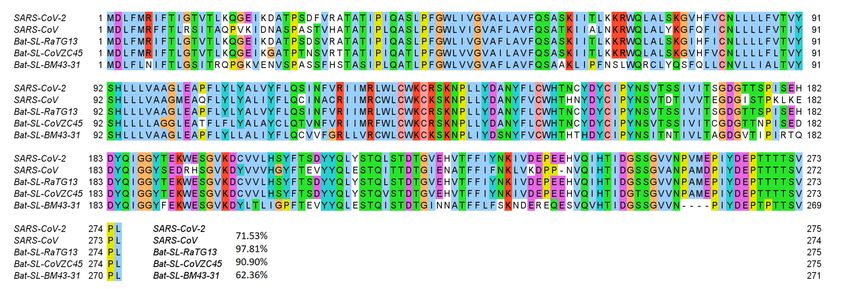
rigidity index (FRI) [12], and network models [13], we show that 23403A>G-(D614G) and 27964C>T-(S24L)
strengthen the folding stability of the spike protein and ORF8 protein. Conversely, the other high-frequency
missense mutations disrupt the folding stability of its corresponding proteins. Furthermore, because SARS-
CoV-2 enters the host cells by the interaction of the S protein and the host angiotensin-converting enzyme
2 (ACE2) receptor [14], we quantitatively evaluate the mutation-induced protein-protein binding free en-
ergy changes (∆∆G) of S protein and ACE2. The results reveal that overall, the frequency of infectivity-
strengthening mutations on the S protein is higher than the infectivity-weakening mutations, explaining
the fast person-to-person transmission in the United States.
  In a nutshell, we analyze the characteristics of SARS-CoV-2 substrains and prevalent mutations in the
United States. These mutations, together with additional mutations on the S protein, suggest that SARS-
CoV-2 has become more infectious in the United States.

2       Results and Discussion

2.1     Genotyping analysis

Figure 1: Pie chart plot of four clusters in the United States as of July 14, 2020. The blue, red, yellow, and green colors represent
clusters A, B, C, and D, respectively. The base color of each state is decided by its dominant cluster. Some of the states do not submit
the complete genome sequences to GISAID. Therefore, we will not set the base color of these states.

2.1.1    Cluster analysis

Complete genome sequence data can provide us with a wide variety of opportunities to decode the mutation-
induced transmission and infection behavior of COVID-19. In this work, we downloaded 28726 complete
SARS-CoV-2 genome sequences from GISAID ( https://www.gisaid.org/) up to July 14, 2020. Based on
the genotyping results, we obtain 28726 SNP profiles, which record all of the single mutations compared to
the first complete genome sequence of SARS-CoV-2 in the GenBank (access number: NC 045512.2). Among
them, 7823 SNP profiles are decoded from the genome isolates submitted by the United States, and 4968

                                                                   2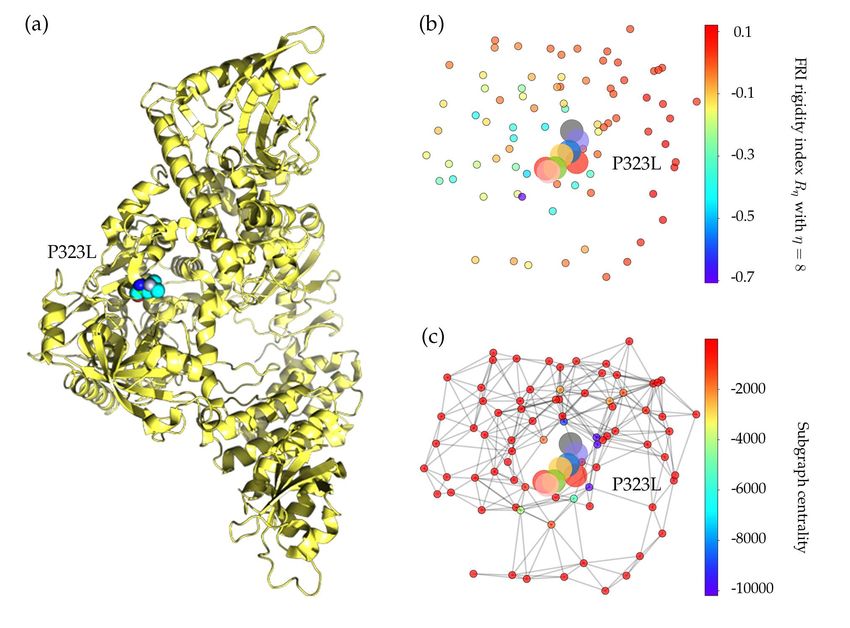
single mutations are detected. We track the geographical distributions of the 4968 single mutations in
7832 SARS-CoV-2 genome isolates with the k-means clustering method. Based on the mutations, the 7832
genome isolates in the United States are clustered into four distinct clusters, as shown in Figure 1. The blue,
red, yellow, and green represent Cluster A, B, C, and D, respectively. The base color of each state is deter-
mined by its dominated cluster. We show that most of the states are dominated by Cluster B and Cluster D.
Table 1 lists the distribution of samples and the total number of single mutations in 20 US states that have
submitted significantly many SARS-CoV-2 genome isolates. They are Alaska (AK), Arizona (AZ), California
(CA), Connecticut (CT), Washington, D.C. (DC), Florida (FL), Idaho (ID), Illinois (IL), Louisiana (LA), Mary-
land (MD), Massachusetts (MA), Michigan (MI), Minnesota (MN), New Mexico (NM), New York (NY),
Oregon (OR), Utah (UT), Virginia (VA), Washington (WA), and Wisconsin (WI). In Cluster A, B, C, and D,
the co-mutations with the highest number of descendants are [8782C>T, 18060C>T, 28144T>C], [241C>T,
3037C>T, 14408C>T, 23403A>G], [11083G>T], and [3037C>T, 14408C>T], respectively. It is noted that all
of the 20 states have the mutations from Clusters B and D. Alaska (AK) and Louisiana (LA) do not have
mutations from Cluster A, and New Mexico (NM) does not have mutations in Clusters A and C. The com-
plete list of the table can be found in the supporting materials. More analysis related to the infectivity of
SARS-CoV-2 based on our four distinct clusters is given in Section 2.3.
        Table 1: The cluster distributions of samples (NNS ) and total mutation counts (NTF ) in 20 states of the U.S. The 20
        states are Alaska (AK), Arizona (AZ), California (CA), Connecticut (CT), Washington, D.C. (DC), Florida (FL), Idaho
        (ID), Illinois (IL), Louisiana (LA), Maryland (MD), Massachusetts (MA), Michigan (MI), Minnesota (MN), New Mexico
        (NM), New York (NY), Oregon (OR), Utah (UT), Virginia (VA), Washington (WA), and Wisconsin (WI).

                              Cluster A               Cluster B              Cluster C              Cluster D
                State       NNS      NTF            NNS      NTF           NNS      NTF           NNS      NTF
                AK            0         0            12       99            4        27            14       105
                AZ            8        51            46      364            4        44            18       156
                CA           99       752           414      3308          152       830          561      5999
                CT            1        11            44      365            1        12            62       701
                DC            1         6            15      108            4        51            2        34
                FL            2        12            85      672            21       275           73       810
                ID            1        10            16      147            1         9            33       460
                IL            8        57            28      202            19       184           30       265
                LA            0         0           264      2302           3        80            77       961
                MD            1         6            23      178            16       221           18       257
                MA            1         8            21      138            3        21            9        64
                MI            2        13           192      1486           11       111           61       572
                MN           43       311           177      1398           31       236          212      2537
                NM            0         0            15       98            0         0            6        52
                NY           17       108           977      7338           70       560          204      1918
                OR           13        84            46      395            50       269           87       762
                UT           12        76            32      243            6        50            21       161
                VA           15       100           163      1291           13       108          136      1430
                WA          982      7274           598      4799           49       558          465      5316
                WI           11        74           137      1019          178       973          334      3539

2.1.2    Top mutations in the United States

To investigate the implications of mutations on the transmission, infection, and virulence of SARS-CoV-2 in
the United States, we focus on the high-frequency or top mutations that represent the most common char-
acteristics of SARS-CoV-2 in the United States. A total of 11 mutations in the United States has a frequency
greater than 700. Among them, 3 mutations are synonymous ones (i.e., 3037C>T-(F106F), 8782C>T-(S76S),

                                                                 3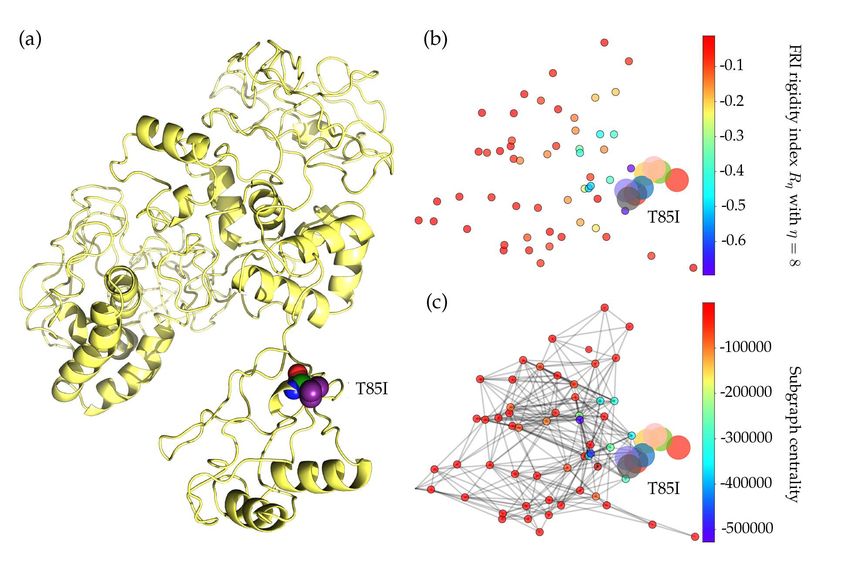
Table 2: Top 8 missense mutations that are prevalent in the United States. The ranking of these 8 mutations in the US and world are
included in the table. NCU.S. and NCWorld represent for the total number of sequences with a specific mutation in the United States
and in the world, respectively. The last column records the date that these eight missense mutations were detected for the first time
in the world and in the United States. The second-last column records their corresponding countries, i.e. the country lists at the top
shows where the mutations first detected, and the country lists at the bottom will always be the United States. Here, UK, US, CN, SG
represent the United Kingdom, the United States, China, and Singapore, respectively. We use ISO 8601 format YYYY-MM-DD as the
date format.

        Rank: US/World               Mutation                  Protein
                                                                 NCU.S. NCWorld Country                            Date
                                                                                  UK                            2020-02-03
           Top 1/Top 2          14408C>T-(P323L) NSP12(RdRp) 5918 22081
                                                                                  US                            2020-02-28
                                                                                  CN                            2020-01-24
           Top 2/Top 1         23403A>G-(D614G)      Spike        5912 22162
                                                                                  US                            2020-02-28
                                                                                  SG                            2020-02-16
           Top 3/Top 3          25563G>T-(Q57H)     ORF3a         4827   8326
                                                                                  US                            2020-02-29
                                                                                  SG                            2020-02-16
           Top 4/Top 7            1059C>T-(T85I)     NSP2         4237   6595
                                                                                  US                            2020-02-29
                                                                                  CN                            2020-01-05
           Top 5/Top 8           28144T>C-(L84S)     ORF8         1434   2487
                                                                                  US                            2020-01-19
                                                                                  US                            2020-02-20
          Top 6/Top 10         17858A>G-(Y541C) NSP13(Helicase) 1245     1428
                                                                                  US                            2020-02-20
                                                                                  US                            2020-02-20
          Top 7/Top 11          17747C>T-(P504L) NSP13(Helicase) 1224    1396
                                                                                  US                            2020-02-20
                                                                                  US                            2020-02-20
          Top 8/Top 14           27964C>T-(S24L)     ORF8          705    749
                                                                                  US                            2020-02-20
and 18060C>T-(L7L)) and 8 mutations are the missense mutations (i.e., 14408C>T-(P323L), 23403A>G-
(D614G), 25563G>T-(Q57H), 1059C>T-(T85I), 28144T>C-(L84S), 17858A>G-(Y541C), 17747C>T-(P504L),
and 27964C>T-(S24L)). Since synonymous mutations do not change SARS-CoV-2 proteins, we only focus
on the other eight missense mutations. Table 2 lists the frequencies of the top 8 missense mutations in the
United States. The dates that these mutations were first detected in the world and in the United States
are also included in the Table 2. The first missense mutation, 23403A>G-(D614G), occurred in China on
January 24, 2020. The missense mutation with the highest frequency, 14408C>T-(P323L), occurred in the
United Kingdom on February 3, 2020. Both mutations were first detected in the US on February 28, 2020.
The first top mutation recorded in the US was 28144T>C-(L84S), on January 19. This mutation was origi-
nally detected in China on January 5, 2020.
   Note that three of the top 8 missense mutations, i.e., 17858A>G-(Y541C), 17747C>T-(P504L), and 27964C>T-
(S24L), first appeared in the United States. In fact, over 87% of these mutations are kept in the United States.
   Note that the top 5 mutations in the United States are also the top 5 mutations in the world. However,
the next 3 mutations in the US is not ranked within the top 8 globally.

2.1.3   Co-mutation analysis

The statistical values of pairwise co-mutations from the top 8 high-frequency mutations in Table 3. The
upper triangular reveals the total number of co-mutations for each pair of mutations, the diagonal presents
the frequency of every single mutation, and the lower triangular shows the ratios of pairwise co-mutations
over single mutations. It is easy to see that the top 8 mutations can be grouped into two essentially dis-
connected groups. The first group involves 5 mutations 1059C>T-(T85I), 14408C>T-(P323L), 23403A>G-
(D614G), 25563G>T-(Q57H), and 27964C>T-(S24L) that are strongly correlated, though have a wide range
of frequencies. The other three mutations, 17747C>T-(P504L), 17858A>G-(Y541C), and 28144T>C-(L84S),

                                                                  4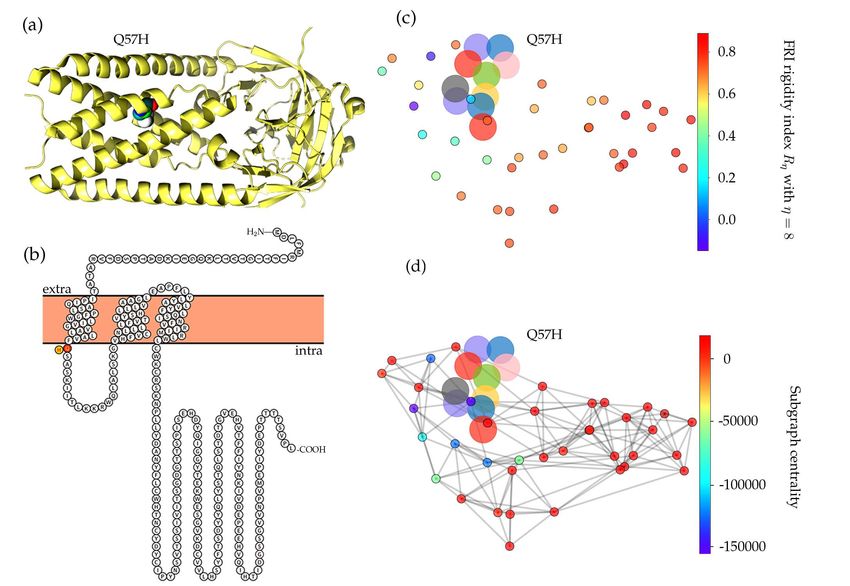
Table 3: The statistical values of pairwise co-mutations from the top 8 high-frequency mutations. The values in the
        diagonal reveal the total number of a specific single mutation in the United States, the values in the upper triangular
        represent the total number of the co-mutations, and the values in the lower triangular present the ratios of pairwise
        co-mutations over single mutations.

                   14408C>T 23403A>G 1059C>T 25563G>T 27964C>T 17747C>T 17858A>G 28144T>C
    14408C>T          5918      5904      4235      4818   705      0         0       4
    23403A>G       1.00/1.00    5912      4230      4818   705      0         0       3
    1059C>T        1.00/0.72 1.00/0.72    4237      4235   703      0         0       4
    25563G>T       1.00/0.82 1.00/0.82 1.00/0.88    4827   703      1         1       4
    27964C>T       1.00/0.12 1.00/0.12 1.00/0.17 1.00/0.15 705      0         0       0
    17747C>T          0/0       0/0       0/0       0/0    0/0    1224      1224    1222
    17858A>G          0/0       0/0       0/0       0/0    0/0 1.00/1.00    1245    1243
    28144T>C          0/0       0/0       0/0       0/0    0/0 0.85/1.00 0.87/1.00  1434
occur mostly together and have similar numbers of frequencies.

2.1.4    Evolutionary analysis

Figure 2: The blue line plots illustrate the evolution of the top 8 missense mutation ratios computed as the frequency of genome
sequences having mutations over the counts of genome sequences at each 10-days period. The red lines represent the evolution of the
total counts of genome sequences. Bar plot of the gender distributions of the ratio of the number of samples having top 8 missense
mutations over the total number of samples having age and/or gender labels. Red bars represent the female ratio and the blue bars
represent the male ratio in the United States.

    Figure 2 plots time evolution trajectories of top 8 missense mutations. The red curves are the total
numbers of genome samples over time, which become very insufficient after middle May 2020. First, as
shown in Table 3, mutations 14408C>T-(P323L) and 23403A>G-(D614G) appear concurrently and thus
have an identical trajectory as shown in Figure 2. Note that this pair of mutations exist in essentially
all of the US infections. Additionally, mutation 1059C>T-(T85I) always occurs together with mutation
25563G>T-(Q57H). Therefore, its time evolution trajectory is extremely similar to that of 25563G>T-(Q57H).
Both mutations were first detected in Singapore on February 16, 2020. This pair of mutations occur in

                                                                  5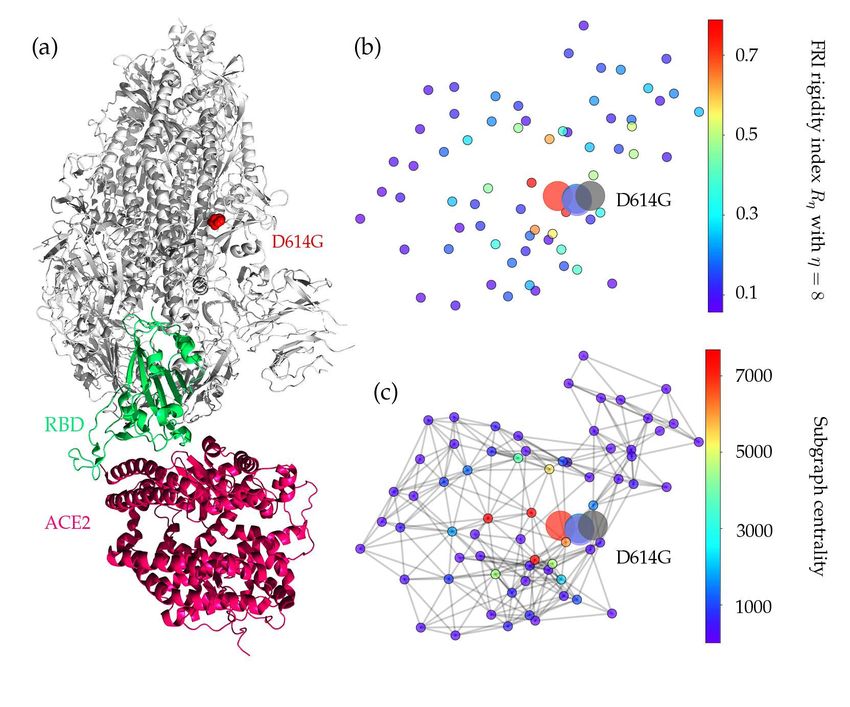
about 70% of US COVID-19 cases. The third pair of mutations, 17747C>T-(P504L) and 17858A>G-(Y541C),
first detected and occurred mostly in the US, have an identical evolution trajectory. Suggested by genome
samples, this pair of US-based mutations on the helicase protein appears to have essentially died out in
the US. Unfortunately, because there are very insufficient sequencing in the US now as shown by the red
curve in Figure 2, one can not rule out the existence of these mutations. Mutation 28144T>C-(L84S), the
first known mutation globally, has had a very unsteady trajectory. However, its trajectory became identical
to those of its co-mutations 17747C>T-(P504L) and 17858A>G-(Y541C) after February 20, 2020. Finally,
mutation 27964C>T-(S24L) has an usually behavior. Its peak ratios occurred in early June when there were
insufficient sequence samples in the US.

2.1.5   Gender analysis

The last chart in Figure 2 displays the gender disparity of the top 8 mutations in the US. The overall pattern
may correlate with the disparity in male and female immune response and gene editing strengths. In the
US, the total number of mutations in all 1044 female genome samples is 8438 compared with 7779 mutations
recorded in 982 male samples. After the total number correction, female genome isolates still have about
2% more mutations than those of male genome isolates. There is an apparent gender difference in mutation
27964C>T-(S24L) on the ORF8 protein. Among 705 samples having this mutation, 204 isolates have gender
labels. The ratio of female samples (167) over male samples (67) is about 2 to 1. We currently do not have a
good explanation for such a large difference in the ratio.

2.2     Protein-specific analysis

In this section, we discuss the properties of the top 8 missense mutations associated with 6 proteins (i.e.,
NSP2, NSP12, NSP13, spike protein, ORF3a, and ORF8). Based on the analysis presented above, we re-
veal the potential influence of these high-frequency mutations on the infective capacity of SARS-CoV-2
in the United States using protein folding stability analysis. Furthermore, to understand the impact on
the protein’s structures induced by mutations, we employ artificial intelligence [11], flexibility-rigidity
index (FRI) [12], and subgraph centrality models [13]. Results of our theoretical analysis are summa-
rized in Table 4, which lists the folding stability changes, the FRI rigidity changes, and the average sub-
graph centrality changes following the mutations. Here, the folding stability change following mutation
∆∆G = ∆Gw − ∆Gm measures the difference between the folding free energies of the wild type ∆Gw
and the mutant type ∆Gw . More specifically, a positive folding stability change ∆∆G indicates that the
mutation will stabilize the structure of the protein and vice versa. The molecular FRI rigidity Rη measures
the topological connectivity and the geometric compactness of the network consisting of Cα at each residue
and the heavy atoms involved in the mutant. In this work, η determines the range of pairwise interactions
and is set to 8Å. Furthermore, the average subgraph centrality hCs i is employed to describe the connection
between any pair of atoms within a cutoff distance of 8.0 Å. The decrease of the average participating rate of
each edge in the network will cause the increment of the average subgraph centrality hCs i. The increment
of the hCs i induced by a mutation is due to the decrease of the number of neighbor edges participating
rate of each edge [13]. In addition, we also list the statistical values of pairwise co-mutations for the top 8
high-frequency mutations in Table 3.

2.2.1   Mutation on the NSP12 protein

Mutation 14408C>T-(P323L) on the NSP12 (also called RNA-dependent RNA polymerase, abbreviation
RdRp) was first found in the United Kingdom on February 03, 2020. The United States found its first case

                                                      6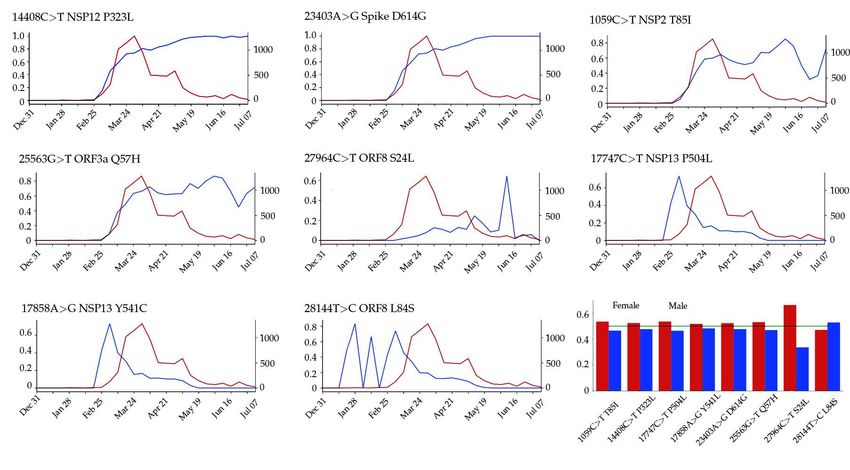
Table 4: The protein folding stability changes of 8 missense mutations. The folding stability change ∆∆G = ∆Gw − ∆Gm , where
∆Gw and ∆Gm are the folding free energies of the wild type and the mutant type, respectively. R8w and R8m are FRI rigidities for
the wild type and mutant type of the protein with η = 8Å. Here, hCsw i and hCsm i are the average subgraph centralities of the wild
type and the mutant type, respectively. ∆R̄8 and ∆hC̄s i are the molecular FRI rigidity changes and the average subgraph centrality
change.
Rank Mutation Protein ∆∆G(kcal/mol) R8w R8m ∆R̄8 % hCsw i hCsm i ∆hC̄s i%
Top 1 14408C>T-(P323L) NSP12(RdRp) -0.11 9.77 9.87 -1.0 1105 1959 -77
Top 2 23403A>G-(D614G) S protein 0.34 10.27 10.10 1.7 2376 1386 42
Top 3 25563G>T-(Q57H) ORF3a -0.24 11.33 11.66 -1.5 25061 58592 -134
Top 4 1059C>T-(T85I) NSP2 -0.05 12.37 12.51 -1.1 89764 166399 -85
Top 5 28144T>C-(L84S) ORF8 -0.99 12.28 12.05 1.9 12810 6504 49
Top 6 17858A>G-(Y541C) NSP13(Helicase) -0.81 11.52 10.40 9.7 506640 7271 99
Top 7 17747C>T-(P504L) NSP13(Helicase) -0.59 7.52 7.54 0.3 4668 6094 -31
Top 8 27964C>T-(S24L) ORF8 0.20 11.72 11.66 0.5 11685 29777 -155
related to 14408C>T-(P323L) on February 28, 2020. Since then, this mutation has become one of the single
dominant mutations in the United States. Among 7823 complete genome sequences, 5918 are connected to
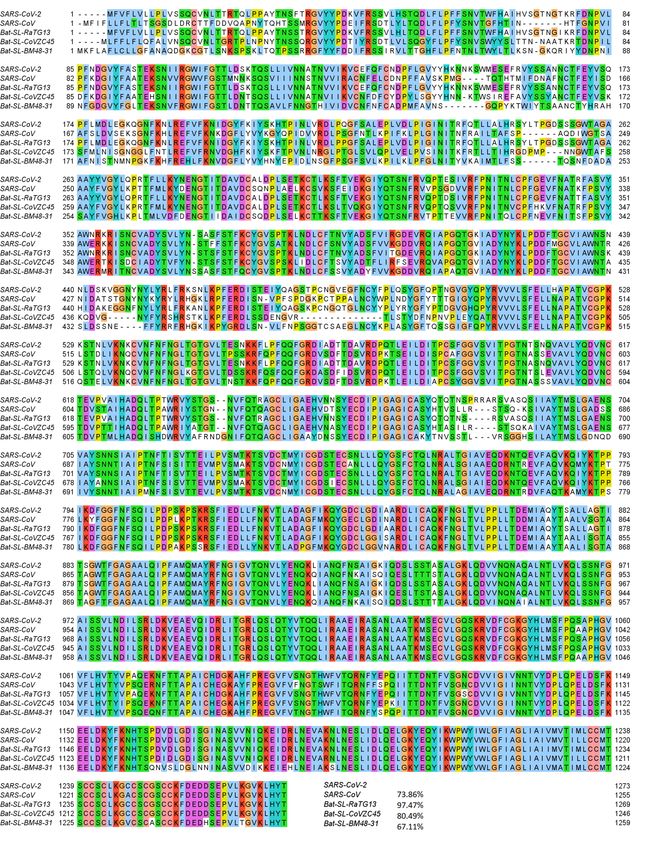
P323L. Figure 3 shows the sequence alignment for the NSP12 of SARS-CoV-2, SARS-CoV [15], bat coron-
avirus RaTG13 [16], bat coronavirus CoVZC45 [17], and bat coronavirus BM48-31 [18]. The red rectangle
marks the mutant residue with its neighborhoods. One can see that SARS-CoV-2 NSP12 is highly conserva-
tive among the other four species. Although P323L mutates the residue of proline (P) to leucine (L), these
two residues are both non-polar and aliphatic, indicating P323L may not affect the functionality of NSP12
too much. Figure 4 (a) shows the three-dimensional (3D) structure of SARS-CoV-2 NSP12, which is created
by PyMol [19].
NSP12 is of paramount importance to the SARS-CoV-2 replication and transcription machinery. It is
one of the primary targets for antiviral drugs. Researchers have engaged in developing new antiviral ther-
apeutics that target NSP12 for combating COVID-19 in the past few months. NSP12 and its cofactors NSP7
and NSP8 can form a hollow cylinder-like supercomplex that interacts with NSP14, an exonuclease that has
the proofreading capability [20]. The structure of NSP12 contains a nidovirus-specific N-terminal extension
domain (residues D60 to R249) and a right-hand RdRp domain (S367 to F920), which are connected by an
interface domain (residues A250 to R365) [21]. Mutation P323L locates on this interface domain, which,
however, is still poorly characterized.
The increasing ratio of P323L in Figure 2 indicates that this type of mutations may favor SARS-CoV-2
and enhance the transmission capacity of SARS-CoV-2. However, the negative folding stability changes in
Table 4 suggest that P323L destabilizes the NSP12, which may make SARS-CoV-2 less contagious. Figure 4
(b) and (c) show the differences of FRI rigidity index and subgraph centrality between the network with
wild type and the network with mutant type. The atoms on the mutant residue is mark with big color balls.
We deduce that the slight increase in the rigidity means the mutation makes the protein less flexible or less
cooperative in synergistic interactions.
Based on the statistical values of co-mutations in Table 3, we can see that 14408C>T-(P323L) always
shows up with 1059C>T-(T85I), 23403A>G-(D614G), 25563G>T-(Q57H), and 27964C>T-(S24L) simultane-
ously. Therefore, we can deduce that the increasing tendency of P323L ratios per 10-days is due to its
co-mutation with other infectivity-strengthening mutations, such as 23403A>G-(D614G).
2.2.2 Mutation on the Spike protein
Mutation 23403A>G-(D614G) located on the spike protein has the second-highest frequency in the United
States, which has been recently considered as the key mutation that makes SARS-CoV-2 more infectious
7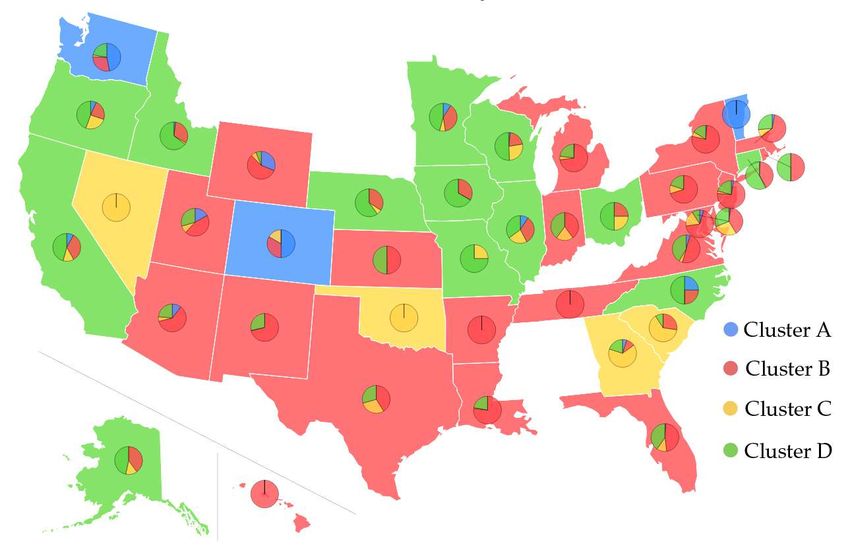
Figure 3: Sequence alignments for the NSP12 of SARS-CoV-2, SARS-CoV, bat coronavirus RaTG13, bat coronavirus CoVZC45, bat
coronavirus BM48-31. Detailed numbering is given according to SARS-CoV-2. One high-frequency mutation 14408C>T-(P323L) is
detected on the NSP12 protein. Here, the red rectangle marks the P323L mutations with its neighborhoods.

worldwide [22]. From Table 2, one can see that mutation D614G was initially detected in China on January
24, 2020. However, D614G was not widely spread in China, which is probably due to the strict social
distancing rules and the Wuhan lockdown implemented by the Chinese government. In the middle of
February, the hot spot with the most COVID-19 cases shifted from China to Europe and the D614G variant
rapidly pervades in Europe [7]. The first case with the D614G mutation in the United States was reported
on February 28, 2020. Since then, the D614G mutation has become a majority variant, and 68.7% of patients
carry D614G in the United States as of July 14, 2020.
    The SARS-CoV-2 spike protein is a multi-functional molecule that interacts with the ACE2, which me-
diates the virus entering into the host cells [23]. Figure 6 (a) depicts the 3D structure of the SARS-CoV-2
spike protein that interacts with the host ACE2. The D614G mutation is one of the most popular mutations
of SARS-CoV-2, which changes the amino acid aspartate (D) with the polar negative charged side changes
to the amino acid glycine (G) with a non-polar side chain. Figure 5 depicts the sequence alignment for the
S protein of SARS-CoV-2, SARS-CoV, bat coronavirus RaTG13, bat coronavirus CoVZC45, and bat coron-
avirus BM48-31. We use the red rectangle to mark the position of D614G and its neighborhoods. The S
protein of bat coronavirus RaTG13 has the highest similarity of 97.47% with the S protein of SARS-CoV-2.
One can see that amino acids near position 614 are very conservative, indicating that D614G mutation will
play an important role in the functions of the S protein of SARS-CoV-2. Moreover, the D614G mutation ratio

                                                           8
Figure 4: (a) The 3D structure of SARS-CoV-2 NSP12 protein. The mutated residue is marked with color balls. (b) The differences
of FRI rigidity index between the network with wild type and the network with mutant type. (c) The difference of the subgraph
centrality between the network with wild type and the network with mutant type.
in Figure 2 keeps climbing, and the ratio is approaching the unity after June 16, 2020, which also proves
that SARS-CoV-2 becomes more contagious as time goes on.
Table 4 shows a positive folding free energy change, indicating the stabilization effect of the mutation.
Figure 6 (b) and (c) illustrate the difference of FRI rigidity index and the subgraph centrality between the
network with wild type and the network with mutant type. The FRI rigidity decreases following the mu-
tation, endowing the S protein higher flexibility to interact with ACE2. The same is confirmed by average
subgraph centrality.
2.2.3 Mutation on the ORF3a protein
Mutation 25563G>T-(Q57H) is on the ORF3a protein. It was first found in Singapore on February 16, 2020.
The case in the United States was detected on February 28, 2020. As of July 14, 2020, 3865 complete genome
sequences have the Q57H mutation in the United States, while 6765 isolates carry this type of single muta-
tion in the world. The Q57H mutation changes the amino acid glutamine (Q) with a non-charged polar side
chain to the positively charged polar side chain of amino acid histidine (H). Figure 7 shows the sequence
alignment results in different species. The ORF3a of SARS-CoV-2 and SARS-CoV share a 71.53% sequence
similarity. The red rectangle marks the Q57H mutations with its two neighborhoods. Similarly, one can see
that the amino acids nearby position 57 are all conservative in all of 5 species. Moreover, Figure 8 (b) visu-
alizes the SARS-CoV-2 ORF3a proteoform, where we use red to mark the wild type amino acid glutamine
(Q) and yellow to address the mutant amino acid histidine (H). Spatiotemporally, mutation Q57H locates
at the intramolecular interface and in touch with the membrane, which indicates the special functionality
changes that Q57H can induce., and Figure 8 (b) is the visualization of ORF3a, which is generated by an
9Figure 5: Sequence alignments for the S proteins of SARS-CoV-2, SARS-CoV, bat coronavirus RaTG13, bat coronavirus CoVZC45, bat
coronavirus BM48-31. Detailed numbering is given according to SARS-CoV-2 S protein. One high-frequency mutation 23403A>G-
(D614G) is detected on the S protein. Here, the red rectangle marks the D614G mutations with its neighborhoods
online server Protter [24].
The ORF3a gene of SARS-CoV-2 encodes 275 amino acids with TNF receptor-associated factors (TRAFs),
ion channel, and caveolin binding domain. Previous studies have shown that SARS-CoV ORF3a contains a
cysteine-rich motif, a tyrosine-based sorting motif, and a diacidic EXD motif, which are the critical domains
that participate in the apoptosis and activate the innate immune signaling receptor NLRP3 (NOD-, LRR-,
and pyrin domain-containing 3) inflammasome [25, 26]. ORF3a of SARS-CoV-2 shares 71.53% similarity
10Figure 6: Illustration of S-protein and ACE2 interaction. The RBD is displayed in green, the ACE2 is given in red, and mutation D614G
is highlighted in red. (b) The difference of FRI rigidity index between the network with wild type and the network with mutant type.
(c) The difference of the subgraph centrality between the network with wild type and the network with mutant type.
with the ORF3a of SARS-CoV. Similarly, SARS-CoV-2 ORF3a protein is widely expressed in intracellular
and plasma membranes, which induces apoptosis and inflammatory responses in the infected cells and
transfected cells [26]. Figure 8 (c) and (d) depict the differences of the FRI rigidity index and the subgraph
centrality between the network with wild type and the network with mutant type. We can see that the
ORF3a becomes more rigidity after the mutation, which may result in a less flexible mutant for ORF3a to
involve in the apoptosis and inflammatory response.
As illustrated in Figure 2, the ratio of the 25563G>T-(Q57H) mutation on ORF3a in each 10-day period
kept increasing once it was introduced to the United States. This tendency indicates that mutation Q57H be-
comes popular in the viral patients of the United States, which may make the SARS-CoV-2 more infectious.
From Table 3, we can see that 4827 SNP variants have 25563G>T-(Q57H) mutation on ORF3a. Among
them, 4818 variants have the [25563G>T-(Q57H), 23403A>G-(D614G)] co-mutations. As we mentioned
above, the S protein plays an important role in viral transmission, indicating that mutation 25563G>T-
(Q57H) may also be of great importance for viral transmission. The negative folding stability changes of
mutation Q57H in Table 4 reveals that ORF3a becomes unstable following the Q57H mutation, which may
harm the function of ORF3a in apoptosis and increase the viral load in the host cell. However, the Q57H
mutation locates near TRAF, ion channel, and caveolin binding domain [26], which may affect the NLRP3
inflammasome activation. ORF3a activates the innate immune signaling receptor NLRP3 inflammasome
via mechanisms such as ion-redistribution and lysosomal disruption, which causes tissue inflammation
during respiratory illness and the production of inflammatory cytokines [27].
11Figure 7: Sequence alignments for the ORF3a protein of SARS-CoV-2, SARS-CoV, bat coronavirus RaTG13, bat coronavirus CoVZC45,
bat coronavirus BM48-31. Detailed numbering is given according to SARS-CoV-2. One high-frequency mutation 25563G>T-(Q57H)
locates on the ORF3a protein. Here, the red rectangle marks the Q57H position with its neighborhoods.
Figure 8: (a) The 3D structure of SARS-CoV-2 ORF3a protein. (b) The visualization of SARS-CoV-2 ORF3a proteoform. The high-
frequency mutation 25563G>T-(Q57H) on ORF3a is marked in color. The red color represents the wild type and the yellow represents
the wild type. (c) The difference of FRI rigidity index between the network with wild type and the network with mutant type. (d) The
difference of the subgraph centrality between the network with wild type and the network with mutant type.
2.2.4 Mutation on the NSP2 protein
Mutation 1059C>T-(T85I) was first detected in Singapore on February 16, 2020. On February 29, 2020, the
first SNP variants with mutation 1059C>T-(T85I) appeared in the United States. As of July 14, 2020, more
than half of mutation1059C>T-(T85I) counts found worldwide are from the United States. The residue
12T85 on the NSP2 is polar and non-charged, and it changes to a non-polar residue I85 after the mutation.
Figure 10 (a) shows the 3D structure of SARS-CoV-2 NSP2. From Figure 9, we can see that coronaviral
NSP2 is relatively conservative for the first 91 residues. Moreover, the T85 residue with its neighbors is all
conservative in the other four SARS-like sequences, indicating this type of mutations may be substantial to
coronaviral structures and properties.
NSP2 is also a viral protein that does not attract much research attention. In the SARS-CoV genome,
the deletion of NSP2 will only result in a modest reduction in viral titers, which is considered to be a
dispensable protein [28]. Table 4 shows that the folding stability change of T85I is -0.05 kcal/mol. Although
the negative value reveals that T85I may destabilize the structure of NSP2, this small change is negligible.
The FRI rigidity change is also minor, as is shown in Figure 4 (c), indicating the mutation of T85I on the
NSP2 does not change the flexibility of NSP2 too much. However, the growing trend in Figure 2 still
indicates that 1059C>T-(T85I) is an infectivity-strengthening mutation, which mainly benefits from the
co-mutation with other infectivity-strengthening mutations, such as 23403A>G-(DD614) and 25563G>T-
(Q57H).
Figure 9: Sequence alignments for the NSP2 of SARS-CoV-2, SARS-CoV, bat coronavirus RaTG13, bat coronavirus CoVZC45, bat
coronavirus BM48-31. Detailed numbering is given according to SARS-CoV-2. One high-frequency mutation 1059C>T-(T85I) locates
on the NSP2 protein. Here, the red rectangle marks the T85I position with its neighborhoods.
2.2.5 Mutations on the NSP13 protein
NSP13 of SARS-CoV-2 is a superfamily 1 helicase, which can unwind a double-stranded RNA (dsRNA) or
DNA (dsDNA) in the 5’ to 3’ direction into two single-stranded nucleic acids. Moreover, NSP13 can hy-
drolyze the deoxyribonucleotide and ribonucleotide triphosphates, which are involved in the ATP-coupling
process [29, 30]. Furthermore, NPS13 is recruited to the double-membranes vesicles (DMVs) which are
mainly found in the cell’s perinuclear area during viral infection, indicating that NSP13 is crucial to the
viral infection and replication [31]. As illustrated in Figure 11, NSP13 of SARS-CoV-2 shares the most
homology with the other 4 species and is one of the most conservative proteins in SARS-CoV-2 genome.
13Figure 10: (a) The 3D structure of SARS-CoV-2 NSP2 protein. The mutant residue is marked with color balls. (b) The difference of FRI
rigidity index between the network with wild type and the network with mutant type. (c) The difference of the subgraph centrality
between the network with wild type and the network with mutant type.
Therefore, the existence of two high-frequency mutations on the NSP13 is very unusual.
Similar to 27964C>T-(S24L), although 17858A>G-(Y541C), 17747C>T-(P504L) are in the final list in Ta-
ble 2, more than 87% of them were detected in the United States. Mutation Y541C changes the amino acid
tyrosine (Y) to cysteine (C). Figure 12 shows the 3D structure of SARS-CoV-2 NSP13, where the mutant
residue is marked with color balls. It is worthwhile to note that tyrosine has an aromatic side chain, while
cysteine only has a polar non-charged side chain, indicating that the 3D structure of NSP13 will be incred-
ibly affected. Moreover, the other single mutation at the residue position 504 will not change the structure
of NSP13 very much since both the mutant and wild-type residues are non-polar aliphatic residues.
From Figure 2, one can note that both mutations on the NSP13 have the same trajectory of the mutation
ratios over time. Once mutations 17858A>G-(Y541C) and 17747C>T-(P504L) were first found in the United
States, they had a rapid increase in the first two weeks. However, these two mutations do not benefit
SARS-CoV-2. In early March, the ratio of both mutations start to decrease and approach zero after May 19,
2020, suggesting that mutations 17858A>G-(Y541C) and 17747C>T-(P504L) may hinder the transmission
of SARS-CoV-2. It is interesting to note that in Table 3, 17858A>G-(Y541C) and 17747C>T-(P504L) never
show up with 23403A>G-(D614G) in more than a thousand SNP variant, which provides a side evidence
that these two mutations may inhibit the contagiousness of SARS-CoV-2.
Table 4 shows that both high-frequency mutations Y541C and P504L have negative folding stability
changes, which will destabilize the structure of NSP13. As stated earlier, mutations 17858A>G-(Y541C) and
17747C>T-(P504L) happen simultaneously after analyzing 24715 genome sequences, which means the fold-
ing stability changes on the NSP13 are superimposed by two simultaneously occurred mutations. This also
explains the same decreasing tendency in Figure 2 after early March. Based on the protein-specific analysis
mentioned above, we can deduce that mutations Y541C and P504L prevent SARS-CoV-2 from efficiently
interacting with host interferon signaling molecules and impede the NSP13 from efficacious participation
14in the replication/transcription process. Figure 4 (b) shows the difference of the FRI rigidity index between
the network with wild type and the network with the mutant type. One mutation (17747C>T-(P504L)) does
not affect the rigidity much whereas the other mutation (17858A>G-(Y541C)) leads to a significant decrease
in the NSP12 rigidity, which may make NSP13 not as robust as before to involve in the viral infection and
replication process.
Figure 11: Sequence alignments for the NSP13 protein of SARS-CoV-2, SARS-CoV, bat coronavirus RaTG13, bat coronavirus CoVZC45,
bat coronavirus BM48-31. Detailed numbering is given according to SARS-CoV-2. Two high-frequency mutations 17858A>G-(Y541C)
and 17747C>T-(P504L) locate on NSP13. Here, the red rectangles mark the Y541C and P504: mutations with their neighborhoods.
2.2.6 Mutations on the ORF8 protein
The ORF8 protein also has two high-frequency mutations, 28144T>C-(L84S) and 27964C>T-(S24L). No-
tably, although 27964C>T-(S24L) has the lowest frequency in the top 8 missense mutations, more than
94.1% mutation 27964C>T-(S24L) worldwide were found in the United States. Moreover, the first con-
firmed case with 27964C>T-(S24L) was discovered on February 20, 2020, in the United States, suggesting
that S24L initially happened in the US. Another mutation on ORF8 is 28144T>C-(L84S), the number of se-
quences with the L84S mutation in the United States is 1437, which accounts for more than 50% proportion
of the isolates in the world. It is interesting to address that these two high-frequency mutations S24L and
L84S mutate reversibly. The amino acid serine (S) has a non-charged polar side chain, while the leucine
(L) has a non-polar aliphatic residue. Figure 13 illustrates the sequence alignment of SARS-CoV-2 ORF8
with the other 4 species. The SARS-CoV-2 ORF8 shares a really low similarity among all the other four
SARS-like species. SARS-CoV, Bat coronavirus RaTG13, Bat coronavirus CoVZC45, and Bat coronavirus
BM48-31 have the same residues at positions 24 and 84. Nonetheless, SARS-CoV-2 ORF8 owns different
types of residues. Here, we would like to address that although the ORF8 of SARS-CoV-2 at position 84 has
a different residue compared to the other 4 species, it mutates back to S in 1434 isolates in the United States.
15Figure 12: (a) The 3D structure of SARS-CoV-2 NSP13 protein. The mutant residue is marked with color balls. (b) The difference of FRI
rigidity index between the network with wild type and the network with mutant type. (c) The difference of the subgraph centrality
between the network with wild type and the network with mutant type.
Figure 14 (a) shows the 3D structure of SARS-CoV-2 ORF8. ORF8 protein of SARS-CoV-2 shares the
least homology with SARS-CoV among all viral proteins, which mediates the immune evasion by inter-
acting with major histocompatibility complex molecules class I (MCH-I) and down-regulating the surface
expression of MHC-I on various cells [32]. Once the “outer” invaders or antigens (i.e., viruses) enter the
host cell, the MCH-I will bind to them and bring them to the surface of the infected cell. Then, the T-cell
receptors (TCRs) that are expressed by cytotoxic T cells (TCLs) can recognize this unique signal presented
by MHC-I-peptide complex and directly eradicate the virus-infected cells, which is an effective and effi-
cient anti-viral immune response [33]. However, in ORF8-expressing cells, the MHC-I protein becomes the
major target for the lysosomal degradation mediated by bafilomycin A1 (Baf-A1), resulting in the limited
expression of MHC-I. Therefore, ORF8 protein has an effect on downregulating MHC-I, which will favor
SARS-CoV-2 to evade immune surveillance by hindering the presentation of antigen regulated by MHC-
I [32].
In Figure 2, the ratio of S24L per 10 days is slightly going up before June 2, 2020. In the next ten days’
period, the sharp increase and sharp drop in the ratio are due to the limited complete genome sequences
submitted to GISAID in June. However, the overall upward trend of the S24L ratio over time reveals that
S24L may enhance SARS-CoV-2’s ability to spread. In contrast, the time evolution plot shows that the ratio
of mutation 28144T>C-(L84S) goes up before the beginning of March, and then the ratio goes down and
approach zero after May 23, 2020. Due to the small number of sequence data, we can say that the ratio of
L84S has a decreasing tendency.
As discussed earlier, the female patients with S24L mutation on ORF8 account for a large proportion,
which indicates that the S24L is most likely to happen in the female population in the United States.
Table 4 shows that the folding stability change of 28144T>C-(L84S) is -0.99 kcal/mol, indicating that
ORF8 becomes unstable. Figure 14 (b) shows that the ORF8 becomes slightly less rigidity after both L84S
and S24L mutations. To be noted, the rigidity changes induced by S24L is less than the L84S. Based on the
function of ORF8 that involved in the immune response, we deduce that L84S may disfavor SARS-CoV-2
16and favor the host immune surveillance to decrease the viral load in the human cells, which provides an
explanation that the ratio of L84S in Figure 2 keeps decreasing. Meanwhile, the positive folding stability
change of 27964C>T-(S24L) lists in Table 4 reveals that this type of mutation may enhance the function
of ORF8. Therefore, the MHC-I will be inhibited more, and the eradication of SARS-CoV-2 in vivo will
be hindered. This explains the increasing trend in the ratio of S24L. Notably, after analyzing 28726 com-
plete genome sequences, none of them have mutations 28144T>C-(L84S) and 27964C>T-(S24L) happened
simultaneously.
Figure 13: Sequence alignments for the ORF8 protein of SARS-CoV-2, SARS-CoV, bat coronavirus RaTG13, bat coronavirus CoVZC45,
bat coronavirus BM48-31. Detailed numbering is given according to SARS-CoV-2. Two high-frequency mutations 28144T>C-(L84S)
and 27964C>T-(S24L) locate on the ORF8. Here, the red rectangles mark the S24L and L84S mutations with their neighborhoods.
Figure 14: (a) The 3D structure of SARS-CoV-2 ORF8 protein. The mutant residue is marked with color balls. (b) The difference of FRI
rigidity index between the network with wild type and the network with mutant type. (c) The difference of the subgraph centrality
between the network with wild type and the network with mutant type.
2.3 Infectivity analysis
As mentioned above, SARS-CoV-2 enters the host cell by the interaction of the S protein and ACE2. The
viral S protein is primed by TMPRSS2 to entail its cleavage at two potential sites, Arg685/Ser686 and
Arg815/Ser816 [14]. Based on the 7823 SNP variants’ information in the United States, we found 264
non-degenerate single mutations on the spike protein. Among them, 32 single mutations are detected on
the receptor-binding domain (RBD). Moreover, 7 single mutations occurred on the receptor-binding motif
17(RBM), the region that directly connects with the ACE2. In this section, we separate 7823 SNP variants in
the United States into four clusters and calculate the mutation-induced binding affinity changes of S pro-
tein RBD and ACE2 in each cluster, which will help us understand the potential transmission tendency
induced by the mutations on the S protein RBD. The binding affinity change induced by single mutation
∆∆G = ∆GW − ∆GM is defined as the subtraction of the binding affinity of the mutant type (∆GM ) from
the binding affinity of the wild type (∆GW ). Furthermore, the positive binding affinity change of a single
mutation means that the mutation can enhance the binding affinity of the S protein RBD and ACE2 and
make SARS-CoV-2 more infectious.
Figure 15 illustrates overall binding affinity changes ∆∆G (kcal/mol) induced by 32 single mutations
on SARS-CoV-2 S protein RBD. The color bar on the left-hand side of the figure represents the mutation
frequency. We can see that 50% single mutations have positive binding changes (16 out of 32). Moreover,
the frequency of mutations with positive binding affinity changes is higher than those with negative bind-
ing affinity changes, suggesting that SARS-CoV-2 is more likely to be infectious. Notably, the mutation
23010T>C-(V483A) has the highest frequency (30) localized on the RBM has the positive binding affinity
change, which indicates that V483A is prevalent in COVID-19 patients’ in the United States has a potential
capacity to enhance the infectivity of SARS-CoV-2. However, mutations that locate away from the RBM
will also have a crucial impact on the infectivity [34]. Although away from the RBM, the relatively high fre-
quency and positive binding affinity changes of N354K, R403K, and G467S indicate more attention should
be paid to them in the future. Additionally, an interesting finding is that the mutations occurred at the same
residue position such as A348S and A348T, P384L and P384S, and Q414E and Q414P always have similar
binding affinity changes.
30
1.00 RBM
Binding affinity changes (kcal/mol)
25
0.75
0.50
20
Frequency
0.25
15
0.00
0.25 10
0.50
5
0.75
0
T344S
R345S
A346K
A348S
N 48T
S3 54K
V3 9N
V367F
P382L
P3 84L
T3 84S
V3 5A
I
D 03K
Q 5V
41 P
I4 4E
L4 8V
I
K4 57K
P4 Q
A4 63S
G 75V
T4 76S
P4 8A
V4 79L
F4 3A
Q 90L
L
P5 20S
A5 R
S
R4 95
R4 41
A5 93
Q 14
22
21
58
8
40
1
7
8
5
4
4
A3
4
3
Figure 15: Overall binding affinity changes ∆∆G (kcal/mol) on the receptor-binding domain (RBD). The blue color region marks
the binding affinity changes on the receptor-binding motif (RBM). The height of each bar indicates the predicted ∆∆G. The color
indicates the occurrence frequency in the GISAID genome dataset.
Figure 16 illustrates the time evolution trajectories of 274 single mutations on SARS-CoV-2 S protein
RBD. The red line shows the mutations that have positive binding affinity changes and the blue lines repre-
sent the mutations that have negative binding affinity changes. Here, we hypothesize that single mutations
on S protein RBD with positive binding affinity changes will enhance the viral transmission since natural
selection favors them. One can see that the red lines gradually outpace the blue lines as time progresses,
suggesting that our hypothesis is correct.
Additionally, green lines indicate the evolutions of mutations that locate away from the RBD. The muta-
tion that has the highest frequency is D614G, which was reported to enhance SARS-CoV-2 infectivity [35,36].
18The trajectories of the other two high frequency S protein mutations (Q675R and E583D) indicate that they
are co-mutations with infectivity-enhancing S protein mutations, such as D614G. We found that the other
high frequency S protein mutation L5F is independent of mutation D614G.
Based on the genotyping results, we separate 7823 SNP variants from the United States into four clusters.
Table 1 shows the mutation distribution of four clusters with number of samples (NNS ) and total single
mutation counts (NTF ) in 20 states. Accordingly, a more specific analysis of the relationship between the
sign of the binding affinity changes and the transmission ability is discussed below.
Figure 16: The time evolution of 264 SARS-CoV-2 S protein mutations. The red lines represent the RBD mutations that strengthen
the infectivity of SARS-CoV-2 (i.e., ∆∆G is positive), the blue lines represent the RBD mutations that weaken the infectivity of SARS-
CoV-2 (i.e., ∆∆G is negative), and the green lines are for S protein mutations that away from the RBD. The mutation with the highest
frequency is D614G.
2.3.1 Cluster A infectivity
Figure 17 depicts the binding affinity changes of mutations in Cluster A. Total seven single mutations are
found in Cluster A. Four of them have the positive binding affinity changes, while the other three muta-
tions induced the negative binding affinity changes. Therefore, the mutations in Cluster B will strengthen
the infectivity of SARS-CoV-2 in general. The V483A mutation is localized on the RBM with the high-
est frequency, indicating that V483A may favor SARS-CoV-2 by natural selection and cause SARS-CoV-2
more infectious. Although A348T and N354K have relatively low frequencies due to the limited number of
genome samples, their high binding affinity changes lead to a more contagious SARS-CoV-2 substrain. It
is worth noting that from Table 1, mutations in Cluster A are involved in all of the 20 states except for LA.
However, DC, MA, and TX each only have one SARS-CoV-2 isolate related to Cluster A. Therefore, LA, DC,
MA, and TX are not contributed to the infectivity-strengthening mutations in Cluster A.
2.3.2 Cluster B infectivity
Figure 18 describes the binding affinity changes of mutations in Cluster B. There are thirteen single muta-
tions on the S protein RBD and six single mutations on the RBM. Although the number of single mutations
with positive binding affinity changes is less than those with negative binding affinity changes, the high
frequency of N354K slightly enhances the infectivity of SARS-CoV-2. We can notice that all of the states in
1930
RBM
Binding affinity changes (kcal/mol) 0.7
0.6
25
0.5 A344S
20
0.4 A520S
Frequency
A348S
0.3 15 A348T N354K
0.2
10
0.1
0.0 5 V483A
0.1
0
G476S
S
S
T
4K
6S
A
S
48
44
48
20
83
47
35
A3
A3
A3
A5
V4
G
N
Figure 17: Cluster A. Left: binding affinity changes ∆∆G (kcal/mol) induced by mutations in Cluster V. Right: mutations on the
SARS-CoV-2 S protein RBD.
the Table 1 are associated with Cluster B. Additionally, a large proportion of single mutations in Cluster B
are in CA, LA, MN, MI, NY, and WA.
6
0.6
RBM 5
P384S
Binding affinity changes (kcal/mol)
0.5 P384L
A522S
S359N
0.4
4
Frequency
0.3 A520S
3 N354K
0.2 Q414E
P463S
2
0.1
0.0 F490L R457K
1
0.1
0
G476S P479L
S3 K
P3 N
P3 L
Q S
R4 E
G S
P4 K
T4 S
P4 A
F4 L
A5 L
A5 S
S
84
79
90
4
84
63
6
20
22
4
57
78
59
41
47
35
T478A
N
Figure 18: Cluster B. Left: binding affinity changes ∆∆G (kcal/mol) induced by mutations in Cluster B. Right: mutations on the
SARS-CoV-2 S protein RBD.
2.3.3 Cluster C infectivity
Figure 19 describes the binding affinity changes in Cluster C. This is the only cluster that has more infectivity-
weakening RBD mutations. To be noted, A475V on the RBM has a negative binding affinity change with a
relatively high frequency compared to the other 3 mutations in Cluster C. However, only four mutations are
detected in the SNP variants that belong to Cluster C, indicating that Cluster C has a limited proportion of
the infected patients in the United States. Our conjecture is confirmed by Table 1. Although 20 states are in-
20volved in Cluster C except for NM, fewer samples related to the mutations in Cluster C are found compared
to the other three clusters. This means the infectivity-weakening mutations do not rapidly spread across
the United States. However, CA and WI have slightly more significant number of samples, indicating that
the recent situation in these states is better than the other states.
6 V367F
1.0 RBM
Binding affinity changes (kcal/mol)
5
0.8
0.6 4
V395I
Frequency
0.4
3
0.2 Q414E
2
0.0
0.2
1
0.4
0 A475V
F
I
4E
V
95
67
75
41
V3
V3
A4
Q
Figure 19: Cluster C. Left: binding affinity changes ∆∆G (kcal/mol) induced by mutations in Cluster C. Right: mutations on the
SARS-CoV-2 S protein RBD.
2.3.4 Cluster D infectivity
The binding affinity changes of RDB mutations in Cluster D are illustrated in Figure 20. Eighteen different
single mutations are classified in Cluster D. Among them, nine mutations have positive binding affinity
changes and relatively higher frequencies, showing that overall the mutations in Cluster D can enhance
the transmission capacity of SARS-CoV-2. From Table 1, we can see that R346K, A348T, and N354K have
relatively high binding affinity changes. In addition, R403K has the highest frequency among the nine
infectivity-strengthen mutations. From Table 1, all of these 20 states have a large proportion in Cluster D,
suggesting that the infectivity-strengthen mutations are widely spreading in the United States, especially
in CA, MN, NY, WA, and WI.
Finally, since the infectivity-strengthening D614G mutation is associated with all clusters and essentially
all the US genome isolates, it may be quite reasonable to say all of the US SARS-CoV-2 substrains become
more infectious compared with the original genome collected on December 24, 2019 in China.
3 Methods
3.1 Data collection and pre-processing
On January 5, 2020, the complete genome sequence of SARS-CoV-2 was first released on the GenBank
(Access number: NC 045512.2) submitted Zhang’s group at Fudan University [4]. Since then, there has been
a rapid accumulation of SARS-CoV-2 genome sequences. In this work, 24,715 complete genome sequences
with high coverage of SARS-CoV-2 strains from the infected individuals in the world were downloaded
21You can also read