Advanced glycation endproducts, dityrosine and arginine transporter dysfunction in autism - a source of biomarkers for clinical diagnosis ...
←
→
Page content transcription
If your browser does not render page correctly, please read the page content below
Anwar et al. Molecular Autism (2018) 9:3
DOI 10.1186/s13229-017-0183-3

 RESEARCH                                                                                                                                        Open Access

Advanced glycation endproducts,
dityrosine and arginine transporter
dysfunction in autism - a source of
biomarkers for clinical diagnosis
Attia Anwar1†, Provvidenza Maria Abruzzo2,4†, Sabah Pasha1, Kashif Rajpoot3, Alessandra Bolotta2,4,
Alessandro Ghezzo2, Marina Marini2,4, Annio Posar5,6, Paola Visconti5, Paul J. Thornalley1,7 and Naila Rabbani1,7,8*

  Abstract
  Background: Clinical chemistry tests for autism spectrum disorder (ASD) are currently unavailable. The aim of this
  study was to explore the diagnostic utility of proteotoxic biomarkers in plasma and urine, plasma protein glycation,
  oxidation, and nitration adducts, and related glycated, oxidized, and nitrated amino acids (free adducts), for the
  clinical diagnosis of ASD.
  Methods: Thirty-eight children with ASD (29 male, 9 female; age 7.6 ± 2.0 years) and 31 age-matched healthy
  controls (23 males, 8 females; 8.6 ± 2.0 years) were recruited for this study. Plasma protein glycation, oxidation, and
  nitration adducts and amino acid metabolome in plasma and urine were determined by stable isotopic dilution
  analysis liquid chromatography-tandem mass spectrometry. Machine learning methods were then employed to
  explore and optimize combinations of analyte data for ASD diagnosis.
  Results: We found that children with ASD had increased advanced glycation endproducts (AGEs), Nε-carboxymethyl-
  lysine (CML) and Nω-carboxymethylarginine (CMA), and increased oxidation damage marker, dityrosine (DT), in plasma
  protein, with respect to healthy controls. We also found that children with ASD had increased CMA free adduct in plasma
  ultrafiltrate and increased urinary excretion of oxidation free adducts, alpha-aminoadipic semialdehyde and glutamic
  semialdehyde. From study of renal handling of amino acids, we found that children with ASD had decreased renal
  clearance of arginine and CMA with respect to healthy controls. Algorithms to discriminate between ASD and healthy
  controls gave strong diagnostic performance with features: plasma protein AGEs—CML, CMA—and 3-deoxyglucosone-
  derived hydroimidazolone, and oxidative damage marker, DT. The sensitivity, specificity, and receiver operating
  characteristic area-under-the-curve were 92%, 84%, and 0.94, respectively.
  (Continued on next page)

* Correspondence: n.rabbani@warwick.ac.uk
†
 Equal contributors
1
 Warwick Medical School, University of Warwick, Clinical Sciences Research
Laboratories, University Hospital, Coventry, UK
7
 Zeeman Institute for Systems Biology & Infectious Disease Epidemiology
Research, Senate House, University of Warwick, Coventry CV4 7AL, UK
Full list of author information is available at the end of the article

                                        © The Author(s). 2018 Open Access This article is distributed under the terms of the Creative Commons Attribution 4.0
                                        International License (http://creativecommons.org/licenses/by/4.0/), which permits unrestricted use, distribution, and
                                        reproduction in any medium, provided you give appropriate credit to the original author(s) and the source, provide a link to
                                        the Creative Commons license, and indicate if changes were made. The Creative Commons Public Domain Dedication waiver
                                        (http://creativecommons.org/publicdomain/zero/1.0/) applies to the data made available in this article, unless otherwise stated.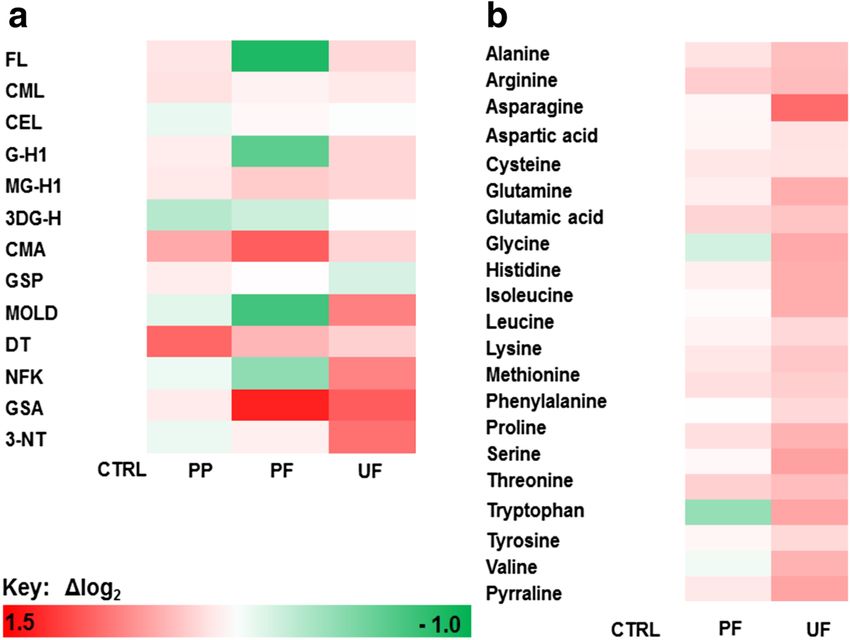
Anwar et al. Molecular Autism (2018) 9:3                                                                           Page 2 of 16

 (Continued from previous page)
 Conclusions: Changes in plasma AGEs were likely indicative of dysfunctional metabolism of dicarbonyl metabolite
 precursors of AGEs, glyoxal and 3-deoxyglucosone. DT is formed enzymatically by dual oxidase (DUOX); selective increase
 of DT as an oxidative damage marker implicates increased DUOX activity in ASD possibly linked to impaired gut mucosal
 immunity. Decreased renal clearance of arginine and CMA in ASD is indicative of increased arginine transporter activity
 which may be a surrogate marker of disturbance of neuronal availability of amino acids. Data driven combination of these
 biomarkers perturbed by proteotoxic stress, plasma protein AGEs and DT, gave diagnostic algorithms of high sensitivity
 and specificity for ASD.
 Keywords: Autism spectrum disorder (ASD), Advanced glycation endproducts (AGEs), Oxidative stress, Amino acid
 metabolome, Machine learning

Background                                                       and saccharide derivatives. Protein glycation adducts are
Autism spectrum disorders (ASD) are defined as develop-          classified as early stage glycation adducts—such as Nε-fruc-
mental disorders mainly affecting social interactions and        tosyl-lysine (FL) residues formed by glycation of proteins by
range of interests and causing a wide spectrum of other          glucose—and late-stage adducts, advanced glycation end-
disabilities, such as speech disturbances, repetitive and/or     products (AGEs)—such as Nε-carboxymethyl-lysine (CML)
compulsive behaviors, hyperactivity, anxiety, and difficulty     and glucosepane (GSP) residues—formed by the degrad-
to adapt to new environments, with or without cognitive          ation of FL residues, hydroimidazolones G-H1, MG-H1,
impairment [1]. The high heterogeneity of the clinical           and 3DG-H formed by the modification of arginine resi-
presentation makes diagnosis of ASD difficult and uncer-         dues by glyoxal, MG and 3-DG, respectively, Nω-carboxy-
tain, particularly at the early stages of development. Dis-      methylarginine (CMA)—also formed by the reaction of
covery and development of robust biomarkers for                  glyoxal with arginine residues, and methylglyoxal-derived
diagnosis and progression of severity of ASD is expected         lysine crosslink (MOLD). Protein oxidation occurs by the
to facilitate earlier diagnosis and intervention. It will also   reaction of proteins with reactive oxygen species (ROS) and
likely reveal new causative factors [2, 3]. In particular, al-   is increased in oxidative stress. Examples of protein oxida-
teration in the metabolome and specific damaging bio-            tion adducts are dityrosine (DT), N-formylkynurenine
chemical modifications may reveal the presence of a              (NFK), α-aminoadipic semialdehyde (AASA), and glutamic
shared metabolic impairment in children with an other-           semialdehyde (GSA) residues. Oxidative stress has been im-
wise highly heterogeneous background, thus shedding              plicated as a contributory factor in the development of
some light on the etiopathogenesis of ASD. Genetic causes        ASD [10–12]. Increased oxidative damage associated with
of ASD are evident in about 30–35% of cases. For the             oxidative stress and neuroinflammation may be common
remaining 65–70% of patients, it is generally agreed that        features of ASD in children. Protein nitration occurs by the
ASD results from the combination of environmental fac-           reaction of proteins with reactive nitrogen species such as
tors with multiple de novo mutations, copy number vari-          peroxynitrite. The main adduct formed by protein nitration
ation, and rare genetic variants, each possibly lending to       is 3-nitrotyrosine (3-NT) residues (Fig. 1). Increased protein
additive effects. Environmental factors may also be in-          damage by these mechanisms may lead to activation of the
volved and reflected in epigenetic modifications [4]. Tran-      UPR to counter the proteotoxic threat and related inflam-
scriptomic, proteomic, and metabolomic profiling have            matory response [13, 14].
been proposed for diagnosis of ASD, with diagnostic per-            Glycated, oxidized, and nitrated proteins undergo prote-
formance judged by area under-the-curve of receiver oper-        olysis to form related glycated, oxidized, and nitrated
ating characteristic (AUROC) plot of 0.73–0.91 [5–7]. It is      amino acids—also called glycation, oxidation, and nitration
expected that improved diagnostic performance may be             free adducts. Glycated, oxidized, and nitrated amino acids
achieved with a relatively small number of biomarker ana-        are released into plasma and are excreted in urine. Urinary
lytes linked to the pathogenic mechanism of ASD.                 excretion of glycation, oxidation, and nitration free adducts
   Impairment of protein homeostasis leading to proteotoxic      are approximate measures of whole body fluxes of protein
stress and activation of the unfolded protein response           glycation, oxidation, and nitration, respectively. There are
(UPR) has been implicated in ASD [8]. Drivers of impaired        also minor contributions to the pool of these metabolites
protein quality are increased spontaneous modifications by       by direct glycation, oxidation, and nitration of amino acids
glycation, oxidation, and nitration [9]. Glycation of proteins   and absorption from food after digestion of damaged pro-
occurs by spontaneous reaction of proteins with glucose,         teins therein [9]. Insight into renal handling of amino acids
reactive dicarbonyl metabolites, glyoxal, methylglyoxal          by the kidney is gained by deducing the renal clearance
(MG), and 3-deoxyglucosone (3-DG), and other saccharides         (CL) of amino acids from plasma to urine. For low
Anwar et al. Molecular Autism (2018) 9:3                                                                                          Page 3 of 16

 Fig. 1 Protein glycation, oxidation, and nitration free adducts. Ionization status at physiological pH is shown. For related adduct residues
 of proteins, alpha-amino-NH+3 and terminal carboxylate –CO−2 groups are moieties of as peptide bonds –NH–CO– with amino acid residues
 immediately before and after in the peptide backbone

molecular weight metabolites such as amino acids, CL is                  glycation, oxidation, and nitration adducts in plasma
mainly influenced by renal tubule reuptake of amino acids                protein and related free adducts in plasma and urine of
mediated by amino acid membrane transporters. ASD has                    children with ASD and healthy controls. We also quan-
been previously associated with homozygous mutations in                  tify the conventional plasma amino acid metabolome
gene solute carrier family 7, member 5 (SLC7A5) which                    [16] and CL of glycation, oxidation, and nitration free
encodes the large neutral amino acid transporter subunit-1               adducts and unmodified amino acids. We then explore
(hLAT-1); and in males, with rare holomorphic variants of                the diagnostic potential of these biomarkers by develop-
cationic amino acid transporter-3 (CAT-3) mediating up-                  ment of diagnostic algorithms with optimum combina-
take of arginine, ornithine, and lysine. These transporters              tions of analyte features. We found evidence of increase
mediate amino acid uptake into the cells, including neu-                 of selected plasma protein AGEs and DT in children
rons [15].                                                               with ASD and also decreased CL of arginine and CMA.
  In this study, we explore the association of proteotoxic               These findings implicate a disturbance of metabolism of
damage with ASD by quantifying levels of protein                         dicarbonyl precursors of AGEs and activation of dual
Anwar et al. Molecular Autism (2018) 9:3                                                                                    Page 4 of 16

oxidase (DUOX) in ASD. The initial evidence given                         study were not taking any medication. TD children were
herein suggests combination of plasma protein AGE and                     recruited in the local community, with no sign of cogni-
DT levels may provide a blood-based test for diagnosis                    tive, learning, and psychiatric involvement. They were at-
of ASD. Decreased CL of arginine and CMA is proposed                      tending mainstream school and had not been subjected to
to be linked to amino acid transporter dysfunction in                     stressful events. Dietary habits were assessed by a Food
ASD, building on increasing evidence of neuronal amino                    Questionnaire, built according to the guidelines issued by
acid availability as a driver in ASD development.                         the Emilia-Romagna Health Authority. No ASD child was
                                                                          on a diet free of gluten or casein. Both patients and con-
Methods                                                                   trols were on a typical Mediterranean diet, as defined by
Subject recruitment                                                       the prevalence of both simple and complex carbohydrates,
A total of 69 children were recruited. Of these, 38 had a                 use of olive oil, and plenty of fruit [21]. The consumption
diagnosis of ASD (29 males and 9 females) and 31 were                     of vegetables was less than desirable in both patients and
classified as typically developing (TD) children (23 males                controls, although vegetable intake was more limited in
and 8 females)—Fig. 2. The age of the two subject groups                  ASD patients. Demographic and clinical features of ASD
was not significantly different. Subject age was as follows:              are summarized in Table 1. All subjects were recruited at
ASD group, 7.6 years ±2.0 years, range 5–12 years and TD                  the Child Neurology and Psychiatry Unit of the Bellaria
group, 8.6 ± 2.0 years, range 5–12 years. All ASD subjects                Hospital of Bologna, Bologna, Italy.
received a diagnosis of ASD by two child development ex-
perts at the Child Neurology and Psychiatry Unit of the                   Blood and urine sampling
Bellaria Hospital of Bologna (IRCCS Institute of Neuro-                   Blood was withdrawn in the morning from fasting
logical Sciences), according to the Diagnostic and Statis-                children. Spot urine samples were the first ones in the
tical Manual of Mental Disorders V (DSM 5 [1] criteria,                   morning. Blood samples were collected using
Autism Diagnostic Observation Schedule (ADOS) [10],                       ethylenediaminetetra-acetic acid (EDTA) as anticoagu-
Childhood Autism Rating Scale (CARS) [17] and charac-                     lant. Plasma and blood cells were separated immediately
teristics of onset pattern of ASD defined according to                    by centrifugation (2000g, 10 min) and plasma samples
Ozonoff et al. [18]. Developmental and cognitive levels                   stored at − 80 °C until analysis and transferred between
were assessed by Psychoeducational Profile-3 (PEP-3) [19]                 collaborating laboratories on dry ice.
and Leiter International Performance Scale–Revised (Lei-
ter-R) [20]. For both ASD and TD subjects, exclusion cri-                 Assay of markers of protein glycation, oxidation, and
teria were presence of inflammatory or infective disease                  nitration
and taking antioxidant supplements at the time of study.                  The content of glycated, oxidized, and nitrated adduct res-
No subject underwent any surgery intervention in the                      idues in plasma protein was quantified in exhaustive en-
4 months prior to blood and urine collection. None of the                 zymatic digests by stable isotopic dilution analysis liquid
ASD subjects had active epilepsy at the time of blood and                 chromatography-tandem mass spectrometry (LC-MS/
urine sampling. Subjects with ascertained medical and                     MS), with correction for autohydrolysis of hydrolytic en-
neurological comorbidity were excluded, through a med-                    zymes [22]. The concentrations of related glycated, oxi-
ical work up including electroencephalography (recorded                   dized, and nitrated amino acids related free adducts
during awake and sleep), cerebral magnetic resonance im-                  (glycated, oxidized, and nitrated amino acids) in plasma
aging, standard clinical and neurological examination,                    and urine were determined similarly in plasma and urine
neurometabolic, and genetic investigations (including                     ultrafiltrate, respectively. Ultrafiltrate of plasma (50 μL)
comparative genomic hybridization array, molecular assay                  was collected by microspin ultrafiltration (10 kDa cut-off)
for Fragile X and MECP2). Subjects recruited for this                     at 4 °C. Retained protein was diluted with water to 500 μL
                                                                          and washed by 4 cycles of concentration to 50 μL and di-
                                                                          lution to 500 μL with water over the microspin ultrafilter
                                                                          at 4 °C. The final washed protein (100 μL) was delipidated
                                                                          and hydrolysed enzymatically as described [22, 23]. Ultra-
                                                                          filtrate of urine (50 μL) was collected by microspin ultrafil-
                                                                          tration (3 kDa cut-off) at 4 °C.
                                                                             Protein hydrolysate (25 μL, 32 μg equivalent) or ultra-
                                                                          filtrate (5 μL) was mixed with stable isotopic standard
                                                                          analytes (amounts as given previously [24]) and analyzed
                                                                          by LC-MS/MS using an Acquity™ UPLC system with a
 Fig. 2 Training and validation subject groups of diagnostic algorithms
                                                                          Xevo-TQS tandem mass spectrometer (Waters, Man-
 for detection of autistic spectrum disorder
                                                                          chester, UK). Samples are maintained at 4 °C in the
Anwar et al. Molecular Autism (2018) 9:3 Page 5 of 16
Table 1 Demographic and clinical features of the autistic children group
No Age Gender ADOS CARS CARS activity CARS body CARS Autism Cognitive/ Onset Probability of autism‡ from
(years) score total level item use item total severity developmental pattern (1, algorithm no.
score score score number level impairment early; 2,
1 2 3 4
(hyperactivity) (stereotypes) of items regressive;
with 3, mixed)†
score ≥
3
1 6.0 m 22 41.0 2.0 3.0 9 Severe Severe 1 0.93 0.79 0.82 0.80
2 5.6 m 14 34.0 2.0 2.0 2 Mild Mild 1 1.00 0.71 0.99 0.77
3 5.5 m 18 40.5 2.5 3.5 9 Severe Moderate 1 1.00 0.86 1.00 0.29
4 5.4 f 17 31.5 2.0 2.0 1 Mild Mild 3 0.88 0.69 0.55 0.27
5 8.5 m 22 36.5 2.0 2.5 6 Mild Mild 3 0.98 0.64 1.00 0.88
6 8.7 m 19 44.5 3.0 3.0 11 Severe Moderate 2 1.00 0.69 1.00 0.74
7 6.8 m 19 36.5 2.5 2.0 7 Mild Normal IQ 1 1.00 0.63 1.00 0.91
8 5.5 f 15 41.5 2.5 2.0 9 Severe Borderline IQ 1 0.73 0.77 0.72 0.92
9 11.9 m 22 44.5 2.5 3.0 11 Severe Severe 2 0.20 0.91 0.34 0.45
10 9.2 f 15 47.5 3.5 3.0 13 Severe Moderate 1 0.84 0.88 0.94 0.36
11 12.0 m 20 39.0 3.0 3.5 8 Severe Severe 3 0.94 0.68 0.82 0.63
12 6.2 m 22 42.5 3.0 2.5 10 Severe Severe 1 1.00 0.69 1.00 0.98
13 6.7 m 21 40.5 2.5 3.0 9 Severe Severe 2 0.83 0.51 0.85 0.56
14 6.6 m 19 37.0 2.5 3.0 7 Severe Moderate 1 0.83 0.63 0.74 0.97
15 5.5 m 22 40.5 3.0 3.0 9 Severe Moderate 3 0.68 0.57 0.82 0.98
16 5.7 m 20 41.5 2.5 3.0 11 severe severe 1 0.98 0.81 0.98 0.81
17 7.8 m 21 46.0 3.5 4.0 11 Severe Severe 1 0.83 0.35 0.52 0.79
18 5.7 f 20 43.5 2.5 3.0 10 Severe Normal IQ 3 0.85 0.39 0.58 0.68
19 7.8 m 20 48.5 3.0 4.0 12 Severe Severe 2 0.95 0.58 0.93 0.57
20 6.8 m 19 42.0 3.0 3.0 9 Severe Moderate 2 0.67 0.61 0.54 0.77
21 9.6 m 19 39.5 3.0 3.0 7 Severe Severe 1 0.55 0.44 0.62 0.51
22 6.2 m 19 41.0 2.5 3.0 9 Severe Severe 3 0.81 0.32 0.78 0.73
23 8.3 m 16 35.0 2.5 2.0 3 Moderate Moderate 1 0.70 0.35 0.63 0.56
24 7.1 m 22 41.0 2.5 2.0 7 Severe Moderate 1 0.83 1.00 0.99 1.00
25 6.2 f 17 38.0 2.0 2.5 7 Severe Severe 1 0.28 0.82 0.15 0.79
26 10.3 f 21 33.5 2.0 2.0 4 Moderate Normal IQ 3 0.89 0.55 0.82 0.86
27 10.7 m 19 39.0 2.0 2.5 7 Moderate Normal IQ 1 0.89 0.60 0.97 0.52
28 6.5 m 17 39.0 3.0 2.5 6 Moderate Normal IQ 3 ND ND ND 0.76
29 8.0 m 22 44.0 2.5 3.0 11 Severe Moderate 1 ND ND ND 0.54
30 7.0 m 18 39.5 2.5 3.0 8 Moderate Normal IQ 1 ND ND ND 0.96
31 9.5 m 21 47.0 3.0 3.5 13 Severe Severe 1 ND ND ND 0.29
32 8.6 m 16 41.5 4.0 2.0 10 Severe Moderate 3 ND ND ND 0.33
33 10.9 m 18 35.0 2.0 3.0 3 Mild Normal IQ 1 ND ND ND 0.28
34 5.8 f 18 43.0 2.5 3.0 11 Severe Moderate 2 ND ND ND 0.30
35 5.3 f 17 39.5 2.5 2.5 6 Moderate Normal IQ 1 ND ND ND 0.62
36 5.3 f 17 41.0 2.5 2.5 7 Severe Normal IQ 1 ND ND ND 0.77
37 8.2 m 20 41.0 2.0 3.5 9 Severe Moderate 1 ND ND ND 0.58
38 11.1 m 13 34.0 2.0 1.5 2 Mild Normal IQ 3 ND ND ND 0.87
†Onset pattern was defined according to Ozonoff et al. [18]
‡Probability the subject has autism estimated from diagnostic algorithms derived from experimental biomarker data—see Table 7Anwar et al. Molecular Autism (2018) 9:3 Page 6 of 16
autosampler during batch analysis. The columns were for performance: random forests, logistic regression, en-
2.1 × 50 mm and 2.1 mm × 250 mm, 5 μm particle size semble classifier, and support vector machines (SVMs)
Hypercarb™ (Thermo Scientific), in series with pro- [26–28]. During the algorithm training, we used the
grammed switching, at 30 °C. Chromatographic reten- complete panel of protein glycation, oxidation, and ni-
tion was necessary to resolve oxidized analytes from tration adducts as features and developed algorithms for
their amino acid precursors to avoid interference from each analyte type: plasma protein adduct residues,
partial oxidation of the latter in the electrospray plasma free adducts, and urinary free adducts. For the
ionization source of the mass spectrometric detector. latter two, unmodified amino acids were also included as
Analytes were detected by electrospray positive features. The aim during the training was to select the
ionization and mass spectrometry multiple reaction set of features that accomplishes the highest perform-
monitoring (MRM) mode where analyte detection re- ance. The machine learning experiments initially ex-
sponse was specific for mass/charge ratio of the analyte plored using all metabolite features. Subsequent
molecular ion and major fragment ion generated by selection of a subset of discriminant biomarker features
collision-induced dissociation in the mass spectrometer improved the algorithm performance. For the biomarker
collision cell. The ionization source and desolvation gas selection, we used a sequential feature selection ap-
temperatures were 120 and 350 °C, respectively; cone proach. The biomarker feature selection and classifier
gas and desolvation gas flow rates were 99 and 900 L/h; selection were made on the basis of algorithm perform-
and the capillary voltage was 0.60 kV. Argon gas (5.0 × ance defined by classification accuracy, sensitivity, speci-
10−3 mbar) was in the collision cell. For MRM detection, ficity, area under-the-curve of the receiver operating
molecular ion and fragment ion masses and collision en- characteristic curve (AUROC), positive likelihood ratio,
ergies optimized to ± 0.1 Da and ± 1 eV, respectively, negative likelihood ratio, positive predictive value, nega-
were programmed [22]—Additional file 1: Table S1. tive predictive value, and F-measure. For each perform-
Analytes determined were glycation adducts—FL, and ance metric, the mean and 95% CI was determined and
AGEs, CML, Nε-(1-carboxyethyl)lysine (CEL), pyrraline, reported. The algorithm training and testing was re-
CMA, G-H1, MG-H1, 3DG-H, MOLD and GSP; oxida- peated 10 times, without altering the algorithm parame-
tion adducts—DT, NFK, AASA, GSA; nitration adduct, ters, with 50% data split, to test for algorithm’s
3-NT; and all major amino acids. Oxidation, nitration, robustness against any bias towards data split. We devel-
and glycation adduct residues are normalized to their oped our computer programs using Statistics and Ma-
amino acid residue precursors and given as millimoles/ chine Learning Toolbox of MATLAB® (MathWorks,
mole amino acid modified, and related free adducts are Inc., Natick, USA), with a linear kernel SVM and se-
given in nanomolar. Chemical structures and biochem- quential minimal optimization (SMO).
ical and clinical significance of these analytes have been
described elsewhere [9, 25]. Renal clearance (CL) of gly- Statistical analysis
cation, oxidation, and nitration free adducts and un- Data are presented as mean ± SD for parametric distribu-
modified amino acids was deduced from plasma and tions and median (lower–upper quartile) for non-
spot urine collections: CL (μL/mg creatinine or mL/mg parametric distributions. The test for normality of data
creatinine) = [analyte]Urine (nmol/mg creatinine)/[analy- distribution applied was the Kolmogorov–Smirnov test.
te]Plasma (pmol/mL or nmol/mL). Significance was evaluated by Student’s t test or by
Mann–Whitney U test for parametrically or non-
Machine learning analysis parametrically distributed data, respectively. Bonferroni
The objective was to distinguish between children with correction was made for analysis of multiple analytes
ASD and healthy controls. In all cases, the diagnostic al- without preconceived hypothesis. Correlation analysis was
gorithms were trained on 50% of the cases and controls performed by Spearman’s rho method with continuous
(training subset) before being used to predict the disease variables. For clinical categorical variables with ≥ 6 cat-
class for each sample in the remaining subjects (test set), egories, Spearman correlation was performed—assuming
twofold cross-validation. The outcome was to assign, for approximation to a continuous variable [29]; for other cat-
each test set sample, a set of probabilities corresponding egorical variables, significance of difference of biomarker
to each of the ASD/control groups—the group assign- data distributions between categories was assessed by one-
ment being that for which the probability is highest. Test way ANOVA for parametric data and Kruskal—Wallis H
data were held separate from algorithm training; algo- test. Data were analyzed using SPSS, version 24.0.
rithm settings were not adjusted once we began to For power analysis in the study design, we chose the
analyze the test set data—thereby guarding against over- level of the irreversible oxidative damage marker DT in
fitting and hence providing a rigorous estimate of pre- plasma protein. In healthy human subjects, plasma pro-
dictive performance. Four algorithm types were tested tein DT was 0.0287 ± 0.0027 mmol/mol tyr (n = 29) inAnwar et al. Molecular Autism (2018) 9:3 Page 7 of 16
previous studies [30]. We designed our study to detect a multiple analytes (Table 2). In correlation analysis, highly
50% increase in plasma protein DT at the 0.01% signifi- significant positive correlations (P < 0.01, Spearman) were
cance level, for which ≥ 18 case and control samples of CML with DT, G-H1 with MG-H1 and DT, MG-H1
were required. Post hoc analysis revealed an 88% in- with CMA, CMA with DT, and AASA with GSA—Addi-
crease with P = 0.00017, after Bonferroni correction of tional file 1: Table S2. No correlation or association of gly-
14, 15 or 20 as appropriate with 27 cases and 21 con- cation, oxidation, and nitration adduct residues was found
trols, suggesting the study was adequately powered for with demographic and clinical features. There was no sig-
this key target analyte. nificant difference of these variables between subject
groups of different genders with and without ASD.
Results
Children with autistic spectrum disorder recruited for this Plasma glycated, oxidized, and nitrated amino acids and
study amino acid metabolome
Thirty-eight children with ASD were recruited for this For glycated, oxidized, and nitrated amino acid concen-
study. The distribution of severity of ASD in this subject tration in plasma, FL, G-H1, and NFK were decreased
group recruited was (number of cases) mild (6), moder- whereas CMA, AASA, and GSA were increased in chil-
ate (6), and severe (26). The distribution of cognitive/de- dren with ASD, with respect to healthy controls. Only
velopmental impairment was (number of cases) normal/ increase in CMA remained significant after Bonferroni
borderline IQ (11), mild (3), moderate (12), and severe correction (Table 3). In correlation analysis, highly sig-
(12). The distribution of onset pattern of ASD was nificant positive correlations were of pyrraline with MG-
(number of cases) early (22), regressive (6), and mixed H1 and 3DG-H, FL with CML, G-H1 and MG-H1, CEL
(10). The ADOS score ranged from 13 to 22 and the with MG-H1 and CMA, MG-H1 with 3DG-H, and
CARS total score from 31.5 to 48.5. CMA with AASA. There were highly significant negative
correlations of pyrraline with NFK, CMA with MOLD,
Plasma protein glycation, oxidation, and nitration and MOLD with AASA—Additional file 1: Table S3.
In plasma protein, protein content of AGEs—CML, MG- For the conventional amino acid metabolome, there
H1 and CMA—were increased in children with ASD, with were increases in arg, gln, glu, and thr and decrease
respect to healthy controls, whereas plasma protein con- in trp in children with ASD, with respect to healthy
tent of AGE, 3DG-H, was decreased in children with controls. None of these changes remained significant
ASD, with respect to healthy controls. Plasma protein after Bonferroni correction (Table 4). There were
content of the oxidative damage adduct, DT, was in- many highly significant positive correlations between
creased in children with ASD, with respect to healthy con- plasma amino acid concentrations—Additional file 1:
trols. Only changes in CML, CMA, and DT remained Table S4. No correlation or association of glycation,
significant after Bonferroni correction for measurement of oxidation, and nitration free adducts and amino acids
Table 2 Glycation, oxidation, and nitration adduct residue content of plasma protein
Glycation markers Healthy controls ASD P value
FL (mmol/mol lys) 1.27 ± 0.39 1.41 ± 0.53 NS
CML (mmol/mol lys) 0.158 ± 0.026 0.190 ± 0.038 0.0018*
CEL (mmol/mol lys) 0.117 ± 0.044 0.092 ± 0.054 NS
G-H1 (mmol/mol arg) 0.012 ± 0.005 0.016 ± 0.011 NS
MG-H1 (mmol/mol arg) 0.473 ± 0.074 0.535 ± 0.100 0.021
3DG-H (mmol/mol arg) 0.165 ± 0.037 0.138 ± 0.027 0.0052
CMA (mmol/mol arg) 0.054 (0.043–0.067) 0.077 (0.066–0.101) 0.000082**
MOLD (mmol/mol lys) 0.027 ± 0.011 0.025 ± 0.016 NS
GSP (mmol/mol lys) 0.514 ± 0.111 0.571 ± 0.206 NS
DT (mmol/mol tyr) 0.025 (0.019–0.031) 0.047 (0.035–0.094) 0.000012***
NFK (mmol/mol trp) 15.6 ± 1.7 15.0 ± 1.5 NS
AASA (mmol/mol lys) 0.154 ± 0.048 0.152 ± 0.081 NS
GSA (mmol/mol arg) 0.639 ± 0.327 0.713 ± 0.350 NS
3-NT (mmol/mol tyr) 0.0056 (0.0045–0.0069) 0.0053 (0.0045–0.0064) NS
Data are median (lower–upper quartile); healthy controls, n = 21, and ASD, n = 27. Significance (Mann–Whitney U)
*P < 0.05, **P < 0.01, and ***P < 0.001 after Bonferroni correction of 14 appliedAnwar et al. Molecular Autism (2018) 9:3 Page 8 of 16
Table 3 Plasma and urinary glycation, oxidation, and nitration free adduct in plasma filtrate
Amino Plasma (nM) Urine (nmol/mg creatinine)
acid
Healthy controls ASD P value Healthy controls ASD P value
FL 1489 (987–1863) 751 (361–1.570) 0.047 56.7 (33.8–128.7) 90.8 (42.4–167.9)
CML 807 (587–1051) 853 (219–1222) 26.2 (19.7–34.7) 33.1 (26.6–42.6) 0.016
CEL 402 (298–477) 420 (310–599) 0.435 (0.202–0.848) 0.472 (0.180–0.940)
G-H1 0.819 (0.553–1.26) 0.527 (0.366–0.959) 0.037 1.88 (1.11–3.04) 2.57 (1.53–3.75) 0.024
MG-H1 271 (176–475) 335 (213–500) 18.6 (8.00–27.4) 24.5 (9.14–37.6)
3DG-H 413 (303–637) 360 (280–434) 2.06 (0.587–4.38) 2.92 (1.09–6.26)
CMA 9.18 (6.67–12.5) 17.7 (13.2–24.8) 0.00052** 1.46 (0.636–1.97) 1.78 (1.14–2.91) 0.037
GSP 12.8 (7.4–17.1) 12.9 (9.3–22.0) 1.58 (1.15–1.98) 1.53 (1.20–1.98)
MOLD 1.79 (0.800–3.42) 1.10 (0.503–0.2.21) 0.025 (0.013–0.050) 0.040 (0.017–0.068) 0.027
Pyrraline 22.0 (12.2–30.4) 24.2 (19.4–40.6) 20.6 (14.9–44.2) 34.2 (22.7–72.5) 0.047
DT 0.501 (0.286–0.771) 0.676 (0.500–0.847) 0.070 (0.058–0.085) 0.086 (0.075–0.109) 0.0022*
NFK 15.2 (12.5–18.1) 11.3 (6.23–14.3) 0.030 0.117 (0.084–0.231) 0.179 (0.107–0.238) 0.037
AASA 19.7 (16.9–29.1) 30.6 (21.1–46.4) 0.0063 1.08 (0.805–2.76) 1.80 (1.13–2.89) 0.040
GSA 73.9 (53.2–129) 109 (80.1–203) 0.039 17.3 (13.2–22.7) 34.5 (12.7–48.0) 0.0018*
3-NT 1.10 (0.90–1.26) 1.17 (0.79–1.58) 0.0044 (0.001–0.010) 0.0077 (0.003–0.014)
Data are median (lower – upper quartile); healthy controls, n = 21–31, and ASD, n = 27–38. Significance (Mann-Whitney U)
*P < 0.05 after Bonferroni correction of 15 applied
Table 4 Plasma and urinary amino acid metabolome
Amino Plasma (μM) Urine (nmol/mg creatinine)
acid
Healthy controls ASD P value Healthy controls ASD P value
Ala 294 ± 71.5 330 ± 98.3 301 (224–432) 392 (305–533) 0.030
Arg 39.4 ± 10.3 48.4 ± 16.6 0.016 52.1 ± 17.1 64.0 ± 18.0 0.014
Asn 33.2 ± 4.57 34.3 ± 10.6 92.4 (72.1–132) 169 (123–236) 0.0012*
Asp 35.5 ± 7.37 37.0 ± 10.0 142 (112–179) 160 (117–241)
Cys (total) 41.7 ± 10.4 46.1 ± 15.0 25.3 (20.4–35.9) 28.3 (21.1–43.3)
Gln 463 ± 38.6 496 ± 61.2 0.024 529 (452–704) 741 (609–876) 0.0048
Glu 1672 ± 324 1999 ± 619 0.034 373 (254–495) 475 (367–690) 0.010
Gly 272 (187–1061) 241 (121–515) 1.12 (1.19–2.78) 2.58 (1.84–3.45) 0.019
His 68.0 ± 8.51 72.8 ± 9.96 2.19 ± 0.88 2.90 ± 1.21 0.027
IIe 50.7 ± 15.3 51.6 ± 12.4 13.0 ± 4.37 18.1 ± 6.50 0.0059
Leu 126 ± 34.4 132 ± 25.6 43.1 ± 13.6 52.0 ± 13.5 0.028
Lys 132 ± 20.3 146 ± 36.7 136 (83.3–264) 171 (117–352)
Met 23.1 ± 6.41 26.2 ± 5.84 17.9 ± 7.98 23.1 ± 7.20 0.0037
Phe 68.9 ± 11.3 68.8 ± 16.8 101 ± 38.9 110 ± 32.9
Pro 195 ± 65.4 223 ± 94.7 14.5 ± 6.21 20.7 ± 5.37 0.00073**
Ser 128 ± 23.5 132 ± 18.7 461 (413–621) 677 (519–910) 0.0021*
Thr 116 ± 36.0 141 ± 46.8 0.041 216 (170–265) 283 (221–405) 0.0039
Trp 5.22 ± 1.26 3.92 ± 2.40 0.0055 114 ± 73.6 164 ± 48.6 0.0043
Tyr 84.4 ± 21.3 87.9 ± 26.8 204 (133–255) 240 (173–317)
Val 125 ± 31.3 120 ± 26.0 25.6 ± 9.52 34.8 ± 10.9 0.00073**
Data are Mean ± SD or median (lower–upper quartile); healthy controls, n = 21, and ASD, n = 27. Significance: t test for parametric data and Mann-Whitney U for
non-parametric data
*P < 0.05 and **P < 0.01 after Bonferroni correction of 20 appliedAnwar et al. Molecular Autism (2018) 9:3 Page 9 of 16
was found with demographic and clinical features. Table 5 Renal clearance of glycation, oxidation, and nitration
There was no significant difference of these variables free adducts
between genders. Amino Renal clearance (μL/mg creatinine)
acid
Healthy controls ASD P value
Urinary glycated, oxidized, and nitrated amino acids and FL# 0.696 (0.375–1.16) 0.866 (0.384–2.31)
amino acid metabolome and renal clearance CML 0.297 (0.249–0.387) 0.259 (0.171–0.782)
For the urinary flux of glycated, oxidized, and nitrated
CEL 0.0068 (0.003–0.019) 0.0042 (0.002–0.011)
amino acids, children with ASD showed increased urin-
ary excretion of CML, G-H1, CMA, MOLD, pyrraline, G-H1 21.2 (13.1–34.7) 23.9 (15.0–57.7)
#
DT, NFK, AASA, and GSA. Only urinary excretions of MG-H1 0.718 (0.496–1.04) 0.628 (0.363–0.912)
DT and GSA remained significant after Bonferroni cor- 3DG-H 0.067 (0.033–0.163) 0.087 (0.042–0.131)
rection (Table 3). For the urinary flux of unmodified CMA 1.57 (0.997–2.08) 0.791 (0.465–1.36) 0.0011*
amino acids, children with ASD showed increased urin- GSP 0.121 (0.083–0.274) 0.112 (0.067–0.195)
ary excretion of all amino acids except asp, cys, lys, phe,
MOLD 0.214 (0.075–0.487) 0.269 (0.153–0.656)
and tyr. Only increases in urinary excretion of asn, pro,
ser, and val remained significant after Bonferroni correc- Pyrraline 0.81 (0.58–1.17) 1.07 (0.64–1.96)
tion (Table 4). There were several highly significant posi- DT 0.119 (0.657–2.02) 0.747 (0.545–0.107) 0.0025
tive correlations between urinary excretions of glycation, NFK 0.062 (0.038–0.109) 0.096 (0.049–0.139) 0.030
oxidation, and nitration adducts and amino acids—see GSA 29.9 (11.1–45.8) 17.8 (1.96–26.1)
Additional file 1: Table S5 and Table S6. 3-NT 0.068 (0.034–0.100) 0.042 (0.036–0.129)
Renal clearance of CMA, GSP, DT, arg, glu, leu, phe,
Data are mean ± SD or median (lower–upper quartile); healthy controls, n = 21,
and thr were decreased and renal clearance of NFK and and ASD, n = 27. Significance: t-test for parametric data and Mann-Whitney U
trp were increased in children with ASD, with respect to for non-parametric data
*P < 0.05, after Bonferroni correction of 14 applied
healthy controls. Only decreases in renal clearance of #
mL/mg creatinine
arg and CMA remained significant after Bonferroni cor-
rection: CLarg decreased 32% and CLCMA decreased 50% (ii)Algorithm-2, developed from plasma glycated,
in children with ASD, compared to healthy control; P < oxidized, and nitrated amino acids and conventional
0.001 (Tables 5 and 6). No correlation or association of amino acid metabolome.
these glycation, oxidation, and nitration free adduct and
amino acid variables was found with demographic and It has the following features: CML and CMA. Classifi-
clinical features. There was no significant difference of cation accuracy was 75%, sensitivity 81%, and specificity
these variables between genders. 67% and AUROC 0.80.
Changes of glycation, oxidation, and nitration adducts
and amino acid metabolome in plasma and urine are sum- (iii)Algorithm-3, developed from plasma protein
marized in heat maps (Fig. 3a, b). Data distributions of glycation, oxidation, and nitration adduct residues
biomarker with significantly different change in the ASD and plasma glycated, oxidized, and nitrated amino
study group after Bonferroni correction are given in Fig. 4. acids and conventional amino acid metabolome
combined.
Development of diagnostic algorithms for ASD
To explore diagnostic utility of protein glycation, oxidation, It has the following features: plasma protein CML,
and nitration measurements for ASD, we analyzed plasma 3DG-H, CMA and DT residues, and plasma G-H1 and
and urinary amino acid analyte data by a machine learning GSA free adducts. Classification accuracy was 89%, sen-
approach. SVMs was the best-performing method out of sitivity 90%, specificity 87%, and AUROC 0.95.
the four algorithms that were investigated. Algorithm opti-
mized from twofold cross-validation were as below. (iv)Algorithm-4, developed from urinary glycated,
oxidized, and nitrated amino acids.
(i) Algorithm-1, developed from plasma protein
glycation, oxidation, and nitration adduct residue It has the following features: GSA and pyrraline free
analytes. adducts. Classification accuracy was 77%, sensitivity
77%, specificity 76%, and AUROC 0.79 (Fig. 5, Table 7,
It has the following features: CML, 3DG-H, CMA, and Additional file 1: Table S7).
and DT. Classification accuracy was 88%, sensitivity The diagnostic algorithms were used to deduce the
92%, specificity 84%, and AUROC 0.94. A random probability of having ASD for each patient diagnosed with
outcome is 0.50. ASD by clinical symptoms (Table 1). The association andAnwar et al. Molecular Autism (2018) 9:3 Page 10 of 16
Table 6 Renal clearance of amino acids correlation of these probabilities with clinical features was
Amino Renal clearance (mL/mg creatinine) explored. No significant association or correlation of these
acid probabilities with clinical features (age, ADOS, total
Healthy controls ASD P value
Ala 1.03 (0.746–1.712) 1.27 (0.890–1.65) CARS, CARS hyperactivity and CARS body use scores,
autism severity, cognitive/developmental impairment, and
Arg 0.011 (0.009–0.015) 0.008 (0.006–0.010) 0.0019*
ASD onset pattern) was found.
Asn 2.80 (2.22–4.76) 4.30 (3.05–7.14) 0.0055
Asp 3.81 (3.04–4.96) 4.73 (2.92–7.82) Discussion
Cys (total) 0.646 (0.518–0.812) 0.629 (0.452–1.133) In this study, we identified changes in plasma protein
Gln 1.18 (0.913–1.53) 1.54 (1.14–1.96) 0.025 AGE and oxidation adducts, increased CML, CMA, and
Glu 0.210 (0.158–0.304) 0.243 (0.179–0.357 0.049 DT and decreased 3DG-H in ASD. Combined in an algo-
rithm, these features provided diagnostic performance im-
Gly 0.0050 (0.002–0.009) 0.0067 (0.004–0.029) 0.018
proved over that previously achieved in transcriptomic,
His 0.029 (0.024–0.040) 0.040 (0.027–0.053)
proteomic, and metabolomic studies [5–7]—with AUROC
IIe 0.262 (0.192–0.347) 0.354 (0.256–0.441) 0.0116 0.94 and classification efficiency 88%. This was slightly im-
Leu 0.358 ± 0.135 0.402 ± 0.105 proved by combination with plasma G-H1 and GSA free
Lys 0.011 (0.005–0.018) 0.0071 (0.005–0.011) adducts, with AUROC 0.95 and classification efficiency
Met 0.0066 ± 0.0015 0.0056 ± 0.0023 89%. This novel biomarker approach focused to protein
damage or proteotoxic stress may lead to biochemical-
Phe 1.32 (0.959–2.02) 1.65 (1.33–1.95)
based diagnosis of ASD and suggests that protein AGE
Pro 0.077 ± 0.031 0.104 ± 0.039 0.0138
and oxidation may be linked to ASD pathogenesis.
Ser 3.66 (2.95–4.79) 5.22 (3.99–6.78) 0.0081 Change in AGE and oxidation adduct content of plasma
Thr 2.023 ± 0.765 2.44 ± 1.05 proteins relates to the rate of protein modification in the
Trp 0.209 (0.155–0.242) 0.287 (0.166–0.497) 0.010 plasma compartment and, to a lesser extent, to modifica-
Tyr 0.0209 (0.016–0.025) 0.015 (0.012–0.025) tions of plasma proteins in interstitial fluid. The major
plasma protein albumin makes repeated cycles from
Val 0.0017 (0.0014–0.0022) 0.0016 (0.0013–0.0026)
plasma to interstitial fluid and lymph before degradation
Data are mean ± SD or median (lower–upper quartile); healthy controls, n = 21,
and ASD, n = 27. Significance: t test for parametric data and Mann-Whitney U [31]. CML residues in plasma protein are mainly produced
for non-parametric data by the oxidative degradation of FL with a usually minor
*P < 0.05, after Bonferroni correction of 20 applied
contribution from glycation by glyoxal. CML is also con-
sidered to be a marker of oxidative damage [32]. CMA is
Fig. 3 Heat map of changes in glycated, oxidized, and nitrated proteins and amino acids in plasma and urine of subjects with autistic spectrum
disorder. a Trace level protein glycation, oxidation, and nitration adducts. b Amino acid metabolome. Key: CTRL control, PP plasma protein
(adduct residues), PF plasma filtrate (free adducts), and UF urine filtrate (free adducts). Data are given in Tables 2, 3, 4, and 5Anwar et al. Molecular Autism (2018) 9:3 Page 11 of 16 Fig. 4 Scatter plots for protein damage biomarker variables changed in children with ASD. Protein adduct residues: a CML, b CMA, and c DT. Plasma free adduct: d CMA. Urine free adduct and amino acids: e DT, f GSA, g Asn, h Pro, i Ser, and j Val. Renal clearance: k CMA and l Arg (an outlier point, 0.0565, was excluded from the ASD data). Significance: One asterisk, two asterisks, and three asterisks indicate P < 0.05, P < 0.01, and P < 0.001, respectively produced exclusively by the glycation of proteins by subjects with ASD. DUOX expression is increased glyoxal [9]. Increased formation of glyoxal, mainly sourced through activating transcription factor 2 in inflammatory from lipid peroxidation, in ASD may explain increases in signaling [37]. DUOX has an important role in gut muco- plasma protein CML and CMA (Fig. 6a). Markers of lipid sal immunity, host–microbe homeostasis, and signaling peroxidation, plasma and red blood cell malondialdehyde, for neutrophil recruitment into allergic airways [38, 39]. urinary 8-isoprostane-F2a, and hexanoyl-lysine adduct Gut microbiota may be influential in the development of were elevated in ASD [33–35]. the behavioral phenotype in ASD children [40] (Fig. 6a). DT residue content of plasma proteins was increased in Decrease of 3DG-H content of plasma protein in subjects subjects with ASD whereas other oxidative damage with ASD likely reflects decreased concentration of plasma markers, NFK, AASA, and GSA, were not. DT residue 3-DG. 3-DG is formed by degradation of fructosamine-3- formation occurs by reaction of tyrosine residues in pro- phosphate in the repair of early glycated proteins and deg- teins with ROS and DUOX [36]. The selective increase in radation of fructose-3-phosphate formed by fructosamine- DT may suggest a role of increased DUOX activity in 3-phosphokinase [41, 42] and the slow, non-enzymatic
Anwar et al. Molecular Autism (2018) 9:3 Page 12 of 16
Fig. 5 Receiver operating characteristic plots of diagnostic algorithms for detection of autistic spectrum disorder by protein glycation and oxidation
adducts. a Algorithm-1, plasma protein adduct residues. AUROC = 0.96. b Algorithm-2, plasma free adducts. AUROC = 0.78. c Algorithm-3, plasma
protein adduct residues and free adducts. AUROC = 0.99. d Algorithm-4, urine free adducts. AUROC = 0.78. ROC plots are representative results from
one run of the classification experiment. A random outcome is AUROC = 0.50
oxidative degradation of glucose and proteins glycated by Combination of markers of oxidative metabolism,
glucose [43]. It is metabolized to 3-deoxyfructose by aldo- DNA oxidation, and methylation in multivariate statis-
keto reductases 1A4, 1B1, and 1B3 which together consti- tical models was recently found to distinguish between
tute 3-DG reductase activity [44]. Since FL residue content children with ASD and healthy controls [12]. Herein,
of subjects with ASD was unchanged, with respect to oxidative damage markers, plasma protein CML and DT
healthy controls, there is unlikely to be decreased activity of and plasma GSA free adduct, emerged as features of
fructosamine-3-phosphokinase in ASD. Rather, increased diagnostic algorithms for ASD. Measurement of multiple
3-DG reductase activity may explain decrease in plasma chemically defined markers of protein oxidative damage
protein 3DG-H residue content in ASD (Fig. 6a). in plasma and urine compartments in subjects with and
Table 7 Diagnostic algorithms developed for autistic spectrum disorder from plasma and urinary analytes
Algorithm no 1 2 3 4
Compartment and Plasma protein adduct Plasma amino Plasma protein adduct residues and amino acids Urinary amino acids
analyte residues acids
Features CML, 3DG-H, CMA, and CML and CMA CML, 3DG-H, CMA, and DT residues with G-H1 and GSA and pyrraline free
DT GSA free adducts adducts
Accuracy (%) 88.3 (85.5–91.2) 74.8 (71.7–77.9) 89.0 (87.0–91.0) 76.8 (74.6–79.0)
Sensitivity (%) 91.9 (89.1–94.6) 80.5 (75.1–86.0) 90.4 (87.7–93.1) 77.1 (73.4–80.8)
Specificity (%) 83.9 (79.3–88.4) 67.1 (58.9–75.4) 87.3 (84.1–90.5) 76.4 (72.0–80.8)
AUROC 0.94 (0.91–0.96) 0.80 (0.77–0.83) 0.95 (0.94–0.96) 0.79 (0.76–0.81)
Positive likelihood ratio 5.69 (4.49–6.89) 2.85 (2.16–3.55) 7.23 (6.09–8.38) 4.16 (2.88–5.44)
Negative likelihood 0.10 (0.07–0.13) 0.28 (0.21–0.35) 0.11 (0.08–0.14) 0.30 (0.25–0.34)
ratio
Positive predictive 88.2 (85.0–91.4) 77.1 (72.9–81.4) 90.2 (87.9–92.5) 80.6 (77.6–83.5)
value (%)
Negative predictive 89.1 (85.5–92.6) 75.0 (70.6–79.4) 88.0 (85.1–91.0) 73.7 (71.0–76.5)
value (%)
F score 0.90 (0.87–0.92) 0.78 (0.75–0.81) 0.90 (0.88–0.92) 0.78 (0.76–0.81)
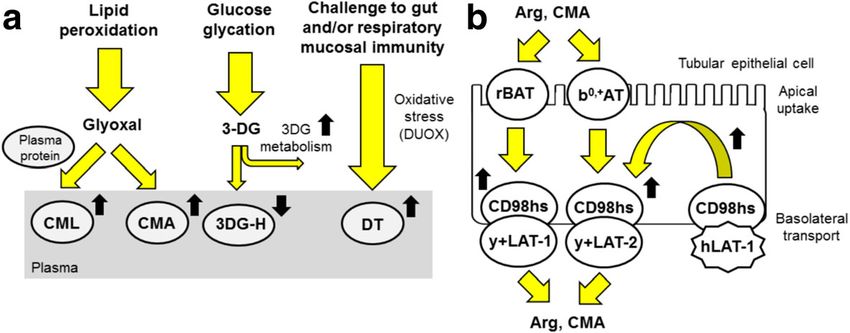
Algorithm outcomes for twofold cross-validation (10 randomized repeat trials for robustness) using SVMs (95% CI given in brackets)Anwar et al. Molecular Autism (2018) 9:3 Page 13 of 16 Fig. 6 Schematic explanation for changes found in protein damage and amino acids in ASD. a Proposed mechanism for observed changes found in plasma protein glycation and oxidation adducts. b Transport of arg and CMA across the renal tubular epithelium and proposed mechanism for increased renal CL (increased arg and CMA reuptake). Key: yellow-filled arrows show processes; black-filled arrows show changes observed (a) and changes expected (b) in ASD without ASD has provided evidence of changes specific in timed collection of urine in children [50]. Decreased to oxidative damage marker type and sample compart- CL relates to increased tubular reuptake and increased ment that likely contributed to algorithm development amino acid transporter activity. Decreased CL of arg and for ASD with improved diagnostic performance. CMA likely reflects increased reuptake of arg and CMA. For unmodified amino acids, we found no changes Arg uptake by the tubular epithelium is mediated by neu- after correction for multiple measurements in plasma tral and basic amino acid transport protein rBAT and sol- but there were significant increases in urinary excretion ute carrier 7, member 9 (b0,+AT) [apical uptake] and of asn, pro, ser, and val. This may relate to impaired tis- CD98 heavy subunit (CD98hs)/y+LAT-2 (solute carrier sue uptake and retention of these amino acids in ASD. family 7 member 6) and CD98hs/y+LAT-1 (solute carrier For modified amino acids, only increased CMA family 7 member 7) complexes [basolateral transport] [51] remained significantly increased in plasma for children and this likely mediates renal tubule uptake of arginine de- with ASD. This may relate to proteolysis of plasma pro- rivative CMA too (Fig. 6b). Homozygous mutations of teins and potentially other proteins of increased CMA SLC7A5 gene were associated with ASD. SLC7A5 encodes residue content in ASD. For modified amino acids in protein hLAT-1 which, together with CD98hs, form the urine, urinary excretions of oxidative damage markers, large neutral amino acid transporter involved in maintain- DT and GSA free adducts, were increased in children ing normal levels of brain branched chain amino acids in with ASD after correction for multiple analytes. This the brain [52]. Dysfunction of hLAT-1, also found in the may relate to proteolysis of plasma proteins and other renal tubular epithelium in complex with CD98hs [51], proteins with increased oxidative damage and DUOX- may leave the latter more available for complexation with catalyzed modification in ASD. The amino acid metabo- y+LAT-1 and y+LAT-2 and drive increased reuptake and lome in plasma and urine has been explored previously decreased CL of arginine and CMA. In addition, rare for biomarkers of ASD [7, 45–47]. We confirmed the re- holomorphic variants in males of amino acid transporter ported minor increase in plasma arg in ASD, compared CAT-3 were associated with ASD [15]. Disturbance in ar- to healthy controls, but significance was lost after cor- ginine transporter function may be a common feature of rection for multiple measurements [48]. ASD and measure of CL of arginine is an accessible bio- Pyrraline is an AGE sourced only from food [49]. In- marker of this. creased urinary pyrraline is indicative of increased food Combination of AGE and DT residue content of plasma consumption and/or permeability of the gastrointestinal protein in Algorithm-1 and this combined with G-H1 and tract to pyrraline. The positive correlation of pyrraline GSA free adducts in Algorithm-3 gave the best diagnostic with CML, MG-H1, CMA, DT, and GSA free adducts in performance for detection of ASD from the analytes de- urine suggests that increase of these free adducts may be termined herein. The absence of conventional, unmodified partly due to food consumption. amino acids from optimum features of the diagnostic al- Exploring changes in renal CL of amino acids provides gorithms suggests that assay of trace level, AGE and oxi- insight in functional activity of amino acid transporters in dised amino acid residues of plasma protein and free the renal tubular epithelium. The deduction of CL herein adducts in plasma provides a diagnostic advantage which was an indirect measure based on estimates of urinary an- has not been hitherto explored. It also suggests that AGE alyte/creatinine ratio rather than urinary analyte excretion and oxidation proteotoxic stress may underly the develop- rate determined in urine collection made over a fixed time ment of ASD, at least in part. Protein glycation and oxida- interval, usually 24 h. This was done because of difficulties tion adducts from dietary protein contribute to levels of
Anwar et al. Molecular Autism (2018) 9:3                                                                                                          Page 14 of 16

plasma and urinary glycation and oxidation free adducts;                         CD98hs: Cluster of differentiation heavy subunit; CEL: Nε-(1-carboxyethyl)lysine;
whereas glycation and oxidation adduct residues of pro-                          CL: Renal clearance; CMA: Nω-carboxymethylarginine; CML: Nε-carboxymethyl-
                                                                                 lysine; DT: Dityrosine; DUOX: Dual oxidase; EDTA: Ethylenediaminetetra-acetic
tein reflect rates of endogenous glycation and oxidation of                      acid; FL: Nε-fructosyl-lysine; G-H1: Hydroimidazolone AGE derived from glyoxal;
protein in mainly the vascular compartment. The domin-                           GSA: Glutamic semialdehyde; GSP: Glucosepane; hLAT-1: Large neutral amino
ance of plasma protein AGE and oxidation adducts in                              acid transporter subunit-1; LC-MS/MS: Liquid chromatography-tandem mass
                                                                                 spectrometry; Leiter-R: Leiter international performance scale–revised;
Algorithm-1 and the modest improvement by addition of                            MG: Methylglyoxal; MG-H1: Hydroimidazolone AGE derived from methylglyoxal
plasma G-H1 and GSA free adducts (Algorithm-3) may                               MOLD, methylglyoxal-derived lysine crosslink; MRM: Multiple reaction
indicate that there is limited influence of dietary glycated                     monitoring; NFK: N-Formylkynurenine; PEP-3: Psychoeducational profile-3;
                                                                                 rBAT: Neutral and basic amino acid transport protein; ROS: Reactive oxygen
and oxidized proteins to the development of ASD. Rather,                         species; SLC7A5: Solute carrier family 7, member 5; SVM: Support vector
challenge to proteostasis by changes in endogenous pro-                          machines; TD: Typically developing; UPR: Unfolded protein response; y+LAT-
tein modification by AGEs and DT may contribute to the                           1: Solute carrier family 7 member 7; y+LAT-2: Solute carrier family 7 member 6

development of ASD.                                                              Acknowledgements
                                                                                 We thank all the subjects recruited and their parents for agreeing to
                                                                                 participate in this study.
Conclusions
We identified changes in plasma protein glycation and                            Funding
oxidation markers; increased CML, CMA, and DT and de-                            This work received funding from Warwick Impact Fund award to NR and
creased 3DG-H that combined in an algorithm gave im-                             funding from Fondazione del Monte di Bologna e Ravenna, Italy, and from
                                                                                 Fondazione Nando Peretti, Rome, Italy, to M.M.
proved diagnostic performance over other approaches.
Increased levels of DT may indicate induction of increased                       Availability of data and materials
DUOX activity linked to gut mucosa dysfunction. Disturb-                         Analytical data produced in this study may be obtained from the
                                                                                 corresponding author.
ance of renal handling of arginine and CMA may indicate
dysfunctional arginine transporter function common in                            Authors’ contributions
ASD. Further clinical validation of plasma protein CML,                          MM, PMA, AG, PJT, and NR designed the research; PV and AP chose the
                                                                                 autistic and the control subjects, carried out the clinical evaluation, and
CMA, DT, and 3DG-H may provide improved diagnosis                                supervised the blood withdrawal and urine collection; AB organized the
of ASD. For future studies, we suggest firstly validation of                     handling of biological samples, performed some preliminary experimental
the current findings in an independent clinical study                            procedures, and kept the records; AA and SP analyzed the clinical samples
                                                                                 and extracted analytical data, AG, KR, PJT, and NR analyzed the data and
group. Thereafter, priorities are investigation of the bio-                      checked the data extraction; PJT, NR, MM, and PMA wrote the manuscript.
markers in children younger than 5 years old to assess                           All authors read, edited, and approved the final manuscript.
their ability to improve diagnosis at earlier stages of ASD
development, assessment of the biomarkers in prospective                         Ethics approval and consent to participate
                                                                                 The study was approved by the Unified Ethics Committee of Bologna, Imola
studies for prediction of risk of progression to severe                          and Ferrara (CE BIF); project number 13062. The experiments conformed to
symptoms, study of the association of genetic polymor-                           the principles set out in the World Medical Association Declaration of
phisms of DUOX and arginine transporters with clinical                           Helsinki. Whole blood and urine samples were collected from children with
                                                                                 written informed consent of a parent.
ASD, preclinical functional genomics of DUOX and argin-
ine transporters with an ASD-like phenotype, and assess-                         Consent for publication
ment of the specificity of the algorithms for ASD versus                         Written consent to publish individual children’s details (Table 1) was given
                                                                                 by their parent or legal guardian.
other psychiatric conditions.
                                                                                 Competing interests
                                                                                 The authors declare that they have no competing interests.
Additional file

 Additional file 1: Table S1. Mass spectrometric multiple reaction               Publisher’s Note
 monitoring detection of protein glycation, oxidation and nitration adducts      Springer Nature remains neutral with regard to jurisdictional claims in
 and amino acids. Table S2. Correlation analysis – plasma protein glycation,     published maps and institutional affiliations.
 oxidation and nitration adduct residues. Table S3. Correlation analysis –
 plasma protein glycation, oxidation and nitration free adducts. Table S4.       Author details
                                                                                 1
 Correlation analysis – plasma amino acids. Table S5. Correlation analysis –      Warwick Medical School, University of Warwick, Clinical Sciences Research
 urinary protein glycation, oxidation and nitration free adducts. Table S6.      Laboratories, University Hospital, Coventry, UK. 2Department of Experimental,
 Correlation analysis – Urinary amino acids. Table S7. Confusion matrix of       Diagnostic and Specialty Medicine, School of Medicine, University of
 algorithm to identify autistic spectrum disorder. (DOCX 80 kb)                  Bologna, Via Belmeloro 8, 40126 Bologna, Italy. 3Department of Computer
                                                                                 Science, University of Birmingham, Birmingham, UK. 4Don Carlo Gnocchi
                                                                                 Foundation ONLUS, IRCCS “S. Maria Nascente”, Via Alfonso Capecelatro 66,
Abbreviations                                                                    20148 Milan, Italy. 5Child Neurology and Psychiatry Unit, IRCCS Institute of
3-DG: 3-Deoxyglucosone; 3DG-H: Hydroimidazolone AGEs derived from 3-             Neurological Sciences, Via Altura, 3, 40139 Bologna, Italy. 6Department of
deoxyglucosone; 3-NT: 3-Nitrotyrosine; AASA: α-Aminoadipic semialdehyde;         Biomedical and Neuromotor Sciences, University of Bologna, Via Altura 3,
ADOS: Autism diagnostic observation schedule; AGE: Advanced glycation            40139 Bologna, Italy. 7Zeeman Institute for Systems Biology & Infectious
endproduct; ASD: Autism spectrum disorder; AUROC: Area under-the-curve of        Disease Epidemiology Research, Senate House, University of Warwick,
receiver operating characteristic plot; b0,+AT: Solute carrier 7, member 9;      Coventry CV4 7AL, UK. 8Research Technology Platform–Proteomics, University
CARS: Childhood autism rating scale; CAT-3: Cationic amino acid transporter-3;   of Warwick, Coventry, UK.
You can also read