An Assessment of the Expanded Program on Immunization (EPI) in the Philippines: Challenges and Ways Forward - Philippine Institute for Development ...
←
→
Page content transcription
If your browser does not render page correctly, please read the page content below
FEBRUARY 2021

          DISCUSSION PAPER SERIES NO. 2021-04

       An Assessment of the Expanded Program
       on Immunization (EPI) in the Philippines:
       Challenges and Ways Forward

       Valerie Gilbert T. Ulep and Jhanna Uy

The PIDS Discussion Paper Series constitutes studies that are preliminary and subject to further revisions. They are being circulated in a limited number of copies only for
purposes of soliciting comments and suggestions for further refinements. The studies under the Series are unedited and unreviewed. The views and opinions expressed are
those of the author(s) and do not necessarily reflect those of the Institute. Not for quotation without permission from the author(s) and the Institute.

CONTACT US:
RESEARCH INFORMATION DEPARTMENT
Philippine Institute for Development Studies

18th Floor, Three Cyberpod Centris - North Tower                                publications@mail.pids.gov.ph
                                                                                                                                               https://www.pids.gov.ph
EDSA corner Quezon Avenue, Quezon City, Philippines                                  (+632) 8877-4000
An Assessment of the Expanded Program on Immunization
  (EPI) in the Philippines: Challenges and Ways Forward

                   Valerie Gilbert Ulep
                       Jhanna Uy

  PHILIPPINE INSTITUTE FOR DEVELOPMENT STUDIES

                     February 2021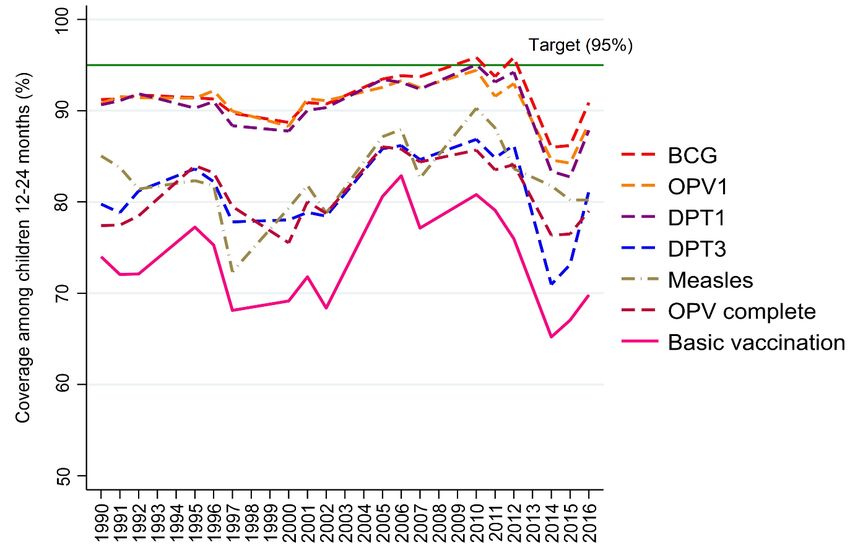
Abstract
The Philippine Expanded Program on Immunization (EPI) has been in existence for almost 40
years. It is one of the major programs of the Department of Health (DOH). The program has
the critical objective of providing Filipino children with access to safe and effective vaccines
that will protect them from diseases like measles, diphtheria, tetanus, and whooping cough.
The Philippine EPI has achieved many milestones in this regard. There is no doubt that
mortality and morbidity due VPDs have declined precipitously over the years, saving the lives
of countless of Filipino children. Moreover, polio was certified eliminated in 2000 and maternal
and neonatal tetanus in 2017.
Despite this progress, the coverage of basic vaccines has hovered at 70%- 80% in the last 30
years. The program has never achieved its target to fully immunize at least 95% of children.
Here, we assess the performance of the EPI in the Philippines. Central to this assessment is the
policy question: why has the country struggled to maintain immunization coverage over the
years and repeatedly failed to achieve its national immunization target?
While demand factors like vaccine confidence have contributed to the weak performance of
the program, the sharp decline in immunization coverage is largely a result of deep-seated
supply-side systems issues related to leadership, planning, and the supply chain that has led to
recurring vaccine stock outs in the past decade.

Keywords: Philippines, Expanded Program on Immunization, vaccine, supply-side

Disclaimer: This article/report reflects the points of view and thoughts of the authors’, and the
information, conclusions, and recommendations presented are not to be misconstrued as those
of the Department of Health (DOH). Furthermore, this article/report has not yet been accepted
by the DOH at the time of writing. The material presented here, however, is done in the spirit
of promoting open access and meaningful dialogue for policy/plan/program improvement, and
the responsibility for its interpretation and use lies with the reader.

Role of funder: We would like to express our gratitude to the Department of Health for their
support in the funding of the study and sharing of data for analyses. For this assessment, the
funders had no role in study design, data analysis, interpretation of results, or preparation of
this discussion paper.
Executive Summary
The Philippine Expanded Program on Immunization (EPI), established in 1976, has been in
existence for almost 40 years. It is one of the major programs of the Department of Health
(DOH). The program has the critical objective of providing Filipino children with access to
safe and effective vaccines that will protect them from common but deadly diseases like
measles, diphtheria, tetanus, and whooping cough.
EPIs are a cornerstone of public health in any country, and the Philippine EPI has achieved
many milestones in this regard. There is no doubt that mortality and morbidity due VPDs have
declined precipitously over the years, saving the lives of countless of Filipino children.
Moreover, polio was certified eliminated in 2000 and maternal and neonatal tetanus in 2017.
Despite progress, the coverage of basic vaccines hovered at 70%- 80% in the last 30 years. The
program has never achieved its target to fully immunize at least 95% of children. The sharpest
decline in immunization coverage occurred during the last decade (2008 to present). In 2014,
immunization coverage has declined to almost 65%, the lowest level since the early 1990’s.
Currently, the country’s immunization coverage is lower than most low-income countries.
Here, we assess the performance of the EPI in the Philippines. Central to this assessment is the
policy question: why has the country struggled to maintain immunization coverage over the
years and repeatedly failed to achieve its national immunization target?
While demand factors like vaccine confidence have contributed to the weak performance of
the program, the sharp decline in immunization coverage is largely a result of deep-seated
supply-side systems issues related to leadership, planning, and the supply chain that has led to
recurring vaccine stock outs in the past decade. The large decline in immunization coverage in
2014, for instance, was largely a result of vaccine stock outs in the previous year when vaccine
confidence of the population was high at 95%.
Highlights of Philippine EPI performance
•   National immunization coverage in past three decades was characterized by large
    fluctuations. The Philippines has never reached the target of 95% basic vaccination
    coverage (i.e., for BCG, 3 doses of OPV, 3 doses of DPT, and 1 dose of measles). In
    contrast, many other countries in the world, including most ASEAN countries, have
    successfully increased and maintained high levels of coverage.
•   The immunization coverage of most regions has suffered declines in recent years with
    rate of decline being highly heterogenous. Region XII and ARMM recorded alarming
    declines: coverage in the Region XII declined from 80% in 2013 to 40% in 2017 while
    coverage in ARMM declined from 40% in 2013 to 20% in 2017. Since the 1993 NDHS,
    ARMM has not had basic vaccination coverage above 50%.
•   Immunization coverage was slightly higher among the rich, but there were relatively
    less inequities between rich and poor compared to other vertical public health
    programs. In 2017, the top 20% richest households had higher coverage for all vaccines

                                                                                               i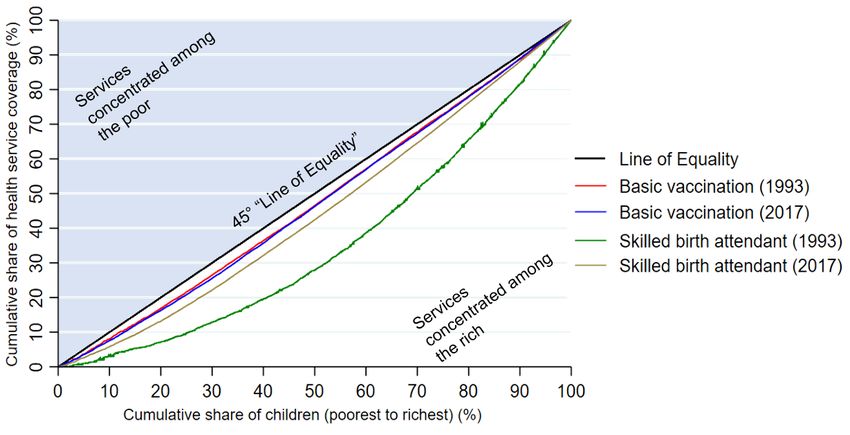
and doses compared to the poorest 60%. But declines in basic immunization coverage over
    time occurred in all socio-economic groups, with the rich suffering the largest declines.
•   Routine immunization seems to be predominantly delivered in public facilities.
    Around 95% of children received their last vaccination at public clinics or hospitals.
    The high uptake of routine child vaccination in public facilities even among the richer
    segment of the population sets EPI apart from other public health programs which typically
    have larger socio-economic inequalities.
•   A substantial number of children were not completing their vaccine series. In 2017,
    only 70% had complete basic vaccination. For measles vaccination, almost 30% of
    children who had their first doses did not complete the required second dose. Based on
    regression results, children of mothers without education and with limited access to
    maternal healthcare services were more likely to miss later doses in the vaccination series.
•   Many children, albeit vaccinated, had untimely immunization. In 2017, only 38% to
    65% (depending on the vaccine dose) of immunized children had timely administration
    based on the recommended vaccination schedule. More alarming is that, overall, among
    children who were immunized with all eight routine vaccine doses considered, only 11%
    had timely vaccinations for all doses.
Financing
•   Routine child immunization was mainly financed by the public sector, specifically the
    national government through DOH. Data on private sector spending on vaccination is
    neither systematically collected nor analyzed; therefore, the total spending on vaccines in
    the country remain largely unknown.
•   In terms of resources, the EPI is clearly a priority program of the Department of
    Health. In 2020, EPI accounted for 7% of the annual DOH budget. From 2005 to 2020,
    public spending on EPI dramatically increased even after adjusting for population growth
    and inflation: expenditures have increased 4-fold after sin tax revenues were allocated to
    EPI - from PHP 2 billion in 2013 to PHP 7 billion in 2020.
•   Majority of additional DOH EPI funds from sin taxes were spent purchasing new
    vaccines and not strengthening the health system’s ability to deliver said vaccines. In
    2017 and 2018, vaccines accounted for almost 97% of the total DOH spending on EPI.
    In 2017 and 2018, almost 60% of the total spending for the EPI were spent on the
    Pneumococcal Vaccine (PCV). Public spending on routine childhood vaccines (BCG,
    OPV, DPT, HiB, HepB, MCV/MMR) and the vaccine cold chain remained roughly same
    with slight decreases on a per-capita basis.
•   Only 1%-1.5% of the DOH EPI budget is typically allocated for cold and supply
    chain and less than 1% for soft components. Investments on human resources such as
    capacity building and training were utterly negligible.

                                                                                              ii
Vaccine supply chain and Human resources
• The mode and manner of delivery of routine vaccines by the public sector has remain
unchanged over the years: It is a government-centric delivery model common in most
developing countries with less mature health systems. The national government plans
and procures all the vaccines annually. It employs push and pull distribution models to
regional and provincial offices, and central government manages the entire supply chain
and logistics.
• The Philippines sources its vaccine supply either from UNICEF as negotiated
procurements or directly from local tenders with competitive bidding. In recent years,
the government has shifted to securing vaccines locally as part of the country’s efforts
towards vaccine independence. This endeavor, however, has led to failed procurements
almost every year. Failed procurements were the primary reason for artificial vaccine stock
outs in 2013, and DOH procurement data up to 2019 shows that it continues to occur.
• Poor strategy and planning, lack of foresight during need’s assessment and
allocation, inadequate warehouse capacity and logistics system, and other
bureaucratic process such as delayed payments to logistics and suppliers have
contributed one way or another vaccine stock outs.
• The government has poured enormous resources and introduced multiple vaccines
in recent years, but it has failed to invest in systems strengthening or the non-vaccine
components of the program to solve recurring problems of stockouts and low
immunization coverage. For example, currently, only two technical staff in DOH central
office manage the program, spreading themselves too thinly on gigantic tasks - nationwide
planning, procurement, logistics, leveraging funds, monitoring, and unplanned
supplemental immunization programs to address VPD outbreaks.
Moving Forward
The EPI has been existence for almost 40 years. It cannot keep doing the same things, incurring
the same problems, and expect things to improve.
To overcome these challenges, the program needs bold leadership and reform. In these reforms,
the DOH needs to ensure that the health system and its health human resources can deliver the
basic childhood vaccines efficiently, equitably, and in a timely manner - before it even thinks
about adding new vaccines that will merely overwhelm the existing weak vaccine cold and
supply chain.
Our policy recommendations are divided into short and long-terms solutions:
A. Short-term solutions
These solutions aim to immediately address supply-side constraints, particularly stock outs:
• In the interim, the DOH should consider procuring all its vaccines from UNICEF until the
local procurement system can effectively guarantee the country’s supply.
iii• The DOH should consider multi-year planning and procurement with local manufacturers
and carefully interface this with UNICEF. The DOH should avail Multi-Year Obligation
Authority (MYOA) from Department of Budget and Management (DBM). This will
reduce the uncertainty that comes with annualized procurement.
• The DOH should augment the technical staff of the program. The leadership of the
program must have the foresight and critical thinking in understanding the current and
future needs of the program, and the ability to communicate these needs within and outside
the bureaucracy.
B. Medium to Long-term solutions
Medium- and long-term solutions are needed to optimize efficiency, timeliness, and equity
in the uptake of vaccines. The program must be aligned with the financing and service
delivery model as envisioned in the Universal Health Care Act of 2019.
• Improve planning of vaccine requirements. The DOH currently uses aggregate census
data in estimating needs, which result to poor planning and foresight. The government
should explore using actual headcounts and electronic immunization registries in
estimating the actual need and monitoring coverage and timeliness of vaccination. This
initiative can be possibly pursued with the new Philippine national ID system.
• Increase immunization coverage and timeliness by expanding to private sector
delivery channels. Given their large and growing presence, the government can tap the
private sector to carry out a publicly- financed and privately or publicly delivered EPI.
With the private sector, child vaccines can be delivered more routinely and timely than
sporadic supplemental vaccination programs. For this to be realized, the government
needs to shift its financing scheme from DOH to PhillHealth. The DOH is not allowed to
contract out private providers, but PhilHealth can.
• Increase immunization coverage by allowing more health worker cadres (both from
the public private health workers) to provide routine vaccination. This requires,
however, further reconnaissance and amendments of certain laws. In other health systems,
non-physicians can administer vaccines or may receive insurance reimbursements.
• Improve and invest in the vaccine cold and supply chain. The DOH centrally procures
and manages the supply chain - storage, distribution, handling, and stock management,
and logistics. The government should create a formal and organized distribution system
and explore contracting out the whole supply chain or parts of it to the private sector.
• Re-design procurement practices to improve efficiency. The government should find
ways to improve efficiency through economies of scale by considering itself (DOH) as the
sole or the main procurement entity of vaccines. Both the private and public health
facilities will only source its vaccine requirements from the purchasing entity. However,
the government should ensure that it has robust supply chain for this to be pursued.
ivTable of Contents Executive Summary ................................................................................................................................. i 1. Introduction ......................................................................................................................................... 1 2. The Philippine Expanded Program on Immunization ......................................................................... 1 3. Methods .............................................................................................................................................. 3 4. Performance of the EPI ....................................................................................................................... 4 4.1. Burden of Vaccine-Preventable Diseases .................................................................................... 4 4.2. Immunization Coverage – National, Regional, and Equity ......................................................... 5 4.3. Vaccination dropouts ................................................................................................................. 11 4.4. Timeliness of vaccination administration .................................................................................. 12 4.6. Demand-Side: Vaccine Confidence ........................................................................................... 13 5. Supply-side challenges in EPI........................................................................................................... 14 5.1. Financing.................................................................................................................................... 14 5.2. National Vaccine Supply and Cold Chain ................................................................................. 17 5.3. Human Resources and Leadership ............................................................................................. 23 6. Conclusions and Recommendations ................................................................................................. 24 7. Bibliography ..................................................................................................................................... 26
List of Tables
Table 1. Philippine national immunization schedule for children 0 to 12 months of age ....................... 2
Table 2. Summary of study components and methods ........................................................................... 3
Table 3. Vaccination dropout for Polio, Pentavalent, and Measles, 2017 ............................................ 11
Table 4. Coverage and timeliness of basic vaccination, 1993-2017, Philippines ................................. 13
Table 5. DOH expenditures for vaccines for 2017 and 2018, millions of pesos (`000,000s) ............... 16
Table 6. DOH expenditures on EPI for 2017 and 2018, millions of pesos (`000,000s) ....................... 17
Table 7. Features of vaccine supply chains........................................................................................... 17
Table 8. Results of DOH EPI vaccine procurements, 2013 - 2019....................................................... 18
Table 9. Failed procurement of vaccines in 2015 and 2019 ................................................................. 19
Table 10. Levels of vaccine stocks in national storage from 2016-2019 .............................................. 22
Table 11. Duration of vaccine stock outs at the national level ............................................................. 22

List of Figures
Figure 1. Evolution of Expanded Program of Immunization in the Philippines (1976-2019) ................ 2
Figure 2. Framework summarizing determinants of vaccine coverage and timeliness........................... 3
Figure 3. Cases of Vaccine-Preventable Diseases, 1980-2019 ............................................................... 4
Figure 4. Deaths due to Vaccine-Preventable Diseases (VPDs), 1980-2016.......................................... 5
Figure 5. Vaccination by birth cohort in the Philippines, 1990-2016 ..................................................... 6
Figure 6. Immunization coverage and measles cases, 1995-2016 .......................................................... 6
Figure 7. DPT3 Coverage in the Philippines and other ASEAN countries, 1980-2018 ......................... 7
Figure 8. Basic vaccination coverage, by region, 1990-2017 ................................................................. 8
Figure 9. Basic vaccination coverage, by socio-economic status, 1980-2018 ........................................ 9
Figure 10. Concentration curves of basic vaccination and skilled birth attendance ............................. 10
Figure 11. Facility of last immunization by vaccine/dose and socio-economic status, 2017 ............... 10
Figure 12. DPT3 coverage and perception on vaccine safety ............................................................... 13
Figure 13. Budget allocation of DOH Expanded Program on Immunization ....................................... 15
Figure 14. Total value of successfully awarded and procured vaccines ............................................... 16
Figure 15. Median time between procurement steps for awarded competitive bids, 2013- 2019 (n=62)
.............................................................................................................................................................. 20
Figure 16. Vaccine supply flow in the public system ........................................................................... 21
An assessment of the Expanded Program on Immunization (EPI)
          in the Philippines: Challenges and ways forward
                                    Valerie Gilbert T. Ulep and Jhanna Uy1

1. Introduction
The EPI is a public health program managed and implemented by the Disease Prevention and
Control Bureau (DPCB) of the Department of Health (DOH). Since its inception in 1976, the
Philippine Expanded Program on Immunization (EPI) has been a cornerstone program of DOH
with the aim of promoting universal access to effective and safe vaccines. Undoubtedly, the
program has saved thousands of Filipino children from disabilities and premature death
because of vaccine-preventable diseases (VPDs) like diphtheria, pertussis, tetanus, and
measles. Routine vaccination has contributed to substantial improvements in childhood
survival and increased life expectancy in the Philippines and globally [1–3].
Perennial challenges in the DOH EPI program remain. The Philippines has struggled to
maintain immunization coverage at par with global recommendations for herd immunity as
well as reach its target to fully immunize at least 95% of all children.2
In this study, we assess the performance of the EPI in the Philippines. Central to this assessment
is the policy question: why has the country struggled to maintain immunization coverage over
the years and repeatedly failed to achieve its national immunization target?
This assessment has two objectives.
     •    First, we assess the performance of the EPI in the last three decades in terms of
          coverage, timeliness, and equity of administration.
     •    Second, we assess the implementation of the program, by identifying supply-side
          challenges that could have hindered the achievement of national immunization targets.

2. The Philippine Expanded Program on Immunization
The Expanded Program on Immunization (EPI) has had a long history in the Philippines.
In 1974, the World Health Organization (WHO) conceived of an idea for a global Expanded
Program on Immunization [4]. The global EPI aimed to promote and develop immunization
programs in all countries, improve vaccination uptake, and establish monitoring systems. The
Philippines was one of the first adopters of EPI. In 1976, the Philippines through a presidential
decree (PD 996) established the national EPI with a mission to promote universal access to safe
and effective vaccines for common vaccine-preventable diseases (VPDs). The country’s

1 Research Fellow and Supervising Research Specialist, respectively, at the Philippine Institute for Development Studies. Both
Ulep and Uy are co-first authors.
The authors would also like to thank Dra. Anna Ong-Lim of the Pediatric Infectious Disease Society of the Philippines, Dr.
Mariella Castillo of UNICEF, and Dr. Carla Ante Orozco of UNICEF for their comments and valuable insights on the topic at
hand.
2 This target is written in the DOH National Objectives for Health 2017-2022.

                                                                                                                            1
commitment to strengthen the implementation of EPI was once again reinforced through
Republic Act no. 10152 of 2011 which mandates free routine vaccination for for 11 VPDs.
The included vaccines under the EPI have expanded over the years (Figure 1). Only six
(6) VPDs were initially targeted as part of routine basic vaccination in the early era of the EPI
(1976-1982). These were tuberculosis, poliomyelitis, diphtheria, whooping cough, tetanus, and
measles. Hepatitis B was the seventh VPD included in 1992 [5]. In the last decade alone, the
DOH expanded significantly to target more age groups and add new vaccines (Figure 1).
Noteworthy are the addition of the second dose of measles vaccine in 2010 and inclusion
pneumococcal conjugate vaccine (PCV) in 2013 and, most recently, the Japanese encephalitis
vaccine for endemic areas in 2019.
Figure 1. Evolution of Expanded Program of Immunization in the Philippines (1976-2019)
Source: Department of Health, 2018; Lopez et al., 2018; Department of Health, 2017; Department of Health,
2019; Wilder-Smith et al., 2019.
The core of the DOH EPI today remains to be routine vaccination for children 0 to 12
months. The vaccination schedule for children is summarized in Table 1.
Table 1. Philippine national immunization schedule for children 0 to 12 months of age
Vaccine / Antigen Disease Doses Schedule
BCG (Bacillus Calmette–Guerin) Tuberculosis 1 Birth (within 24 hours)
HepB (monovalent) Hepatitis B 1 Birth (within 24 hours)
Pentavalent vaccine Diphtheria, tetanus and pertussis 3 6, 10, 14 weeks
(DPT-HepB -HiB) Hepatitis B
Hemophilus influenzae type B
Meningitis
OPV (Oral polio vaccine) Poliomyelitis 3 6, 10, 14 weeks
IPV (Inactivated polio vaccine) 1 14 weeks
PCV (Pneumococcal conjugate Pneumococcal infections (e.g. 3 6, 10, 14 weeks
vaccine) meningitis)
MCV (measles containing vaccine) Measles, mumps, rubella 2 9-12 months, 12-15
and MMR (Measles, mumps, months
rubella)
Source: Pediatric Infectious Disease Society of the Philippines, 2019
23. Methods
The table below summarizes the study components, its data sources, and the executed analyses.
Table 2. Summary of study components and methods
Components Data Source Data Analysis
1. EPI reach, Available nationally representative surveys Descriptive statistics
timeliness, equity and surveillance data from DOH, WHO, and Regression modelling
UNICEF
Equity analysis
2. EPI DOH administrative data: accounting data Descriptive analysis of
public expenditures (registry of allotments, obligations, and expenditures
disbursements) and procurement monitoring
reports
3. EPI supply-side Review of literature, EPI documents, and past Thematic and narrative
factors assessments analyses
Interviews with two Philippine EPI experts
Analytical Framework: The goal of the EPI is to reduce the burden of VPDs by increasing
immunization coverage and timeliness. Determinants of immunization coverage and timeliness
may be any of:
• Demand-side: Socio-economic characteristics and knowledge/attitudes/practices of
households and caregivers that leads to the intent to vaccinate.
• Supply-side: Supplies, human resources, funds, equipment, and other resources and
processes necessary to ensure that a facility can provide vaccination services to children
when their caregivers wish to avail of them.
• Contextual factors: Geographic distance, financial affordability, and cultural
acceptability of immunization services that facilitate or hinder parent/caregiver access
to immunization services.
Figure 2. Framework summarizing determinants of vaccine coverage and timeliness
Attitudes Supply
Vaccine
Coverage
Perceived Intent to and Facility
norms Vaccinate Timeliness readiness
Perceived
Contextual factors Workforce
control
that affect
Demand-side community access Supply-side
Source: Phillips et al., 2017; Masters et al., 2019
3We use this framework as a guide in assessing the performance of the EPI in the Philippines.
The following sections of this paper are organized as follows:
• Section 4: We assess the performance of the country’s EPI in the last 30 years, looking
at the incidence of and deaths due to VPDs, vaccine coverage, immunization dropouts
for multi-dose vaccines, and the timeliness of vaccine administration. We also shed
light on some demand-side determinants.
• Section 5: We outline EPI supply-side challenges in the realm of financing, national
vaccine cold and supply chain, and human resources and leadership.
• Section 6: We conclude the paper and provide overarching short-term and long-term
recommendations.
4. Performance of the EPI
4.1. Burden of Vaccine-Preventable Diseases
The burden of VPDs in any country is greatly influenced by the uptake of childhood
vaccinations and the strength of its immunization programs [14]. There is no question that
morbidity and mortality due to VPDs have declined significantly after the introduction
of the EPI. In the early 1980s, thousands VPD cases were recorded every year, particularly
for measles and pertussis (Figure 3). By the mid-1990s, the number of VPD cases and deaths
declined sharply (Figure 4). The Philippines was certified to have eliminated Polio in 2000 as
well as maternal and neonatal tetanus in 2017.
Figure 3. Cases of Vaccine-Preventable Diseases, 1980-2019
2000
1800
1600
Cases per million population
1400
1200
1000
800
600
400
200
0
1980
1981
1982
1983
1984
1985
1986
1987
1988
1989
1990
1991
1992
1993
1994
1995
1996
1997
1998
1999
2000
2001
2002
2003
2004
2005
2006
2007
2008
2009
2010
2011
2012
2013
2014
2015
2016
2017
2018
2019
Diphtheria Measles Mumps Neonatal tetanus Pertussis Polio Rubella
Source: Analysis of data from the WHO vaccine-preventable diseases monitoring system
4Figure 4. Deaths due to Vaccine-Preventable Diseases (VPDs), 1980-2016
14000
12000
10000
Number of deaths
8000
6000
4000
2000
0
1980
1981
1982
1983
1984
1985
1986
1987
1988
1989
1990
1991
1992
1993
1994
1995
1996
1997
1998
1999
2000
2001
2002
2003
2004
2005
2006
2007
2008
2009
2010
2011
2012
2013
2014
2015
2016
Diptheria Whooping cough Tetanus Acute Polio Measles
Source: Analysis of data from the DOH FHSIS annual reports
Despite success in reducing the burden of VPDs, occasional disease outbreaks continue to
occur. In the last decade, measles outbreaks occurred in 2014, 2018, and 2019 (spikes in Figure
3), recording 58,848, 20,827, and 48,525 cases, respectively [16, 17]. In 2019, the Philippines
had two cases of vaccine-derived poliovirus after the country was declared polio-free in 2000.3
The occasional outbreaks suggest long-standing problems of under-vaccination, untimely
administration, and failure to reach and maintain herd immunity levels.
4.2. Immunization Coverage – National, Regional, and Equity
Immunization coverage in past three decades was characterized by large fluctuations. The
Philippines has never reached the target of 95% basic vaccination coverage (i.e., for BCG,
3 doses of OPV, 3 doses of DPT, and 1 dose of measles) . Figure 5 shows that coverage for basic
vaccines among children 12-24 months has been remarkably unstable over time. In 2002,
coverage started to increase steadily and was sustained until 2012 for all basic vaccines until
95% coverage was achieved for BCG and the first doses of DPT and OPV. Then coverage
suddenly declined sharply in 2013 with basic vaccination coverage dipping to its lowest point
(65%) in 2014, even lower than the levels in the 1990s. The incidence of VPDs follow
fluctuations in immunization coverage; The measles outbreak in 2014 can be attributed to large
decline in coverage in the previous years (see Figure 6).
3
Note that these two cases were vaccine-derived poliovirus type 2 which are very rare genetically mutated strains of polio from
the oral vaccine. Communities with persistently low coverage for oral and inactivated polio vaccines and poor sanitation allow
transmission of this strain. Over time the virus may regain its ability to cause disease. High immunization coverage with OPV and
IPV protects the community from both wild and vaccine-derived poliovirus types.
5Figure 5. Vaccination by birth cohort in the Philippines, 1990-2016
Source: Analysis of National Demographic and Health Survey (NDHS) 1993-2017
Figure 6. Immunization coverage and measles cases, 1995-2016
700 90%
85%
600 83%
Measles cases (per million population)
81%
81% 80% 79% 80%
77% 77% 77% 76%
Basic vaccination covergae
500 75%
75%
72% 72% 71%
400 69% 70% 70%
68% 68% 67%
65% 65%
300
60%
200 55%
50%
100
45%
0 40%
measles cases basic vaccination
Source: Analysis of annual surveillance data from WHO VPD monitoring system and NDHS 1993-2007
6In contrast, the global average, and many other countries in the world, including most ASEAN
countries, have successfully increased, and maintained high levels of coverage. Figure 7 shows
a comparison of DPT34 coverage among the Philippines, the global average, and other ASEAN
countries. From 1980-83, the Philippines had a DPT3 coverage (47%) that was more than twice
that of the global average (20%) and much better than the coverages in Vietnam, Cambodia,
Indonesia, and Lao. Past 2012, as global coverage and coverage in ASEAN countries improved,
the Philippines was not able to maintain its past gains. In 2017, DPT3 coverage in the
Philippines (72%) was lower than the world’s poorest countries like Burundi (90%), Malawi
(92%), and Liberia (84%). Among ASEAN countries, the Philippines registered the lowest
DPT3 coverage (65%) in 2018.
Figure 7. DPT3 Coverage in the Philippines and other ASEAN countries, 1980-2018
Source: Analysis of WHO-UNICEF coverage estimates data
Like the national trend, immunization coverage in regions varied over time. Over the last
three decades, the immunization coverages in all regions (except Davao) were characterized
by large fluctuations and a decline in 2013 (Figure 8). Region XII and ARMM recorded
alarming declines: coverage in the Region XII declined from 80% in 2013 to 40% in 2017
while coverage in ARMM declined from 40% in 2013 to 20% in 2017. Since the 1993 NDHS,
ARMM has not had basic vaccination coverage above 50%.
4 The coverage for the third dose the DPT vaccine is tracked globally as a metric for the performance of EPIs or utilization of
routine immunization systems [18]
7Figure 8. Basic vaccination coverage, by region, 1990-2017
Source: Analysis of the NDHS 1993-2017
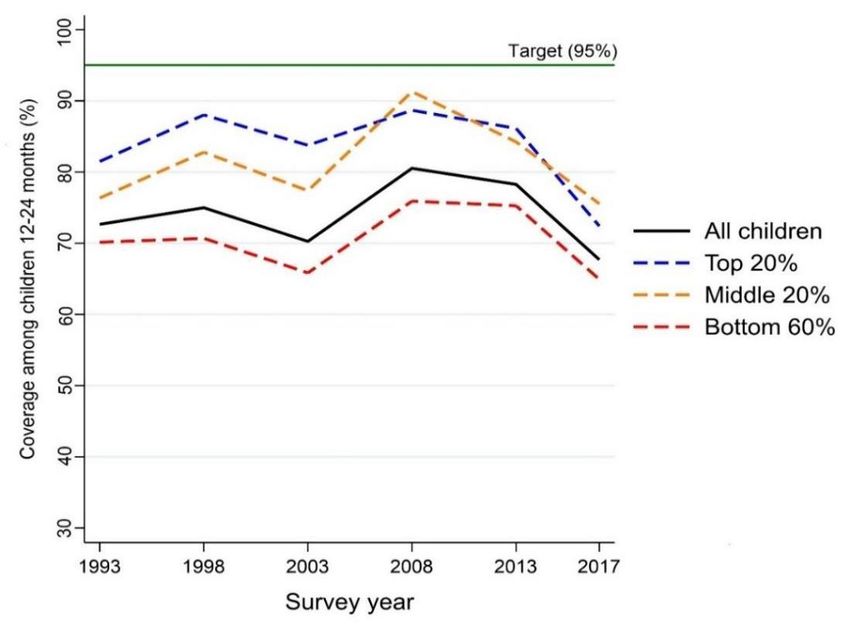
8Immunization has a socio-economic gradient across wealth quintiles. Children from poorer
households had lower coverage compared to richer households (Figure 9). Based on the 2017
NDHS, basic vaccination coverage among children from the top 40% wealthiest households
was 75% compared to the 60% of the bottom 60% of households. However, all socio-economic
groups experienced decreases in basic vaccination coverages post-2013.
Figure 9. Basic vaccination coverage, by socio-economic status, 1980-2018
Source: Analysis of the NDHS 1993-2017
Overall, the inequality associated with immunization coverage is only moderately pro-rich.
Figure 10 shows concentration curves5 for basic vaccination coverage and skilled birth
attendance (SBA). Compared to SBA, the curve for basic vaccination is quite near the line of
equality (45-degree line). In other words, the difference in the uptake of basic vaccination
between the rich and the poor is not that large. This disparity has not changed over last thirty
years (between 2013 and 2017; blue vs. red curve). In contrast, the gap in SBA and other
maternal child health services, albeit having decreased over time (brown vs. green curve), is
still greater than that of the inequality in basic vaccination.
Routine immunization seems to be primarily delivered in the public sector. Analysis of
NDHS data shows that around 95% of children received their last vaccination at a public
5 Concentration curves are commonly used to identify wealth or income inequality in the utilization of health
services. Concentration curves plot the cumulative percentage of the health care utilization (e.g., basic vaccination
coverage) on the y-axis against the cumulative percentage of the population ranked by socio-economic status,
beginning with the poorest and ending with the richest, on the x-axis.
If children of all wealth quintiles received an equal proportion of immunization coverage, the curve would coincide
with the 45° line or the “line of perfect equality.” If the curve lies above the line of equality, coverage is concentrated
among the poor; when the curve lies below the line of quality, coverage is concentrated among the rich.
9facility. Richer households were more likely to get immunized in the private sector, especially
for later doses in a series (Figure 11).
Figure 10. Concentration curves of basic vaccination and skilled birth attendance
Source: Analysis of the NDHS 1993-2017
Figure 11. Facility of last immunization by vaccine/dose and socio-economic status, 2017
Source: Analysis of the NDHS 2017
10Notes: The NDHS only asks about the facility of the last immunization. There is no data on the facility for each
dose. This estimate is merely a proxy for the share of public/private sector delivery of immunizations services.
4.3. Vaccination dropouts
Metrics on immunization dropouts reflect an immunization program’s ability to reach a child
multiple times for vaccines with more than one dose. Thus, it gives insight into barriers to
return such as stock-outs, errors in vaccination scheduling for a child, inadequate caregiver
education, or lack of tracking and reminding systems [20–22].
Table 3 shows the percentage (%) of children not completing their succeeding vaccine doses
for OPV, Pentavalent vaccine, and measles vaccine. For measles vaccination, almost 30% of
children who had their first doses did not complete the required second dose.
The effect of socio-demographics factors on the completion of vaccine varies considerably not
only by vaccine and dose. In general, based on regression results, children of mothers
without education and with limited access to maternal healthcare services were more
likely to miss the second or third doses. For instance, those who were born at home or those
without adequate prenatal quality are more likely to drop out or miss their child’s second and
third polio and pentavalent vaccine doses.
Table 3. Vaccination dropout for Polio, Pentavalent, and Measles, 2017
OPV 1 to OPV 2 to Penta 1 Penta 2 Measles
2 3 to 2 to 3 1 to 2
Children with vaccination cards,
immunized with prior dose, and n=2922 n=2630 n=2973 n=2668 n=1564
meet minimum age of next dose
Overall Dropout (%) 3.9 5.8 3.2 5.5 30.0
A. Maternal Characteristics
Educational attainment
None 7.5 5.6 8.0 9.6 35.7
Primary 8.3 6.1 6.2 6.0 31.4
Secondary or higher 1.9 5.7 1.6 4.9 28.9
B. Barriers to Health Care and Health Care Utilization
Money
No problems 3.3 5.4 2.4 5.7 27.4
Big problem 4.5 6.3 4.1 5.3 32.9
Geographic distance
No problems 3.9 5.4 3.0 5.7 28.6
Big problem 3.7 7.0 3.8 5.0 34.3
Antenatal care
Less than 4 visits or not seen by 9.6 4.7 7.5 11.6 37.6
skilled health staff
At least 4 visits and seen by a 3.0 6.0 2.6 4.7 29.0
skilled health staff
Delivery by a skilled health staff
No 10.0 9.6 9.2 8.7 38.0
Yes 3.2 5.4 2.5 5.2 29.2
Place of delivery
11OPV 1 to OPV 2 to Penta 1 Penta 2 Measles
2 3 to 2 to 3 1 to 2
Home/other 7.2 9.0 7.9 9.0 35.4
Public hospital 2.9 5.9 2.1 5.0 30.8
Public health center 2.1 5.7 2.2 5.5 34.4
Private facility 4.7 3.9 3.1 4.4 21.5
C. Household Characteristics
Type of residence
Rural 4.4 6.7 4.1 6.0 32.5
Urban 3.2 4.8 2.1 4.9 27.0
Wealth quintile
Quintile 1 - Poorest 5.6 5.5 6.1 7.0 35.5
Quintile 2 3.8 8.7 3.7 7.0 31.8
Quintile 3 2.0 5.4 1.9 5.1 27.5
Quintile 4 4.3 2.3 1.3 3.0 30.8
Quintile 5 - Richest 2.8 6.4 1.6 4.2 20.2
Source: Analysis of NDHS 2017
4.4. Timeliness of vaccination administration
In this subsection, we reiterate select findings of our past paper “Too Early, Too Late:
Timeliness of Child Vaccination in the Philippines” to complete the entire picture of EPI
performance. For more details, readers may refer to the original paper [23].
Traditionally, EPI performance has been measured by coverage because it is an important
proxy for population immunity and VPD incidence tracks closely to coverage. The National
Objectives for Health (NOH), an official document that outlines medium-term health system
targets of the DOH, only includes coverage as an indicator of the EPI’s success [24].
However, the importance of the timeliness of vaccine administration as an important metric of
EPI performance is increasingly being recognized globally [12]. Coverage is a measure of
completion of the immunization schedule, but high completion does not necessarily mean
timely vaccination. Childhood protection to against to disease is maximized only when
vaccines are delivered in a timely manner within the recommended ages. This is the reason why
vaccination schedules exist. Vaccination schedules are determined by accounting for local
disease epidemiology, and they have an underlying goal of eliciting immunity in children
before they are exposed to infectious diseases [25]. Late doses increase a child’s duration at
risk for VPDs while early doses or improperly spaced doses may decrease immune response to
vaccine [25, 26].
Among children immunized with all basic vaccine (8 doses), only 10.6% had all their vaccines
and doses administered on time (Table 4); there is no difference among of socio-economic class
for this metric. There were, however, differences if timeliness is measured per vaccine dose.
Timely administration for individual vaccines from 38% to 67% in 2017 (review [23] for
detailed data). From the 1993 to 2017 rounds, the timeliness of BCG (12.9% to 64.6%), OPV1
(16.8% to 39.5%), and DPT1 (16.4% to 37.5%) improved significantly. Children of the top
20% richest households (83.2%) were much more likely to receive the BCG birth dose within
the recommended schedule of birth to 2 weeks compared to children of the bottom 60%
(58.6%).
12Table 4. Coverage and timeliness of basic vaccination, 1993-2017, Philippines
All children 12-24 months Top 20% in wealth Bottom 60% in wealth
NDHS
Year All Timely Coverage All Timely Coverage All Timely
Coverage (%)
(%) (%) (%) (%) (%)
1993 71.9 2.1 78.3 3.6 70.0 1.6
1998 72.6 2.1 85.1 3.3 68.9 1.5
2003 69.8 2.6 80.4 4.3 66.8 1.9
2008 79.3 5.3 86.6 5.4 75.1 4.0
2013 77.2 9.3 85.8 12.4 74.0 7.0
2017 69.4 10.6 74.4 10.5 65.7 9.2
Source: Analysis of NDHS 1993-2017 rounds
4.6. Demand-Side: Vaccine Confidence
Depending on the period, the decline in immunization coverage in recent years could be partly
explained by both supply and demand factors. Supply factors include health system challenges
that could lead to vaccine stockouts in health facilities while demand factors affect the intent
of the household to vaccine their children.
We argue that the large decline in coverage in 2014 could be attributed to vaccine stock outs
and less because of demand-side factors. The supply factors are elaborated on in Section 5 of
this paper. Based on vaccine confidence surveys, almost 97% of the population in 2014 agreed
that vaccines were safe, but coverage was the lowest in decades (Figure 12).
Figure 12. DPT3 coverage and perception on vaccine safety
100 100
Dengvaxia
Perception on vaccine safety (%)
controversy 90
90
80
DPT3 Coverage (%)
70
80
60
70 50
40
60
30
20
50
10
97.6 65.9 75.5 87.4 88.4
40 0
vaccine is safe DPT3 coverage
Source: Coverage data from WHO-UNICEF and vaccine confidence data from Philippine Survey and Research
Center (PSRC)
13Vaccine coverage was improving after 2014, but when vaccine confidence in the safety of
vaccines plummeted to 66% in 2018 following the Dengvaxia controversy,6 coverage declined
concomitantly. The decline was larger among the richer population (review Figure 9) which
also experienced larger decreases in vaccine confidence: In 2018, based on PSRC survey data,
only 63% of the population belonging to class ABC agreed that vaccines are safe compared to
70% of their poorer counterparts (class D and E). However, the next section shows that supply
challenges remained during this period and contributed to declines in coverage in recent years.
5. Supply-side challenges in EPI
In the previous section, we assessed the performance of the Philippine EPI in terms of burden
of VPDs, immunization coverage, drop-outs in vaccine series, and timeliness of administration.
We also touched about vaccine confidence as a demand-side factor that affects the vaccine
uptake. Now, we present supply-side factors that influence vaccine coverage and
timeliness. This section is divided into financing, national vaccine supply and cold chain, and
human resources and governance.
5.1. Financing
Routine child immunization was mainly financed by the public sector, specifically the
national government through DOH. Data on private sector spending on vaccination is neither
systematically collected nor analyzed; therefore, the total spending on vaccines in the country
remain largely unknown [27]. However, given that routine childhood vaccination seems to be
largely delivered in the public sector even among the richer segment of the population (review
Figure 11), we hypothesize that EPI spending is largely from the public sector. PhilHealth does
not have an immunization package, but it does include birth doses of BCG and Hepatitis B as
part of reimbursements in the Newborn Care Package instituted in 2006. Nevertheless, since
the DOH procures majority of the vaccine and even the disposable supplies (e.g., syringes,
safety collector boxes) required by the country, we assume that DOH accounts for the lion
share of total public spending for immunization in the Philippines.
In terms of budget allocation, the EPI is clearly a priority program of the Department of
Health. In 2020, DOH allocated around PHP 7.3 billion, equivalent to about 7.2% of the
DOH’s total budget of PHP 100.56 billion. From 2005 to 2020 public spending on EPI had
increased sharply, with the program receiving massive infusion of funds after the passage of
Sin Tax Law in 2012 (RA 10351). Public spending increased by almost 4-folds, from PHP 2
billion in 2013 to PHP 7 billion in 2020 (See Figure 13). Likewise, after adjusting for
population growth and inflation, public spending per person has increased from PHP 6 per
person in 2005 to PHP 67 per person in 2020.
6 Dengvaxia was subject to a large controversy following Sanofi’s analysis which suggests that the vaccine risk of
severe dengue and hospitalizations. Distribution of vaccine has been suspended in the country due to the fear
resulting from this controversy. The controversy was said to have increased vaccine hesitancy in the country.
14Figure 13. Budget allocation of DOH Expanded Program on Immunization
8 73.4 72.9 71.6 80
66.7
Total allocation (2020 PHP billion)
7 70
Total per capita (2020 PHP)
6 60
5 42.9 50
37.1
4 40
31.9
28.5
3 22.9 23.0 30
2 12.5 13.4 20
8.1 7.7
1 5.8 5.9 10
0.3 0.3 0.5 0.5 0.9 1.0 2.5 1.9 1.9 2.5 3.3 4.0 7.1 7.4 7.5 7.3
0 0
2005
2006
2007
2008
2009
2010
2011
2012
2013
2014
2015
2016
2017
2018
2019
2020
budget allocation per capita constant
Source: Analysis of DBM National Expenditure Program data from FY 2005-2020
Majority of public spending and increase in DOH EPI funds were spent on adding and paying
for relatively new vaccines in the program. The sin taxes were used to introduce the
pneumococcal vaccine (PCV) and human papilloma virus (HPV) in 2013 and 2014,
respectively (review Figure 1) [8]. While these vaccines are considered a new and underutilized
vaccines recommended by the WHO for inclusion in EPIs, PCV specifically is much more
expensive than core routine vaccines: Based on the EPI’s procurement project management
plans for 2017-2019, PCV costs around PHP 800-870 per dose compared to PHP 7-70 per dose
for BCG, polio, pentavalent, and MMR vaccines.
Table 5 shows that more than 70% of the total spending on vaccines (excluding service
delivery) in 2018 and 2019 were accounted for by the PCV and HPV vaccine. This is confirmed
by more DOH procurement monitoring data from 2013 to 2019 (Figure 14) which also shows
that spending on routine child vaccines remained the relatively stable over the same period.
Majority of the EPI budget is spent on vaccines. In 2017 and 2018, vaccines (and their
import taxes) accounted for almost 97% of the total DOH EPI disbursements (Table 6). Only
a small share was accounted for service delivery of the program (including capacity building).
Around 1%-1.5% were allocated for the cold and supply chain and less than 1% for soft
components, which includes capacity building, media, promotion, and research.
15Table 5. DOH expenditures for vaccines for 2017 and 2018, millions of pesos (`000,000s)
2017 2018
Vaccines Disbursed Share Disbursed Share
Total (excluding taxes) 7,398.93 100% 7,061.40 100%
Basic routine (for infants) 1,705.06 24% 1,913.50 27%
BCG 47.99 1% - -
Hepatitis B - - - -
Polio 412.02 6% 416.25 6%
Pentavalent 490.55 7% 481.96 7%
Tetanus-diphtheria 62.76 1% 56.05 1%
Measles 691.74 9% 959.24 14%
Relatively new vaccines 5,693.77 77% 5,147.91 73%
PCV (for infants) 4,692.59 63% 4,822.91 68%
HPV (for girls 9-10 years) 738.68 10% 325.00 5%
Influenza (for seniors) 262.50 4% - -
Source: Authors’ analysis of DOH registry of allotments, obligations, and disbursements (RAOD) data
Notes: [1] Program RAOD data analyzed were from the Expanded program of immunization, Family
Health Nutrition and Responsible Parenthood, and Public Health Management (started in 2018 for
DOH-DPCB soft components). [2] The analysis for 2017 includes the continuing appropriations
(CONAP) from 2016 funds. [3] “--“means no expenditures were recorded in the RAOD
Figure 14. Total value of successfully awarded and procured vaccines
9,000
Total awarded (PHP millions)
8,000
7,000
6,000
5,000
4,000
3,000
4,819
2,000 1,768 5,576
1,186 2,423
775 4,544
1,000
707 1,321 1,404 1,161 838 1,407 2,060
-
2013 2014 2015 2016 2017 2018 2019
Core routine PCV HPV Other new
Source: Authors’ analysis of the DOH Procurement Monitoring Reports (PMRs) from 2013-2019
Note: There may be slight differences with totals compared to Table 5 because (1) The PMRs
measure contracts awarded, but not necessarily disbursed. (2) There may be differences in the actual
year of disbursements according to the RAOD compared to when the contract was awarded. (3) There
may be contracts awarded and disbursed, but not recorded in the RAOD as of the time we obtained
the data.
16Table 6. DOH expenditures on EPI for 2017 and 2018, millions of pesos (`000,000s)
2017 2018
Vaccines Disbursed Share Disbursed Share
Total 7,762.46 100% 7,596.86 100%
A. Vaccines 7,398.93 95.3% 7,061.40 93.0%
B. Vaccine import taxes 119.09 1.5% 266.43 3.5%
C. Safe injection supplies 140.66 1.8% 26.86 0.4%
Auto-disable syringes 101.11 1.3% - -
Reconstitution syringes 11.25 0.1% 3.57 0.0%
Safety collector boxes 28.3 0.4% 23.28 0.3%
D. Supplemental immunization activities
8.56 0.1% 92.59 1.2%
(measles and polio)
E. Cold and Supply Chain 70.83 0.9% 143.21 1.9%
Brokerage and storage 0.4 0.0% 5.00 0.1%
Transport 39.85 0.5% 105.62 1.4%
Warehouse 30.58 0.4% 32.59 0.4%
F. Equipment (vaccine carriers) 11.11 0.1% - -
G. Soft Components 13.28 0.2% 6.37 0.1%
Media and News 0 0.0% 5.75 0.1%
Research and monitoring 13 0.2% - -
Training and Events 0.28 0.0% 0.62 0.0%
Source: Authors’ analysis of DOH registry of allotments, obligations, and disbursements (RAOD) data
Notes: [1] Program RAOD data analyzed were from the Expanded program of immunization, Family
Health Nutrition and Responsible Parenthood, and Public Health Management (started in 2018 for
DOH-DPCB soft components). [2] The analysis for 2017 includes the continuing appropriations
(CONAP) from 2016 funds.[3] “--“means no expenditures were recorded in the RAOD
5.2. National Vaccine Supply and Cold Chain
In this section, we identify and assess the challenges starting from procurement until
distribution of vaccines. Challenges in each step have adverse impact on availability of critical
vaccines and contribute to stockouts at the facility-level.
Table 7. Features of vaccine supply chains
Planning and
Storage Distribution
procurement
A. Planning and Procurement
As mentioned, the DOH centrally procures vaccines for the whole country. The DOH EPI
prepares a vaccine procurement and allocation plan before it goes through the usual process of
the government in accordance with the Government Procurement reform Act of 2003. The
program determines the demand for the year based on the projected aggregate number of
newborns for the year based on census data from the Philippine Statistical Authority (PSA).
As part of standard global practice, a buffer stock should be added to estimated demand, but it
is unclear if this is followed conscientiously. It is also unclear how herd immunity thresholds
17(HIT) are accounted for in estimated demand for a particular year. Unvaccinated children
from the previous years, should be included otherwise the vaccine-naïve population
accumulates, which eventually lead to outbreaks and the need for supplemental
immunization activities for catch-up vaccinations.
Once the plan is prepared, the DOH Procurement Services of DOH facilitates the procurement
of the vaccines. The Bids and Awards Committee (BAC) Secretariat consolidates the plan and
recommended before approval of the procuring entity.
The Philippines sources its vaccine supply either from the United Nations Children's Fund
(UNICEF) or directly from local tenders. The Philippine government usually enter negotiated
procurement with UNICEF through the Vaccine Independence Initiative (VIII), which was
established by UNICEF and WHO in 1991 to help lower-middle income countries (LMICs)
like the Philippines to participate in pooled procurement and benefit from economies of scale.
The VII enables LMICs to eventually be self-reliant with respect to vaccine procurement and
management [28].
In recent years, the DOH has been attempting to procure vaccine directly from manufacturers,
which typically undergo competitive procurement process. While such endeavor is part of the
country’s long-term efforts towards vaccine independence, this has put uncertainty on the
vaccine supply of the country as failed local biddings for national supply have been recurring.
Table 8 shows the procurement results of EPI from 2013 to 2019. The primary mode of
procurement for vaccines differs over time. Negotiated procurement (primarily with UNICEF)
was prominent in 2013, 2014, and 2017. Competitive bidding was prominent in 2014 onwards,
but it resulted to high levels of bidding failures especially for the basic routine vaccines (i.e.,
BCG, HepB, Polio, Penta (DPT-HepB-HiB), measles).
Table 8. Results of DOH EPI vaccine procurements, 2013 - 2019
Basic routine (N=84) Relatively new (N=44)
Year, n (number failed) Competitive Negotiated Competitive Negotiated
2013 1 (1) 6 (0) 0 (0) 5 (0)
2014 4 (1) 8 (0) 2 (1) 4 (1)
2015 16 (11) 3 (1) 9 (3) 0 (0)
2016 12 (5) 3 (0) 7 (1) 2 (0)
2017 1 (0) 7 (0) 4 (0) 0 (0)
2018 2 (1) 6 (0) 6 (3) 1 (1)
2019 8 (6) 7 (0) 4 (0) 0 (0)
* Excluded cancelled or repeat order items.
Source: Authors’ analysis of the DOH Procurement Monitoring Reports (PMRs) from 2013-2019
Notes: Basic routine vaccines: BCG, HepB, Polio, Pentavalent (DPT-HepB-HiB), measles; Relative new
vaccines: PCV, HPV, influenza, rotavirus, JEV
18When local tenders fail, the government resorts to emergency procurement with
UNICEF. For emergency procurements, the request would come in the second or even third
quarter of the current year whereas UNICEF requires countries to commit on orders September
of the prior year. KII respondents commented that late requests and payments (3-5 months)
result to delayed delivery of vaccines when stock outs are already occurring. For example,
emergency procurement with UNICEF happened in 2015 and 2019 when there were failed
local bidding for Pentavalent vaccine and measles vaccines, respectively, and vaccine stores
were at stock-out levels (Table 9). These last-minute requests and failed commitments do
not make the Philippines a “responsible customer” in the global vaccine market where
countries must queue for vaccines, particularly for those with only one global supplier (e.g.,
MMR). Table 9Table 9 shows the pattern of failed competitive bids and that the number of
days ‘spent’ on failed bids in 2015 and 2019 was upwards of 100 days.
Table 9. Failed procurement of vaccines in 2015 and 2019
COBAC ID Procurement Mode Start Date* Fail Date Days Delay
2015
A. BCG
2015-087 Competitive bidding Mar 6, 2015 Mar 31, 2015 117
2015-087A Competitive bidding May 21, 2015 Jun 23, 2015
NP NO. 2015-015 UNICEF - negotiated Jul 1, 2015
B. Pentavalent
2015-086 Competitive bidding Mar 6, 2015 Mar 31, 2015 166
2015-086-A Competitive bidding Apr 7, 2015 May 12, 2015
2015-158 Competitive bidding Aug 19, 2015
EP NO.2015-003 UNICEF - negotiated
C. Measles
2015-080 Competitive bidding Mar 6, 2015 Mar 31, 2015 157
2015-085 Competitive bidding Mar 6, 2015 Mar 31, 2015
2015-085-A Competitive bidding May 12, 2015 Jun 23, 2015
NP-UNICEF-014-2015 UNICEF - negotiated Jul 8, 2015
2015-111 Competitive bidding Apr 28, 2015
2015-111-A Competitive bidding Jun 29, 2015 Jul 27, 2015
2015-111-B Competitive bidding Aug 10, 2015
2019
A. BCG
2019-143 Competitive bidding Oct 30, 2018 Dec 3, 2019 141
2019-143-B UNICEF - negotiated Mar 20, 2019
B. Hepatitis B
2019-111 Competitive bidding Oct 30, 2018 Feb 26, 2019 185
2019-111-B UNICEF - negotiated May 3, 2019
C. Polio
2019-222 Competitive bidding Feb 4, 2019 Aug 4, 2019 151
2019-222-B UNICEF - negotiated Jul 5, 2019
19You can also read