IMI Impact of Myopia Special Issue
←
→
Page content transcription
If your browser does not render page correctly, please read the page content below
Special Issue

              IMI Impact of Myopia
              Padmaja Sankaridurg,1,2 Nina Tahhan,1,2 Himal Kandel,3 Thomas Naduvilath,1,2
              Haidong Zou,4 Kevin D. Frick,5 Srinivas Marmamula,6 David S. Friedman,7
              Ecosse Lamoureux,8 Jill Keeffe,6 Jeffrey J. Walline,9 Timothy R. Fricke,1 Vilas Kovai,10 and
              Serge Resnikoff1,2
              1
                Brien Holden Vision Institute, Sydney, Australia
              2
                School of Optometry and Vision Science, University of New South Wales, New South Wales, Australia
              3
                Save Sight Institute, Sydney Medical School, The University of Sydney, New South Wales, Australia
              4
                Shanghai Eye Disease Prevention and Treatment Center, Shanghai, China
              5
                Johns Hopkins Carey Business School, Baltimore, Maryland, United States
              6
                Gullapalli Pratibha Rao International Centre for Advancement of Rural Eye care, L V Prasad Eye Institute, Hyderabad, India
              7
                Glaucoma Center of Excellence, Massachusetts Eye and Ear, Harvard Medical School, Boston, Massachusetts, United States
              8
                Duke - NUS Medical School, Singapore; Singapore Eye Research Institute, Singapore
              9
                The Ohio State University College of Optometry, Columbus, Ohio, United States
              10
                 Health Promotion Service, Population Health, Liverpool Hospital, SWSLHD, Health - New South Wales, New South Wales,
              Australia

              Correspondence: Padmaja                   The global burden of myopia is growing. Myopia affected nearly 30% of the world popu-
              Sankaridurg, Brien Holden Vision          lation in 2020 and this number is expected to rise to 50% by 2050. This review aims to
              Institute, Level 4, North Wing,           analyze the impact of myopia on individuals and society; summarizing the evidence for
              Rupert Myers, Building Gate 14,           recent research on the prevalence of myopia and high myopia, lifetime pathological mani-
              Barker Street, University of New          festations of myopia, direct health expenditure, and indirect costs such as lost produc-
              South Wales, Sydney, New South
              Wales 2052, Australia;
                                                        tivity and reduced quality of life (QOL). The principal trends are a rising prevalence of
              p.sankaridurg@bhvi.org.                   myopia and high myopia, with a disproportionately greater increase in the prevalence of
                                                        high myopia. This forecasts a future increase in vision loss due to uncorrected myopia as
              Received: December 21, 2020               well as high myopia-related complications such as myopic macular degeneration. QOL
              Accepted: December 26, 2020
                                                        is affected for those with uncorrected myopia, high myopia, or complications of high
              Published: April 28, 2021
                                                        myopia. Overall the current global cost estimates related to direct health expenditure
              Citation: Sankaridurg P, Tahhan N,        and lost productivity are in the billions. Health expenditure is greater in adults, reflect-
              Kandel H, et al. IMI Impact of            ing the added costs due to myopia-related complications. Unless the current trajectory
              myopia. Invest Ophthalmol Vis             for the rising prevalence of myopia and high myopia change, the costs will continue to
              Sci. 2021;62(5):2.
              https://doi.org/10.1167/iovs.62.5.2
                                                        grow. The past few decades have seen the emergence of several novel approaches to
                                                        prevent and slow myopia. Further work is needed to understand the life-long impact of
                                                        myopia on an individual and the cost-effectiveness of the various novel approaches in
                                                        reducing the burden.
                                                        Keywords: myopia, high myopia, direct costs, lost productivity, quality of life, economic
                                                        impact, disability, utility

              W       orldwide, one-fifth of blindness is due to refractive
                      error, predominantly myopia.1 Myopia (defined as
              a spherical equivalent refraction ≤ −0.50 diopter [D]) is
                                                                                     with a significant risk of complications leading to blind-
                                                                                     ness and vision impairment,3 the global burden of myopia
                                                                                     is likely to increase.
              an inadequately acknowledged global public health prob-                    Understanding the burden of myopia provides a frame-
              lem and chronic condition that affects almost 30% of the               work to assess and address the condition appropriately. At
              world’s population.2 Myopia impacts an individual’s early              the societal and individual levels, detection and interven-
              life, imposes disability by way of poor vision, and is life-           tions aimed at delaying the onset and/or slowing myopia
              long. Depending on the age of the individual, magnitude                progression would reduce the risk of sight-threatening
              of myopia, and geographical setting (e.g. urban versus                 complications as well as the economic burden related to
              remote/rural), it can have severe socio-economic conse-                managing the condition. This would result in better visual
              quences on the individual and, consequently, on society as             outcomes that would in turn translate to economic gains as
              a whole. It appears inevitable that the proportion of people           well as improvements in quality of life (QOL). For example,
              affected by myopia will increase in coming decades. Projec-            a streamlined approach may improve integrated health care
              tions estimate 50% of the global population will be affected           provision at various levels so that the more complex cases
              by myopia in the year 2050, of whom 10% will have high                 are more efficiently channeled or co-managed. This would
              myopia.2 As myopia, particularly high myopia, is associated            reduce costs, reduce waiting times, and facilitate higher and

              Copyright 2021 The Authors
              iovs.arvojournals.org | ISSN: 1552-5783                                                                                             1

                   This work is licensed under a Creative Commons Attribution-NonCommercial-NoDerivatives 4.0 International License.

Downloaded from iovs.arvojournals.org on 08/31/2021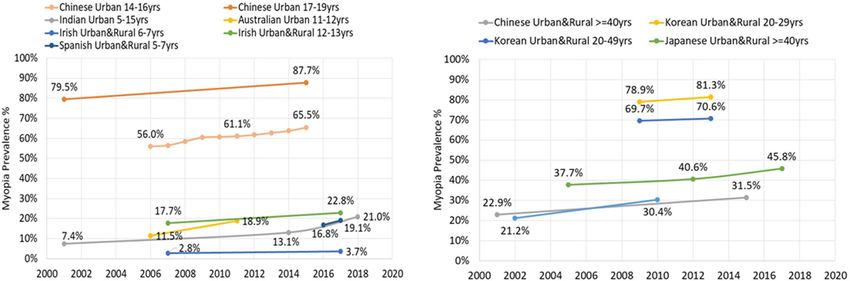
IMI Impact of Myopia                                                           IOVS | Special Issue | Vol. 62 | No. 5 | Article 2 | 2

              earlier rates of detection and more effective intervention for    of myopia prevalence in Chinese children and adolescents
              those at risk of myopia development or progression.               found the prevalence had increased steadily between 2000
                  In this nonsystematic review, we report recent evidence       to 2015 from 25.7% (before 2001), to about 39% (2001–2010)
              on the prevalence of myopia and high myopia and identify          and then to 46.1% (2011–2015).6 Although East Asian coun-
              the direct costs, patient-reported outcomes, and lost produc-     tries have the highest prevalence, an increasing myopic shift
              tivity associated with the disorder. This review will identify    is also observed in other regions of the world. In Australia,
              gaps in our understanding of the condition as well as provide     cross-sectional studies of 12-year-old children reported a
              evidence to support and advocate for developing appropri-         prevalence that increased from 11.5% in 2006 to 18.9%
              ate approaches and policies to manage myopia.                     in 2011.7 In Northern Ireland, the prevalence in 12-year-
                                                                                old children increased from 17.7% in 2007 to 22.8% in
                                                                                2017.8,9 Similarly, prevalence increased from 7.4% to 13.1%
              UNDERSTANDING          THE   BURDEN                               between 2001 and 2014 in New Delhi in children aged 5 to
              Standardized Definition of Myopia                                 15 years,10,11 and was 21.1% 4 years later, a steep increase in
                                                                                myopia.12 In contrast to these reports of rising myopia preva-
              The way myopia is defined or classified is an important           lence, prevalence in children aged 6 to 8 years in Hong Kong
              consideration when attempting to quantify its burden. In          was high, but decreased slightly over 15 years (28.4% in 2001
              descriptive terms, myopia is “a refractive error in which         to 25.0% in 2019).13,14 Although the authors speculate the
              rays of light entering the eye parallel to the optical axis are   role of the academic system, it is possible that differences in
              brought into focus in front of the retina when ocular accom-      administration of cycloplegic drops in this young cohort is
              modation is relaxed. This usually results from the eyeball        responsible for the variation in prevalence.
              being too long from front to back, but can be caused by an            Data from adult populations also indicates an increas-
              overly curved cornea and/or a lens with increased optical         ing myopic shift. Between 2001 and 2015, myopia preva-
              power.”4 In 2019, the taskforce established by the Interna-       lence in adults ≥ 40 years in urban China rose from 22.9%
              tional Myopia Institute (IMI) reviewed the existing published     to 31.5%.15,16 In Korea, between 2008 and 2011, myopia
              terminology, definitions, and thresholds for myopia, includ-      prevalence in 20 to 29-year-olds was 78.9% and increased
              ing the existing World Health Organization (WHO) defi-            in 2013 to 2014 to 81.3%, and in Japan, myopia in adults ≥
              nitions of myopia, and defined myopia as a condition in           40 years increased from 37.7% in 2005 to 45.8% in 2017.17
              which the spherical equivalent is ≤ −0.50 D when ocular           Meta-analysis of studies in Europe show that the age stan-
              accommodation is relaxed, and high myopia as a spheri-            dardized prevalence of myopia increased in older adults,
              cal equivalent of ≤ −6.00 D.4 The WHO expert commit-              where myopia in the 50 to 79 year age group was observed
              tee on myopia defined high myopia as ≤ −5.00 D on the             to be higher by 5.7% in those born later (23.5%) in a decade
              basis that uncorrected myopia of this degree impacts visual       compared to those born earlier (17.8%).18
              acuity (VA) to a level that meets the threshold for blindness         As a result of the rising prevalence of myopia, it follows
              (
IMI Impact of Myopia                                                                  IOVS | Special Issue | Vol. 62 | No. 5 | Article 2 | 3

              TABLE 1. Age and Region-Specific Myopia Prevalence in Children and Adults From 2000 to 2019
              Region                           City/Country        Urban/Rural         Age Group (Yrs.) Year Myopia %                Reference

                                                                                 Children
              East Asia                    Beijing, China          Urban                    14–16      2006     56.0%     Li et al. 20175
                                                                                            14–16      2007     56.5%
                                                                                            14–16      2008     58.5%
                                                                                            14–16      2009     60.5%
                                                                                            14–16      2010     60.8%
                                                                                            14–16      2011     61.1%
                                                                                            14–16      2012     61.8%
                                                                                            14–16      2013     62.8%
                                                                                            14–16      2014     63.8%
                                                                                            14–16      2015     65.5%
                                           Fenghua city, China     Urban                    17–19      2001     79.5%     Chen et al. 201819
                                                                                            17–19      2015     87.7%
                                           South Korea             KHANES IV-V               5–18      2008     64.6%     Lim et al. 2018111
                                                                   KHANES VII                5–18      2016     65.4%     Kim et al. 2020112
              South Asia                   New Delhi, India        Urban                     5–15      2001      7.4%     Murthy et al. 200210
                                           New Delhi, India        Urban                     5–15      2014     13.1%     Saxena et al. 201511
                                           Gurugram, India         Urban                     5–15      2018     21.0%     Singh et al. 201912
              High Income Asia-Pacific     Hong Kong               Urban                      6–8      2000     28.4%     Fan et al. 200113
                                           Hong Kong               Urban                      6–8      2015     25.0%     Yam et al. 201914
              Australasia                  Sydney, Australia       Urban                    11–12      2006     11.5%     French et al. 20137
                                           Sydney, Australia       Urban                    11–12      2011     18.9%
              Western Europe               Spain                   Urban & Rural             5–7       2016     16.8%     Alvarez-Peregrina et al 2019137
                                                                   Urban & Rural             5–7       2017     19.1%
                                           Northern Ireland        Urban & Rural              6–7      2007      2.8%     O’Donoghue, et al. 20108
                                                                   Urban & Rural              6–7      2017      3.7%     Harrington et al 20199
                                           Northern Ireland        Urban & Rural            12–13      2007     17.7%     O’Donoghue et al. 20108
                                                                   Urban & Rural            12–13      2017     22.8%     Harrington et al. 20199
                                                                              Adults
              East Asia                    Beijing, China          Urban   &   Rural        >= 40      2001     22.9%     Xu et al. 200515
                                           Yunnan (Han), China     Urban   &   Rural        >= 40      2015     31.5%     Wang et al. 201916
              High Income Asia Pacific     South Korea             Urban   &   Rural        20–29      2009     78.9%     Kim et al. 2013115
                                           South Korea             Urban   &   Rural        20–29      2013     81.3%     Han et al. 2019116
                                           South Korea             Urban   &   Rural        20–49      2009     69.7%     Kim et al. 2013115
                                           South Korea             Urban   &   Rural        20–49      2013     70.6%     Han et al. 2019116
                                           Hisayama, Japan         Urban   &   Rural        >= 40      2005     37.7%     Ueda et al. 201917
              North Africa and Middle East Tehran, Iran            Urban                    16–25      2002     22.5%     Hashemi et al. 2004138
                                           Aligoudarz city, Iran   Urban                    14–21      2012     33.5%     Hashemi et al. 2014139
                                           Tehran, Iran            Urban                    >= 46      2002     21.2%     Hashemi et al. 2004138
                                           Shahroud city, Iran     Urban                    >= 45      2010     30.4%     Hashemi et al. 2012140

              FIGURE 1. Myopia prevalence from 2000 to 2019 (age and region).

Downloaded from iovs.arvojournals.org on 08/31/2021
IMI Impact of Myopia IOVS | Special Issue | Vol. 62 | No. 5 | Article 2 | 4
TABLE 2. Prevalence of Myopia and High Myopia in Young Adults
High
Myopia %
Region City/Country Urban/Rural Age Group Year Myopia % (≤−6.00 D) Reference
Young Adults
East Asia Fenghua City, Urban 17–19 y 2001 79.5% 7.9% Chen (2018)19
China
17–19 y 2015 87.7% 16.6%
South Korea Urban 19 2010 96.5% 21.6% Jung et al (2012)113
South Korea Rural 19 83.3% 6.8% Lee et al. (2013)114
South Korea Urban and Rural 20–29 y 2009 78.9% 10.9% Kim et al. (2013)115
South Korea Urban and Rural 20–29 y 2013 81.3% 11.1% Han et al. (2019)116
Taiwan Urban 18–24 2010 86.1% 21.2% Lee et al. (2015)117
Taiwan Urban Freshman (first year 1988 91.3% 23.5% Wang et al. (2009)20
university students)
Taiwan Urban Freshman (first year 2005 95.9% 38.4% Wang et al. (2009)20
university students)
Singapore Urban 17–29 2009 81.6% 14.7% Koh et al. 2014118
Middle East Israel 16–22 2002 28.3% 2.0% M 2.3% F Dayan et al. 2005119
stability, and associated morbidity are not fully where.15,17,40 A recent meta-analysis found a pooled preva-
understood. Current evidence shows that myopia is gener- lence of MMD in the world population of 2.1% (increas-
ally detected in children before 10 years of age, but the onset ing from 1.3% in the 40–49 age group to 4.5% in the 70+
may vary from as young as 3 to 4 years to late teenage or age group)41 and found a higher frequency of MMD from
early adulthood depending on ethnic, familial, environmen- data reported from 2007 to 2019 compared to 1993 to 2006.
tal, and geographical factors.25–27 Usually, the condition is Vision impairment from MMD was estimated to have affected
progressive in the early years of life. Two studies found that 10 million people (0.13% of world’s population) in 2015 and,
the annual progression rate was higher in the year before if the trajectory for the rising prevalence of myopia and high
detection and in the year following when myopia was first myopia continues at the same pace, it is set to grow to nearly
detected, but declined thereafter.28,29 Annual progression 56 million (0.6%) by the year 2050.42
data from spectacle wearers of Asian ethnicity found that
the younger the age, the greater the risk of progression, with
7-year-old children progressing approximately 0.9 D/year
whereas progression in 12-year-old children was approx- IMPACT OF MYOPIA ON AFFECTED INDIVIDUALS
imately 0.58 D/year.23,30 In a school-based cohort study Impact of Myopia on Education
conducted in Shanghai, the average 2-year progression of
cycloplegic spherical equivalent refractive error in myopic Numerous studies have shown an association between
children aged 7, 8, and 9 years was 2.0 D, 1.6 D, and 1.8 D, increased near work and myopia, with educational pressures
respectively.31 Younger age at baseline predicted a greater cited for the increasing prevalence of myopia.43,44 Although
risk of high myopia,32 possibly due to the faster progression it is accepted that these factors may be involved in the onset
rate at a younger age.23,29 Although the condition is said to and progression of myopia, the impact of undercorrected
stabilize in teenage years to adulthood, there are no clear or uncorrected myopia on school performance is of inter-
data on when exactly this occurs and, additionally, there are est as there is evidence linking educational outcomes to
reports of onset and progression in adults.33,34 In younger adult health.45 The scholastic performance of students in
age groups, visual disability by way of impaired distance whom myopia is uncorrected relative to those with corrected
vision is the characteristic feature of myopia, although in myopia is a complex area to investigate; however, data from
a smaller number of cases, especially in individuals with randomized studies from China indicate that providing spec-
high myopia, complications, such as retinal breaks, poste- tacles for children with myopia who do not have correction
rior staphylomas, and retinal detachments, may occur.35 can lead to improved academic performance, with demon-
Additionally, a small percent of the population may also strated improvement in mathematics test scores.46,47
suffer complications related to corrective modalities, such A study involving parents, teachers, and students found
as Laser-Assisted In-Situ Keratomileusis (LASIK) and contact poor vision or uncorrected visual deficits in children nega-
lenses.36,37 tively impacted their attention, perseverance, academic
Although there is no threshold or cutoff criterion, increas- performance, and caused psychosocial stress, whereas
ing age is a risk factor for myopia-related complications. receiving corrective spectacles improved the students’
In later years, myopia is associated with an increased risk academic performance and psychosocial wellbeing.48 Board
of cataract, glaucoma, and various conditions affecting the work remains the mainstay of school education in most parts
posterior segment of the eye, such as posterior staphyloma, of the world, although projection or digital technology is
myopic retinopathy, also known as myopic macular degener- becoming increasingly popular, especially in urban areas.49
ation (MMD), and myopic traction retinopathy (Table 3).38,39 An assessment of VA demands for classwork in different
Of these, myopic retinopathy or MMD is fast emerging as class grades found that a VA of 0.3 log MAR (6/12 or 20/40
one of the leading causes of blindness in East Asia and else- Snellen VA) was required for board work.50 Even low grades
Downloaded from iovs.arvojournals.org on 08/31/2021IMI Impact of Myopia IOVS | Special Issue | Vol. 62 | No. 5 | Article 2 | 5
TABLE 3. Complications Observed in Myopic Eyes
Ocular Sign or Condition Myopia/Age of Myope/Prevalence or OR
Cataract High myopia/≥45 yrs/OR-2.79117 ; 2.55118
Glaucoma Any myopia/elderly/pooled OR −1.92119
Posterior vitreous detachment High myopia/20-29 yrs/12.5%120
Myopic maculopathy/Myopic Macular High myopia/>40 yrs/pooled-47.4%38
Degeneration
- Tessellations of fundus
- Diffuse chorioretinal atrophy
- Patchy chorioretinal atrophy
- Lacquer cracks
- Fuchs spot
- Choroidal neovascularization*
- Macular Atrophy
Posterior Staphyloma High myopia/6–19 yrs/12.7%121
- Chorioretinal atrophy High myopia/12–67 yrs/12.0%122
- Macular retinoschisis
- Dome-shaped macula
- Bruch’s membrane defects
Myopic traction maculopathy116 Highly myopic eyes with posterior staphyloma/>40 yrs/Not available
- Retinoschisis
- Foveal detachment
- Macular holes
Retinal detachment High myopia/15–75 yrs/6.3%123
- Epiretinal membranes
- Tractional internal limiting membrane detachment
Peripheral retinal degeneration
- Lattice degeneration High myopia/15–75 yrs/11.8–37.8%123
- White without Pressure High myopia/19–25 yrs/46.5–14.6%124
of myopia can reduce VA beyond this threshold and hence comprehensive data on direct costs to date for myopia have
pose a learning challenge for children with uncorrected or been from Singapore, a country with one of the highest
undiagnosed myopia. Additionally, dioptric blur is found to prevalence rates of myopia anywhere in the world. Data
affect reading performance, with speed of reading reduced gathered from a cross-sectional study in 2006 involving chil-
for large blur.51 dren aged 12 to 17 years, found a mean annual direct cost
While spectacles can help restore vision and enhance of myopia of SG $222 (US $148) and a median cost of SG
academic performance, access to appropriate spectacles and $125 (US $83).59 A more recent paper indicated that costs
adherence with spectacle wear among children is influenced increase substantially as the individual ages.60 The annual
by many factors. Although myopia, more severe refractive direct costs of myopia per person aged 40 years and above
error,52–54 and poorer VA promotes adherence, boys are less for the year 2011 was reported to be SG $900 (US $709), of
likely to be adherent and socio-economic factors, such as which 65% (SG $588 or US $463) was associated with vision
cost, accessibility to spectacles, and parental education, are products and optometry visits. The higher costs for older
cited to be barriers to spectacle wear and compliance.55 individuals relative to costs for children was partly related
There are also psycho-social barriers, such as fear of discrim- to complications from myopia.60
ination, bullying, and negative societal attitudes.53,55,56 The In a study in the United States that included partici-
unmet need for refractive error correction has been reported pants older than 12 years with distance vision impairment,61
in many parts of the world, for example, 27% of children the annual direct costs estimated for refraction and a pair
in rural China have uncorrected VA worse than 20/40 and of glasses varied from US $138.60 to $226.48 in the year
13.1% of children in Philadelphia schools have uncorrected 2000, depending on whether the fee schedule was based
refractive errors. Most of the refractive errors in these cases on Centers for Medicare and Medicaid Services or Medical
was myopia.57,58 Expenditure Panel Survey. This figure is likely a conservative
estimate as it does not take into consideration all the direct
health-related costs as well as non-health costs. In provid-
Estimating Cost of Myopia to Individuals ing this figure, the authors suggested that the fee schedule
Direct costs and productivity loss costs are incurred gathered from the Medical Expenditure Panel Survey (US
by individuals and their families affected by myopia. $226.48) was more reflective of the annual figure because it
Direct costs include expenditure for diagnosis and correc- considered lens types, such as contact lenses, as well as any
tion/management, transport costs, and treatment of morbid- multiple purchases within the year.
ity. Lost productivity costs may include time spent on eye Data gathered from optometry and ophthalmology
examinations or returning to clinics to pick up aids, unpaid sources in China (multiple sources from Zhongshan
caregiver time, lost workplace or home productivity, and the Ophthalmic Centre, AIER hospitals as well as data from
value of loss of QOL. Shanghai Eye Disease Prevention and Treatment Center for
Costs are generally reported as annual costs and, as Anhui, Shanghai, and Yunnan region) suggest that the direct
expected, vary significantly between countries. The most annual cost of vision products (assuming 100% of people
Downloaded from iovs.arvojournals.org on 08/31/2021IMI Impact of Myopia IOVS | Special Issue | Vol. 62 | No. 5 | Article 2 | 6
with myopia purchase spectacles, 10% contact lenses, and is a need for further research, data, and modeling on life-
1.5% orthokeratology) and an eye examination is CN ¥ 809 time costs associated with myopia. Several myopia control
or US $113. If refractive surgery is factored in for 1% of strategies have been shown to significantly slow myopia,63
those with myopia, this cost increases to between US $125 and models demonstrate that such myopia control strate-
to $136. Additionally, data from India (Courtesy: Optometry gies, when applied early and consistently, can significantly
Council of India, L V Prasad Eye Institute, and private prac- reduce the risk of individuals reaching high myopia.23 It is
titioners) suggest that the direct cost of vision products and reported that each diopter increase in myopia increases the
an eye examination in urban India approximates to Rs3460 risk of MMD by 67% or, alternatively, slowing myopia by
or US $48. Additionally, if 1% of those with myopia opt for about 1 D can reduce the likelihood of developing MMD by
refractive surgery, this cost increases to between US $54 to 40%.64 More data are needed to quantify these impacts from
$60. When comparing costs between countries, one must be an economic perspective.
mindful of the relative purchasing power parity to place the
cost in the context of society.
Except for cost estimates from Singapore, costs from Patient-Reported Outcomes – Quality of Life and
other countries do not consider expenditures related to Myopia
pathological myopia. Additionally, the cost estimates for
China and India do not consider multiple purchases in a year Myopia, either uncorrected or corrected, may impact a
and do not consider the more specialized lens requirements person’s QOL and the effect on QOL can be evaluated using
of those with high myopia. Considering that a progressing qualitative (interviews/focus-group discussions)65 or quanti-
and/or a high myope would require more frequent changes, tative patient-reported outcome measures (PROMs), such as
may need specialized lenses and frames, and may attend questionnaires and item-banks.66 PROMs used for myopia
more frequent or specialist examinations, their costs are (Table 4) contain items on symptoms,67–72 activity limita-
likely to be higher than the reported averages. If the propor- tion,67,69–72 emotional impact,67,68,71,72 social impact,67,69,72
tional increase due to myopia in an older population from and inconvenience69,72 (Fig. 2). These surveys were intended
the Singapore data can be applied to China and India, then to evaluate QOL with myopia correction strategies, largely
the cost associated with myopia in the older population refractive surgery outcomes, and thus lack sufficient content
would approximate to US $510 and $218 in China and India, on QOL issues for individuals with myopia in low-resource
respectively. Additionally, these figures exclude costs associ- settings and uncorrected myopes. For example, people in
ated with newer myopia control management options, such low-resource settings may experience greater inconvenience
as novel spectacles and contact lenses, which are likely to be having to travel far to have their myopia corrected, whereas
greater than those of a standard lens. In addition to the direct having vision sufficient to drive may be of greater concern
medical costs, affected households and society incur addi- for dwellers from high income countries.65,73
tional productivity costs relating to caregiver time, absen- Many existing myopia-specific PROMs are either first
teeism from educational activities, reduced productivity, and generation or second-generation questionnaires (classified
reduced QOL. Such costs are also likely to vary from country based on the development or validation theory used74 ) that
to country. suffer from limitations of being static and inflexible, as
Although comprehensive cost data are limited, it is every item is administered to every individual irrespective
evident that there is a significant financial burden associ- of their QOL issues. Additionally, clinical, demographic, and
ated with myopia, particularly for poorer communities in socio-economic characteristics influence QOL and therefore
countries with higher myopia prevalence and for individu- results vary between populations and groups.73,75 Despite
als with high myopia and this is likely to rise in the future. their limitations, existing PROMs have proven valuable in
Furthermore, unlike other conditions or diseases that may evaluating QOL impacts of myopia and demonstrate that
result in a one-off or a short-term cost, the chronic nature of the impact of myopia on QOL is significant. The detrimental
myopia translates to a life-long burden. The Singapore study impacts of myopia have been observed in diverse aspects
for adult myopia estimated a lifetime cost of SG $21,616 (US of daily living, including activity limitation, economic well-
$17,020) for those with 80 years’ duration of myopia.60 being, emotional well-being, symptoms, and social well-
It is therefore important that cost data are evaluated in being.66,73,75–77 Generally, poorer QOL has been demon-
the context of (a) relationship between incurred costs to strated for uncorrected refractive error/poor vision and
health and productivity gains, and (b) ways to reduce burden high myopia as well as with complications associated with
(i.e. are the costs justified in terms of planned or achieved myopia. In a group of 16-year-old patients, myopia was an
benefits or outcomes?). For the former issue, considering the independent risk factor for poorer QOL for both distance
Singapore data, a value of $709 per person for myopia care and near vision, whereas hyperopia was not associated with
for adults in Singapore was considered to equate to < 2% any difficulty.78 Although data on the impact of uncorrected
of Gross Domestic Product (GDP) per person at that time myopia on QOL and the benefits of spectacle wear are
in comparison to blindness and moderate distance vision scarce, in a study of 2346 adolescents from southwestern
impairment representing potential lost productivity of 18.7% China,79 where spectacle utilization was low, adolescents
and 3.1% of GDP, respectively.62 This, therefore, represented not using spectacles had lower psychosocial, emotional,
a positive trade-off when investing in myopia. However, the and social functioning health-related QOL scores. Similarly,
cost-benefit of using GDP or any other suitable metric may healthy adolescents with reduced VA reported lower health-
vary across countries and may or may not result in a posi- related QOL, including social functioning and school func-
tive trade-off. For example, the direct vision costs reported tioning in two separate studies conducted in Singapore and
for China and India without the additional costs related to China, although the study from Singapore did not find differ-
age approximate to 1.5% to 3% of their GDP per capita, ences between refractive error types.80,81
but if age-related changes are factored in, these figures will In general, people with a higher magnitude of myopia
significantly rise to 5% to 10% of GDP per capita. There are likely to have poorer QOL,76,82 and the impact of high
Downloaded from iovs.arvojournals.org on 08/31/2021IMI Impact of Myopia IOVS | Special Issue | Vol. 62 | No. 5 | Article 2 | 7
TABLE 4. Patient Reported Outcome Measures Used in Myopia
Types Sub-Types Examples of Patient-Reported Outcome Measures
Generic (non-disease Domain Emotional well-being:
specific) - Hospital Anxiety and Depression Scale (HADS),82
- General Well-Being Schedule (GWBS)83
- General Health Questionnaire (GHQ),129
- Hudson Index of Self-Esteem (HISE),129
- Adjective check list130
Pain: McGill Pain Questionnaire131
Ophthalmic (non- Vision - National Eye Institute Visual Function Questionnaire (NEI-VFQ),82,90
myopia-specific) - Vision Related effect on Quality of Life (VQOL, aka Vision Core Measure-1 [VCM1])76
- Visual Function Index–14 (VF–14)76,86
Refractive error - Quality of Life Impact of Refractive Correction (QIRC)87
- National Eye Institute Refractive Quality of Life (NEI-RQL)132,133
- Refractive Status and Vision Profile (RSVP)85,134
Myopia-specific Myopia correction Institute for Eye Research Multidimensional Quality of Life for Myopia (MQLM)67
Intervention RK: Prospective Evaluation of Radial Keratotomy (PERK) Study questionnaire68
PRK: Canadian Refractive Surgery Research Group Quality of Vision Questionnaire
(QVQ)69
LASIK: Subjective Vision Questionnaire (SVQ)70 and Myopia-specific Quality of Life
Questionnaire (MQLQ)71
Population Children:
- Pediatric Refractive Error Profile (PREP)72,88,93,94,135
- Modified QIRC91
Health economic Generic - Time-Trade-off100,103
(utility) - Standard Gamble103
Ophthalmic - Vision Quality of Life index (VISQoL)136
LASIK, Laser-assisted In Situ Keratomileusis; PRK, Photorefractive Keratectomy; RK, Radial Keratotomy.
FIGURE 2. Quality of life issues explored in myopia specific patient reported outcome measures.
myopia (−10.00 D) has been found to be similar to that groups.76,83 In adults with high myopia (worse than −8.00
of keratoconus.76 Individuals with high myopia have higher D), functional status in daily life was reduced in those
QOL concerns regarding cosmetic appearance, especially if with myopia compared to controls and was represented by
they have to wear thick lenses, and they spend more money poor scores on disability (e.g. reading signs), handicap (e.g.
on spectacles than those with low or moderate myopia, unable to perform studies and jobs), and support (under-
as the cost of thinner and lighter (high index) spectacle standing from the family structure).83 More significantly,
lenses is higher. However, the expenditure for contact lenses Yokoi et al. reported that about 25% of patients with high
was found to be similar between high and low myopia myopia were likely to have depression and anxiety disorders,
Downloaded from iovs.arvojournals.org on 08/31/2021IMI Impact of Myopia IOVS | Special Issue | Vol. 62 | No. 5 | Article 2 | 8
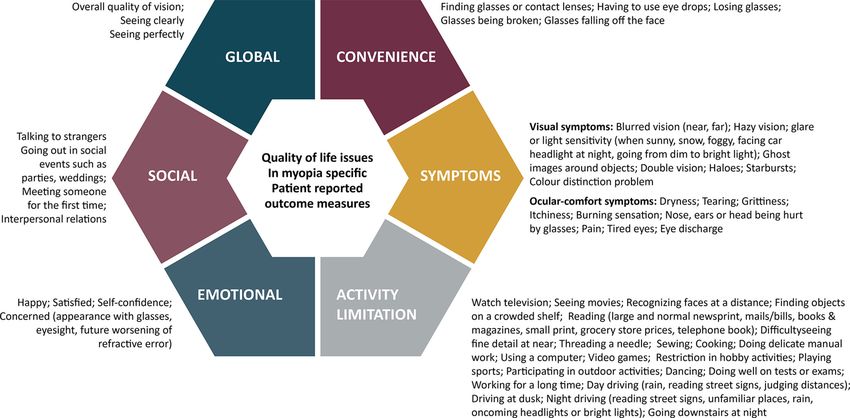
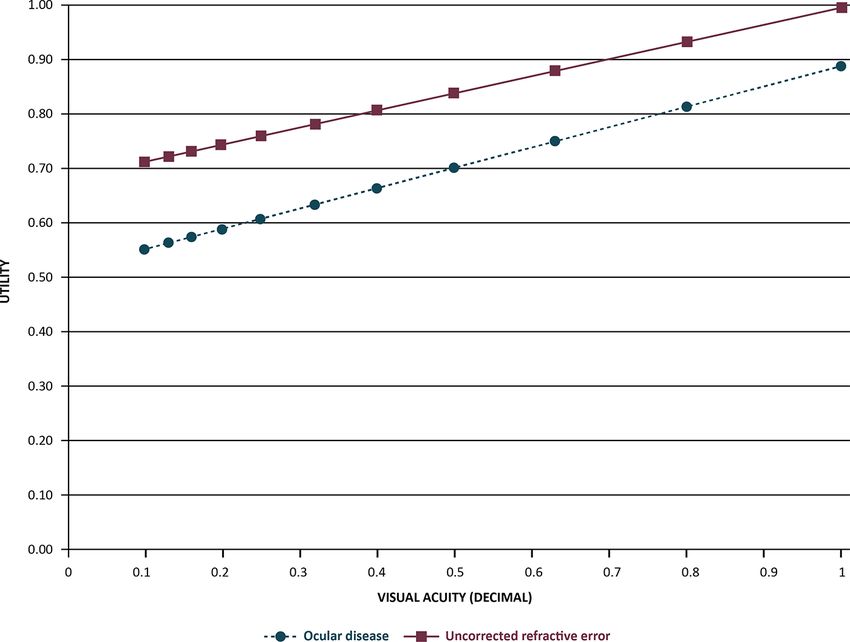
FIGURE 3. Relationship between utility and visual acuity.100
which could substantially lower QOL.82 In older individuals, health conditions can be compared, for example, the utility
those with advanced MMD had poorer vision-related QOL for severe angina has been reported as 0.5,97 whereas util-
than those without.84 ity of complete blindness was reported as 0.26.98 Utilities
Additionally, the impact of myopia on QOL differs by associated with ocular conditions, including refractive error,
type of myopia. In presbyopic populations, individuals were related to the level of VA loss (Fig. 3).99,100 For uncor-
with myopic astigmatism have worse QOL than spherical rected myopia in adults,100 decrement in utility significantly
myopia.85 correlated with higher levels of myopia (see Fig. 3).100 Inter-
Correction improves QOL, particularly bringing improve- estingly, utilities reported for uncorrected myopia (caus-
ments to visual functioning and symptoms.71,77,86–89 ing distance vision impairment) are reportedly similar to
However, it should be noted that refractive correction those for uncorrected presbyopia (near vision impairment;
may not restore QOL to an emmetropic level.88,90,91 For Table 5) and, generally, utility values for refractive error were
example, spectacle wearers may have concerns about reportedly higher than utility values for ocular disease (see
cosmetic appearance and the inconveniences of having to Table 5, Fig. 3). Utility studies evaluating corrected myopia
look after their spectacles,73 contact lens wearers may have (one with teenagers,101 one with medical students,102 and
concerns about possible complications, and those who have one with adults103 ) found utility to be close to perfect health
undergone refractive surgery may have to live with glare and ranged from 0.93 to 0.97. A Chinese study involving 442
and dry eye-related symptoms.73,92 patients with myopia who were scheduled to undergo refrac-
In children and teenagers with myopia, a better vision- tive surgery found contact lens users had a significantly
related QOL has been reported with contact lenses than better QOL (higher utility) compared to spectacle wearers.103
with spectacles, including with contact lenses designed for Although, research has made utility data available for input
slowing myopia.93–96 Areas that showed improvement were in economic evaluations of myopia, no such studies are avail-
increased satisfaction with correction, activities, and appear- able in the current literature.
ance. Orthokeratology lenses were also well-accepted and Disability weight estimates are led by a consortium
brought significant improvement in QOL in children with of research collaborators through the Global Burden of
myopia.88 Disease (GBD) program. Table 6 provides a list of disability
Although the above data have heterogeneity in factors, weights for various degrees of vision impairment and other
including study populations and choice of PROMs, it is clear comparable health disorders calculated since 2004.104 Signif-
that uncorrected myopia and high myopia are associated icant debate in the literature about the validity of methods
with poorer or reduced outcomes for vision and health- used to derive recent figures has ensued, with researchers
related QOL measures. It is also clear that QOL can be ascribing poor face validity of assessment methods as a
improved with appropriate correction for those with uncor- factor for unreasonably low estimates for vision impairment
rected myopia. However, for those with high myopia, there and blindness compared to previous values in 2004.105–107
remain gaps in the existing literature on interventions that Global Health Estimates (GHEs) have been provided by
provide improvements in QOL. the WHO in recent years to counter these low values, but
For economic evaluations, such as cost-effectiveness anal- in spite of revisions, current disability weights for vision
ysis, QOL data can be used as quantifiable inputs for assess- impairment and blindness are still substantially lower than
ing the value of health interventions. Here, QOL data are those from 2004.104 Disability weights have been used as
input on a 0 to 1 scale for utility (0 = death and 1 = perfect inputs in economic evaluations of myopia for quantifying
health) or a disability weight (0 = perfect health and 1 = indirect costs to society, including lost productivity.108,109
death or complete disability). In such evaluations, disparate Using low disability weights in economic evaluations would
Downloaded from iovs.arvojournals.org on 08/31/2021IMI Impact of Myopia IOVS | Special Issue | Vol. 62 | No. 5 | Article 2 | 9
TABLE 5. Utility Findings for Uncorrected Refractive Error and Ocular Disease100
Uncorrected Ocular Disease Ranges
Presbyopia: Myopia: Only Refractive Error:
Only Near* Distance† Both Distance and
Utility (0-Death; Impaired Impaired Near Impaired
1-Perfect Health) (Mean ± SD) (Mean ± SD) (Mean ± SD) Moderate VI Severe VI
LogMAR VA 0.43 ± 0.17 0.50 ± 0.24 0.64 ± 0.27 0.2–0.7 0.61-NLP
Snellen VA 6/15–6/19 6/19 6/24 6/9.5–6/30 6/24-NLP
Decimal VA 0.37 0.32 0.23 0.6–0.2 0.25-NLP
Time-trade-off utility 0.81 ± 0.17 0.82 ± 0.16 0.68 ± 0.25 0.67 0.64–0.47 (0.57)
VA, visual acuity; VI, visual impairment;
* VA measure at 40 cm.
† VA measure at 6 m.
TABLE 6. Disability Weights for Vision Loss and Various Health States104
Disability Weights (0-Perfect Health; 1-Death or Complete Disability)
Health State GHE 2015 GHE 2012 GDB 2015 GDB 2010 GDB 2004
Distance vision: mild impairment 0.005 0.005 0.003 0.004
Distance vision: moderate impairment 0.089 0.089 0.031 0.033 0.17
Distance vision: severe impairment 0.314 0.314 0.184 0.191 0.43
Distance vision blindness 0.338 0.338 0.187 0.195 0.6
Near vision impairment 0.013 0.02
Hearing loss: mild 0.01 0.005 0.01 0.005 0.04
Hearing loss: moderate 0.05 0.05 0.027 0.023 0.12
Hearing loss: severe 0.167 0.167 0.158 0.031 0.333
Hearing loss: profound 0.281 0.281 0.204 0.032 0.333
Hearing loss: complete 0.281 0.281 0.215 0.033
Infertility: primary 0.056 0.056 0.008 0.011 0.18
Dementia: mild 0.165 0.165 0.069 0.082
Dementia: moderate 0.388 0.388 0.377 0.346 0.666
Dementia: severe 0.545 0.545 0.449 0.438 0.94
GHE, Global Health Estimates; GBD, Global Burden of Disease.
under-represent the true impact and economic conse- significantly greater compared to other diseases or medical
quences of visually impairing and blinding conditions, such conditions.
as high myopia. This could lead to lower government priori- In a more recent conference proceeding,109 the global
tization for health spending relative to other medical condi- costs of myopia and directs costs (including examinations,
tions. cost of spectacles and lenses, LASIK, care for complications
such as cataract, retinopathy, and glaucoma) were estimated
ECONOMIC IMPACT OF MYOPIA ON SOCIETY to be US $358.7 billion in 2019 and projected to rise to US
$870 billion in 2050. Importantly, these data indicate that
Although limited economic evaluations of myopia are avail- whereas costs related to spectacles and lenses are set to
able in the literature, the existing data provide some signif- double, costs related to cataract care and myopic retinopathy
icant insights on the current and future burden. With are estimated to quadruple.
respect to direct health expenditure, data from Singapore In addition to the economic burden associated with
suggested an annual SG $959 million (US $755 million) in direct costs, the burden of productivity costs associated
2011 for direct costs associated with myopia in terms of with myopia is also significant. Potential lost productivity
eye examinations, vision correction, and transport. When due to vision impairment was estimated at US $244 billion
placed in context, these are significantly greater than those from uncorrected myopia and US $6 billion from MMD in
reported for other chronic conditions in Singapore, such as 2015.108 These estimates do not include children < 15 years
Parkinson’s disease (US $23–41 million), chronic obstructive of age. Another study reported a productivity loss of about
pulmonary disease (US $9 million), and acute primary angle- US $94.5 billion in 2019 from severe vision impairment and
closure glaucoma (US $0.2–0.3 million). Even though indi- blindness projected to rise to US $229.3 billion in 2050.109
vidual costs of myopia are relatively low in the early years, Key points that arise from these findings are: first, global
the higher societal costs are driven by the fact that myopia costs of myopia and high myopia are set to rise substan-
is more prevalent and complications associated with higher tially in the future due the increasing prevalence of myopia.
magnitudes of myopia are more common later in life. As The costs attributable to high myopia and related compli-
Singapore has a high prevalence of myopia and high myopia, cations, such as MMD, as a percent of overall costs will
it may be inferred from this valuation that countries, partic- be rising due to the disproportionately higher increase in
ularly those in East Asia with similar prevalence rates, carry the prevalence of high myopia relative to myopia overall.
a similar burden profile whereby the costs of myopia are Second, significant benefits in productivity can be gained by
Downloaded from iovs.arvojournals.org on 08/31/2021IMI Impact of Myopia IOVS | Special Issue | Vol. 62 | No. 5 | Article 2 | 10
managing uncorrected myopia. Even though myopia correc- mation that will facilitate optimal health resource allocation
tion may increase direct health expenditure, the benefits decisions.
due to improved productivity are significantly greater than
the costs associated with managing the burden. Indeed, it
has been reported that the global productivity losses far Acknowledgments
exceed estimated costs of providing the world’s popula- The authors thank Monica Jong for facilitation of the process.
tion with refractive error correction, including establish-
ing, maintaining, and operating refractive care facilities.110 Supported by the International Myopia Institute. The publica-
Third, myopia control strategies that prevent the onset of tion costs of the International Myopia Institute reports were
myopia and/or slow the progression of myopia may result supported by donations from the Brien Holden Vision Institute,
in long term savings in direct and indirect health spending Carl Zeiss Vision, Cooper Vision, Essilor, and Alcon.
for both the individual and society. However, these interven-
tions do often come at a higher price in the early years and Disclosure: P. Sankaridurg, BHVI (E), co-inventor on multiple
cost-effectiveness evaluations, which weigh the initial outlay patents related to myopia (P), Alcon (R), SEED (R), Mark Ennovy
of costs against the long-term benefits for these strategies (R), Carl Zeiss Vision (R); N. Tahhan, BHVI (E); H. Kandel,
None; T. Naduvilath, BHVI (E), co-inventor on patent related to
remain to be determined.
myopia (P); H. Zou, None; K.D. Frick, None; S. Marmamula,
None; D.S. Friedman, None; E. Lamarouex, None; J. Keeffe,
None; J.J. Walline, Bausch + Lomb (F); T.R. Fricke, BHVI (E);
SUMMARY V. Kovai, None; S. Resnikoff, None
The prevalence of myopia is high and rising worldwide with
consequences spanning from childhood to late adult life. References
Recent evidence reveals that the prevalence of high myopia
is growing at a faster rate than the prevalence of overall 1. Bourne RRA, Flaxman SR, Braithwaite T, et al. Magnitude,
temporal trends, and projections of the global prevalence
myopia in conjunction with rising rates of serious blinding of blindness and distance and near vision impairment: a
complications associated with high myopia, notably MMD. systematic review and meta-analysis. Lancet Glob Health.
East Asian countries have a higher prevalence of myopia 2017;5(9):e888–e897.
and high myopia and therefore carry a major share of the 2. Holden BA, Fricke TR, Wilson DA, et al. Global prevalence
global burden. of myopia and high myopia and temporal trends from 2000
For the individual, particularly a young individual, when through 2050. Ophthalmology. 2016;123(5):1036–1042.
vision is impaired either due to uncorrected myopia or 3. Fricke TR, Jong M, Naidoo KS, et al. Global prevalence
due to complications associated with myopia, academic of visual impairment associated with myopic macular
performance and psychosocial well-being are likely to be degeneration and temporal trends from 2000 through
affected. In adults, myopia results in significant losses in 2050: Systematic review, meta-analysis and modelling. Br
productivity and negative impact on QOL. QOL is adversely J Ophthalmol. 2018;102(7):855–862.
affected by uncorrected myopia, high myopia, and compli- 4. Flitcroft DI, He M, Jonas JB, et al. IMI – Defining and
cations of high myopia. Although certain corrective modal- classifying myopia: A proposed set of standards for clini-
ities appear to improve QOL in certain domains, further cal and epidemiologic studies. Investig Ophthalmol Vis Sci.
2019;60(3):M20–M30.
information is needed on interventions that provide QOL
5. Li Y, Liu J, Qi P. The increasing prevalence of myopia
benefits for those with high myopia. Conventional correc-
in junior high school students in the Haidian District of
tion of myopia restores vision but does not slow progression, Beijing, China: A 10-year population-based survey. BMC
and direct health expenditure related to myopia is much Ophthalmol. 2017;17(1):88.
higher in older individuals, partly due to costs associated 6. Dong L, Kang YK, Li Y, Wei W, Bin Jonas J. Prevalence
with myopia-related complications. Additionally, there is the and time trends of myopia in children and adolescents
burden related to lost productivity; although the majority of in CHINA: a systemic review and meta-analysis. Retina.
the current burden is due to uncorrected myopia, data indi- 2019;40(3):399–411.
cate that the proportion resulting from vision impairment 7. French AN, Morgan IG, Burlutsky G, Mitchell P, Rose KA.
due to complications of high myopia will rise in the future. Prevalence and 5- to 6-year incidence and progression
Currently, the global costs related to direct health expen- of myopia and hyperopia in Australian schoolchildren.
diture and lost productivity as a result of myopia are in the Ophthalmology. 2013;120(7):1482–1491.
range of several hundred billion dollars annually. Unless the 8. O’Donoghue L, McClelland JF, Logan NS, Rudnicka AR,
current trajectory for the rising prevalence of myopia and Owen CG, Saunders KJ. Refractive error and visual impair-
high myopia is lowered, the costs will continue to grow. ment in school children in Northern Ireland. Br J Ophthal-
mol. 2010;94(9):1155–1159.
Shifting the trajectory requires a coordinated global effort
and it is encouraging that there have been some successes 9. Harrington SC, Stack J, Saunders K, O’Dwyer V. Refractive
error and visual impairment in Ireland schoolchildren. Br
with optical, environmental, and pharmaceutical strategies J Ophthalmol. 2019;103(8):1112–1118.
to prevent the onset and/or effectively slow the progression
10. Murthy GVS, Gupta SK, Ellwein LB, et al. Refractive error
of myopia. An early and appropriate intervention mitigates in children in an urban population in New Delhi. Investig
the risks and consequences related to uncorrected vision. Ophthalmol Vis Sci. 2002;43(3):623–631.
More importantly, it can reduce the risk of the eye progress- 11. Saxena R, Vashist P, Tandon R, et al. Prevalence of myopia
ing to higher levels of myopia and thus have a positive and its risk factors in urban school children in Delhi:
impact on reducing the burden. Assessment of the costs The North India myopia study (NIM study). PLoS One.
and cost-effectiveness of these various interventions is in the 2015;10(2):e0117349.
early stages. Such research will provide individuals, govern- 12. Singh NK, James RM, Yadav A, Kumar R, Asthana S,
ments, and other decision makers with quantifiable infor- Labani S. Prevalence of myopia and associated risk
Downloaded from iovs.arvojournals.org on 08/31/2021IMI Impact of Myopia IOVS | Special Issue | Vol. 62 | No. 5 | Article 2 | 11
factors in schoolchildren in North India. Optom Vis Sci. 31. Ma Y, Zou H, Lin S, et al. Cohort study with 4-year
2019;96(3):200–205. follow-up of myopia and refractive parameters in primary
13. Fan DSP, Lam DSC, Lam RF, et al. Prevalence, incidence, schoolchildren in Baoshan District, Shanghai. Clin Exp
and progression of myopia of school children in Hong Ophthalmol. 2018;46(8):861–872.
Kong. Investig Ophthalmol Vis Sci. 2004;45(4):1071–1075. 32. Parssinen O, Kauppinen M. Risk factors for high myopia:
14. Yam JC, Tang SM, Kam KW, et al. High prevalence of a 22-year follow-up study from childhood to adulthood.
myopia in children and their parents in Hong Kong Acta Ophthalmol. 2019;97(5):510–518.
Chinese Population: the Hong Kong Children Eye Study 33. Iribarren R, Cortinez MF, Chiappe JP. Age of first distance
[published online ahead of print Jan, 24, 2020]. Acta prescription and final myopic refractive error. Ophthalmic
Ophthalmol, https://doi.org/10.1111/aos.14350. Epidemiol. 2009;16(2):84–89.
15. Xu L, Li J, Cui T, et al. Refractive error in urban 34. McBrien NA, Adams DW. A longitudinal investigation of
and rural adult Chinese in Beijing. Ophthalmology. adult-onset and adult-progression of myopia in an occu-
2005;112(10):1676–1683. pational group: refractive and biometric findings. Investig
16. Wang M, Cui J, Shan G, et al. Prevalence and risk factors Ophthalmol Vis Sci. 1997;38(2):321–333.
of refractive error: a cross-sectional study in Han and Yi 35. Tsai ASH, Wong CW, Lim L, et al. Pediatric retinal detach-
adults in Yunnan, China. BMC Ophthalmol. 2019;19(1):33. ment in an Asian population with high prevalence of
17. Ueda E, Yasuda M, Fujiwara K, et al. Trends in the preva- myopia: clinical characteristics, surgical outcomes, and
lence of myopia and myopic maculopathy in a Japanese prognostic factors. Retina. 2019;39(9):1751–1760.
population: the Hisayama study. Investig Ophthalmol Vis 36. Lim CHL, Stapleton F, Mehta JS. Review of contact lens–
Sci. 2019;60(8):2781–2786. related complications. Eye Contact Lens. 2018;44(Suppl
18. Williams KM, Bertelsen G, Cumberland P, et al. Increasing 2):S1–S10.
prevalence of myopia in Europe and the impact of educa- 37. Sakimoto T, Rosenblatt MI, Azar DT. Laser eye surgery for
tion. Ophthalmology. 2015;122(7):1489–1497. refractive errors. Lancet. 2006;367(9529):1432–1447.
19. Chen M, Wu A, Zhang L, et al. The increasing prevalence of 38. Yokoi T, Ohno-Matsui K. Diagnosis and treatment of
myopia and high myopia among high school students in myopic maculopathy. Asia Pac J Ophthalmol (Phila).
Fenghua City, Eastern China: a 15-year population-based 2018;7(6):415–421.
survey. BMC Ophthalmol. 2018;18(1):159. 39. Chang L, Pan CW, Ohno-Matsui K, et al. Myopia-related
20. Wang TJ, Chiang TH, Wang TH, Lin LLK, Shih YF. fundus changes in Singapore adults with high myopia. Am
Changes of the ocular refraction among freshmen in J Ophthalmol. 2013;155(6):991–999.
National Taiwan University between 1988 and 2005. Eye. 40. Hsu WM, Cheng CY, Liu JH, Tsai SY, Chou P. Prevalence
2009;23(5):1168–1169. and causes of visual impairment in an elderly Chinese
21. Ma Y, Qu X, Zhu X, et al. Age-specific prevalence of population in Taiwan: the Shihpai Eye Study. Ophthalmol-
visual impairment and refractive error in children aged 3– ogy. 2004;111(1):62–69.
10 years in Shanghai, China. Investig Ophthalmol Vis Sci. 41. Zou M, Wang S, Chen A, et al. Prevalence of myopic
2016;57(14):6188–6196. macular degeneration worldwide: a systematic review
22. Donovan L, Sankaridurg P, Ho A, Naduvilath T, Smith and meta-analysis. Br J Ophthalmol. 2020;104(12):1748–
EL, III, Holden BA. Myopia progression rates in urban 1754.
children wearing single-vision spectacles. Optom Vis Sci. 42. Fricke TR, Jong M, Naidoo KS, et al. Global prevalence
2012;89(1):27–32. of visual impairment associated with myopic macular
23. Sankaridurg PR, Holden BA. Practical applications to degeneration and temporal trends from 2000 through
modify and control the development of ametropia. Eye. 2050: systematic review, meta-analysis and modelling. Br J
2014;28(2):134–141. Ophthalmol. 2018;102(7):855–862.
24. Chua SYL, Sabanayagam C, Cheung YB, et al. Age of onset 43. Morgan I, Rose K. How genetic is school myopia? Prog
of myopia predicts risk of high myopia in later child- Retin Eye Res. 2005;24(1):1–38.
hood in myopic Singapore children. Ophthalmic Physiol 44. Morgan IG, French AN, Ashby RS, et al. The epidemics
Opt. 2016;36(4):388–394. of myopia: aetiology and prevention. Prog Retin Eye Res.
25. Williams KM, Hysi PG, Nag A, Yonova-Doing E, Venturini 2018;62:134–149.
C, Hammond CJ. Age of myopia onset in a British 45. Case A, Fertig A, Paxson C. The lasting impact of childhood
population-based twin cohort. Ophthalmic Physiol Opt. health and circumstance. J Health Econ. 2005;24(2):365–
2013;33(3):336–345. 389.
26. Dirani M, Shekar SN, Baird PN. Adult-onset myopia: The 46. Ma X, Zhou Z, Yi H, et al. Effect of providing free glasses on
genes in myopia (GEM) twin study. Investig Ophthalmol children’s educational outcomes in China: cluster random-
Vis Sci. 2008;49(8):3324–3327. ized controlled trial. BMJ. 2014;349:g5740.
27. Ma Y, Qu X, Zhu X, et al. Age-specific prevalence of 47. Ma Y, Congdon N, Shi Y, et al. Effect of a local vision care
visual impairment and refractive error in children aged 3– center on eyeglasses use and school performance in rural
10 years in Shanghai, China. Investig Ophthalmol Vis Sci. China a cluster randomized clinical trial. JAMA Ophthalmol.
2016;57(14):6188–6196. 2018;136(7):731–737.
28. Mutti DO, Hayes JR, Mitchell GL, et al. Refractive error, 48. Dudovitz RN, Izadpanah N, Chung PJ, Slusser W. Parent,
axial length, and relative peripheral refractive error before teacher, and student perspectives on how corrective lenses
and after the onset of myopia. Investig Ophthalmol Vis Sci. improve child wellbeing and school function. Matern Child
2007;48(6):2510–2519. Health J. 2016;20(5):974–983.
29. Xiang F, He M, Morgan IG. Annual changes in refrac- 49. Hinterlong JE, Holton VL, Chiang CC, Tsai CY, Liou
tive errors and ocular components before and after the YM. Association of multimedia teaching with myopia:
onset of myopia in Chinese children. Ophthalmology. A national study of school children. J Adv Nurs.
2012;119(7):1478–1484. 2019;75(2):3643–3653.
30. Liao C, Ding X, Han X, et al. Role of parental refractive 50. Negiloni K, Ramani KK, Sudhir RR. Do school class-
status in myopia progression: 12-year annual observation rooms meet the Visual requirements of children and
from the Guangzhou Twin Eye Study. Invest Ophthalmol recommended vision standards? PLoS One. 2017;12(4):
Vis Sci. 2019;60(10):3499–3506. e0174983.
Downloaded from iovs.arvojournals.org on 08/31/2021IMI Impact of Myopia IOVS | Special Issue | Vol. 62 | No. 5 | Article 2 | 12
51. Chung STL, Jarvis SH, Cheung SH. The effect of keratectomy: Part 1: Development and validation of a
dioptric blur on reading performance. Vision Res. survey questionnaire. Ophthalmology. 2000;107(9):1783–
2007;47(12):1584–1594. 1789.
52. Wedner S, Masanja H, Bowman R, Todd J, Bowman R, 70. Fraenkel G, Comaish I, Lawless MA, et al. Development of a
Gilbert C. Two strategies for correcting refractive errors in questionnaire to assess subjective vision score in myopes
school students in Tanzania: randomised comparison, with seeking refractive surgery. J Refract Surg. 2004;20(1):10–
implications for screening programmes. Br J Ophthalmol. 19.
2008;92(1):19–24. 71. Lee J, Lee J, Park K, Cho W, Kim JY, Kang HY. Assessing
53. Gogate P, Mukhopadhyaya D, Mahadik A, et al. Specta- the value of laser in situ keratomileusis by patient-reported
cle compliance amongst rural secondary school children outcomes using quality of life assessment. J Refract Surg.
in Pune district, India. Indian J Ophthalmol. 2013;61(1):8– 2005;21(1):59–71.
12. 72. Walline JJ, Jones LA, Chitkara M, et al. The adolescent and
54. Khandekar R, Mohammed AJ, Al Raisi A. Compliance of child health initiative to encourage vision empowerment
spectacle wear and its determinants among schoolchildren (ACHIEVE) study design and baseline data. Optom Vis Sci.
of Dhakhiliya region of Oman: a descriptive study. J Sci Res 2006;83(1):37–45.
Med Sci. 2002;4(1-2):36–43. 73. Kandel H, Khadka J, Goggin M, Pesudovs K. Impact of
55. Morjaria P, McCormick I, Gilbert C. Compliance and refractive error on quality of life: a qualitative study. Clin
predictors of spectacle wear in schoolchildren and reasons Exp Ophthalmol. 2017;45(7):677–688.
for non-wear: a review of the literature. Ophthalmic 74. Pesudovs K. Item banking: a generational change in
Epidemiol. 2019;26(6):367–377. patient-reported outcome measurement. Optom Vis Sci.
56. Narayanan A, Kumar S, Ramani KK. Spectacle compli- 2010;87(4):285–293.
ance among adolescents: A qualitative study from Southern 75. Kandel H, Khadka J, Fenwick EK, et al. Constructing item
India. Optom Vis Sci. 2017;94(5):582–587. banks for measuring quality of life in refractive error.
57. He M, Huang W, Zheng Y, Huang L, Ellwein LB. Refrac- Optom Vis Sci. 2018;95(7):575–587.
tive error and visual impairment in school children in rural 76. Rose K, Harper R, Tromans C, et al. Quality of life in
Southern China. Ophthalmology. 2007;114(2):374–382. myopia. Br J Ophthalmol. 2000;84:1031–1034.
58. Mayro EL, Hark LA, Shiuey E, et al. Prevalence of uncor- 77. Kandel H, Khadka J, Shrestha MK, et al. Uncorrected and
rected refractive errors among school-age children in the corrected refractive error experiences of Nepalese adults:
school district of Philadelphia. J AAPOS. 2018;22(3):214– a qualitative study. Ophthalmic Epidemiol. 2018;25(2):147–
217. 161.
59. Lim MCC, Gazzard G, Sim EL, Tong L, Saw SM. Direct costs 78. Hsieh MH, Lin JC. Association of refractive error with
of myopia in Singapore. Eye. 2009;23(5):1086–1089. vision-related quality of life in junior high school students.
60. Zheng YF, Pan CW, Chay J, Wong TY, Finkelstein E, Taiwan J Ophthalmol. 2016;6(1):32–35.
Saw SM. The economic cost of myopia in adults aged 79. Qian DJ, Zhong H, Li J, Liu H, Pan CW. Spectacles
over 40 years in Singapore. Investig Ophthalmol Vis Sci. utilization and its impact on health-related quality of life
2013;54(12):7532–7537. among rural Chinese adolescents. Eye. 2018;32(12):1879–
61. Vitale S, Cotch MF, Sperduto R, Ellwein L. Costs of refrac- 1885.
tive correction of distance vision impairment in the United 80. Pan CW, Wu RK, Wang P, Li J, Zhong H. Reduced
States, 1999-2002. Ophthalmology. 2006;113(12):2163– vision, refractive errors and health-related quality of
2170. life among adolescents in rural China. Clin Exp Optom.
62. Congdon N, Burnett A, Frick K. The impact of uncorrected 2018;101(6):758–763.
myopia on individuals and society. Community Eye Health. 81. Wong HB, Machin D, Tan SB, Wong TY, Saw SM. Visual
2019;32(105):7–8. impairment and its impact on health-related quality of life
63. Wildsoet CF, Chia A, Cho P, et al. IMI–Interventions in adolescents. Am J Ophthalmol. 2009;147(3):505–511.
myopia institute: Interventions for controlling myopia 82. Yokoi T, Moriyama M, Hayashi K, et al. Predictive factors
onset and progression report. Investig Ophthalmol Vis Sci. for comorbid psychiatric disorders and their impact on
2019;60(3):M106–M131. vision-related quality of life in patients with high myopia.
64. Bullimore MA, Brennan NA. Myopia control: why each Int Ophthalmol. 2014;34(2):171–183.
diopter matters. Optom Vis Sci. 2019;96(6):463–465. 83. Takashima T, Yokoyama T, Futagami S, et al. The quality
65. Kandel H, Khadka J, Shrestha MK, et al. Uncorrected and of life in patients with pathologic myopia. Nihon Ganka
corrected refractive error experiences of Nepalese adults: Gakkai Zasshi. 2002;45(1):84–92.
a qualitative study. Ophthalmic Epidemiol. 2018;25(2):147– 84. Wong Y-L, Sabanayagam C, Wong C-W, et al. Six-year
161. changes in myopic macular degeneration in adults of
66. Kandel H, Khadka J, Goggin M, Pesudovs K. Patient- the Singapore epidemiology of eye diseases study. Invest
reported outcomes for assessment of quality of life Ophthalmol Vis Sci. 2020;61(4):14.
in refractive error: a systematic review. Optom Vis Sci. 85. Savage H, Rothstein M, Davuluri G, El Ghormli L, Zaetta
2017;94(12):1099–1107. DM. Myopic astigmatism and presbyopia trial. Am J
67. Erickson DB, Stapleton F, Erickson P, Du Toit R, Gian- Ophthalmol. 2003;135(5):628–632.
nakopoulos E, Holden B. Development and validation of 86. Kanonidou E, Chatziralli IP, Konidaris V, Kanonidou C,
a multidimensional quality-of-life scale for myopia. Optom Papazisis L. A comparative study of visual function of
Vis Sci. 2004;81(2):70–81. young myopic adults wearing contact lenses vs. spectacles.
68. Bourque LB, Cosand BB, Drews C, Waring GO, Lynn M, Contact Lens Anterior Eye. 2012;35(5):196–198.
Cartwright C. Reported satisfaction, fluctuation of vision, 87. Meidani A, Tzavara C, Dimitrakaki C, Pesudovs K, Tountas
and glare among patients one year after surgery in the Y. Femtosecond laser-assisted LASIK improves quality of
prospective evaluation of radial keratotomy (PERK) study. life. J Refract Surg. 2012;28(5):319–326.
Arch Ophthalmol. 1986;104(3):356–363. 88. Santodomingo-Rubido J, Villa-Collar C, Gilmartin B,
69. Brunette I, Gresset J, Boivin JF, Boisjoly H, Makni H. Gutiérrez-Ortega R. Myopia control with orthokeratology
Functional outcome and satisfaction after photorefractive contact lenses in Spain: A comparison of vision-related
Downloaded from iovs.arvojournals.org on 08/31/2021You can also read