The social and economic cost of the North and Far North Queensland Monsoon Trough (2019) - Queensland Reconstruction Authority - Deloitte
←
→
Page content transcription
If your browser does not render page correctly, please read the page content below
The social and economic cost of the North and Far North Queensland Monsoon Trough (2019)

The social and economic cost of the
North and Far North Queensland
Monsoon Trough (2019)
Queensland Reconstruction Authority
June 2019

1
The social and economic cost of the North and Far North Queensland Monsoon Trough (2019)

Contents

Acronyms                                                                                                                                                    iv

Executive summary                                                                                                                                            v

1         Introduction                                                                                                                                       8

          1.1       Event details                                                                                                                            8
          1.2       Economic and social context                                                                                                              8

2         Economic framework                                                                                                                               13

          2.1       Overview of economic framework                                                                                                         13
          2.2       Approach in this report                                                                                                                14
          2.3       Assumptions and limitations                                                                                                            14

3         The social and economic cost of the Monsoon Trough                                                                                               16

          3.1       Introduction                                                                                                                           16
          3.2       Social and economic cost summary                                                                                                       16
          3.3       Residential and commercial damage                                                                                                      18
          3.3.1       Residential damage                                                                                                                   18
          3.3.2       Commercial damage                                                                                                                    19
          3.4       Public infrastructure damage                                                                                                           20
          3.4.1       Road damage                                                                                                                          20
          3.4.2       Rail damage                                                                                                                          21
          3.4.3       Water and sewage infrastructure damage                                                                                               21
          3.4.4       Other public asset damage                                                                                                            21
          3.5       Agriculture damage and disruption                                                                                                      21
          3.5.2       Direct costs to agriculture                                                                                                          22
          3.5.3       Indirect costs to agriculture                                                                                                        22
          3.6       Business disruption                                                                                                                    23
          3.6.1       Small business disruption                                                                                                            23
          3.7       Emergency response and clean up                                                                                                        24
          3.7.1       Emergency response                                                                                                                   24
          3.7.2       Clean up and evacuation costs                                                                                                        25
          3.8       Health, social and community impacts                                                                                                   25
          3.8.1       Death and injury                                                                                                                     26
          3.8.2       Health, wellbeing and community impacts                                                                                              27
          3.9       Environmental impacts                                                                                                                  31
          3.9.1       Direct environmental costs                                                                                                           31
          3.9.2       Indirect environmental costs                                                                                                         32
Deloitte refers to one or more of Deloitte Touche Tohmatsu Limited, a UK private company limited by guarantee, and its network of member firms, each of which is a
legally separate and independent entity. Please see www.deloitte.com/au/about for a detailed description of the legal structure of Deloitte Touche Tohmatsu Limited
and its member firms.

The entity named herein is a legally separate and independent entity. In providing this document, the author only acts in the named capacity and does not act in any
other capacity. Nothing in this document, nor any related attachments or communications or services, have any capacity to bind any other entity under the ‘Deloitte’
network of member firms (including those operating in Australia).

Liability limited by a scheme approved under Professional Standards Legislation.

© 2019 Deloitte Access Economics
The social and economic cost of the North and Far North Queensland Monsoon Trough (2019)

Appendix A : Summary of costs estimated                                                                                                                    34

Limitation of our work                                                                                                                                     35

          General use restriction                                                                                                                          35

Deloitte refers to one or more of Deloitte Touche Tohmatsu Limited, a UK private company limited by guarantee, and its network of member firms, each of which is a
legally separate and independent entity. Please see www.deloitte.com/au/about for a detailed description of the legal structure of Deloitte Touche Tohmatsu Limited
and its member firms.

The entity named herein is a legally separate and independent entity. In providing this document, the author only acts in the named capacity and does not act in any
other capacity. Nothing in this document, nor any related attachments or communications or services, have any capacity to bind any other entity under the ‘Deloitte’
network of member firms (including those operating in Australia).

Liability limited by a scheme approved under Professional Standards Legislation.

© 2019 Deloitte Access Economics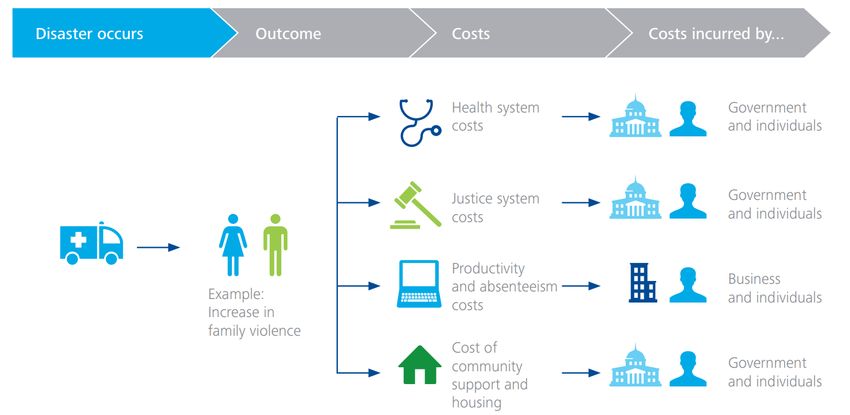
The social and economic cost of the North and Far North Queensland Monsoon Trough (2019)

Acronyms
ABS                                   Australian Bureau of Statistics

ACCC                                  Australian Competition and Consumer Commission

DAF                                   Department of Agriculture and Fisheries

DES                                   Department of Environment and Science

DESBT                                 Department of Employment, Small Business and Training

DHPW                                  Department of Housing and Public Works

DRFA                                  Disaster Recovery Funding Arrangements

DSDMIP                                Department of State Development, Manufacturing, Infrastructure and Planning

DTMR                                  Department of Transport and Main Roads

FRG                                   Functional Recovery Group

GRP                                   Gross Regional Product

GVA                                   Gross Value Added

ICA                                   Insurance Council of Australia

LGA                                   Local Government Area

NCD                                   Non-communicable diseases

NDRRA                                 Natural Disaster Relief and Recovery Arrangements

OBPR                                  The Office of Best Practice Regulation

PHAS                                  Personal Hardship Assistance (PHAS) Grants

QAS                                   Queensland Ambulance Service

QGIF                                  Queensland Government Insurance Fund

QRA                                   Queensland Reconstruction Authority

iv
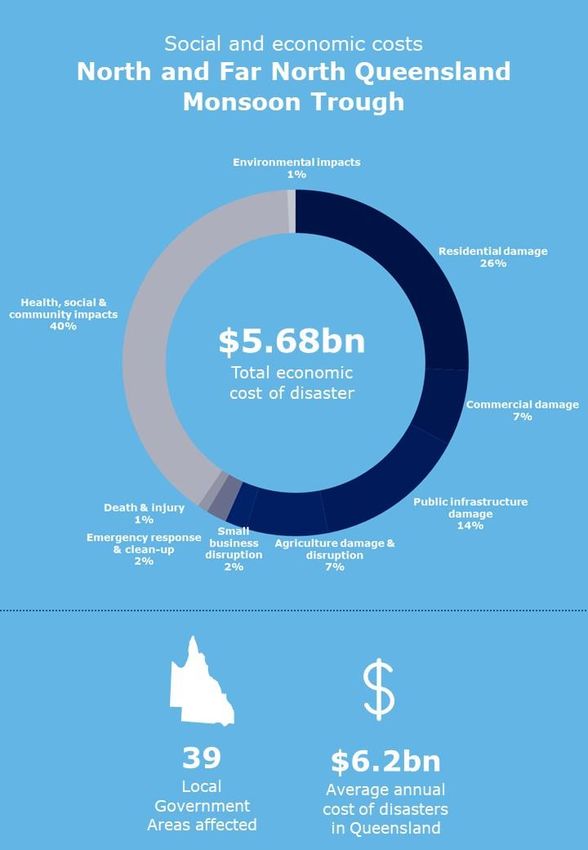
The social and economic cost of the North and Far North Queensland Monsoon Trough (2019)

Executive summary
The North and Far North Queensland Monsoon Trough – 25 January 2019 to 14 February 2019
(‘the Monsoon Trough’) has imposed billions of dollars in direct costs to individuals, businesses,
councils and government. The region experienced heavy rainfall and major flooding across more
than 100 million hectares – 56% of the state’s land. The major economic hub of Townsville was
inundated and large sections of grazing land and critical infrastructure were damaged or
destroyed.

Beyond these impacts, there is also a broad set of flow-on impacts that will take months or years
to recover from. This includes impacts from business disruption, as primary producers restock and
rebuild and tourism and other trading take time to return to usual. It also includes environmental
damage to productive land, waterways and coastal ecosystems that are yet to be fully realised,
particularly in the context of a region that had previously been coping with prolonged drought.

There is also anticipation of a high and lasting social cost, with some consequences for people’s
health and wellbeing expected to persist for the rest of their lives. These include intangible impacts
on physical and mental health, family and community cohesion. By the end of March 2019, more
than 60,000 people had accessed psychological first aid and more than 100,000 people had
applied for personal hardship assistance grants. The human and community impact of this event is
already substantial.

This report defines and considers the economic and social cost of the Monsoon Trough, including
direct and indirect costs. It draws on preliminary data available, as at 12 April 2019, from the
Queensland Reconstruction Authority (QRA), the Insurance Council of Australia (ICA) and other
government agencies in the eight weeks following the disaster event. The purpose of this report is
to provide useful information for understanding the magnitude and type of social and economic
impacts associated with the Monsoon Trough. This is important for aligning the identified impacts
to the appropriate lines of functional recovery which will serve as a useful tool for evaluating
existing disaster recovery planning and operations, as well as inform future disaster recovery and
resilience policy planning.

At this time, impact assessments are still underway and the full cost of the disaster is yet to be
determined. Consequently, the estimates developed in this report provide a conservative estimate
by only considering those impacts where there is sufficient data to undertake quantification. It also
acknowledges a broader set of impacts that are yet to be quantified, recognising that all identified
outcomes are important and relevant to recovery planning and future mitigation decision-making.
As such, costs included in this report should not be considered as a ‘total cost’ assessment, given
that some costs estimated are transitory (for example, restoration or repair costs of infrastructure)
and some costs capture a longer lasting impact to the community (for example, mental health and
social impact costs).

This report estimates the social and economic cost of the Monsoon Trough to North, Far North and
North West Queensland will exceed $5.68 billion. By value, this is approximately 14% of annual
gross regional product (GRP) in the affected local government areas.1 A summary of these costs is
provided below.

1
  The comparison of social and economic cost against GRP is provided to contextualise the extent of the impact
to this region. This is not intended to be an estimation of the shock to the economy as a result of the natural
disaster.

v
The social and economic cost of the North and Far North Queensland Monsoon Trough (2019)

Table i: Key components of social and economic cost

Key components                                                                               $m

Residential damage                                                                         $1,460

Commercial damage                                                                            $402

Public infrastructure damage                                                                 $807

Agriculture damage and disruption                                                            $432

Small business disruption                                                                    $116

Emergency response and clean-up                                                              $109

Deaths and injury                                                                             $56

Health, wellbeing and community impacts                                                    $2,255

Environmental impacts                                                                         $44

Combined social and economic cost                                                          $5,681
Source: Deloitte Access Economics estimates.

Deloitte Access Economics

vi
The social and economic cost of the North and Far North Queensland Monsoon Trough (2019)

vii
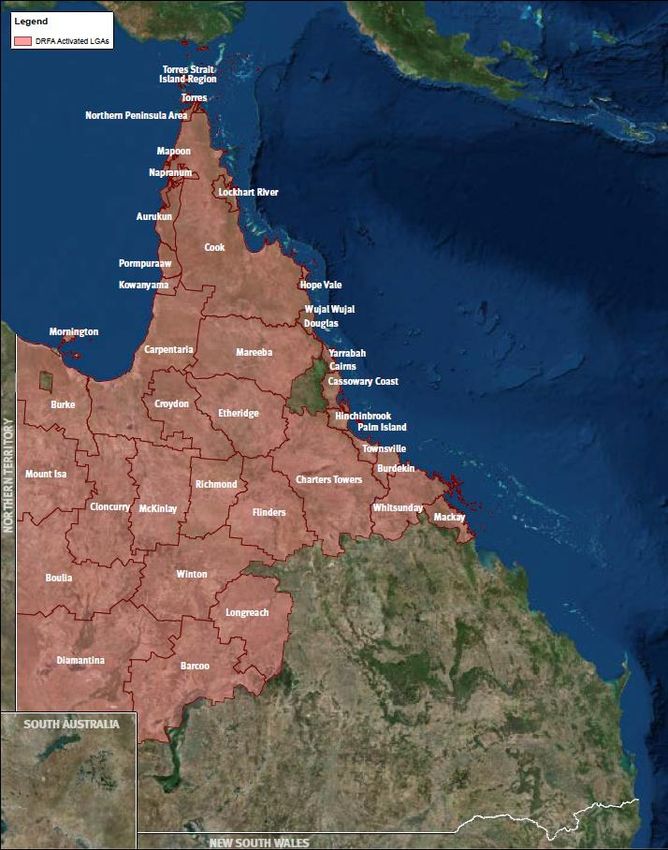
1            Introduction
1.1      Event details
From 25 January 2019 to 14 February 2019, North, Far North and North West Queensland
experienced unprecedented heavy rainfalls and major flooding. Due to an active monsoon trough
and a slow-moving low pressure system, the region hit new rainfall records with regard to
geographic spread, duration and intensity of rainfall.2

More than 100 million hectares, covering an estimated 56% of the state’s land, were affected and
39 local government areas (LGAs) were activated under the Disaster Recovery Funding
Arrangements (DRFA).3 The major economic hub of Townsville was inundated and large sections of
grazing land and critical infrastructure were damaged or destroyed. Accumulated rainfall over
consecutive days in Townsville exceeded previous records, over both a 7-day and 10-day period
(Chart 1.1).

Chart 1.1: February 2019 accumulated rainfall (mm) in Townsville, against previous records

Source: Bureau of Meteorology (2019).

1.2      Economic and social context
The regions of North, Far North and North West Queensland are vulnerable to natural disasters,
including storms, floods, cyclones and bushfires. More than any other state, around 60% of

2
  Bureau of Meteorology ‘An extended period of heavy rainfall and flooding in tropical Queensland’ (Special
Climate Statement 69, 8 March 2019) .
3 The affected LGAs were: Aurukun, Barcoo, Boulia, Burdekin, Burke, Cairns, Carpentaria, Cassowary Coast,

Charters Towers, Cloncurry, Cook, Croydon, Diamantina, Douglas, Etheridge, Flinders, Hinchinbrook, Hope
Vale, Kowanyama, Lockhart River, Longreach, Mackay, Mapoon, Mareeba, McKinlay, Mornington, Mount Isa,
Napranum, Northern Peninsula Area, Palm Island, Pormpuraaw, Richmond, Torres, Torres Strait Island,
Townsville, Whitsunday, Winton, Wujal Wujal and Yarrabah.

8
disaster-related costs to the Australian economy are borne by Queensland.4 Many of these relate
to disasters affecting the region.

Every LGA of the 39 activated for the Monsoon Trough disaster has had at least one DRFA/NDRRA5
activation in the past 12 months, and been impacted by at least five disaster events since 2011.6, 7
The Insurance Council of Australia (ICA) has estimated damage of another catastrophic event in
the region - the North Queensland floods (March 2018) - at more than $16 million in insured
losses.8 Further, disaster-related damage to public infrastructure alone has cost these councils an
estimated $2.2 billion dollars since 2011, including $588 million since 2017.9

Table 1.1: Recent regional disaster events

Event                                                    Date
Severe Tropical Cyclone Trevor                           19 - 27 March 2019
North and Far North Queensland Monsoon Trough            25 January - 14 February 2019
Tropical Cyclone Penny                                   24 December 2018 - 4 January 2019
Tropical Cyclone Owen                                    9 - 17 December 2018
Mareeba Tablelands Bushfires                             17 September – 9 October 2018

Source: Queensland Reconstruction Authority (2019) 10.

These disasters have had direct and indirect economic and social impacts on individuals,
communities and businesses. Both the up-front costs and the longer term community impacts will
depend in part on the resilience of the community to withstand, respond to and recover from
disaster events.

4
  Deloitte Access Economics, Building resilience to natural disasters in our states and territories (report
commissioned by the Australian Business Roundtable for Disaster Resilience & Safer Communities, 2017).
5
  Natural Disaster Relief and Recovery Arrangements (NDRRA) was replaced by the DRFA in November 2018.
6
  According to Queensland Reconstruction Authority supplied information.
7
  Queensland Reconstruction Authority, Activations (2019) .
8
  Insurance Council of Australia, ICA Catastrophe Dataset (28 February 2019)
.
9
  According to Queensland Reconstruction Authority supplied information.
10
   Queensland Reconstruction Authority, Activations (2019) .

9
Figure 1.1: Map of affected LGAs in the 2019 North and Far North Queensland Monsoon Trough

Source: Queensland Reconstruction Authority (2019)

10
The regional economy – defined by the 39 affected LGAs – was valued at $40 billion in 2017-18,
equivalent to 13% of the Queensland state economy.11 Key economic drivers across the three
regional clusters include agriculture, mining and tourism:
The North Queensland economy (including Townsville) is relatively diversified. The region
supports mining and agriculture processing and trade and employment is increasingly driven
by services, defence and tourism.12
North West Queensland is dominated by copper ore silver-lead-zinc ore mining, supported
by beef cattle farming and expanding service-based sectors.13
Far North Queensland is partly led by government services, education and health care, but
tourism, specialised agriculture and bauxite mining are particular areas of regional
competitiveness.14
Agriculture along the coastal corridor is centred around sugarcane, vegetables and fruit, while
the inland areas are focused on livestock, particularly beef cattle.15 The Monsoon Trough affected
more than 600 primary producers. Prior to the flood event, many shires in the North West had
already reduced stocking rates in response to prolonged drought. The Queensland government has
estimated that stock numbers have been reduced from 1.4 million cattle to as low as 750,000 due
to the drought.16 Additional stock losses following the Monsoon Trough disaster has exacerbated
this existing sector downturn.
Mining and minerals operations across the region employ over 15,000 people across a sparsely
populated environment.17 The region dominates Australian exports of copper, zinc and lead which
are transported, largely by rail, to the Port of Townsville. The Monsoon Trough has caused major
delays and disruptions to mining activity, largely as a consequence of the closure of the Mount Isa
rail line. This has affected a number of mining operations as well as the flow-on supply chain.
Tourism accounts for around 25% of gross regional product (GRP) and 98,000 jobs18. The region
includes popular destinations including the Great Barrier Reef, Daintree and Whitsunday Islands.
Disaster events can deter visitors from the region and are anticipated to reduce short to medium
term visitation numbers.
The Australian Bureau of Statistics (ABS) estimates the population for the affected area to include
nearly 680,000 residents and 54,000 businesses in 2018.19 The most populous areas affected were
Townsville, Cairns, Mackay, Whitsunday and the Cassowary Coast. Around 193,000 people live in
the City of Townsville, which suffered significant damage with almost 3,300 properties damaged
and thousands of residents evacuated.20
The main industries of employment, according to the 2016 Census, are health care and social
assistance (13%), retail trade (10%), and public administration and safety (9%).21 However, the
region also has relatively high unemployment of approximately 9% in Townsville and 8.31%
across the broader region – higher than the overall Queensland unemployment rate of 6.2%22. The
11
.idcommunity, National economic indicators for local government areas, 2017/18 (2018)
.
12
Queensland Government Economic Research, Manufacturing and Industry Development, ‘North Queensland –
Regional Economic Growth Drivers’ (October 2018).
13
Queensland Government Economic Research, Manufacturing and Industry Development, ‘North West
Queensland – Regional Economic Growth Drivers’ (October 2018
14
Queensland Government Economic Research, Manufacturing and Industry Development, ‘Far North
Queensland – Regional Economic Growth Drivers’ (October 2018).
15
According to Queensland Reconstruction Authority supplied information.
16
Four of the affect LGAs were drought declared on 1 January 2019
17
Australian Bureau of Statistics, 2016 Census – Counting Persons, Place of Usual Residence (MB) (2016).
18
Deloitte Access Economics, Regional Tourism Satellite Accounts 2016-17
19
Australian Bureau of Statistics, 2016 Census – Counting Persons, Place of Usual Residence (MB) (2016).
20
Gissing, A, O’Brien, J, Hussein, S, Evans, J, Mortlock, T 2019. Townsville 2019 floods: insights from the field,
Bushfire and Natural Hazards CRC, Melbourne, 2019.
21
Excluding the following industry of employment responses: ‘Inadequately described’, ‘Not stated’, and ‘Not
applicable’.
22
Australian Bureau of Statistics, 2016 Census – Counting Persons, Place of Usual Residence (MB) (2016).
11overall population has been in decline for 19 of the LGAs, including 9 of the 11 LGAs23 which the Queensland Reconstruction Authority (QRA) define to have experienced the hardest hit from the Monsoon Trough. The affected region is relatively disadvantaged, with 19 of the 39 affected LGAs having a score of one against the ABS Index of Relative Socio-economic Disadvantage (IRSD)24, 25. Approximately half of the population have completed year 12 or equivalent schooling.26 During the event, communities were cut off from their places of work and schooling. The region’s major rail line was severely damaged and more than 6,000 kilometres of roads were affected, with around 3,000 kilometres remaining closed for over a week.27 100 schools were closed as a result of the flood event,28 for example at Oonoonba State School, where seven school buildings were damaged.29 The region’s underlying socioeconomic vulnerability is likely exacerbated by the human and social impacts of the disaster event. By 27 March, more than 116,000 people had applied for personal hardship assistance,30 63,000 calls had been made to the Community Recovery Hotline and 62,248 people had been assisted with psychological first aid through the Salvation Army, UnitingCare Queensland – Lifeline, and Australian Red Cross.31 The region also suffered environmental damage with implications for how agriculture, tourism and the ecosystem is likely to recover. Large amounts of sediment have been disturbed and entered local waterways. Streambank retreat has been estimated to be up to 40 metres in some areas, including loss of riparian vegetation. Coastal areas, including those surrounding the reef, have lost large areas of sand and coastal habitat. Post-disaster, the region is at risk of pest and weed outbreaks that could cause further damage to the agricultural sector and environment.32 23 The QRA has identified 11 local government communities as being the hardest hit by the Monsoon Trough, this includes; Burdekin, Burke, Carpentaria, Cloncurry, Douglas, Flinders, Hinchinbrook, McKinlay, Richmond, Townsville, and Winton. According to Queensland Reconstruction Authority supplied information. 24 The Index of Relative Socio-economic Disadvantage (IRSD), which ranks geographic regions based on relative socioeconomic disadvantage using Census data. A low score (one being the lowest, and ten the highest) indicates relatively greater disadvantage, for example many households with low income, or many people in unskilled occupations. 25 Australian Bureau of Statistics, 2033.0.55.001 - Census of Population and Housing: Socio-Economic Indexes for Areas (SEIFA), Australia, 2016 (27 March 2018) . 26 Australian Bureau of Statistics, 2016 Census – Counting Persons, Place of Usual Residence (MB) (2016). 27 According to Queensland Reconstruction Authority supplied information. 28 38 schools remained closed as of April 2019. 29 According to Queensland Reconstruction Authority supplied information. 30 According to Queensland Reconstruction Authority supplied information. 31 According to Queensland Reconstruction Authority supplied information. 32 According to Queensland Reconstruction Authority supplied information. 12
2 Economic framework
2.1 Overview of economic framework
The Monsoon Trough event has had wide-ranging impacts on individuals, businesses and
communities. The impacts of the flood disaster are ongoing and still being assessed. The purpose
of this report is to estimate the economic and social impacts of the flood disaster using information
collected to date by the QRA, in conjunction with other Queensland Government agencies. The
purpose of the report is to provide useful information for understanding the magnitude and type of
social and economic impacts associated with the Monsoon Trough. This is important for aligning
the identified impacts to the appropriate lines of functional recovery which will serve as a useful
tool for evaluating existing disaster recovery planning and operations, as well as inform future
disaster recovery and resilience policy planning.33
The economic and social costs of the disaster should be distinguished from the financial costs. In
an economic analysis, financial costs such as the direct damage to residential and commercial
buildings are only a portion of the overall social and economic cost, and includes non-market
impacts such as broader social impacts relating to death, injury, health and wellbeing.34 Further,
an economic analysis looks at the net impact of the disaster, meaning that the overall estimate
of economic costs does not include monetary transfers between different entities (to avoid double
counting), and costs that would have been incurred in the absence of the disaster event.35
To estimate the social and economic cost of the disaster, this report identifies and where possible
quantifies, the value of the impacts of the flood disaster. As many of the social and economic
impacts measured do not have a market value, a key and complex component of the analysis
involves estimating a monetary value of those impacts. In these cases, valuation proxies from
literature, such as the statistical value of life, have been used. Care has been taken in selecting
appropriate proxies for monetisation to align with the context of this disaster event. Some of the
intangible impacts cannot be reliably monetised in the absence of detailed non-market valuation
studies. Where an appropriate non-market valuation approach for a given impact is not available
or the impacts of the disaster are uncertain (due to for example, missing or incomplete data)
impacts are discussed qualitatively.
The approach taken in this report draws on fundamental research conducted by the Bureau of
Transport Economics (BTE) (now, the Bureau of Infrastructure, Transport and Regional Economics
(BITRE)), and Deloitte Access Economics on the economic cost of natural disasters.
A BTE 2001 report developed a framework for estimating the economic cost of financial
disasters, which included costs that should be included in the analysis and suggested
approaches for estimation.36
A Deloitte Access Economics 2013 report adapted BTE’s framework to develop a bottom-up
approach to estimating the economic cost of disasters in Australia, using various available data
relating to disaster impacts.37
A Deloitte Access Economics 2016 report revised the framework further to enable the
estimation of broader, long-term social costs of natural disasters, including impacts on health
and wellbeing.38
33
Economic modelling of the disaster impact has also been undertaken by Queensland Treasury and the
Department of State Development, Manufacturing, Infrastructure and Planning (DSDMIP) for cabinet briefing
purposes.
34
Deloitte Access Economics, Building our nation’s resilience to natural disasters (report commissioned by the
Australian Business Roundtable for Disaster Resilience and Safer Communities, 2013).
35
Bureau of Transport Economics ‘Economic costs of natural disasters in Australia’ (Report 103, 2001).
36
Bureau of Transport Economics ‘Economic costs of natural disasters in Australia’ (Report 103, 2001).
37
Deloitte Access Economics, Building our nation’s resilience to natural disasters (report commissioned by the
Australian Business Roundtable for Disaster Resilience and Safer Communities, 2013).
38
Deloitte Access Economics, The economic cost of the social impact of natural disasters (report commissioned
by the Australian Business Roundtable for Disaster Resilience and Safer Communities, 2016).
132.2 Approach in this report
This report applies the framework developed and refined through the above mentioned reports to
enable the estimation of tangible direct, tangible indirect and intangible costs associated with the
flood disaster, using a bottom-up approach.39 These cost categories are defined as follows:40
Direct costs are those that are incurred as a result of the disaster event. These costs have a
market value such as the damage to residential or commercial buildings, or public
infrastructure.
Indirect costs are any flow-on effects that are not directly caused by the natural disaster but
arise as a result of the consequences of the damage and destruction. Examples of such costs
include business disruption and environmental degradation.
Intangible costs are the direct and indirect damages that cannot be easily priced. Examples
of intangible costs include social costs associated with death, injury, and health and wellbeing,
as well as costs related to environmental impacts. While tangible costs tends to be one-off
costs, intangible impacts, particularly those related to social impacts, can persist over a
person’s lifetime, and may be multiple or compounding (i.e. not necessarily linear).
Figure 2.1 provides a high-level snapshot of the economic framework underpinning the estimation
of the direct and indirect costs of the disaster to the region of North, Far North and North West
Queensland.
2.3 Assumptions and limitations
This report considers the social and economic impact of the disaster to the 39 LGAs impacted by
the Monsoon Trough. As such, the results determine the social and economic cost of the disaster
to the region of North, Far North and North West Queensland, rather than the state as a whole.
This is because there are likely to be economic transfers from one region to another in response to
the disruption. There may also be flow-on impacts to stakeholders in other regions which are not
captured in the analysis.
This report draws on information supplied by the QRA regarding the impacts of the disaster in the
eight weeks following the event. These data were provided to QRA by several government
departments involved in response and recovery activities. Given this timeframe, several impacts to
people, businesses, communities and the environment are still being assessed and data collection
is ongoing (i.e. it takes up to three years for insurance claims data to be collected on a particular
disaster event). As such, the social and economic cost estimate provided in this report is
conservative and based on the information available as at 12 April 2019. It is expected that
additional data would most likely revise the estimate upwards.
Costs included in this report should not be considered as a ‘total cost’ assessment given that some
costs estimated are transitory (for example, restoration or repair costs of infrastructure) and some
costs capture a longer lasting impact to the community (for example, mental health and social
impact costs). A cost-benefit analysis has not been undertaken to take into account the timing and
duration of identified impacts. As such, the estimates presented here should not be considered as
the total cost of the natural disaster.
39
A bottom-up approach looks at individual cost categories and uses data of the actual impacts of the disaster
to build up a total picture of the disaster’s costs.
40
Deloitte Access Economics, The economic cost of the social impact of natural disasters (report commissioned
by the Australian Business Roundtable for Disaster Resilience and Safer Communities, 2016).
14Figure 2.1: Framework for estimating the social and economic cost of the flood disaster Source: Deloitte Access Economics. 15
3 The social and economic
cost of the Monsoon
Trough
3.1 Introduction
Deloitte Access Economics has estimated the social and economic costs of the disaster based on
data provided by QRA as at 12 April 2019. The estimate excludes a number of impacts which have
been considered qualitatively due to data limitations or implicit difficulty associated with
monetisation (e.g. some social and environmental impacts).
Unless otherwise specified, data have been provided by various Queensland Government functional
recovery groups in place to support disaster recovery planning and activities. It has not been
independently verified as part of this analysis.
All data is presented in 2019 dollars.
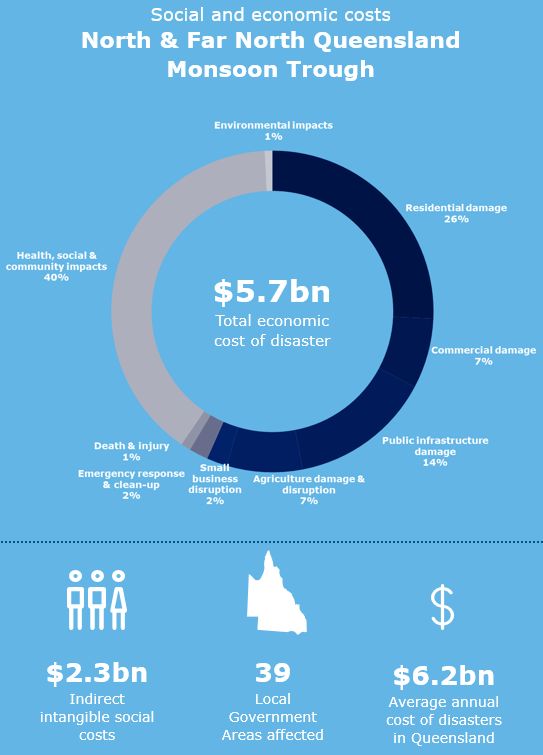
3.2 Social and economic cost summary
The preliminary estimated regional social and economic cost of the North and Far North
Queensland Monsoon Trough – 25 January to 14 February 2019 is $5.68 billion. By value, this
impact is approximately 14% of GRP in 2017-18.41 This includes $3.15 billion in direct costs and
$2.53 billion in indirect costs (as a result of flow-on effects that are not directly caused by the
disaster itself) (Table 3.1).
Table 3.1: Estimated direct and indirect costs
$bn
Direct costs $3.15
Indirect costs $2.53
Combined social and economic cost $5.68
Source: Deloitte Access Economics estimates
This section summarises each of the components of total social and economic cost estimated in
this report. The following sections break down these costs in further detail. The larger cost is $3.15
billion in direct losses to homes, buildings, livestock and public assets (Table 3.2). This is closely
followed by indirect social costs to health, wellbeing and communities at $2.53 billion. Compared
to the direct costs, social costs are largely intangible and will be incurred over the long-term in the
months and years to come.
These estimates are conservative and have been developed based on the data available in the
eight weeks immediately following the disaster event. For example, impact assessments are
ongoing to evaluate the extent of damage, including for infrastructure, agriculture, injuries and the
environment. Experience from previous disaster events suggests that there are additional
intangible impacts that could affect individuals and their communities over the long term.42 These
41 The comparison of social and economic costs against GRP is provided to contextualise the extent of the
impact to this region. This is not intended to be an estimation of the shock to the economy as a result of the
natural disaster.
42
Deloitte Access Economics, The economic cost of the social impact of natural disasters (report commissioned
by the Australian Business Roundtable for Disaster Resilience and Safer Communities, 2016).
16social and environmental consequences are complex and difficult to measure but suggest the social and economic cost of the disaster could be even higher than those quantified in this report. Table 3.2: Key components of total social and economic cost Key components $m Residential damage $1,460 Commercial damage $402 Public infrastructure damage $807 Agriculture damage and disruption $432 Small business disruption $116 Emergency response and clean-up $109 Deaths and injury $56 Health, wellbeing and community impacts $2,255 Environmental impacts $44 Combined social and economic cost $5,681 Source: Deloitte Access Economics estimates Environmental impacts are underestimated as this report primarily considers the direct environmental losses estimated according to their replacement value, based on available data.43 The flow-on, intangible impacts cannot be reliably monetised without detailed non-market valuation studies. This includes impacts of sedimentation and asset damage on water quality, habitat and biodiversity. While the above estimates include some disruption impacts to agriculture and small business, broader business disruption and supply chain impacts have not been included separately. These impacts cannot be reasonably determined given the difficulty in quantifying the commercial impacts for individual businesses that have been offset by an uptake in business activity elsewhere in the region (for example, increases in construction activity). In addition, these estimates are partially captured by commercial damage estimates, which includes insured business losses. For this reason, business disruption is excluded to avoid double counting. These disaster costs are not outside the norm for Queensland. Deloitte Access Economics (2017) estimated that natural disasters have cost an average $6.2 billion per year to the State in the 10 years to 2016.44 Some one-off events have exceeded this, including the 2010-11 Queensland Floods which cost an estimated $14.6 billion (see box below). 43 It is recognised that some estimation approaches are more robust than others (i.e. a willingness to pay survey). The estimation approach used here is based on data available at the time of the report. Estimates based on better quality of data will be more robust than others. 44 Deloitte Access Economics, Building resilience to natural disasters in our states and territories (report commissioned by the Australian Business Roundtable for Disaster Resilience and Safer Communities, 2017). 17
Queensland Floods 2010-11

      The 2010-11 floods affected more than 78% of Queensland, 36 people died and over 2.5
      million people were affected45.

      Deloitte Access Economics estimated the cost of the disaster in its report for the Australian
      Business Roundtable for Disaster Resilience and Safer Communities. The total economic cost
      of this disaster, including direct and indirect impacts, was estimated at $14.6 billion dollars
      (2015 dollars).

     The economic cost of natural disasters in Queensland

     In 2017, Deloitte Access Economics released a report that considered the economic cost of
     natural disasters in Australia’s states and territories.46 Key findings from that report are outlined
     below.

3.3      Residential and commercial damage
3.3.1      Residential damage
Direct damage to homes and residential property is one of the largest costs associated with
disaster events.

The Monsoon Trough event damaged 3,369 homes, with 1,255 (37%) classified as uninhabitable
and 2,114 (63%) assessed to have minor damage. As at 14 March, the ICA reported domestic
claims valued at $817 million. Of these claims, 48% were lodged for insured buildings, 34% for
contents and 17% for motor vehicles.

It is recognised that in the affected region, insurance premiums are costly and a high proportion of
residences are uninsured or underinsured (see box below). Furthermore, analysis of historical

45
   Queensland Floods Commission of Inquiry, Queensland Floods Commission of Inquiry Final Report (2012)
.
46
   Deloitte Access Economics, Building resilience to natural disasters in our states and territories (report
commissioned by the Australian Business Roundtable for Disaster Resilience and Safer Communities, 2017).

18
claims data suggests that disaster-related insurance claims tend to be made over a three year period following the event – with 48% of claims made in the year following the natural disaster, 32% the year after that and 20% in the third year following.47 As such, the actual cost of residential damage could be higher than current estimates. Insurance premiums in Northern Australia Prior to 2011, flood cover was not widely offered in Northern Australia. In 2012, the Australian Government introduced legislation to increase the offering of flood cover to residential property. This led to an increase in premiums for consumers in high flood risk areas. The Australian Competition and Consumer Commission’s (ACCC) ongoing Northern Australia Insurance Inquiry indicates that insurance affordability is increasingly recognised as a challenge for liveability and subsequently, economic prosperity in the region.48 High premiums and a lack of transparent information about the potential cost impact of excluding flood cover mean that a high proportion of people are uninsured. Underinsurance in Australia is also a concern. The Productivity Commission’s inquiry in to national disaster funding suggested that consumers’ lack of access to information, or lack of understanding about risk and insurance coverage can lead to underinsurance.49 Given the high cost of insurance coverage in northern Australia, consumers may underestimate the value of their residences to avoid high premiums, unaware or sceptical about the impact this will have on their level of cover. The Monsoon Trough may have a further impact on insurance premiums in this region. Premium adjustments may be made by insurance companies operating in this region if these companies experienced a loss as a result of the Monsoon Trough. To estimate the total (insured and uninsured) cost to residential property, ICA data were adjusted by an estimated ratio of insured losses to uninsured losses developed by Deloitte Access Economics. Under this approach, residential property damage is estimated at $1.46 billion. 3.3.2 Commercial damage There are a number commercial businesses operating in the impacted region that have suffered direct property damage. The area supports a large number of agricultural, mining, manufacturing and tourism activities. There are more than 46,000 businesses in the 11 most impacted councils, including 12,000 businesses in Townsville alone. There are around 450 primary producers in the worst affected areas. The impacted zone, activated in accordance with the DRFA, includes more than 17,000 small businesses.50 A preliminary survey of small businesses, conducted by the Department of Employment, Small Business and Training (DESBT) has identified 214 respondents (out of 626 participants) with damage to premises.51 47 Deloitte Access Economics, Building our nation’s resilience to natural disasters (report commissioned by the Australian Business Roundtable for Disaster Resilience and Safer Communities, 2013). 48 Australian Competition and Consumer Commission, ‘Northern Australia Insurance Inquiry’ (First interim report, November 2018) 49 Productivity Commission, ‘Natural Disaster Funding Arrangements’ (Inquiry Report Vol 1, No 74, 17 December 2014) . 50 There were 5 LGAs activated for Category C assistance for small businesses: Cloncurry, Flinders, McKinlay, Richmond and Townsville. 51 Undertaken by the Department of Employment, Small Business and Training. Results as of 11 March 2019. 19
The ICA received 2,458 commercial property claims as at 14 March 2019, with a total value of
$225 million52, 53. Using the same approach as for residential damage to account for insurance and
underinsurance, the cost of commercial property damage is estimated at $402 million.

It is noted that a number of the recorded claims relate to business disruption (15%). As such,
while the estimate mostly relates to direct business costs, it also includes some indirect costs.

3.4       Public infrastructure damage
Public infrastructure includes damage to roads, transport networks, communications systems,
schools and other public assets. Much of the cost associated with restoring public infrastructure is
covered by Category B assistance provided under the DRFA between Queensland and the
Commonwealth. Other asset damage is insured or falls to councils, state governments and other
asset owners to repair.

Damage to public infrastructure is estimated to be $807 million. Table 3.3 summarises
these impacts which are detailed below, in the remainder of this section.

Table 3.3: Breakdown of public infrastructure costs

                                                                                                              $m
Road damage                                                                                               $742.1
Rail damage                                                                                                   n.a.
Water and sewage infrastructure                                                                             $14.5
Other public asset damage                                                                                   $50.0
Combined cost                                                                                             $806.6

3.4.1      Road damage
The event caused extensive damage to Queensland’s road network. More than 6,000 kilometres of
state-controlled roads were affected by closures (4,422km) and restricted access (1,998km). Many
areas have faced ongoing flood impacts as a result of further rainfall associated with Tropical
Cyclone Trevor54.

Road closures affected community access to homes, schools and places of work. In addition,
temporary closure in the region’s key transport corridors along the Bruce and Flinders Highways
caused major supply chain disruption for regional trade. Inaccessible roads have also delayed
assessments to determine the full extent of damages, including to primary producers.

The cost of the road damage includes the direct asset replacement cost as well as a number of
additional costs arising from the need to conduct temporary works to ensure roads are safe and
trafficable until full reconstruction can be scheduled. These counter-disaster operations include
removal of hazards and pothole repairs and are included as part of emergency response cost
estimates (section 3.7).

Council managed roads have an estimated a damage cost of just over $442 million. In addition,
the Department of Transport and Main Roads (DTMR) has estimated a total cost of $300 million
to recover the state-owned road network.

While not estimated, there are likely to be other indirect costs to the road network. Specifically,
extensive rail damage (described in section 3.4.2) increased pressure on the road system, with a

52
   The claims relate to commercial property (67%), motor vehicles (16%) and business disruption (15%).
53
   Business disruption is classified as an indirect cost, but cannot be reliably separated from the total value of
commercial claims, so is included in these figures and excluded from the calculations in section 3.6.
54
   Cyclone Trevor hit North Queensland in March 2019 and has exacerbated damage and prolonged recovery in
some areas.

20
significant increase in the number of heavy vehicles using Flinders Highway to transport goods which would usually be transported by rail. 3.4.2 Rail damage Flooding severely disrupted the Mount Isa rail line. More than 307km of the rail line was damaged, including severe damage to 200km of track between Richmond and Oorindi, which was closed until 29 April 2019. As a result of the train derailment at Nelia, Queensland Rail removed 81 rolling stock, storing a mixture of minerals including zinc, lead and copper anodes.55 A 1.2 km rail deviation has been constructed, to enable train services to resume while environmental remediation works are in progress around the derailment site. The damaged rail line has now been repaired. At the time of this report, the cost of the repair was not available from Queensland Rail. Given a lack of information around the nature of the rail damage and thus the level of work that would be required to repair the damaged rail, a cost benchmarking exercise to approximate the cost of the rail damage has not been undertaken. 3.4.3 Water and sewage infrastructure damage The disaster has caused extensive damage to water and sewerage networks including controls, mains, accesses and electrical assets. For example, Townsville City Council reported breakage to 21 bulk mains and 310 reticulation mains, as well as damage due to inundated pump stations. There are a number of dams affected including Burdekin Falls, Eungella, Julius and Teembra dams. Some restoration costs are covered by public asset insurance (described in section 3.4.5). However, QRA has estimated additional direct restoration costs of $14.5 million. This excludes potential additional costs in North West Queensland where damage assessments remain underway. 3.4.4 Other public asset damage An estimated 765 state-owned frontline public assets sustained damage, including 179 which sustained significant damage. These assets include social housing, schools and police stations. In addition, a number of community and recreational assets were damaged, such as public parks, reserves, playgrounds, and sporting facilities. The Queensland Government Insurance Fund (QGIF) is the mandatory insurer for Queensland’s state assets. While many claims are yet to be processed, they have estimated direct damages to state assets at $30 million. In addition, QRA and the Department of Housing and Public Works (DHPW) estimated restoration of community and recreation facilities to be at least $20 million. These data suggest public asset damage costs of at least $50 million. Costs to privately operated assets, such as energy and communications infrastructure, are accounted for under commercial damages (section 3.3.2). These costs included restoring supply to 8,900 electricity customers in Townsville and at 1,612 Telstra sites. It is to be noted that the full cost of restoring electricity and telecommunication lines at these sites may be higher than that quantified here, which has not factored in the indirect costs that may be incurred by users and service providers as a result of these utility outages. 3.5 Agriculture damage and disruption The affected region is heavily dependent on agricultural production to support its economy. Damage to agriculture is estimated at $432 million, including $384 million in direct costs and $48 million in indirect costs. Table 3.4 summarises these impacts which are detailed in the sections below. 55 Queensland Rail, Mount Isa Line Recovery Plan (22 May 2019) . 21
Table 3.4: Breakdown of costs to agriculture

                                                                                                               $m
Livestock losses                                                                                          $376
Crop losses                                                                                                    $8
Direct cost                                                                                              $384
Additional fodder                                                                                              $2
Carcass disposal                                                                                           $46
Indirect cost                                                                                              $48
Combined cost                                                                                            $432

3.5.2      Direct costs to agriculture
The Monsoon Trough event affected upwards of 600 primary producers, with 31 identifying
damage as ‘catastrophic’.56 The worst impacts are among beef cattle and sheep farmers in the
North West region. AgForce has estimated livestock losses at 500,000 head of cattle (1.7% of the
national herd) and 30,000 sheep. Assuming an average replacement cost of $750 per head, the
replacement cost of these livestock is approximately $376 million.

In the coastal region, there were a number of properties with major crop losses. This includes
damage to a number of sugarcane, broadacre and horticulture farmers in Townsville, Burdekin and
Hinchinbrook. As at 4 April, $8 million in crop losses (gross value of agricultural production) has
been estimated by the Department of Agriculture and Farming (DAF) for these areas. Additional
damage to crops was reported in Douglas, however damage has not been fully assessed at the
time of this report.

In addition to crop and livestock losses, DAF has noted extensive damage to bores, watering
points, yards and property buildings. On-farm infrastructure losses include up to 10,000km of
fencing, 1,000km of water pipelines, and 15,000km of on-farm roads. Damage to on-farm
infrastructure has been estimated at $100 million. These infrastructure costs are not
included separately in aggregate economic cost estimates to avoid double counting with
commercial losses.

3.5.3      Indirect costs to agriculture
Primary producers have also faced indirect flow-on costs from the need to purchase additional
fodder and dispose of carcasses.

As well as the widespread livestock losses, many thousands of cattle and sheep that remained
after the event were stranded and stressed. A major fodder drop was coordinated by government,
industry and charitable organisations – including transport by helicopter to some inaccessible
properties. Extraordinary fodder costs have been estimated at $2 million. This excludes the
cost of hay that was donated (2,300 bales) and other fodder costs borne by producers that cannot
be separated from commercial damages, as well as the cost of helicopter transport provided by the
Australian Defence Force.

A Carcass Disposal Strategic Master Plan was adopted by the Commonwealth and State
Governments and five local councils impacted in the North West LGAs to support the safe disposal
of carcasses. As part of this plan, assistance grants of $5,000 have been offered to producers. To
date, 458 producers have received $2.27 million.

In this report, the total cost of carcass disposal was estimated using average per head costs
developed by BTE (2001).57 Adjusted to 2019 dollars using CPI and applied to the stock losses

56
   There were 11 LGAs activated for Category C assistance for primary producers: Burdekin, Burke,
Carpentaria, Cloncurry, Douglas, Townsville, Hinchinbrook, Richmond, McKinlay, Flinders and Winton.
57
   Bureau of Transport Economics, ’Economics costs of natural disasters in Australia’. Report 103, Canberra,
(2001).

22
described above, the total cost of carcass disposal is estimated at $45.5 million for cattle and $364,000 for sheep. 3.6 Business disruption Agriculture, mining and tourism are major industry sectors in the region. These major sectors, as well as other industry operators, have experienced trade disruptions because of this event. For example, stock and crop losses have major consequences for transport and freight operators, abattoirs and other input and service suppliers to the industry. These business disruptions are indirect losses as a consequence of the disaster. Natural disasters disrupt businesses through a variety of mechanisms, specifically through disruption of infrastructure, transportation and telecommunications, which frequently forces businesses to close in the aftermath of a disaster.58 Moreover, disasters can cause population dislocation, losses in discretionary income among employees in the impact area and competitive pressure from large outside businesses59. The closure of the Mount Isa rail line critically disrupted mining and minerals production – the major employer in North West Queensland. Glencore’s Collinsville mine, Newlands Coal mine and Incitec Pivot’s fertiliser facility were partially shutdown. These businesses incurred extraordinary costs associated with alternative storage and freight of product. Zinc and Copper refineries in Townsville as well as Port operations were also disrupted. Other trade disruption has been incurred as a result of transport delays, electricity and communications network outages, temporary business closures and clean-up activities. In general, business disruption is not included as an economic cost to the region. This is due to the difficulty in determining the shift in production from one location in the region to another, or from one affected business to an unaffected one. For example, where a grocer is closed for a week on account of flooding, customers would seek out the next best alternative grocer – transferring their expenditure within the economy. An estimated 98% of reconstruction activities are being undertaken by local contractors – a benefit to the regional economy. The net impact of these transfers within the region is complex to determine. Nevertheless, some commercial damages claims include insurance for business disruption. To this extent, business disruption is partially accounted for in estimates of commercial damages. In addition, this report quantifies indirect losses to small business, including those in the tourism sector. Data on small business impacts has been made available from a preliminary survey undertaken by the DESBT which provide an indication of the flow-on impacts to small business. 3.6.1 Small business disruption Small businesses are disproportionately affected by disaster events. They are typically less resilient, lack capacity to design and implement hazard management programs and less likely to have insurance to cover interruption to trade. Small businesses also take longer to re-establish as they primarily depend on neighbourhood customers.60 There were five LGAs activated for Category C assistance for small businesses: Cloncurry, Flinders, McKinlay, Richmond and Townsville. Of the 12,383 small businesses in these regions, an estimated 52% (6,481) were affected61. This includes an estimated 1,067 tourism-dependent small businesses and 5,414 other small businesses. 58 Whitney, D.J., A. Dickerson and M.K. Lindell (2001) ‘Non-structural seismic preparedness of Southern California hospitals’. 17(2) Earthquake Spectra pp. 153–171. 59 Zhang, Y., Lindell, M.K., Prater, C.S. (2009), ‘Vulnerability of community businesses to environmental disasters’, 33(1) Disasters, pp. 38-57. 60 Alesch, D.J., J.N. Holly, E. Mittler and R. Nagy (2001) ‘When small businesses and not-for-profit organizations collide with environmental disasters’. Paper presented at the First Annual IIASA– DPRI Meeting on Integrated Disaster Risk Management: Reducing Socio-Economic Vulnerability. 1–4 August. Laxenburg, Austria. 61 The share of the regional population affected was estimated using data on Category A claims for personal hardship assistance. That is, on average 52% of the resident population in these 5 LGAs had applied for 23
The DESBT survey found that 70% of small businesses had been directly affected by the disaster,
with an average damage cost of $87,00062. However, 80% of businesses had been indirectly
affected by temporary closures and trade interruptions. In addition, around 30% of businesses
estimated that it would take more than three months for normal trading to resume.

Businesses had self-reported the indirect costs associated with disruption to trade. The average
indirect cost was $34,479 to small business (excluding tourism) and $43,000 for tourism-
dependent small businesses. For tourism small business, the high cost estimates accounted for the
additional impacts associated with cancellation or deterrence of forward bookings.

Research has shown that tourism businesses can be slower to recover from disaster. In addition to
direct property damage that needs replacement or repair, affected destinations can also be
impacted by negative perceptions amongst potential tourists. 63, 64 This impact was more evident
for business operation in coastal destinations, such as those affected in Far North Queensland.

To determine the economic cost of these business losses, it is assumed that 50% of the revenue
loss is to gross value added (GVA).65 As a result, it is estimated that indirect costs to small
business was $116 million, including $23 million to tourism-dependent small businesses.

3.7       Emergency response and clean up
3.7.1       Emergency response
Emergency response costs have previously been estimated by Deloitte Access Economics in 201366
using data on Category A expenditure covering individual and household assistance. To date, a
total of 65,823 grant applications have been paid to individuals and households, totalling $30.8
million in emergency response (Table 3.5).

Table 3.5: Category A – Individual assistance grants as at 3 April 2019

LGA                                                 Applications             Approved                  Grant
                                                            Paid             Payments           Beneficiaries
Emergency Hardship Assistance (EHA)                         54,801           $20,634,150                116,358
Essential Household Contents Grant                           4,321            $8,186,549                  9,835
(EHCG)
Structural Assistance Grant (SAG)                                 2              $14,500                       7
Essential Services Safety and                                     -                      -                     -
Reconnection Scheme Grant (ESSRS)
Essential Services Hardship Assistance                       6,699            $1,918,800                 12,886
(ESHA)
Total                                                      65,823          $30,753,999
Source: Queensland Reconstruction Authority.

In this analysis, data were also available on the cost of exceptional counter-disaster operations
($16 million) and the cost to the State government in administering PHAS grants and purchasing
extraordinary recovery specific services such as psychological first aid, under Category A ($12.3
million).

Category A assistance. It was assumed that the share of affected small businesses was equivalent to the share
of affected population across each LGA.
62
   These costs have not been separately considered from commercial damages, see section 3.3.
63
   Lehto, X., Douglas, A.C., Park, J, (2008) ‘Mediating the effects of natural disasters on travel intention’ 23(2-
4) Journal of Travel & Tourism Marketing, pp.29-43
64
   Hall, M.H, (2010) ‘Crisis events in tourism: subjects of crisis in tourism, Current Issues in Tourism, 13(5),
pp. 401-417.
65
   Many loss assessments also make the error of counting lost turnover and lost sales as losses, instead of
counting only lost profit. See: Emergency Management Australia, ‘Disaster loss assessment guidelines’ (2002).
66
   Deloitte Access Economics, Building our nation’s resilience to natural disasters (report commissioned by the
Australian Business Roundtable for Disaster Resilience and Safer Communities, 2013).

24
You can also read