Corporate Presentation - November 2020 - Coeur Mining
←
→
Page content transcription
If your browser does not render page correctly, please read the page content below

Corporate Presentation

          November 2020
                                   NYSE: CDE

                                   NYSE: CDE   1

JC 2016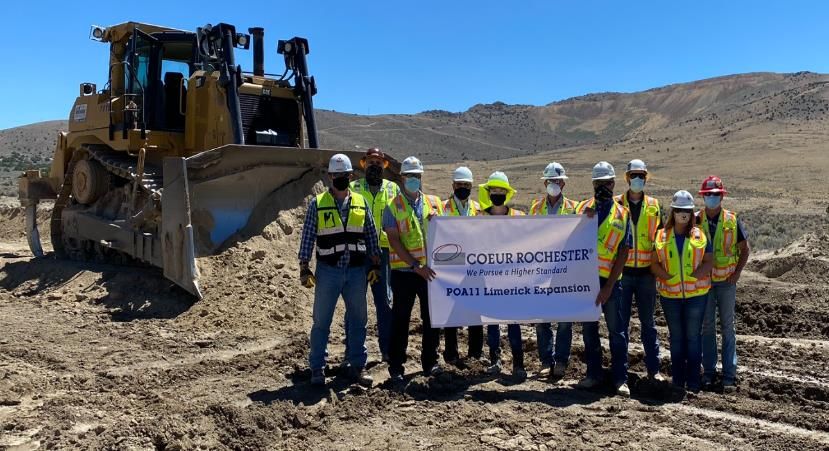
Cautionary Statements
          This presentation contains forward‐looking statements within the meaning of securities legislation in the United States and Canada, including statements involving strategic priorities and
          company strategies, expectations regarding environmental, social and governance (“ESG”) initiatives, anticipated production, costs and expenses, revenues, free cash flow, exploration and
          development efforts, health and safety protocols, COVID-19 planning and response measures, operations, expectations and initiatives at the Palmarejo, Rochester, Kensington, Wharf and
          Silvertip mines, the impact of the new crushing circuit, POA 11 expansion project and technical report preparation at Rochester, included expected future cash flow, metals price sensitivities,
          the impact of a new stacking plan at Rochester, the impact of Jualin on Kensington operations, debt repayment plans, placement rates, strategies, catalysts, capital allocation, growth,
          financial flexibility and hedging strategies. Such forward‐looking statements involve known and unknown risks, uncertainties, and other factors which may cause Coeur's actual results,
          performance, or achievements to be materially different from any future results, performance, or achievements expressed or implied by the forward‐looking statements. Such factors include,
          among others, the risk that the strategies, initiatives and expectations described in this presentation are not achieved on a timely basis or at all, the risks and hazards inherent in the mining
          business (including risks inherent in developing large‐scale mining projects, environmental hazards, industrial accidents, weather, or geologically related conditions), changes in the market
          prices of gold, silver, zinc, and lead, and a sustained lower price or higher treatment and refining charge environment, the uncertainties inherent in Coeur's production, exploratory and
          developmental activities, including risks relating to permitting and regulatory delays (including the impact of government shutdowns), ground conditions, grade variability, any future labor
          disputes, or work stoppages, the uncertainties inherent in the estimation of mineral reserves and resources, changes that could result from Coeur's future acquisition of new mining
          properties or businesses, the loss or insolvency of any third‐party smelter to which Coeur markets its production, the potential effects of the COVID-19 pandemic, including impacts to the
          availability of our workforce, continued access to financing sources, government orders that may require temporary suspension of operations at one or more of our sites and effects on our
          suppliers or the refiners and smelters to whom the Company markets its production, the effects of environmental and other governmental regulations and government shut-downs, the risks
          inherent in the ownership or operation of or investment in mining properties or businesses in foreign countries, Coeur's ability to raise additional financing necessary to conduct its business,
          make payments or refinance its debt as well as other uncertainties and risk factors set out in filings made from time to time with the United States Securities and Exchange Commission, and
          the Canadian securities regulators, including, without limitation, Coeur's most recent reports on Forms 10‐K and 10-Q. Actual results, developments, and timetables could vary significantly
          from the estimates presented. Readers are cautioned not to put undue reliance on forward looking statements. Coeur disclaims any intent or obligation to update publicly such
          forward‐looking statements, whether as a result of new information, future events, or otherwise. Additionally, Coeur undertakes no obligation to comment on analyses, expectations, or
          statements made by third parties in respect of Coeur, its financial or operating results or its securities.
          Christopher Pascoe, Coeur's Director, Technical Services and a qualified person under Canadian National Instrument 43‐101, reviewed and approved the scientific and technical information
          concerning Coeur's mineral projects in this presentation. Mineral resources are in addition to mineral reserves and do not have demonstrated economic viability. Inferred mineral resources
          are considered too speculative geologically to have the economic considerations applied to them that would enable them to be considered for estimation of mineral reserves, and there is no
          certainty that the inferred mineral resources will be realized. For a description of the key assumptions, parameters and methods used to estimate mineral reserves and resources, as well as
          data verification procedures and a general discussion of the extent to which the estimates may be affected by any known environmental, permitting, legal, title, taxation, socio‐political,
          marketing or other relevant factors, Canadian investors should see the Technical Reports for each of Coeur's properties as filed on SEDAR at www.sedar.com and the technical report for the
          Rochester mine to be filed on SEDAR in December 2020.
          Cautionary Note to U.S. Investors ‐ The United States Securities and Exchange Commission permits U.S. mining companies, in their filings with the SEC, to disclose only those mineral
          deposits that a company can economically and legally extract or produce. We may use certain terms in public disclosures, such as "measured," "indicated," "inferred” and “resources," that
          are recognized by Canadian regulations, but that SEC guidelines generally prohibit U.S. registered companies from including in their filings with the SEC. U.S. investors are urged to consider
          closely the disclosure in our Form 10‐K which may be secured from us, or from the SEC's website at http://www.sec.gov.
          Non‐U.S. GAAP Measures ‐ We supplement the reporting of our financial information determined under United States generally accepted accounting principles (U.S. GAAP) with certain
          non‐U.S. GAAP financial measures, including adjusted net income (loss), operating cash flow excluding changes in working capital, adjusted EBITDA, adjusted EBITDA margin, total leverage,
          net leverage, free cash flow and adjusted costs applicable to sales per ounce/pound. We believe that these adjusted measures provide meaningful information to assist management,
          investors and analysts in understanding our financial results and assessing our prospects for future performance. We believe these adjusted financial measures are important indicators of
          our recurring operations because they exclude items that may not be indicative of, or are unrelated to our core operating results, and provide a better baseline for analyzing trends in our
          underlying businesses. We believe adjusted net income (loss), adjusted EBITDA, adjusted EBITDA margin, total leverage, net leverage, free cash flow and adjusted costs applicable to sales
          per ounce/pound are important measures in assessing the Company's overall financial performance. This presentation does not represent an offer of any securities for sale.

                                                                                                                                                                                       NYSE: CDE         2

JC 2016
Company Overview
          Headquartered in Chicago, IL, Coeur Mining (NYSE: CDE) is a well-diversified,
          growing precious metals producer with a repositioned portfolio, focused on
          generating sustainable, high-quality cash flow from its North American assets

               Five                        Three                   Cash flow                 Committed            Best-in-class
          quality operations           top jurisdictions               focused              community partner   corporate governance

                                                                                                                Palmarejo
                                                                                                                Northern Mexico

                                                                                                                 Au    Ag

                                                                                                                Rochester
                                         S ILVERTIP                                                             West-Central Nevada

                         K ENSINGTON                                                                             Ag    Au

                                                                                                                Kensington
                                                                                                                Southeast Alaska

                                                                                                                 Au
                                                              W HARF
                                                      ROCHESTER                                                 Whar f
                                                                       C ORPORATE O FFICE                       Black Hills South Dakota

                                                                                                                 Au

                                                           PALMAREJO                                            Silver tip
                                                                                                                Northern British Columbia

                                                                                                                 Ag    Zn    Pb

                                                                                                                               NYSE: CDE    3

JC 2016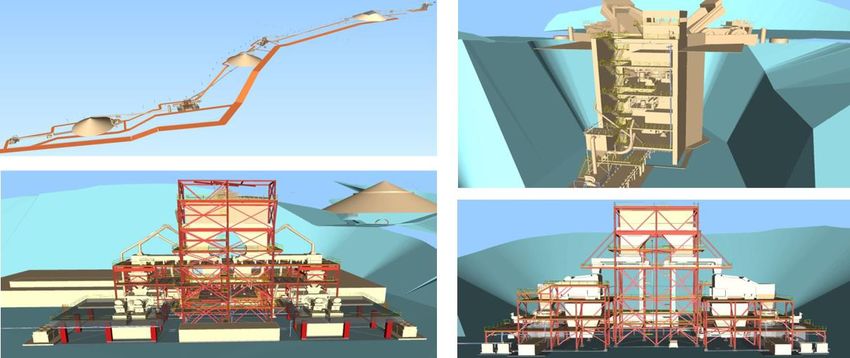
Why Invest in Coeur?

                             Compelling Strategy Aligned with Stockholder Priorities
                                                                                           ✓
                             Excellent Environmental, Social and Governance Initiatives
                                                                                           ✓
                             Balanced, Low-Risk Portfolio of Precious Metals Assets
                                                                                           ✓
                             Leading Exposure to Gold and Silver Prices
                                                                                           ✓
                             Multiple High-Impact Organic Growth Opportunities
                                                                                           ✓
                             Near-Term Inflection Point Driven by Nevada-Based Expansion
                                                                                           ✓
                             Attractive Trading Liquidity
                                                                                           ✓
                                                                                           NYSE: CDE   4

JC 2016
Compelling Strategy Aligned with Stockholder Priorities
                Coeur’s strategy is to safely and responsibly discover, develop and operate a
                balanced portfolio of quality precious metals assets to maximize cash flow,
                returns and net asset value
                                                    Priorities                                                                   ✓
                                                                                                                                 •      U.S.-based and NYSE-listed, mid-tier gold and silver producer
                                                                                                                                 •
                                                                                                                                 ✓      Balanced portfolio of assets located solely in North America
                                          Purpose                  Culture
                                                                                                                                        Targeting higher returns on invested capital and strong free cash
                   Accountability

                                                                                                                                 •
                                                                                                                                 ✓
                                           “Why”                   “How”

                                                                                             Alignment
                                                                                                                                        flow1 growth via high-impact organic growth
                                                                                                                                 •
                                                                                                                                 ✓      Industry-leading investment in exploration
                                        Organization              Strategy                                                       ✓
                                                                                                                                 •      Recognized as industry leader for ESG programs and initiatives
                                           “Who”                  “What”
                                                                                                                                 •
                                                                                                                                 ✓      Approaching key inflection point driven by Rochester expansion
                                                    Execution                                                                    •
                                                                                                                                 ✓      Approximately $45 million ADTV (~2.6% of market cap)2

                                                 Protecting the                                                            Social and                                                Governance
                                                 Environment                                                            Community Impact                                             Performance
                   • Leading tailings management                                                         • High-impact community                                    • 50% of independent directors are
                                    procedures and practices                                               partnerships and support                                   diverse
                   • Published responsibility report in                                                  • Innovative development and                               • Innovative incentive compensation
                                    April 2020                                                             diversity initiatives                                      design aligned with stockholders
                   • Recently entered into first-of-its kind                                             • First precious metals company to                         • ISS #1 Quality Score for Governance
                                    sage-grouse habitat agreement in                                       sign CEO Action for Diversity and
                                                                                                                                                                    • Proactive stockholder engagement
                                    Nevada                                                                 Inclusion pledge
                                                                                                                                                                    • Winner of 2019 Corporate Secretary
                   • Partnership with Trout Unlimited to                                                 • 71% of employees from
                                                                                                                                                                      Magazine’s Best Proxy Statement
                                    support abandoned mine legislation                                     surrounding communities
                                                                                                                                                                      Award (small cap)
          (1) Free cash flow is defined as cash flow from operating activities less capital expenditures and gold production royalty payments.                                                  NYSE: CDE   5
          (2) ADTV = Average Daily Trading Volume. Data observed over a 90-day trading period. FactSet as of October 30, 2020.

JC 2016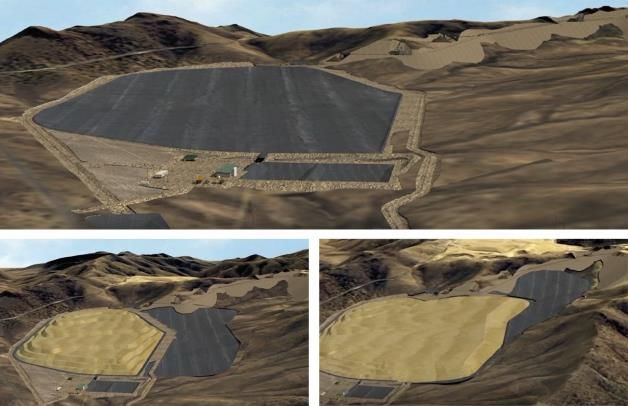
Recent Environmental, Social and Governance Accomplishments
          Coeur is committed to being an industry leader in its environmental, social and
          governance practices, exemplified by the Company’s accomplishments for
          protecting its people, places and planet

                                                                  #1
             Winner of cfi.co, Best Miner               Ranked Among Peer Group by
           Governance, North America 2020                 Sustainalytics, May 2020

          Finalist for S&P Global Platts Mining        Hosted Day of Understanding to
             and Metals Award 2020, CSR                 Promote Diversity & Inclusion

                                                                                           Published Responsibility Report
            Significantly Improved External                 Released ESG Goals
                Ratings and Rankings

                                    Winner of International EHS                         ISS QualityScore of ‘‘1’’ for Governance
                                      Innovation Award 2019                                        (Highest Possible)
                                                                                                                          NYSE: CDE   6

JC 2016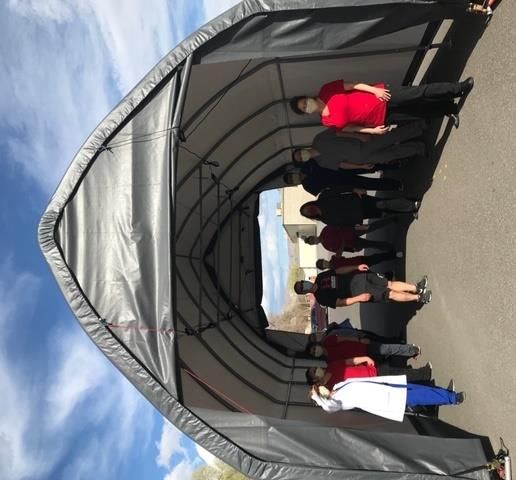
Balanced, Low-Risk Portfolio of Precious Metals Assets
                                                                                        2010                                                                                  YTD 2020

                                                                                     12%                                                                                                                               Palmarejo
                                                                                                                                                                           23%
                                                                                                                                                                                                                       Rochester
                                                                                                                                                                                           35%
                                                                                                                                                                                                                       Kensington
                                                                                                            45%
      Metal Sales by Asset                                                 28%        $516M                                                                                      $557M                                 Wharf
      (% of revenue)                                                                                                                                                                                                   San Bartolomé
                                                                                                                                                                           29%                                         Other1
                                                                                     5%                                                                                                  13%
                                                                                            10%

                                                                  15%                                                                                                                                                  U.S.
                                                                                                                                                                                                                       Mexico
                                                                  45%                                                                                                                                                  Bolivia
      … by Geography
                                                                                                                                                                                                                       Australia
      (% of revenue)                                              28%                                                                                 65%                                                              Argentina

                                                                   2%                                                                                        35%
                                                                                                                          10%
                                                                                                                                                      O ve r $ 420 m i l l ion o f U . S. N e t O pe r ating L o s ses 2

      … by Metal                                                                Ag Au                                                                                             Au Ag
      (% of revenue)                                                             69%               31%                                                                            76%      24%

          (1) Other refers to Coeur Capital (primarily production from the Endeavor silver stream in Australia) and the Martha Mine in Argentina. Both assets have been sold by Coeur.                           NYSE: CDE         7
          (2) As of December 31, 2019.

JC 2016
Repositioned Financial Profile Focused on Cash Flow
                The Company has repositioned itself to deliver higher-quality cash flow growth
                from longer mine lives and a more flexible balance sheet
                Total Debt/Interest Expense                                                      G&A Expense                                                                       Adj. EBITDA1/Margin1
                ($ M)                                                                            ($ M)                                                                             ($ M)
                              $463.2                          (35%)
                                                                                                                                                                                                               +4x                $239.2
                                                                                                                 $40.7                         (19%)

                                                              $301.1
                               $47.5                                                                                                                                                                                               32%

                                                                                                                                                $32.9
                                                               $21.5                                                                                                                              $58.9

                                                                                                                                                                                                   11%

                                2014                     LTM 3Q 2020                                             2014                      LTM 3Q 2020                                            2014                      LTM 3Q 2020

                Exploration Expense                                                              P&P Gold Reserves2                                                                P&P Silver Reserves2
                ($ M)                                                                            (oz)                                                                              (oz)

                                                               $38.3                                                                                                                                          +65%                182.9M
                                          +77%                                                                              +57%                 2.6M

                                                                                                                 1.6M                                                                           110.9M

                               $21.6

                                2014                     LTM 3Q 2020                                             2014                            2019                                             2014                             2019

          Note: See slides in appendix for additional information related to mineral reserves and resources. Canadian investors should refer to the applicable technical report on file at www.sedar.com.                            NYSE: CDE   8
          (1) See applicable non-GAAP reconciliation tables in the appendix to this presentation.
          (2) Figures exclude mining properties previously divested by Coeur. Figures exclude Coeur's La Preciosa silver-gold exploration project, which was reclassified from mineral reserves into mineral resources in 2015.

JC 2016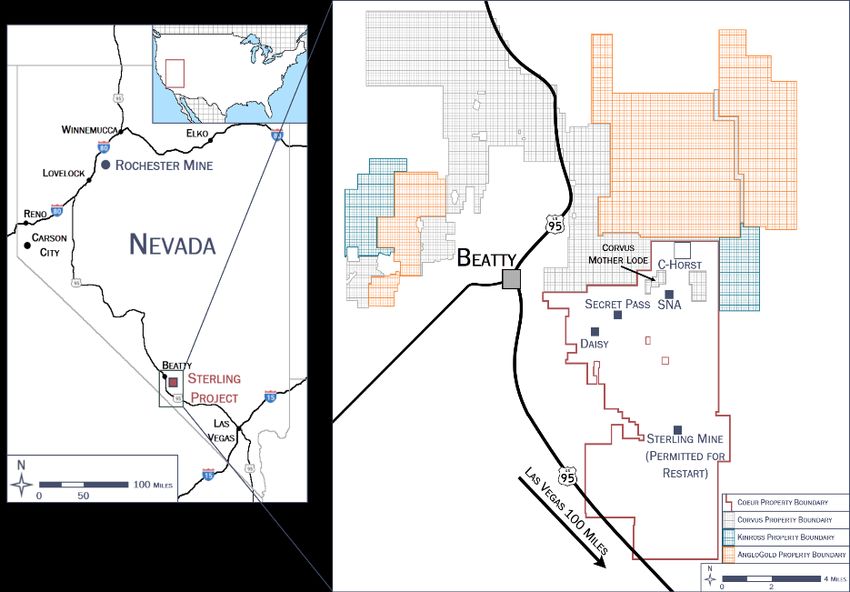
Leading Exposure to Gold and Silver Prices
Coeur’s diversified portfolio of precious metals assets is well-positioned to
capture the potential upside from rising gold and silver prices
Outlook for Precious Metals Prices Metals Price Sensitivities
Gold Prices Gold Market Fundamentals 2020E Revenue3
($/oz) ($ M)
$2,650 •✓ Unprecedented levels of global fiscal
$2,500
$2,431 Gold Price ($/oz)
$2,450 $2,331 and monetary stimulus
($250) $2,000 +$250
$2,250
•✓ Growing geopolitical risks and macro
$2,050 $1,839 ($5.00) ~$756 ~$781 ~$797
uncertainty
Silver Price ($/oz)
$1,850
$1,650 $1,546
•✓ Mine supply expected to decline
$1,450 $1,568 $1,600 $1,622 $1,550 $25.00 ~$786 ~$810 ~$827
$1,250
$1,270 •✓ Low/negative interest rate
$1,050
environment
2019A 2020E 2021E 2022E 2023E +$5.00 ~$816 ~$840 ~$857
Consensus Consensus •✓ Investment and central bank demand
Futures2
High/Low1 Average1
Silver Prices Silver Market Fundamentals 2020E Free Cash Flow3,4
($/oz) ($ M)
$32.00 $31.00 •✓ Attractive, growing, diverse demand
$33.00 Gold Price ($/oz)
$30.00 drivers
$29.50 ($250) $2,000 +$250
$26.00 •✓ Nearly ~70% of global mine supply
derived as by-product ($5.00) ~$21 ~$42 ~$54
Silver Price ($/oz)
$22.50
$19.31 $21.66
$19.00
•✓ Highly correlated to both gold and
$15.50 $18.26 $25.00 ~$45 ~$66 ~$78
copper
$14.38 $14.88 $15.00 $15.30
$12.00
2019A 2020E 2021E 2022E 2023E •✓ Small, illiquid market leads to high
+$5.00 ~$69 ~$89 ~$102
volatility
Consensus Consensus
Futures2
High/Low1 Average1
(1) Source: S&P Global Market Intelligence. Data as November 2, 2020. NYSE: CDE 9
(2) Source: Bloomberg. Data as of October 30, 2020. 2020 figures reflect averages for remaining periods.
(3) Analysis assumes metal sales of approximately 350,000 ounces of gold and 10.3 million ounces of silver; includes hedge position for 2H 2020 as well as ounces sold under Palmarejo’s gold stream agreement.
(4) Free cash flow is defined as cash flow from operating activities less capital expenditures. See reconciliation tables in the appendix to this presentation.
JC 2016
Coeur’s Capital Allocation Framework
Mining is capital intensive and requires a disciplined approach to capital
allocation with a view toward long-term reserve replacement and growth
Illustrative
Investment Return Key Benefits Key Considerations
✓ Reflects the Company’s values
Safety/Environment/
− ✓ Mitigates risk for stakeholders
Sustainability
✓ Establishes and sustains social license
✓ Highest returns
Asset Optimization/ ✓ Quickest impact
25% + Finite opportunity set
Enhancements ✓ Low capital intensity
✓ Lowest risk
✓ High success / lowest risk exploration
Brownfield Returns dependent on specific deposit
20% + ✓ Low average discovery cost
All deposits eventually come to an end
Exploration
✓ Quick payback given existing infrastructure
Limited number of opportunities meet criteria
✓ Opportunity to meaningfully impact company
Opportunistic M&A 15% + ✓ Scale and liquidity can be differentiators
Requires significant organizational commitment
Challenging social dynamics
6% - 10% estimated cost of capital
Low success rate
Greenfield Can vary ✓ Potential to create substantial value from new
discoveries
Requires long-term, sustained financial and
Exploration widely organizational commitment
✓ Eliminates/reduces interest expense Low ROI
Debt
5% - 6% ✓ Improves balance sheet flexibility Reduces cash liquidity levels
Repayment
✓ Mitigates downside metal price risk Bond buybacks can be expensive
✓ Reflects Board and management confidence in
Industry’s cyclicality and capital intensity
Dividends/ long-term outlook
− ✓ Provides discipline
Not a key driver for most investors
Repurchases
✓ Offers opportunity to differentiate among peers
Limited under indenture and credit agreement
NYSE: CDE 10
JC 2016Multiple High-Impact Organic Growth Opportunities
Coeur has multiple high-impact exploration, expansion and optimization
opportunities embedded in its portfolio, which it plans to methodically pursue
by prioritizing investments based the Company’s capital allocation framework
Exploration Expansion Optimization
Near-Mine New Discoveries Rochester Upgrade and Palmarejo Recoveries
Expansion
Palmarejo District Sterling
Rochester Throughput
Lincoln Hill Crown Palmarejo Excess Processing and HPGR
East/West Rochester Capacity
C-Horst
Kensington District Kensington Automation
Richmond Hill Silvertip Expansion and
Silvertip District Restart Wharf Crushing Rates
•✓ Pursuing a higher standard •✓ Aligning organizational structure and incentive compensation
•✓ Executing largest exploration program in Company history •✓ Measuring success based on actual results
•✓ Allocating capital according to Company’s framework •✓ Striving to achieve higher returns, longer mine lives and
margin expansion
NYSE: CDE 11
JC 2016Nevada-Based Exploration Investment Opportunities
Coeur uniquely positioned to build out its organic growth portfolio in the U.S.,
specifically in Nevada – a top mining jurisdiction. The Company believes
investing in these opportunities will drive long-term value for stockholders
Northern Nevada Southern Nevada
•✓ Significant potential to further grow reserves and •✓ Acquired in late 2018 containing multiple gold deposits
leverage Rochester’s existing infrastructure •✓ ~35,500 net acres in southern Nevada near existing
•✓ East Rochester represents potential for significant infrastructure
higher-grade addition to current reserves and resources •✓ New discovery results (e.g., C-Horst) by Coeur adjacent
•✓ Acquired property package adjacent to Rochester in late to other new gold discoveries
2018 for ~$19 million •✓ Future potential sources of low cost, long-life open pit
•✓ Total land position of over 40,300 acres gold production
NYSE: CDE 12
JC 2016Rochester: Expansion Represents Key Near-Term Catalyst
The Company is advancing efforts to expand Rochester under Plan of
Operations Amendment 11 (“POA 11”), which is expected to reposition the
mine as a cornerstone asset and unlock significant value for stockholders
High-Level Project Timeline
2018 2019 2020 2021 2022/2023 2023
Start X-Pit Commission Receive ROD1 Co m p l e t e A dv a n c e a n d New expansion
expansion fi r s t H P G R a n d and begin phase I of commission i n fr a s t r u c t u r e
incorporating advance construction stage VI leach new expansion i n fu l l
HPGR engineering on expansion pad in 2H i n fr a s t r u c t u r e p r o du c t i o n
Key Highlights of Expansion
Top-tier mining Low technical execution risk
jurisdiction (11th expansion over 35 years)
Nevada and U.S. NOLs Open pit, heap leach
Accelerated silver recoveries Largest U.S.-based primar y
utilizing HPGR technology silver mine
At current gold and silver prices, Rochester is
expected to generate at least $100 million of
70%/2 yrs. vs. 60%/20 yrs. Post-expansion
annual free cash flow2 post-expansion
(1) Record of Decision. NYSE: CDE 13
(2) Free cash flow is defined as cash flow from operating activities less capital expenditures and gold production royalty payments.
JC 2016Rochester: Expansion Represents Key Near-Term Catalyst (cont.)
The Company expects to publish an updated technical report for Rochester in
December 2020, reflecting ~$350-$400 million of construction capital and an
after-tax NPV5% of ~$550-$650 million based solely on proven and probable
reserves
Value Proposition Facilitates Multiple Stockholder Priorities
Successful Near-Mine Exploration •✓ Higher overall returns on invested capital
+ Economies of Scale
•✓ Sustained, strong free cash flow1
+ HPGR Crusher Impact on Silver Recoveries
•✓ Further de-leveraging opportunities
•✓ Leading, low-risk exposure to precious metals prices
Higher Returns
Funding of other high-quality growth opportunities
= Fundamental Step -Change for Coeur
•✓
•✓ Potential to return excess capital over the long term
Funding Strategy HPGR Crushing
• Cash on balance sheet HPGR microfractures release silver
Cash on
• Opportunistic monetization of strategic
Hand
investments (e.g., Metalla)
• Expect strong cash flow generation during
Internally
construction period
Generated
− Operating cash flow from Rochester
Cash Flow
− Free cash flow1 from other operations
Existing Debt • Revolving credit facility
Capacity • Equipment and finance leases
Unleached Leached
• Utilizing zero-cost collars on gold
Opportunistic
− Targeting up to 50% of expected gold HPGR creates micro-fractures, breaking silica
Hedging
production through 2022 encapsulation, causing higher silver exposure
(1) Free cash flow is defined as cash flow from operating activities less capital expenditures and gold production royalty payments. NYSE: CDE 14
JC 2016Rochester: Expansion Represents Key Near-Term Catalyst (cont.)
Coeur began initial construction on POA 11 in August 2020, with major
construction projects scheduled to begin in 2021 and be largely completed by
late 2022
2019 2020 2021 2022 2023
4Q 1Q 2Q 3Q 4Q 1Q 2Q 3Q 4Q 1Q 2Q 3Q 4Q 1Q 2Q
Leach Construction First Production
I Pad1 Began From Stage VI
Merrill-Crowe
II Plant
Crushing
III Circuit
General
Infra.
Site
Power
Engineering Procurement Construction Commissioning
I II III
(1) Includes ancillary facilities. NYSE: CDE 15
JC 2016Balance Sheet and Hedging Summary
Liquidity Profile Debt and Leverage Summary1,2
($M) ($M)
2.0x
1.7x
$77.1 $286.6 1.5x
1.3x 1.4x
$250.0 0.9x
$298.7 $295.5 $301.1
$209.5
($20.0)
($20.5) $239.9
$233.4
$224.0
Sept. 30, Dec. 31, Sept. 30, Sept. 30, Dec. 31, Sept. 30,
Revolver Borrowings Letters Revolver Cash and Total
2019 2019 2020 2019 2019 2020
Capacity of Credit Availibilty Equivalents Liquidity
September 30, 2020 Total Debt & Total Leverage Net Debt & Net Leverage
Summary of Metal Sales Hedges Snapshot of Metal Sales Hedges
• Opportunistically executing hedges to support 4Q 2020 2021 2022
funding of POA 11
Strategy Ounces
− Targeting up to 50% of expected gold 55,500 158,700 126,000
Hedged
production through 2022
• Zero-cost collar gold hedge
Avg. Ceiling ($/oz) $1,823 $1,875 $2,030
− No upfront costs
Instrument
− “Guarantees” price floor and provides upside
price participation up to a specified ceiling
Avg. Floor ($/oz) $1,471 $1,600 $1,626
Settlement • Financially, against monthly average LBMA3 pricing
(1) See non-GAAP reconciliation tables in the appendix to this presentation. NYSE: CDE 16
(2) Net debt equals total debt less cash and cash equivalents.
(3) London Bullion Market Association.
JC 2016Looking Ahead: Delivering Consistent Operating & Financial Results
• Maintain focus on rigorous health and safety protocols
✓
• Sustain strong operating performance at Palmarejo and Wharf
✓
• Continue executing revised stacking plan and advancing early-stage
✓
POA 11 construction activities at Rochester
• Increase high-grade contributions from Jualin at Kensington
✓
• Remain committed to a high-level of exploration investment to drive
✓
reserve and resource growth
• Adhere to capital allocation framework and prudently invest in high-
✓
return growth opportunities
• Further enhance financial flexibility by repaying debt and building cash
✓
NYSE: CDE 17
JC 20162020 Guidance 1
Production Outlook
Gold (oz) Silver (K oz)
Palmarejo 100,000 – 110,000 6,000 – 7,000
Rochester 27,000 – 33,000 3,100 – 3,700
Kensington 122,500 – 130,000 -
Wharf 85,000 – 95,000 -
Consolidated 334,500 – 368,000 9,100 – 10,700
CAS Outlook2
Gold ($/oz) Silver ($/oz)
Palmarejo (co-product) $650 - $750 $9.50 - $10.50
Rochester (co-product) $1,150 - $1,300 $13.50 - $14.75
Kensington $900 - $1,000 -
Wharf (by-product) $875 - $925 -
Capital, Exploration and G&A
($M)
Capital Expenditures, Sustaining3 $55 – $60
Capital Expenditures, Growth $45 – $55
Exploration, Expensed $43 – $49
Exploration, Capitalized $7 – $11
General & Administrative Expenses $32 – $36
Note: The Company’s guidance reflects realized prices through 3Q 2020 and estimated prices of $1,850/oz gold and $24.00/oz silver as well as CAD of 1.30 and MXN of 21.00 for 4Q 2020. NYSE: CDE 18
(1) Guidance as published by Coeur on October 28, 2020.
(2) See non-GAAP reconciliation tables in the appendix to this presentation.
(3) Sustaining capital expenditures exclude capital leases.
JC 2016ESG Highlights
NYSE: CDE 19
JC 2016What Matters to Coeur
Environmental • Training and Development
• Climate Change • Health, Safety & Security
• Green House Gas Emissions Society
• Water Stewardship • Investment in Local Communities
• Waste Minimization • Indigenous Rights
• Biodiversity • Human Rights
• Tailings Management Governance
• Closure Planning • Ethics and Governance
Social • Compliance
Human Capital Management • Anti-Corruption
• Fair Employment Practices and Equal
Opportunity
NYSE: CDE 20
JC 2016Aiming to Reduce Greenhouse Gas Emissions
Coeur strives to increase production while using less energy over the long-
term. With the support of site-specific energy leads and champions across the
Company, Coeur is managing its carbon footprint and reducing greenhouse
gas emissions
Recent Energy Management Highlights
ROCHESTER WHARF
Implemented improved crushing system Signed agreement to source electricity
and mining process from wind generated power
Results: Results:
• Efficiencies resulted in nearly 27M kw-hrs of • Agreement begins in 2021
electricity savings • More than 40% of the electricity used by Wharf
• Energy saved is equivalent to approximately expected to come from wind generated power
four months of operation in 2021
• Savings could power approximately 2,500 • Wharf plans to increase its proportion of power
homes for one year1 generated from wind as capacity is available
• Awarded $435,000 from NV Energy PowerShift with a goal to eventually source 100% of its
Program – the largest award in NV Energy’s electricity from wind generated power
portfolio history
These initiatives are expected to reduce greenhouse gas emissions
by more than 14,500 t annually2
(1) According to the EIA, in 2019, the average home used 10,649 kw-hrs annually. Thus, 2,535 homes could be powered by the savings of 27M kw-hrs. https://www.eia.gov/tools/faqs/faq.php?id=97&t=3. NYSE: CDE 21
(2) Wharf greenhouse gas reduction estimate is based on 2019 electricity use.
JC 2016Precious Metals Are Coeur to Everyday Life
Coeur is an important part of the supply chains for gold and silver. Due to their
unique properties, gold and silver have countless innovative uses that shape
the way we live today and enable a more sustainable, healthier tomorrow
Au
Coeur’s Palmarejo, Rochester, Kensington and Wharf mines produce gold, which is a critical component of:
Medical Devices Electronics Electrification Devices Transportation
COVID-19 diagnostic test kits, Nanotechnology and touch Batteries and solar panels GPS technology and catalytic
pacemakers, CAT scan screen monitors converters in motor vehicles &
equipment and others electric vehicle circuit boards
Ag
Coeur’s Palmarejo and Rochester mines produce silver, which is a critical component of:
Medical Devices Renewable Energy Household Items Public Health
Bandages, pharmaceuticals Photovoltaic cells in solar Mirrors, clothing and jewelry Water purification systems
and anti-microbial coating for panels
equipment
Source: Mining Association of Canada, MineralsMakeLife.org, The National Mining Association and The United States Geological Survey (USGS). NYSE: CDE 22
JC 2016Committed to Diversity and Inclusion
“The tragic death of George Floyd and other horrific events…serve as stark
reminders that, as a society, much work remains to be done to address racism
and the conscious and unconscious biases that enable its existence. At Coeur,
we are committed to fostering diversity and inclusion at our company and in
our communities.”
–Mitchell J. Krebs, President & CEO
• ✓ First and only precious •✓ Designed to highlight and •✓ Coeur sponsored ‘reading •✓ Creating relationship with
metals mining CEO to sign engage members of the playoffs’ event for four My Block, My Hood, My City
the CEO ACTION for military consecutive years − Providing transportation
Diversity & Inclusion pledge after school to Coeur’s
•✓ Allows service members to •✓ Expanding partnership to
headquarters in
• ✓ Hosted a Day of use the special skills include: COVID-19
Chicago for an
Understanding in early developed during their time response and staff
afternoon of exploring
2020 of service to help make a diversity training
precious metals mining
difference at Coeur’s
− Created platform for
operations •✓ Hosted Geology 101 event − Goal of exposing
open dialogue and for students Chicago’s Black youth
meaningful − Provided 87 career
to our industry and
conversations on opportunities to current •✓ Developing STEM After- career opportunities
diversity and inclusion and former U.S. Military school program for
personnel graduating Seniors
NYSE: CDE 23
JC 2016COVID-19 Response and Decision-Making Approach
Coeur’s principal objective to help combat COVID-19 is to safeguard the health,
safety and well-being of its workforce, their families and the communities
where the Company operates
Guidance f rom key agencies
U .S. Centers Mexican and F ederal,
f or D isease World Health Canadian state and
Control and Organization public health loc al
Prevention of ficials authorities
Coeur COV ID -19
Committee
S afeguarding the health, saf ety and well -being of
workforce, f amilies and c ommunities
Minimizing business interruption
NYSE: CDE 24
JC 2016Activities to Protect People and Places During COVID-19
•
✓ Social distancing and enhanced cleaning
•
✓ Multilayered testing strategy
•
✓ Traditional contact tracing complemented by wearable technology pilot
•
✓ Remote work for office employees
•
✓ Only essential business travel
People •
✓ Pre-work and on-site health screenings
•
✓ Regular CEO communications; talking points for local leaders
•
✓ Sick leave policies cover bonus payments to camp employees affected by
extended schedules and quarantine
•
✓ Partner with communities in communication and response efforts
•
✓ Greatly reduced travel, limiting community risk of exposure
•
✓ Implementing company-provided testing and contact tracing organization-wide
•
✓ Donations, including PPE and supplies for vulnerable community members
Places
•
✓ Palmarejo clinic open to the public
NYSE: CDE 25
JC 2016Active Involvement in Protecting Our Communities
Health tent at Wharf used for screening
temperatures and completing questionnaire forms
Rochester team showcasing completed drive-through testing
center donated to Pershing County Hospital
Food distribution at Palmarejo
NYSE: CDE 26
JC 2016Industry-Leading Safety Performance
Coeur has held the National Mining Association CORESafety certification since 2017
Coeur’s injury frequency rate remains significantly below industry averages
Lost-Time Injury Frequency Rate Total Reportable Injury Frequency Rate
Industry average1 Industry average1
Coeur Mining2 Coeur Mining2
1.67 1.64 2.34
1.53 2.23 2.23
1.41 1.37 2.02
1.34 2.27 1.93
1.25 1.73 1.81
1.16 1.68
1.58
0.74 1.04 1.03 0.96
0.85
0.43 0.42 0.60 0.69 0.69
0.33 0.30
0.23 0.26 0.20 0.20
2012 2013 2014 2015 2016 2017 2018 2019 YTD 2012 2013 2014 2015 2016 2017 2018 2019 YTD
20203 20203
(1) Source(s): U.S. Department of Labor Mine Safety and Health Administration: Metal Operators Mine Safety and Health Statistics. Injuries per 200,000 employee-hours worked. NYSE: CDE 27
(2) Includes both Coeur employees and contract workers.
(3) Coeur YTD 2020 information through September 30, 2020.
JC 2016Demonstrating Our Commitment
Governance Practices
✓ Board Refreshment and Succession Planning
− Two new independent directors added to the Board in February 2018 and five directors – more than 50% of the Board – added in last seven years
• Also added a new independent director in early 2019, who recently had to resign in connection with a new professional position that did
not allow outside board service
− Active Board succession planning and refreshment
✓ Robust Board and Committee Evaluations
− Annual evaluations promote Board and Board committee effectiveness
− Chairman’s one-on-one meetings with each director promote candor, effectiveness and accountability
✓ No Related Party Transactions
− No related person transactions with directors or executive officers
✓ Board-Level Risk Oversight
− The Board and Board committees take an active role in the Company’s risk oversight and risk management processes
✓ Active Stockholder Engagement
− During 2019, Coeur continued its proactive and robust stockholder outreach efforts on governance, executive compensation and other matters,
contacting all institutional stockholders of 0.15% or more
✓ Clawback Policy
− Added officer misconduct to the scope of clawback policy in addition to financial restatement-driven events
Stockholder Rights
• ✓ Annual Election of Directors
− All directors are elected annually for one-year terms
•✓ Majority Voting for Director Elections
− Majority voting in uncontested director elections with a resignation policy
•✓ Stockholder Right to Call Special Meetings
− Stockholders owning 20% or more of Coeur’s common stock have the right to call a special meeting of the Stockholders
•✓ No Poison Pill
− Coeur does not have a poison pill or similar anti-takeover defenses in place
•✓ Proxy Access
− Proactively adopted proxy access in March 2019, which allows stockholders who have satisfied specified requirements under the Company’s
Bylaws to include director nominees in the Company’s proxy statement and form of proxy (greater of two nominees or 20% Board seats)
NYSE: CDE 28
JC 2016Significantly Improved Corporate Governance Profile
Corporate Governance Enhancements Since 2010 2010 2020
Independent Board Chairman
Entire Board of Directors is independent other than CEO
Gender diversity on the Board
Majority voting standard for uncontested Director elections
Proxy access allowing certain stockholders to nominate directors
Robust Board and Committee self-evaluation (including 1:1 discussions with
Chairman and third-party participation)
Executive and Director stock ownership guidelines
No excise tax gross-up on executive severance
All incentive awards subject to double-trigger change-in-control vesting
60% of executive equity awards are performance shares and 40% are time-
vesting restricted stock
Independent executive compensation consultant to compensation committee
No executive employment agreements other than CEO
No “related person transactions" with Directors or executive officers
Robust executive compensation clawback policy covering officer misconduct
NYSE: CDE 29
JC 20162019 CEO Compensation Tied to Stockholder Returns
Base Salary
19%
Performance
Shares
57% of compensation 34%
linked to stock
performance AIP
24%
Restricted (Based 100% on
Stock Company Performance)
23%
NYSE: CDE 30
JC 20162020 Incentive Plan
Aligned with Strategic Objectives & Purpose Statement
TRIFR % Reduction
PROTECT
AIP1 20%
% Decline in Permit Exceedances
Three-Year Growth in Reserves and
DEVELOP
PSUs2,3 35%
Resources from Continuing Operations
Achievement of Milestones for Strategically
PSUs2,3 30%
Critical Long-Term Projects4
Costs Applicable to Sales per Ounce
AIP 55%
Adjusted EBITDA
DELIVER
Three-Year Return on Invested Capital PSUs2,3 35%
Production AIP 25%
(1) Annual incentive plan. NYSE: CDE 31
(2) Performance share units.
(3) The three internal performance share metrics are subject to a relative total stockholder return (“TSR”) modifier that adjusts payouts +/-25% for top or bottom quartile performance compared to peers.
(4) Tied to achievement of Rochester and Silvertip expansion projects (split 20% Rochester and 10% Silvertip) and YE 2022 net asset values for Rochester and Silvertip.
JC 2016Diverse Board Led by Independent Chair
•
✓ Eight out of nine Directors Skill1
are independent (all except
CEO); all four main Current and Former Chief Executive 90%
committees comprised of Project Development/Management 80%
independent directors only
Environmental, Social and Governance/Health
90%
and Safety
•
✓ Two directors elected in Government Affairs, Regulatory and Legal 80%
February 2018 having skills
and experiences that Strategy Development and Execution 90%
complement other directors
Capital Markets Transactions 80%
•
✓ Balance of newer and Extractive or Cyclical Industry 70%
longer serving directors; no
U.S. Public Company Board Service 70%
mandatory retirement age
Finance/Accounting 70%
•
✓ Half of independent Technology/Cyber Security 20%
directors are diverse
(gender or ethnicity), Human Capital Management 100%
contributing to a variety of
Culture 100%
viewpoints
(1) Percentages rounded to nearest 10%. NYSE: CDE 32
JC 2016Diverse Board Led by Independent Chair (cont.)
Other Public
Name Age Audit CLDC NCGC EHSCR Exec Independent Company Boards
Robert E. Mellor (Chairman) 76 • (C) (C) • 1
Linda L. Adamany 68 (C)(F) • • 2
Sebastian Edwards 66 • • • 0
Randolph E. Gress 64 (F) • • • 0
Mitchell J. Krebs 48 • 1
Eduardo Luna 74 • • • 2
Jessica L. McDonald 51 • • • 2
John H. Robinson 69 (C) • • • 1
J. Kenneth Thompson 68 • (C) • • 3
(C) Denotes the Chair of each committee
(F) Denotes Audit Committee financial expert
Diversity Tenure Independence
Ethnic Gender 1-3 Yrs 3-10 Yrs 10+ Years Independent Not Independent
NYSE: CDE 33
JC 2016Appendix
NYSE: CDE 34
JC 2016Palmarejo
Ownership 100%
Claims 112,520 net acres
Type Underground
Crushing, grinding, flotation, CIL,
Processing
Merrill-Crowe precipitation, refining
Metals Silver and gold doré
Mine life ~7 years
Palmarejo
Chihuahua, Northern Mexico
Share of Companywide 2020E 1 Production 2015 & 2019 Reserves & Resources 2
P&P Reserves M&I Resources Inferred Resources
50.5M
Gold Silver
26.3M
34.5M
44.9M
693
690
367
25.3M
425
30%
330
351,250 9.9M
147
8.2M
oz oz
66%
2015 2019 2015 2019 2015 2019
Gold (K oz) Silver (M oz)
(1) Based on midpoint of guidance as published by Coeur on October 28, 2020. NYSE: CDE 35
(2) See slides in appendix for additional information related to mineral reserves and resources. Canadian investors should refer to the applicable technical report on file at www.sedar.com.
JC 2016Palmarejo (cont.)
Production and Cost Performance Operating Cash Flow and Capital Expenditures
($M)
Operating cash flow
Capital expenditures
$686
$660 $645 $10.06 $49.7
$622
$41.4
$602 $36.3
$8.95 $8.79
$8.37 $8.13
2,029 $28.9
32 32 1,835
1,720 29 29 1,784
$7.8 $8.6 $7.1
15 867 $4.5 $5.0
($3.5)
3Q 2019 4Q 2019 1Q 2020 2Q 2020 3Q 2020 3Q 2019 4Q 2019 1Q 2020 2Q 2020 3Q 2020
Gold production (K oz) Adj. CAS per AuOz1
Silver production (K oz) Adj. CAS per AgOz1
Costs Per Ton 3Q 2019 4Q 2019 1Q 2020 2Q 2020 3Q 2020
($)
UG tons mined 463,994 475,595 491,080 274,126 475,939
UG mining costs per UG ton mined $38 $35 $35 $32 $36
Processing costs per ton processed2 $26 $27 $24 $21 $25
G&A per ton processed3 $11 $10 $10 $12 $7
(1) See applicable non-GAAP reconciliation tables in the appendix to this presentation. NYSE: CDE 36
(2) Excludes third-party refining charges.
(3) Excludes management fee allocated from corporate.
JC 2016Rochester
Ownership 100%
Claims 16,494 net acres
Type Open pit and heap leach
Crushing, dump heap leaching,
Processing
Merrill-Crowe precipitation, refining
Metals Silver and gold doré
Rochester
Mine life ~15 years Nevada, U.S.
Share of Companywide 2020E 1 Production 2015 & 2019 Reserves & Resources 2
P&P Reserves M&I Resources Inferred Resources
117.5M
82.8M
Gold Silver
737
67.5M
60.8M
546
79.3M
378
483
34%
477
9.9M
31.2M
351,250
179
oz oz
9%
2015 2019 2015 2019 2015 2019
Gold (K oz) Silver (M oz)
(1) Based on midpoint of guidance as published by Coeur on October 28, 2020. NYSE: CDE 37
(2) See slides in appendix for additional information related to mineral reserves and resources. Canadian investors should refer to the applicable technical report on file at www.sedar.com.
JC 2016Rochester (cont.)
Production and Cost Performance Operating Cash Flow and Capital Expenditures
($M)
$1,481 Operating cash flow
$1,359 Capital expenditures
$1,230
$1,142 $1,148
$10.2 $9.8
$14.38 $14.98 $8.3
$14.24 $13.75
$13.25 $6.9
$5.1 $5.8
$5.0
$2.1
982
848
687 728 740
11
8
6 6
5 ($5.6)
($9.3)
3Q 2019 4Q 2019 1Q 2020 2Q 2020 3Q 2020 3Q 2019 4Q 2019 1Q 2020 2Q 2020 3Q 2020
Silver production (K oz) Adj. CAS per AgOz1
Gold production (K oz) Adj. CAS per AuOz1
Costs Per Ton 3Q 2019 4Q 2019 1Q 2020 2Q 2020 3Q 2020
($) Ore tons mined 2,497,963 2,574,343 3,512,239 5,769,097 4,746,086
Strip Ratio 0.3:1 0.4:1 0.6:1 0.1:1 0.1:1
Mining costs per ton mined $2.75 $2.27 $1.47 $1.29 $1.93
Processing costs per ton processed2 $3.75 $4.57 $3.57 $3.30 $3.03
G&A per ton processed3 $1.24 $1.36 $1.25 $0.98 $0.95
(1) See applicable non-GAAP reconciliation tables in the appendix to this presentation. NYSE: CDE 38
(2) Excludes third-party refining charges.
(3) Excludes management fee allocated from corporate.
JC 2016Review of HPGR Technology
HPGR technology is relatively new to precious metals mining, although it has
been proven in processing other materials. The implementation of HPGR at
Rochester is expected to improve silver recoveries and lower operating costs
HPGR Schematic 1 Selected Commentary
Feed • Feed material is subjected to high compressive force
Floating roll Fixed roll exerted by the floating roll, which is regulated by
hydraulic pistons
• Counter rotating rolls draw in a bed of material,
which is crushed via inter-particle comminution
• Creates micro-fractures in crushed material, allowing
cyanide to flow more freely
– Increases silver recoveries when compared to
Hydraulic pistons Product other crushers
Key Advantages
Low operational and maintenance costs due in large
✓
part to limited moving parts
✓ Limited downtime for wear part replacement
✓ Comparatively higher comminution efficiency
✓ Accommodates greater mineral variability
HPGR crushing unit at Rochester
(1) Thyssenkrupp Industrial Solutions POLYCOM® Installations (2018). NYSE: CDE 39
JC 2016Kensington
Ownership 100%
Claims 12,336 net acres
Type Underground
Processing
Crushing, grinding, flotation Kensington
processing Alaska, U.S.
Metals Gold concentrate
Mine life ~3 years
Share of Companywide 2020E 1 Production 2015 & 2019 Reserves & Resources 2
P&P Reserves M&I Resources Inferred Resources
762
Gold
690
518
560
351,250
358
366
oz
36%
2015 2019 2015 2019 2015 2019
Gold (K oz)
(1) Based on midpoint of guidance as published by Coeur on October 28, 2020. NYSE: CDE 40
(2) See slides in appendix for additional information related to mineral reserves and resources. Canadian investors should refer to the applicable technical report on file at www.sedar.com.
JC 2016Kensington (cont.)
Production and Cost Performance Operating Cash Flow and Capital Expenditures
($M)
$1,128 Operating cash flow2
Capital expenditures
$976 $20.8
$928 $934
$19.2 $18.9
$822
$15.2
34 33 $14.2
32
30
27
$4.9 $4.8 $5.3
$4.3 $3.9
3Q 2019 4Q 2019 1Q 2020 2Q 2020 3Q 2020 3Q 2019 4Q 2019 1Q 2020 2Q 2020 3Q 2020
Gold production (K oz) Adj. CAS per AuOz1
Costs Per Ton 3Q 2019 4Q 2019 1Q 2020 2Q 2020 3Q 2020
($) Ore tons mined 169,090 167,499 166,909 168,435 162,572
Mining costs per ton mined $58 $65 $64 $72 $73
Processing costs per ton processed3 $40 $43 $44 $40 $50
G&A per ton processed4 $38 $43 $46 $40 $41
(1) See applicable non-GAAP reconciliation tables in the appendix to this presentation. NYSE: CDE 41
(2) Excludes impact of prepayments.
(3) Excludes third-party smelting charges, which are reflected in average realized selling prices of concentrate production.
(4) Excludes management fee allocated from corporate.
JC 2016Wharf
Ownership 100%
Claims 7,852 net acres
Type Open pit and heap leach
Crushing, “on-off” heap leaching,
Processing spent ore neutralization, carbon
absorption/desorption Wharf
South Dakota, U.S.
Metals Electrolytic cathodic sludge
Mine life ~7 years
Share of Companywide 2020E 1 Production 2015 & 2019 Reserves & Resources 2
P&P Reserves M&I Resources Inferred Resources
334
134
Gold
768
26%
712
81
167
351,250
oz
2015 2019 2015 2019 2015 2019
Gold (K oz)
(1) Based on midpoint of guidance as published by Coeur on October 28, 2020. NYSE: CDE 42
(2) See slides in appendix for additional information related to mineral reserves and resources. Canadian investors should refer to the applicable technical report on file at www.sedar.com.
JC 2016Wharf (cont.)
Production and Cost Performance Operating Cash Flow and Capital Expenditures
($M)
Operating cash flow
$1,090 Capital expenditures $39.1
$887
$802 $804 $804
33
26 26 $19.1
25 $17.6 $17.0
16
$2.6
$0.8 $0.8 $0.4 $0.3 $0.5
3Q 2019 4Q 2019 1Q 2020 2Q 2020 3Q 2020 3Q 2019 4Q 2019 1Q 2020 2Q 2020 3Q 2020
Gold production (K oz) Adj. CAS per AuOz1
Costs Per Ton 3Q 2019 4Q 2019 1Q 2020 2Q 2020 3Q 2020
($)
Ore tons mined 1,315,446 1,169,344 921,897 1,376,237 1,320,542
Strip Ratio 1.0:1 1.1:1 1.8:1 0.9:1 1.5:1
Mining costs per ton mined $3.70 $3.82 $4.09 $3.93 $3.38
Pad unload costs per ton mined $1.13 $0.86 $0.59 $1.11 $0.68
Total mining costs per ton mined (incl. pad unload) $4.82 $4.67 $4.67 $5.04 $4.05
Processing costs per ton processed2 $1.82 $3.01 $3.36 $2.33 $3.35
G&A per ton processed3 $1.91 $2.59 $3.49 $1.84 $2.29
(1) See applicable non-GAAP reconciliation tables in the appendix to this presentation. NYSE: CDE 43
(2) Excludes third-party refining charges.
(3) Excludes management fee allocated from corporate.
JC 2016Silvertip
Ownership 100%
Claims 90,156 net acres
Type Underground Silvertip
British Columbia, Canada
Crushing, grinding, flotation
Processing
processing, concentrate thickening
Metals Lead concentrate, zinc concentrate
Mine life ~5 years
2018 & 2019 Reserves & Resources 1
P&P Reserves M&I Resources Inferred Resources
14.9M
15.0M
295.4M
305.0M
291.2M
182.2M
8.2M
11.6M
221.6M
197.5M
196.5M
108.6M
105.3M
143.9M
8.4M
4.6M
105.2M
58.6M
2018 2019 2018 2019 2018 2019
Silver (M oz) Zinc (M lb) Lead (M lb)
(1) See slides in appendix for additional information related to mineral reserves and resources. Canadian investors should refer to the applicable technical report on file at www.sedar.com. NYSE: CDE 44
JC 2016Non-GAAP Reconciliations
NYSE: CDE 45
JC 2016Non-GAAP to U.S. GAAP Reconciliation for Guidance
Unaudited Costs Applicable to Sales Guidance for 2020
($ thousands, except per ounce amounts) Palmarejo Rochester Kensington Wharf
Costs applicable to sales, including amortization (U.S. GAAP) $179,529 $102,554 $175,424 $94,989
Amortization (44,409) (14,561) (52,201) (11,600)
Reported costs applicable to sales $135,120 $87,993 $123,223 $83,389
By-product credit - - - (2,058)
Adjusted costs applicable to sales $135,120 $87,993 $123,223 $81,331
Metal Sales
Gold ounces 106,500 31,400 126,700 89,500
Silver ounces 6,400,000 3,600,000 95,000
Revenue Split
Gold 52% 43% 100% 100%
Silver 48% 57%
Costs applicable to sales
Gold ($/oz) $650 - $750 $1,150 - $1,300 $900 - $1,000 $875 - $925
Silver ($/oz) $9.50 - $10.50 $13.50 - $14.75
NYSE: CDE 46
JC 2016Non-GAAP to U.S. GAAP Reconciliation
Costs Applicable to Sales
Unaudited 3 months ended September 30, 2020
($ thousands, except per ounce amounts) Palmarejo Rochester Kensington Wharf Silvertip Total
Costs applicable to sales, including amortization (U.S. GAAP) $46,163 $22,382 $43,053 $31,887 $1,185 $144,670
Amortization (11,912) (3,278) (11,523) (4,000) (1,185) (31,898)
Reported costs applicable to sales $34,251 $19,104 $31,530 $27,887 - $112,772
Inventory adjustments (100) 517 (141) (46) - 230
By-product credit - - - (1,007) - (1,007)
Adjusted costs applicable to sales $34,151 $19,621 $31,389 $26,834 - $111,995
Metal Sales
Gold ounces 27,252 6,834 27,815 33,382 95,283
Silver ounces 1,765,371 785,887 40,521 - 2,591,779
Revenue Split
Gold 48% 40% 100% 100%
Silver 52% 60% -
Adjusted costs applicable to sales
Gold ($/oz) $602 $1,148 $1,128 $804
Silver ($/oz) $10.06 $14.98 -
NYSE: CDE 47
JC 2016Non-GAAP to U.S. GAAP Reconciliation (cont.)
Costs Applicable to Sales
Unaudited 3 months ended June 30, 2020
($ thousands, except per ounce amounts) Palmarejo Rochester Kensington Wharf Silvertip Total
Costs applicable to sales, including amortization (U.S. GAAP) $26,095 $21,348 $43,235 $25,653 $1,231 $117,562
Amortization (7,270) (3,012) (12,853) (3,181) (1,231) (27,547)
Reported costs applicable to sales $18,825 $18,336 $30,382 $22,472 - $90,015
Inventory adjustments (106) (566) (139) (3,304) - (4,115)
By-product credit - - - (385) - (385)
Adjusted costs applicable to sales $18,719 $17,770 $30,243 $18,783 - $85,515
Metal Sales
Gold ounces 16,924 5,278 32,367 23,364 77,933
Silver ounces 874,642 723,679 22,707 - 1,621,028
Revenue Split
Gold 62% 44% 100% 100%
Silver 38% 56% -
Adjusted costs applicable to sales
Gold ($/oz) $686 $1,481 $934 $804
Silver ($/oz) $8.13 $13.75 -
NYSE: CDE 48
JC 2016Non-GAAP to U.S. GAAP Reconciliation (cont.)
Costs Applicable to Sales
Unaudited 3 months ended March 31, 2020
($ thousands, except per ounce amounts) Palmarejo Rochester Kensington Wharf Silvertip Total
Costs applicable to sales, including amortization (U.S. GAAP) $49,149 $19,860 $42,429 $20,267 $23,002 $154,707
Amortization (13,175) (2,904) (11,922) (2,444) (5,345) (35,790)
Reported costs applicable to sales $35,974 $16,956 $30,507 $17,823 $17,657 $118,917
Inventory adjustments 73 (422) (101) (25) (10,381) (10,856)
By-product credit - - - (248) - (248)
Adjusted costs applicable to sales $36,047 $16,534 $30,406 $17,550 $7,276 $107,813
Metal Sales
Gold ounces 31,287 5,473 32,781 16,094 85,635
Silver ounces 1,894,789 632,237 14,768 158,984 2,700,778
Zinc pounds 3,203,446 3,203,446
Lead pounds 2,453,485 2,453,485
Revenue Split
Gold 56% 45% 100% 100%
Silver 44% 55% 26%
Zinc 48%
Lead 26%
Adjusted costs applicable to sales
Gold ($/oz) $645 $1,359 $928 $1,090
Silver ($/oz) $8.37 $14.38 $11.79
Zinc ($/lb) $1.12
Lead ($/lb) $0.74
NYSE: CDE 49
JC 2016Non-GAAP to U.S. GAAP Reconciliation (cont.)
Costs Applicable to Sales
Unaudited 12 months ended December 31, 2019
($ thousands, except per ounce amounts) Palmarejo Rochester Kensington Wharf Silvertip Total
Costs applicable to sales, including amortization (U.S. GAAP) $201,306 $118,246 $170,194 $92,969 $145,496 $728,211
Amortization (59,379) (18,041) (50,592) (12,280) (36,738) (177,030)
Reported costs applicable to sales $141,927 $100,205 $119,602 $80,689 $108,758 $551,181
Inventory adjustments (344) (4,625) (913) (3,617) (64,610) (74,109)
By-product credit - - - (1,072) - (1,072)
Adjusted costs applicable to sales $141,583 $95,580 $118,689 $76,000 $44,148 $476,000
Metal Sales
Gold ounces 116,104 36,052 130,495 84,999 367,650
Silver ounces 6,841,380 3,844,556 64,161 1,164,470 11,914,567
Zinc pounds 18,154,521 18,154,521
Lead pounds 16,487,847 16,487,847
Revenue Split
Gold 56% 45% 100% 100%
Silver 44% 55% 34%
Zinc 39%
Lead 27%
Adjusted costs applicable to sales
Gold ($/oz) $683 $1,193 $910 $894
Silver ($/oz) $9.11 $13.67 $12.89
Zinc ($/lb) $0.95
Lead ($/lb) $0.72
NYSE: CDE 50
JC 2016Non-GAAP to U.S. GAAP Reconciliation (cont.)
Costs Applicable to Sales
Unaudited 3 months ended December 31, 2019
($ thousands, except per ounce amounts) Palmarejo Rochester Kensington Wharf Silvertip Total
Costs applicable to sales, including amortization (U.S. GAAP) $49,590 $31,100 $41,537 $29,818 $42,189 $194,234
Amortization (14,799) (5,791) (12,776) (4,072) (10,166) (47,604)
Reported costs applicable to sales $34,791 $25,309 $28,761 $25,746 $32,023 $146,630
Inventory adjustments (11) (116) (176) (3,677) (23,325) (27,305)
By-product credit - - - (373) - (373)
Adjusted costs applicable to sales $34,780 $25,193 $28,585 $21,696 $8,698 $118,952
Metal Sales
Gold ounces 27,953 11,248 29,293 27,039 95,533
Silver ounces 1,979,315 931,326 21,132 294,498 3,226,271
Zinc pounds 4,052,554 4,052,554
Lead pounds 4,223,504 4,223,504
Revenue Split
Gold 50% 51% 100% 100%
Silver 50% 49% 38%
Zinc 32%
Lead 30%
Adjusted costs applicable to sales
Gold ($/oz) $622 $1,142 $976 $802
Silver ($/oz) $8.79 $13.25 $11.22
Zinc ($/lb) $0.69
Lead ($/lb) $0.62
NYSE: CDE 51
JC 2016Non-GAAP to U.S. GAAP Reconciliation (cont.)
Costs Applicable to Sales
Unaudited 3 months ended September 30, 2019
($ thousands, except per ounce amounts) Palmarejo Rochester Kensington Wharf Silvertip Total
Costs applicable to sales, including amortization (U.S. GAAP) $53,237 $31,999 $43,085 $25,385 $32,457 $186,163
Amortization (15,840) (4,250) (13,552) (3,301) (8,268) (45,211)
Reported costs applicable to sales $37,397 $27,749 $29,533 $22,084 $24,189 $140,952
Inventory adjustments (175) (4,799) (405) (7) (13,966) (19,352)
By-product credit - - - (293) - (293)
Adjusted costs applicable to sales $37,222 $22,950 $29,128 $21,784 $10,223 $121,307
Metal Sales
Gold ounces 32,731 7,651 35,452 24,573 100,407
Silver ounces 1,747,250 951,043 16,612 289,910 3,004,815
Zinc pounds 4,076,390 4,076,390
Lead pounds 4,330,862 4,330,862
Revenue Split
Gold 58% 41% 100% 100%
Silver 42% 59% 39%
Zinc 29%
Lead 32%
Adjusted costs applicable to sales
Gold ($/oz) $660 $1,230 $822 $887
Silver ($/oz) $8.95 $14.24 $14.14
Zinc ($/lb) $0.75
Lead ($/lb) $0.71
NYSE: CDE 52
JC 2016Non-GAAP to U.S. GAAP Reconciliation (cont.)
Unaudited Adjusted EBITDA
($ thousands) 2019 2018 2017 2016 2015 2014
Net income (loss) ($341,203) ($48,405) ($1,319) $55,352 ($367,183) ($1,186,874)
Income (loss) from discont. ops., net of tax (5,693) (550) 12,244 (32,917) 79,372 89,224
Interest expense, net of capitalized interest 24,771 24,364 16,440 36,896 44,978 47,494
Income tax provision (benefit) (11,129) (16,780) 28,998 (33,247) (29,075) (410,140)
Amortization 178,876 128,473 146,549 116,528 125,953 143,013
EBITDA ($154,378) $87,102 $202,912 $142,612 ($145,955) ($1,317,283)
Fair value adjustments, net (16,030) (3,638) 864 11,581 (5,202) (3,618)
Impairment of equity securities - - 426 703 2,346 6,593
Foreign exchange (gain) loss 4,346 9,069 (1,281) 11,455 16,021 (355)
Gain on sale of Joaquin project - - (21,138) - - -
(Gain) loss on sale of assets and securities 714 (19) 1 (11,334) 352 646
Gain on repurchase of Rochester royalty - - (2,332) - - -
(Gain) loss on debt extinguishment 1,282 - 9,342 21,365 (15,916) -
Mexico inflation adjustment - (1,939) - - - -
Transaction-related costs - 5 3,757 1,199 2,112 -
Interest income on notes receivables (198) (1,776) - - - -
Manquiri sale consideration write-down - 18,599 - - - -
Silvertip inventory write-down 64,610 26,720 - - - -
Wharf inventory write-down 3,596 - - - - -
Rochester In-Pit crusher write-down - 3,441 - - - -
Receivable write-down 1,040 6,536 - - - -
Asset retirement obligation accretion 12,154 11,116 8,983 7,263 7,374 4,994
Inventory adjustments and write-downs 5,904 2,093 1,806 5,590 9,276 13,975
Impairment of long-lived assets 250,814 - - - - -
Write-downs - - - 4,446 246,625 1,353,967
Adjusted EBITDA $173,854 $157,309 $203,340 $194,880 $117,680 $58,918
Revenue $711,502 $625,904 $709,598 $571,897 $561,407 $517,993
Adjusted EBITDA Margin 24% 25% 29% 34% 21% 11%
NYSE: CDE 53
JC 2016You can also read