Measuring and Analysing the Chain of Implicit Trust: A Study of Third-party Resources Loading
←
→
Page content transcription
If your browser does not render page correctly, please read the page content below
Measuring and Analysing the Chain of Implicit Trust: A
Study of Third-party Resources Loading

MUHAMMAD IKRAM, Macquarie University, Australia                                                                                   8
RAHAT MASOOD, UNSW and Data61, CSIRO, Australia
GARETH TYSON, Queen Mary University of London & Alan Turing Institute, United Kingdom
MOHAMED ALI KAAFAR, Macquarie University and Data61, CSIRO, Australia
NOHA LOIZON, Data61, CSIRO, Australia
ROYA ENSAFI, University of Michigan, USA
The web is a tangled mass of interconnected services, whereby websites import a range of external resources
from various third-party domains. The latter can also load further resources hosted on other domains. For
each website, this creates a dependency chain underpinned by a form of implicit trust between the first-party
and transitively connected third-parties. The chain can only be loosely controlled as first-party websites
often have little, if any, visibility on where these resources are loaded from. This paper performs a large-scale
study of dependency chains in the web, to find that around 50% of first-party websites render content that
they do not directly load. Although the majority (84.91%) of websites have short dependency chains (below 3
levels), we find websites with dependency chains exceeding 30. Using VirusTotal, we show that 1.2% of these
third-parties are classified as suspicious — although seemingly small, this limited set of suspicious third-parties
have remarkable reach into the wider ecosystem. We find that 73% of websites under-study load resources
from suspicious third-parties, and 24.8% of first-party webpages contain at least three third-parties classified
as suspicious in their dependency chain. By running sandboxed experiments, we observe a range of activities
with the majority of suspicious JavaScript codes downloading malware.
CCS Concepts: • Security and privacy → Web application security; Malware and its mitigation; • Infor-
mation systems → Traffic analysis; • General and reference → Measurement; • Networks → Web
protocol security; • Social and professional topics → Malware / spyware crime.
Additional Key Words and Phrases: Measurement, web of trust, third party resources, javascript, web security
and privacy, sandbox, experiments
ACM Reference Format:
Muhammad Ikram, Rahat Masood, Gareth Tyson, Mohamed Ali Kaafar, Noha Loizon, and Roya Ensafi. 2020.
Measuring and Analysing the Chain of Implicit Trust: A Study of Third-party Resources Loading. ACM Trans.
Priv. Sec. 23, 02, Article 8 (March 2020), 28 pages. https://doi.org/10.1145/3380466
A preliminary version of this paper, titled “The Chain of Implicit Trust: An Analysis of the Web Third-party Resources
Loading”, to appear in the proceedings of the 28t h World Wide Web Conference (WWW), San Francisco (2019) [27]. See
Sections 1 and 6 for a summary of the new results presented in this paper.
Authors’ addresses: Muhammad Ikram, Macquarie University, BD Building, 4 Research Park Drive, Level 2, Macquarie
University, Sydney, NSW, 2109, Australia, muhammad.ikram@mq.edu.au; Rahat Masood, UNSW and Data61, CSIRO, Level
5, 13 Garden Street, Eveleigh, Sydney, NSW, 2015, Australia, rahat.masood@data61.csiro.au; Gareth Tyson, Queen Mary
University of London & Alan Turing Institute, Mile End Road, London, E1 4NS, London, United Kingdom, g.tyson@qmul.ac.
uk; Mohamed Ali Kaafar, Macquarie University and Data61, CSIRO, BD Building, 4 Research Park Drive, Level 2, Macquarie
University, Sydney, NSW, 2109, Australia, dali.kaafar@mq.edu.au; Noha Loizon, Data61, CSIRO, Level 5, 13 Garden Street,
Eveleigh, Sydney, NSW, 2015, Australia, noha.loizon@data61.csiro.au; Roya Ensafi, University of Michigan, Bob and Betty
Beyster Building, 2260 Hayward Street, Ann Arbor, MI, 48109-2121, USA, ensafi@umich.edu.

Permission to make digital or hard copies of all or part of this work for personal or classroom use is granted without fee
provided that copies are not made or distributed for profit or commercial advantage and that copies bear this notice and the
full citation on the first page. Copyrights for components of this work owned by others than the author(s) must be honored.
Abstracting with credit is permitted. To copy otherwise, or republish, to post on servers or to redistribute to lists, requires
prior specific permission and/or a fee. Request permissions from permissions@acm.org.
© 2020 Copyright held by the owner/author(s). Publication rights licensed to ACM.
2471-2566/2020/03-ART8 $15.00
https://doi.org/10.1145/3380466

                                             ACM Trans. Priv. Sec., Vol. 23, No. 02, Article 8. Publication date: March 2020.
8:2 Ikram, et al. 1 INTRODUCTION In the modern web ecosystem, websites often load resources from a range of third-party domains such as ad providers, tracking services and analytics services. This is a well known design decision that establishes an explicit trust between websites and the domains providing such services. However, often overlooked is the fact that these third-parties can further load resources from other domains, creating a dependency chain. This results in a form of implicit trust between first-party websites and any domains loaded further down the chain. Consider the bbc.com webpage,1 which loads JavaScript program from widgets.com, which, upon execution loads additional content from another third-party, say ads.com. Here, bbc.com as the first-party website, explicitly trusts widgets.com, but implicitly trusts ads.com. This can be represented as a simple dependency chain in which widgets.com is at level 1 and ads.com is at level 2. Past work tends to ignore this, instead collapsing these levels into a single set of third- parties [11, 44]. Here, we argue that this overlooks a vital aspect of website design. For example, it raises a notable security challenge, as first-party websites lack visibility on the resources loaded further down their domain’s dependency chain. This potential threat should not be underestimated as errant active content (e.g., JavaScript code) opens the way to a range of further exploits, e.g., Layer-7 DDoS attacks [45] or ransomware campaigns [32]. This paper studies dependency chains in the web ecosystem. Although there has been extensive work looking at the presence of third-parties in general [11, 38, 44], little work has focused on how content is indirectly loaded. We start by inspecting how extensive dependency chains are across the Alexa’s top-200K (Section 2). We confirm their prominence, finding that around 50% of websites do include third-parties (e.g., content delivery networks (CDNs) such as akamaihd.net and ad and tracking services such as google-analytics.com) which subsequently load other third-parties to form a dependency chain (i.e., they implicitly trust third-parties they do not directly load). The most common implicitly trusted third-parties are well known operators, e.g., google-analytics.com and doubleclick.net: these are implicitly imported by 68.3% (134,510) and 46.4% (91,380) websites respectively. However, we also observe a wide range of more obtuse third-parties such as pippio.com and 51.la imported by 0.52% (1,146) and 0.51% (1,009) of websites. Although the majority (84.91%) of websites have short chains (with levels of dependencies below 3), we find first-party websites with dependency chains exceeding 30 in length. This not only complicates page rendering, but also creates notable attack surface. With the above in mind, we then proceed to inspect if suspicious or even potentially malicious third-parties are loaded via these long dependency chains (Section 4). We do not limit this to just traditional malware, but also include third-parties that are known to mishandle user data and risk privacy leaks [5, 8, 16, 41, 43, 52]. Example threats include the re-identification of users in the anonymised AOL search histories, the Netflix training data that was attacked, and the Massachusetts hospital discharge data [16, 43, 52]. Furthermore, the collection of sensitive data by third parties also had devastating impacts on people’s lives. For instance, it was shown that a person discovered his teenage daughter’s pregnancy by observing her targeted adverts [8]. Similarly, Gmail was shown to use words from users’ emails to target ads, exposing the nature of private correspondence in targeted ads [5]. Using the VirusTotal service [29] API, we classify third-party domains into innocuous vs. sus- picious. When using a reasonable classification threshold (i.e., VTscore ≥ 10, further elaborated in Section 2.2 and 4.1), we find that 1.2% of third-parties are classified as suspicious. Although seemingly small, we find that this limited set of suspicious third-parties have remarkable reach. 73% of websites under-study load resources from suspicious third-parties, and 24.8% of first-party 1 This is an example (i.e., hypothetical case) to elaborate the (suspicious) resource dependency tree of bbc.com. ACM Trans. Priv. Sec., Vol. 23, No. 02, Article 8. Publication date: March 2020.
A Study of Third-party Resources Loading                                                                                  8:3

webpages contain at least 3 third-parties classified as suspicious in their dependency chain. This,
of course, is impacted by many considerations which we explore — most notably, the power-law
distribution of third-party popularity, which sees a few major players on a large fraction of websites.
   This paper expands on our prior work [27]). In this past research we inspected the prevalance of
dependency chains in the web. Here, we build on these past findings to focus on what activities are
undertaken within the dependency chains. Hence, we sandbox all suspicious JavaScript programs
to monitor their activities (Section 5). We build a sandbox and perform tests executing suspicious
JavaScript codes. We find that JavaScript codes loaded at higher levels in the dependency chain
(Level ≥2) generated a larger number of HTTP requests. This is worrying as resources loaded
at higher levels in the dependency chain are the most opaque to the website operator (i.e., they
rely on implicit trust). The activities of these scripts are diverse. For example, we find evidence
of first-party websites performing malicious search poisoning activities when (implicitly) loading
some JavaScript codes. The most typical purpose of the suspicious JavaScript code is downloading
dropfiles2 . We also observe instances of very active JavaScript codes, e.g., the most active (at level
4) downloads 129 files.
   In Section 7.1, we summarise our key findings and explore simple solutions that may mitigate
the impact of the discussed vulnerabilities (cf. Section 5). We also proceed to highlight some of the
key limitations of our work in Section 7.2. We conclude the paper by summarising the reality of
a very fragile web ecosystem, confirming that suspicious parties within the dependency chains
are relatively commonplace (Section 8). We share all our datasets, experimental testbed code and
scripts with the wider research community: https://wot19submission.github.io.

2     DATASET AND DATA ENRICHMENT
  We start by presenting our data collection methodology, and how we have validated its cor-
rectness. This consists of two key parts: (i) collecting information about individual websites, such
that we can extract their dependency chains; and (ii) classifying all dependencies (i.e., third-party
domains) as suspicious vs. innocuous.

2.1    Alexa dependency dataset
  We first present how we have obtained data on website dependencies, and how we construct
their dependency chain. This critical first step underpins all subsequent analysis
2.1.1 Data Collection. We obtain the resource dependencies of the Alexa top-200K websites’ main
pages3 using the method described in Kumar et al. [35]. This Chromium-based Headless [15] crawler
renders a given website and tracks resource dependencies by recording network requests sent to
third-party domains. The requests are then used to reconstruct the dependency chains between
each first-party website and its third-party URLs. Note that each first-party can trigger the creation
of multiple dependency chains (to form a tree structure).
   Figure 1 presents an example of a dependency chain with 3 levels; level 1 is explicitly trusted by
the first-party website, whilst level 2 and 3 are implicitly (or indirectly) trusted. For simplicity, we
refer to any domain that differs from the first-party to be a third-party. More formally, to construct
the dependency tree, we identify third-party requests by comparing the second level domain of the
page (e.g., bbc.com) to the domains of the requests (e.g., cdn.com and ads.com via widgets.com).
Those with different second level domains are considered third-party. We ignore the sub-domains
2 Dropfiles are executables (e.g., malware, Exploitkits, Trojans, etc.) exploiting the browser to download and execute code
 without user consent (cf. Section 5.2.3).
3 We select the top 200K as this gives us broad coverage of globally popular websites, whilst also remaining tractable for our
  subsequent data enrichment activities.

                                            ACM Trans. Priv. Sec., Vol. 23, No. 02, Article 8. Publication date: March 2020.
8:4 Ikram, et al.
bbc.com
Image/GIF JavaScript Resource, Data
Dependency *
cdn.com widgets.com
Level 1
JavaScript Resource
Dependency * Data
ads.com
Level 2 gstat.net
Data
Dependency
stats.txt
Level 3
Fig. 1. Example dependency chain of bbc.com. Arrows represent the inclusion of resources with red ones
showing suspicious resource inclusion. For instance, ads.com is suspicious, and loaded by widgets.com,
creating an implicit line of trust.
so that a request to a domain such as player.bbc.com is not considered as third-party. Due to
the lack of a purely automated mechanism to disambiguate between site-specific sub-domains
(e.g., player.bbc.com) or country-specific domains (e.g., bbc.co.uk), we leverage the Mozilla
Public Suffix list [51] and tldextract [36] for this task. From the Alexa Top-200k websites, we
collect 11,287,230 URLs which consist of 6,806,494 unique external resources that correspond to
68,828 and 196,940, respectively, unique second level domains of third- and first-parties.
Constructing the dependencies between objects in a webpage is a non-trivial task. In cases
where third-party JavaScript program gets loaded into a first-party context, and then makes an
AJAX request, the HTTP(S) request appears to be from the first-party (i.e. the referrer will be the
first-party). To overcome such cases and to preserve the information on relations between the
nested resource dependencies, we allow the crawler to include the URL of the third-party from
which the JavaScript program was loaded by first-party.
2.1.2 Data Validation. As our main dataset relies on a single snapshot, we want to evaluate the
stability of the resources loaded by websites to ensure that a single snapshot does not miss significant
complexity within the ecosystem. Thus, we repeat the methodology from Section 2.1.1 on a daily
basis to study how the dependency chains evolve. Unfortunately, performing daily crawls for the
Alexa top-200k websites was not possible due to scalability reasons. We therefore selected 1,500
domains as a seed for the crawler. This list consists of the Alexa top-1K alongside 250 domains
randomly selected from the Alexa rank ranging from 1K to 50K, and a final 250 domains randomly
chosen from websites within the Alexa rank 50K–200K. This offers a broad sampling of the Alexa
sites covered. In total, on a daily basis from September 15 to October 2 2018, we have collected on
average 225,035 unique URLs per daily snapshot which covers 5,423 unique second level domains
from the 1,500 first-parties.
Figure 2 presents the day-to-day stability of the domains we see within each website.4 We observe
that 95.07% of second level domains remain consistent across consecutive days, and only an average
of 4.93% domains are absent in any two consecutive snapshots. On average, only 35 (0.66%) and 232
(4.27%) domains are absent at explicit and implicit dependency levels, respectively. Hence, we take
this as a strong indicator that utilising a single snapshot is sufficient for gaining vantage into the
use of third-parties.
4 We define the (normalized) stability as the count of domains present in the dependency trees crawled on day n and also
n ∩C n+1
present on day n + 1. More specifically, let C denoting the crawled data then, stability = C
C n ∪C n+1 .
ACM Trans. Priv. Sec., Vol. 23, No. 02, Article 8. Publication date: March 2020.A Study of Third-party Resources Loading 8:5
100% 2,500
Intersection of Domains
Stability of Domains
80% 2,00
60% 1,500
40% 1,00
20% 500
0% 0%
17 09
18 09
19 09
20 09
21 09
22 09
23 09
24 09
25 09
26 09
27 09
28 09
29 09
30 09
01 09
02 10
-10
-
-
-
-
-
-
-
-
-
-
-
-
-
-
-
-
16
Fig. 2. Stability of day-by-day dependency trees analyzed per domain.
2.2 Meta-data collection From VirusTotal
The next challenge is to classify domains as suspicious vs. innocuous. For this we use VirusTotal
— an online solution which aggregates the scanning capabilities provided by 68 Anti-Virus (AV)
tools, scanning engines and datasets. It has been commonly used in the academic literature to detect
malicious apps, executables, software and domains [21, 25, 26, 28, 33, 34, 59]. For each domain, we
use the VirusTotal report API to obtain the VTscore for each third-party domain. This VTscore
represents the number of AV tools that flagged the website as malicious (max. 68). The reports also
contain meta-information such as the first scan date, scan history, domain name resolution (DNS)
history, website or domain category, reverse DNS, and whois information. We further supplement
each domain with their WebSense [58] category5 provided by the VirusTotal’s record API. During
the augmentation, we eliminate repeating, unresponsive or invalid URLs in each dependency chain.
Thus, we collect the above metadata for each second level domain in our dataset. This results in a
final sample of 196,940 first-party websites, and 68,828 third-party domains.
3 EXPLORING THE CHAINS
We begin by exploring the presence and usage of implicit trust chains. We first confirm if websites
do, indeed, rely on implicit trust and then explore how these chains are used. To this end, at each
level of the dependency chain, we choose two metrics: number of requests and number of third-
parties. The first metric, the number of requests, shows the significance or volume of resources
imported from different levels, whereas the second metric characterises coverage of third-parties
in different levels.
3.1 Do websites rely on implicit trust?
Overall, the Top-200k dataset makes 11,287,230 calls to 6,806,494 unique external resources,
with a median of 27 external resources per first-party website. To dissect this, Table 1 presents the
percentage of webpages in each Alexa range that load explicitly and implicitly trusted third-parties.
Confirming prior studies [11, 38], it shows that 95% of websites import external resources, with 91%
importing externally hosted JavaScript codes. More important is that around 50% of the websites do
rely on implicit trust chains, i.e., they do include third-parties to load further third-parties on their
behalf. The propensity to form dependency chains is marginally higher in more popular websites;
for example, 55% in the Alexa top 10K have dependency chains compared to 48% in the bottom 10K
5 For details on the websites or domains classification, we refer the reader to WebSense’s, also known as ForcePoint, domains
classification repository [12].
ACM Trans. Priv. Sec., Vol. 23, No. 02, Article 8. Publication date: March 2020.8:6 Ikram, et al.
Alexa Rank
1-200K 1-10K 190-200K 10-50K 50-100K 100-200K
First-parties that trust at least one
third-party which loads:
Any Resources:
Explicitly (Lvl. 1) 95% 95% 95% 94% 95% 95%
Implicitly (Lvl. ≥ 2) 49.7% 55.1% 47.9% 51.8% 50.23% 48%
JavaScript Resources:
Explicitly 91% 92% 91% 91% 91% 90%
Implicitly 49.5% 55% 47.8% 51.69% 50% 47.8%
Table 1. Overview of the dataset for different ranges of the Alexa ranking. The rows indicate the proportion
of Alexa’s Top-X websites (with rank values lie in the rank-range such as 1-10K and 1-200K) that explicitly and
implicitly trust at least one third-party (i) resource (of any type); and (ii) JavaScript code. It shows that 95% of
websites import external resources, with 91% importing externally hosted JavaScript codes. Moreover, around
50% of the websites do rely on implicit trust chains, i.e., they allow third-parties to load further third-parties
on their behalf.
Third-Party Distribution
40% Ads SearchEngines
Business SocialNetworks
30% IT
20%
10%
0%
1 2 3 4 5A Study of Third-party Resources Loading 8:7
# Unique # Unique JavaScript
Level Total Resource Calls Third-Parties Image Codes Data Font/CSS Uncateg.
1 9,212,245 8,866,074 57,375 (83.36%) 34.4% 30.6% 16.0% 7.8% 11.3%
2 1,566,841 1,295,322 8,617 (12.52%) 48.8% 16.7% 11.7% 3.3% 19.4%
3 405,390 223,080 1,618 (2.35%) 45.0% 12.3% 11.1% 1.3% 30.2%
4 78,107 90,984 647 (0.94 %) 41.8% 18.4% 8.0% 8.1% 23.6%
5 14,413 8,928 310 (0.45%) 40.6% 18.0% 12.8% 2.0% 26.4%
≥6 10,208 4,764 548 (0.8%) 36.6% 12.3% 13.0% 1.2% 36.8%
Table 2. Breakdown of resource types requested by the Top-200K websites across each level in the dependency
chain. Total column refers to the number of resource calls made at each level.
Briefly, we also note that Figure 3a reveals subtle differences between different categories of
third-party domains. For example, those classified as adverts are most likely to be loaded at level 1;
this is perhaps to be expected, as many ad brokers naturally serve and manage their own content.
In contrast, Social Network plugins and widgets (e.g., Facebook plugins) are least likely to be loaded
at level 1. We found that social networks are typically (99% of the times) loaded via CDNs (e.g.,
akamaihd.net which is hosting the JavaScript codes belonging to Facebook) and in some cases (1%
of the times) via third-parties, i.e., analytics services (e.g., addthis.com). Business third-parties are
also very common: As per the Websense [12, 58] categorisation, this includes websites devoted to
business firms, business associations, industry groups, e.g., banks, credit unions, credit cards, and
insurance. This also includes websites that provide access to business-oriented web applications and
allow storage of sensitive data. Whilst the “IT” category includes websites providing information
about computers, software, the Internet and related business firms, including sites supporting the
sale of hardware, software, peripherals and services.
3.2 What objects exist in the chain?
The previous section has confirmed that a notable fraction of websites create dependency chains
with (up to) tens of levels. We next inspect the types of resources imported within these dependency
chains. We classify resources into four main types: Image, JavaScript codes, Data (consisting of
HTML, JSON, XML, plain text files), and CSS/Fonts.7 Overall, first-party websites import a median
of 9 JavaScript codes and/or 6 images from external websites. Table 2 presents the volume of each
resource type imported at each level in the trust chain. We observe that the make-up of resources
varies dramatically based on the level in the dependency chain. For example, the fraction of images
imported tends to increase with each level— this is largely because third-parties are in-turn loading
images (e.g., for adverts). In contrast, the fraction of JavaScript programs decreases as the level in
the dependency chain increases: 30.6% of resources at level 1 are JavaScript codes compared to just
12.3% at level 3. This trend is caused by the fact that new levels are typically created by JavaScript
code execution (thus the fraction of JavaScript codes is likely to deplete along the chain). However,
it remains at a level that should be of concern to web engineers as this confirms a significant
fraction of JavaScript code is loaded from potentially unknown implicitly trusted domains (see
Section 7.1 for further discussion).
To build on this, we also inspect the categories of third-party domains hosting these resources.
Figure 3b presents the make-up of third-party categories at each level in the chain. It is clear
that, across all levels, advertisement domains make up the bulk of third-parties. We also notice
7 Weclassify using the HTTP headers and URL extensions (i.e.,*.js, *.html, *.css); this allowed us to classify 85% of
resources.
ACM Trans. Priv. Sec., Vol. 23, No. 02, Article 8. Publication date: March 2020.8:8 Ikram, et al.
other highly demanded third-party categories such as search engines, Business and IT. These are
led by well known providers, e.g., google-analytics.com (web-analytics8 ) is on 68.3% of pages.
The figure also reveals that the distributions of categories vary across each dependency level. For
example, 23.1% of all loaded resources at level 1 come from advertisement domains, 37.3% at level 2,
and 46.2% at level 3. In other words, the proportion increases across dependency levels. In contrast,
social network third-parties (e.g., Facebook) are mostly presented at level 1 (9.58%) and 2 (13.57%)
with a significant drop at level 3. The dominance of advertisements is not, however, caused by a
plethora of ad domains: there are far fewer ad domains than business or IT (see Table 3). Instead, it
is driven by the large number of requests to advertisements: Even though ad domains only make-up
1.5% of third-parties, they generate 25% of resource requests. Importantly, these popular providers
can trigger further dependencies; for example, doubleclick.com imports 16% of its resources from
further implicitly trusted third-party websites. This makes such domains an ideal propagator of
malicious resources for any other domains having implicit trust in it [32, 38, 39, 53, 59].
4 FINDING SUSPICIOUS CHAINS
The previous section has shown that the creation of dependency chains is widespread, and there
is extensive implicit trust within the web ecosystem. This, however, does not shed light on the
activity of resources within the dependency chains, nor does it mean that the implicit trust is abused
by third-parties. Thus, we next study the existence of suspicious third-parties, which could lead to
abuse of the implicit trust. Within this section we use the term suspicious (to be more generic than
malicious) because VirusTotal covers activities ranging from low-risk (e.g., sharing private data
over unencrypted channels) to high-risk (malware).
VTscore ≥ 3 VTscore ≥ 10 VTscore ≥ 20 VTscore ≥ 40 VTscore ≥ 55
Third- Total Suspicious
Cat Parties Calls JS Num. Vol. Num. Vol. Num. Vol. Num. Vol. Num. Vol.
All 68,828 11,287,204 270,758 (2.4%) 1.6% 6.4% 1.2% 6.2% 1.0% 6.1% 0.6% 5.7% ≤ 0.1% ≤ 0.1%
Business 6,786 1,924,591 184,360 (9.6%) 1.5% 21.5% 1.1% 21.5% 1.0% 21.4% 0.5% 20.6% 0% 0%
Ads 1,017 2,870,482 7,924 (0.3%) 3.5% 0.1% 3.3% 0.1% 2.9% 0.1% 1.6% ≤ 0.1% 0% 0%
IT 8,619 1,646,287 10,547 (0.6%) 2.2% 3.8% 1.5% 3.6% 1.2% 3.5% 0.6% 3.0% ≤ 0.1% ≤ 0.1%
Other 52,406 4,845,844 67,927 (1.4%) 1.4% 4.6% 1.1 4.3% 0.9% 4.2% 0.6% 3.8% ≤ 0.1% ≤ 0.1%
Table 3. Overview of suspicious third-parties in each category. Col.2-4: number of third-party websites
in different categories, the number of resource calls to resources, and the proportion of calls to suspicious
JavaScript codes. Col.5-9: Fraction of third-party domains classified as suspicious (Num.), and fraction of
resource calls classified as suspicious (Vol.), across various VTscores (i.e., ≥ 3 and ≥ 55).
4.1 Do chains contain suspicious parties?
First, we inspect the fraction of third-party domains that trigger a warning by VirusTotal. From
our third-party domains, 2.5% have a VTscore of 1 or above, i.e., at least one virus checker classifies
the domain as suspicious. If one treats the VTscore as a ground truth, this confirms that popular
websites do load content from suspicious third-parties via their chains of trust. However, we are
reticent to rely on VTscore ≥ 1, as this indicates the remaining 67 virus checkers did not flag the
domain.9 Thus, we start by inspecting the presence of suspicious third-parties using a range of
thresholds.
8 Grouped as in business category as per VirusTotal reports.
9 Diversity is likely caused by the virus databases used by the different virus checkers [6]
ACM Trans. Priv. Sec., Vol. 23, No. 02, Article 8. Publication date: March 2020.A Study of Third-party Resources Loading 8:9
Table 3 shows the fraction of third-parties that are classified as suspicious using several VTscore
thresholds. For context, we separate third-parties into their respective categories (using WebSense).
The table confirms that a noticeable subset of suspicious third-party domains exist; for example,
if we classify any resource with a VTscore ≥ 10 as suspicious, we find that 1.2% of third-party
domains are classified as suspicious with 6.2% of all resource calls in our dataset going to these
third-parties. Notably this only drops marginally (to 5.7%) with a very conservative VTscore of
≥ 40. We observe similar results when considering thresholds in the [3..50] range. This confirms,
with a high certainty, that approximately 6% of resource calls in the dependency chains are towards
domains that engage in suspicious activity (see Section 5 for further details). We will conservatively
refer to domains with a VTscore ≥ 10 as suspicious in the rest of this analysis.
The proportion of suspicious third parties and resource calls can be related to a prominence
metric defined in [9] that measures the frequency with which a user browsing encounters the third-
party. The paper showed that the top 5 third-parties (doubleclick.net, google-analytics.com,
gstatic.com, google.com, and facebook.com) have a prominence of 5.7 on average. The exact
relationship between the prominence and the number of suspicious third-parties (and their volume
of resource calls) is not important to us. However, a high prominence of a suspicious third party
means that users have a high probability of becoming a target, i.e., the effect of the 1.2% suspicious
third parties becomes more devastating when a user is accessing those websites multiple times. For
instance, in Table 5 we show that google-analytics.com is the top most suspicious third-party
which has a prominence of 6.20 implying that a user is hit 6.2 times by this website.
Additionally, we inspect first-party domains that inherit suspicious JavaScript resources from
the explicit and various implicit levels. We focus (cf. Section 5) on JavaScript programs as active
web content that poses great threats with significant attack surfaces consisting of vulnerabilities
related to client-side JavaScript codes, such as cross-site scripting (XSS) and advanced phishing [38].
Table 4 shows the top first-party domains, ranked according to the number of unique suspicious
third-parties in their chain of dependency. We note that the top ranked (most vulnerable) first-party
domains belong to various categories such as Content Sharing, News, or IT. This indicates that
there is not any single category of domains that inherits suspicious JavaScript codes. However, we
note that first party websites categorised as “Business” represent the majority of most exposed
domains at Level ≥2: 16% of first-party domains implicitly trusting suspicious JavaScript codes
belonging to the Business Category. The distant second is the “News & Media” Category, and the
third is “Adult”. The number of suspicious JavaScript codes loaded by these first-party domains
ranges from 4 to 31. For instance, we note the extreme case of amateur-fc2.com, which implicitly
imports 31 unique suspicious JavaScript programs from 4 unique suspicious domains.
4.2 How widespread are suspicious parties?
We next inspect how widespread these suspicious third-parties are at each position in the
dependency chain, by inspecting how many websites utilize them. Figure 4a displays the cumulative
distribution (CDF) of resource calls to third-parties made by each first-party webpage in our dataset.
Within the figure, we decompose the third-party resources into various groups (including total
vs. suspicious). As mentioned earlier, we take a conservative approach and consider a resource
suspicious if it receives a VTscore ≥ 10. We purposefully select a relatively low VTscore threshold
to balance the need for broad coverage against high confidence10 . Figure 4a reveals that suspicious
parties within the dependency chains are commonplace: 24.8% of all first-party webpages contain
at least 3 third-parties classified as suspicious in their dependency chain. Remarkably, 73% of
first-party websites load resources from third-parties at least once. Hence, even though only 1.6% of
10 Note that the difference between 3 and 10 only results in an increase of 0.2% resource calls classified as malicious.
ACM Trans. Priv. Sec., Vol. 23, No. 02, Article 8. Publication date: March 2020.8:10 Ikram, et al.
Unique Suspicious Domains at Level = 1
Alexa # Malicious Unique Susp. Chain
# First-party Domains Rank JSes Domains Category Length
1 theinscribermag.com 46,242 6 5 Blogs 5
2 skynet-system.com.ua 192,549 6 5 Business 4
3 nodwick.com 194,823 13 4 Entertainment 4
4 iphones.ru 12,045 4 4 IT 4
5 privet-rostov.ru 193,024 6 4 LifeStyle 4
Unique Suspicious Domains at Level ≥ 2
1 traffic2bitcoin.com 33,513 6 5 Games 7
2 radionetplus.ru 166,003 8 4 SW Download 6
3 studiofow.tumblr.com 85,483 11 4 Adult 4
4 amateur-fc2.com 52,556 31 4 Adult 5
5 fasttorrent.ru 24,250 9 4 File Sharing 7
Table 4. Top 5 most exposed first-party domains (with VTscore ≥ 10) ranked by the number of unique
suspicious domains.
100 100
CDF F-Party (%)
80 Total 80 Total
CDF F-Party(%)
60 Malicious 60 Malicious
Business Business
40 IT 40 IT
20 Ads 20 Ads
Other Other
0 0
10 0 10 1 10 2 10 3 10 0 10 1 10 2 10 3
External Resource Count External Resource Count
(a) All websites (b) Without google-analytics
Fig. 4. CDF of resources loaded per-website from various categories of third-parties.
third-party domains are classified as suspicious, their reach covers nearly three quarters of websites
(indirectly via implicit trust).
The above is demonstrated in Table 5, which presents the top 10 most frequently encountered
suspicious third-party domains that are providing suspicious JavaScript codes. It can be seen that
popular third-party domains exist across many first-party sites. The top 20% of third-party domains
cover 86% (9,650,582) of all resource calls. Closer inspection shows that it is driven by one prominent
third-party: google-analytics.com. At first, we thought that this was an error, however, during
the measurement period google-analytics.com obtained a VTscore of 51, suggesting a high
degree of certainty. This was actually caused by google-analytics.com loading another third-
party, sf-helper.net, which is known to distribute adwares and spywares. It is unclear why
Google was performing this. We therefore repeated these checks in October 2018, to confirm that
this activity has ceased, and sf-helper.net is no longer loaded. To understand the impact its new
de-classification has, Figure 4b shows the distribution of resource calls to third-party categories
when google-analytics.com is benign. This reduces the number of first-party websites exposed
to suspicious resources by 63%. This highlights effectively the impact of high centrality third-
parties being permitted to load further resources: the infection of just one can immediately effect a
significant fraction of websites.
ACM Trans. Priv. Sec., Vol. 23, No. 02, Article 8. Publication date: March 2020.A Study of Third-party Resources Loading 8:11
Prevalence of Third-parties at Level = 1
# Third-party Domain Alexa Rank # First Parties Category
1 google-analytics.com 13,200 43,156 Business (Web Analytics)
2 gravater.com 2,292 3,520 IT
3 charter.com 12,714 3,425 Business
4 vk.com 13 2,815 Social Network
5 statcounter.com 2,265 2,327 Business (Web Analytics)
Prevalence of Third-parties at Level ≥ 2
1 charter.com 12,714 3,452 Business
2 vk.com 13 2,290 Social Network
3 livechatinc.com 888 851 Web Chat
4 onesignal.com 950 467 Business
5 rambler.ru 291 370 SearchEngine
Table 5. Top 5 most prevalent suspicious third-party domains (with VTscore ≥ 10) on level 1 (explicit trust) and
beyond (implicit trust) providing resources to first-parties. Here, First-party domains having the corresponding
suspicious third-party domain in their chain of dependency.
4.3 How popular are suspicious third-parties?
We next test if widespread suspicious third-parties are also highly ranked within Alexa. We
treat this as a proxy for global popularity. Beyond google-analytics.com we find several other
suspicious third-party domains from the Top 100 Alexa ranking. For-instance, vk.com, a social
network website mostly geared toward East European countries has been used by 3,094 first-parties
and is ranked 13 by Alexa. This website is found to be one of the most prevalent suspicious third-
party domains at both level 1 and levels ≥ 2. An obvious reason for this domain’s presence is because
of other infected (malware-based) apps that try to authenticate users from such domains [46]. Other
websites such as statcounter.com or gravater.com are also among the most prevalent third
party domains in level 1. These websites were reported to contain malware in their JavaScript
codes [10]. For instance, users in statcounter forums reported it as malicious because a JavaScript
code running on its website redirects users to a malware website gocloudly.com, and forces users
to click the button [13].
250 3500
Level 1 Level 1
Level 2 3000 Level 2
# of Suspicious JSes
200
Prevalance in FP
2500
150 2000
1500
100
1000
50 500
0
1 50K 100K 150K 200K 101 102 103 104 105
First Party Domains (Alexa Rank) Suspicious Third Parties (Alexa Rank)
(a) (b)
Fig. 5. Figure (a) depicts the number of suspicious JavaScript content imported (explicitly and implicitly) by
first-party domains shown according to their Alexa ranking; and (b) shows the number of impacted first-party
domains as function of the ranking of domains of suspicious JavaScript codes.
ACM Trans. Priv. Sec., Vol. 23, No. 02, Article 8. Publication date: March 2020.8:12 Ikram, et al. More generally, we observe the presence of a wide range of Alexa ranks in the list of most prevalent domains at levels ≥ 2. In Figure 5a, we show the number of suspicious JavaScript codes imported by the first-party domains (Y-axis) according to their Alexa rank (X-axis). Overall, first- party domains import a larger number of suspicious third-party JavaScript codes at levels ≥ 2. However, the first-party domains seem to be equally vulnerable to the implicit importing of suspicious content regardless of their rank. There are exceptions though, signified by the peaks in the number of suspicious JavaScript codes — these are near exclusively driven by a large number of ≥level-2 scripts (implicit trust). We also encounter an interesting case, which we exclude from the graphs for readability purposes: The first-party domain kikar.co.il imports 2,592 JavaScript codes originating from the third-party hwcdn.net, a well-known browser hijacker that has been reported to force users to visit spam pages [54]. The VirusTotal API indicates a VTscore of 22 for this suspicious domain. We also note that 35 other first-party domains have this domain in their chain of dependency. Again, this highlights the risk of implicit trust. In Figure 5b we show the number of impacted first-party domains as a function of the Alexa Rank of suspicious third-party domains (limited to a maximum Alexa Rank of 1 million) — note the log scale of X-axis. Some very prevalent third-parties have a high Alexa ranking (even exclud- ing google-analytics.com). For instance, note a spike around the 2000 rank, which reaches a prevalence of 3500 first-party domains at level 1. This spike is caused by gravatar.com, propa- gating suspicious JavaScript resources. This supports our statements earlier (from Table 5) where gravatar.com is ranked the second top most suspicious domain. Similarly, a spike around 10K rank indicates the presence of charter.com both at level 1 and 2 respectively. These findings demonstrate the wide variety of third-party suspicious JavaScript content loaded from various, not necessarily “obscure”, third-party domains. 4.4 At which level do suspicious third-parties occur? Next, we inspect the location(s) in the dependency chain where these suspicious third-parties are situated. This is vital, as implicitly trusted (≥level 2) resources are far more difficult for a first-party administrator to remove. Table 6 presents the proportion of websites that import at least one resource with a VTscore ≥ 10. We separate resources into their level in the dependency chain. The majority of resources classified as suspicious are requested at level 1 in the dependency chain (i.e., they are explicitly trusted by the first-party). 73% of websites containing suspicious third-parties are “infected” via level 1. This might include websites that purposefully utilise such third-parties [22]. Perhaps more important, the above leaves a significant minority of suspicious resources imported via implicit trust (i.e., level ≥ 2). In these cases, the first-party is potentially unaware of their presence. The most vulnerable category is news: over 15% of news sites import implicitly trusted resources from level 2 with a VTscore ≥ 10. Notably, among the 56 news websites importing suspicious JavaScript resources from trust level 3 and deeper, we find 52 loading advertisements from adadvisor.net. One possible reason is that ad-networks could be infected or victimized with malware to perform malvertising [40, 53]. Similar, albeit less extreme, observations can be made across Sports, Entertainment, and Forum websites. Briefly, Figure 6 displays the categories of (suspicious) third-parties loaded at each level in the dependency chain — it can be seen that the majority are classified as business. This is, again, because of several major providers classified as suspicious such as convexity.net and charter.com. Furthermore, it can be seen that the fraction of advertisement resources also increases with the number of levels due to the loading of further resources (e.g., images). Next, we again focus on JavaScript content as, when loaded, it can represent significant security risks: Our analysis is motivated by well known attack vectors underpinned by JavaScript codes, e.g., malvertising [40], malware injection and exploit kits redirection. These are exemplifed by the recent ACM Trans. Priv. Sec., Vol. 23, No. 02, Article 8. Publication date: March 2020.
A Study of Third-party Resources Loading 8:13
Ads Scocial Networks Ads Scocial Networks
Business Search Engines Business Search Engines
IT Other IT Other
1.0 1.0
CDF of Suspicious Third Parties
CDF of Suspicious Third Parties
0.8 0.8
0.6 0.6
0.4 0.4
0.2 0.2
0.0 0.0
1 2 3 4 5 1 2 3 4 5
Trust Level Trust Level
(a) All Websites (b) News Websites
Ads Scocial Networks
Business Search Engines
IT Other
1.0
CDF of Suspicious Third Parties
0.8
0.6
0.4
0.2
0.0
1 2 3 4 5
Trust Level
(c) Sports Websites
Fig. 6. Distribution of suspicious third-party websites per category at each level, for all top-200K websites
(Figure 6a) and most vulnerable first-party categories (Figures 6b, 6c).
All News Sports Entertainment Forums
Lv. All JS All JS All JS All JS All JS
1 61.30% 57.70% 75.40% 73.50% 75.70% 73.20% 69.30% 65.60% 67.40% 65.50%
2 5.20% 2.20% 13.40% 5.60% 11.10% 3.70% 8.60% 4.10% 9.10% 4.05%
3 1.30% 0.18% 2.90% 0.45% 3.60% 0.28% 2.70% 0.30% 3.20% 0.15%
4 0.22% ≤ 0.1% 0.64% 0.08% 0.80% ≤ 0.1% 0.70% 0.08% 0.60% 0.00%
≥5 ≤ 0.1% 0 0.002 ≤ 0.1% 0.001% ≤ 0.1% 0.002% ≤ 0.1% ≤0.001% 0.00%
Table 6. Proportion of top-200K websites importing resources classified as suspicious (with VTscore ≥ 10) at
each level.
reporting that Equifax and TransUnion were hit by a third-party web analytics script [37] [48].
Figure 7 presents the breakdown of the domain categories specifically for suspicious JavaScript
resources. Clear trends can be seen, with IT (e.g., dynaquestpc.com), Business (e.g.,vindale.com),
ACM Trans. Priv. Sec., Vol. 23, No. 02, Article 8. Publication date: March 2020.8:14 Ikram, et al.
IT
Business
NewsAndMedia
Entertainment
Adult
Download
Uncategorized
Shopping
Games
SocAndLifestyle
SearchEngines
Government
Streaming
PNandBackup
Education
Financial
WebHosting
Blogs
Ads
Sports
SocialNetworks
RefMaterials Level = 1
Parked
Forums Level 2
Vehicles
IM
0 200 400 600 800 1000 1200
# of Suspicious JavaScript Programs
Fig. 7. Breakdown of unique, suspicious JavaScript resources at explicit and implicit trust levels. Previous
work [7] used the domain category to group suspicious JavaScript resources. In the same spirit, we use the
domain category to group JavaScript resources into different groups such as IT, Business, etc. Here, the
Uncategorized category includes suspicious JavaScript resources whose domain’s categories are unknown to
WebSense, e.g.,newmyvideolink.xyz and cooster.ru. We observe that the suspicious JavaScript resources
hosted by domains of IT, Business, News and Media, and Entertainment dominate at explicit and implicit
trust levels.
News and Media (e.g., therealnews.com), and Entertainment (e.g., youwatchfilm.net) dominating.
Clearly, suspicious JavaScript resources cover a broad spectrum of activities. We observe that 70%
and 67%, respectively, of Business (Web analytics) and Ads JavaScript codes are loaded from level ≥
2 in contrast to 17% and 31% of JavaScript programs of Government and Shopping loaded at level 1.
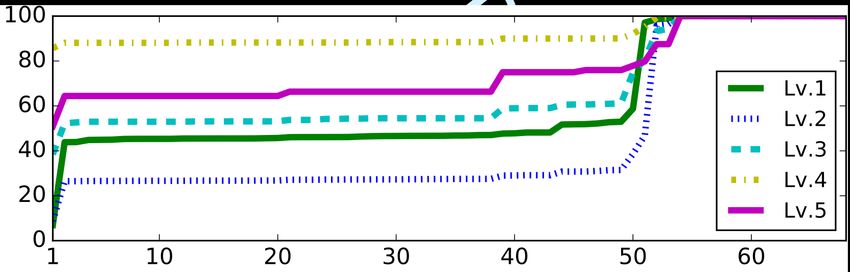
We next strive to quantify the level of suspicion raised by each of these JavaScript programs.
Intuitively, those with higher VTscores represent a higher threat as defined by the 68 AV tools
used by VirusTotal. Hence, Figure 8 presents the cumulative distribution of the VTscores for all
JavaScript resources loaded with VTscore > 0. We separate the JavaScript programs into their
location in the dependency chain. Clear difference can be observed, with level 2 obtaining the
highest VTscore (median 52). In fact, 78% of the suspicious JavaScript resources loaded on trust
level 2 have a VTscore > 52 (indicating very high confidence).
This is a critical observation; whereas suspicious third-parties at level 1 can be ultimately removed
by first-party website operators if flagged as suspicious, this is much more difficult for implicitly
trusted resources further along the dependency chain. If the intermediate (non-suspicious) level
1 resource is vital for the webpage, it is likely that some operators would be unable or unwilling
to perform this action. The lack of transparency and the inability to perform a vetting process
on implicitly trusted loaded resources further complicates the issue. It is also worth noting that
the VTscore for resources loaded further down the dependency chain is lower (e.g., level 4). For
example, 80% of level 4 resources receive a VTscore below 5. This suggests that the activity of
these resources is more contentious, with a smaller number of AV tools reaching consensus. It is
ACM Trans. Priv. Sec., Vol. 23, No. 02, Article 8. Publication date: March 2020.A Study of Third-party Resources Loading
JavaScript Resources (%)
8:15
CDF of Suspicious
VTscore
Fig. 8. CDF of VTscores for JavaScript programs (with VTscores > 0) at different levels in the chain.
impossible to state the reason for this, hence in Section 5 we analyze the dynamic activities of these
JavaScript content.
5 ANALYSIS OF SUSPICIOUS JAVASCRIPT RESOURCES
JavaScript codes are arguably the most dangerous resource to import, as JavaScript codes have the
potential to execute diverse functions (including the downloading of further resources). Thus, we
proceed to inspect the activities of the 7,166 JavaScript resources that were classified as suspicious
in our dataset. We achieve this by executing the JavaScript resources in an isolated sandbox, and
studying their activities.
5.1 Methodology
We use a dedicated testbed composed of three Virtual machines (VMs) that connect to the
Internet via a computer running the Cuckoo sandbox and tcpdump. These VMs are configured
with Windows 7, and are utilised to log all system-level events and to intercept all traffic being
transmitted between the virtual machines and the Internet. Moreover, we use Volatility [55] to
collect and analyse memory dumps of JavaScript code running in the browser. Volatility allows
us to reveal information (i.e., kernel-level processes and network connections) about the analysed
JavaScript codes. This allows us to observe the traffic generated by each JavaScript code when it is
rendered by the browser. For instance, our logs keeps a record of the network traffic generated, all
file operations, memory changes, registry changes etc..
For each test, we first create an HTML document and inject suspicious JavaScript code via the
tag. We then load the HTML in the browser of our VM testbed. We configured our testbed
to wait 120 seconds for each target JavaScript code, embedded in an HTML code, to be rendered by
the VM browser. The yielded logs are stored in a JSON object and pushed to our storage server for
further analysis. It took, on average, an additional 3 seconds transferring and saving data at our
server. Prior to each test, we turn-off and restore the VM to a clean snapshot. This ensures that
any malicious software downloaded by prior JavaScript code’s test does not remain on the VM. We
share the code and data for the testbed at https://wot19submission.github.io.
ACM Trans. Priv. Sec., Vol. 23, No. 02, Article 8. Publication date: March 2020.ACM Trans. Priv. Sec., Vol. 23, No. 02, Article 8. Publication date: March 2020.
8:16
# Level JavaScript Code Category VTscore A-Rank #HTTP #Domains Observed Behavior
1 Lvl-1 hxxp://pinshan.com/js/union/new-play-1.js Business 12 25,574 12 5 PUP11 activity e.g., Installing Fake AV and mediaplayers
2 Lvl-1 hxxp://newyx.net/js/dui_lian.js Games 11 22,057 12 6 Displaying annoying ads and perform click fraud
3 Lvl-1 hxxp://loxblog.com/fs/clocks/02.js IT 10 86,505 10 3 Installing additional SW with elevated privileges
4 Lvl-1 hxxp://mecum.com/js/jquery.fancybox.pack.js Business 13 51,897 9 3 PUP activity, Installing Fake AV and mediaplayers
5 Lvl-1 hxxp://bubulai.com/js/xp.js Enter. 10 117,261 9 5 Displaying annoying ads and perform click fraud
1 Lvl≥2 hxxp://yourjavascript.com/3439241227/blog.js PNandBackup 13 2,007,688 58 51 Displaying annoying ads and perform click fraud
2 Lvl≥2 hxxp://negimemo.net/alichina/login.js SW Download12 10 13,093,855 49 21 Displaying annoying ads and perform click fraud
3 Lvl≥2 hxxp://funday24.ru/js/c/funday-index.js News 11 2,017,900 42 9 Displaying annoying ads and perform click fraud
4 Lvl≥2 hxxp://netcheckcdn.xyz/optout/set/strtm.js Business 14 18,064,762 42 7 Displaying annoying ads and perform click fraud
5 Lvl≥2 hxxp://pushmoneyapp.com/js/main.js Business 17 8,757,970 41 6 Installing additional SW with elevated privileges
Table 7. Top 5 suspicious JavaScript resources measured by number of HTTP requests generated. We separate into JavaScript code loaded at Level 1 (upper
part of table) and Level ≥2 (lower). Here ‘A-Rank’ and ‘Category’ represent Alexa rank and category of the domain of the JavaScript code, respectively. Here,
PUP stands for Potentially Unwanted Programs, including “bogus” software such as free screen-savers or fake AV scanners that surreptitiously generate
advertisements or perform redirections to collect personal identifiable information. SW Download means websites that share or facilitate downloading
software executables. Note that PDF readers may render these suspicious links and expose readers of the paper to potential risks; therefore, we have replaced
http:// with hxxp:// to avoid PDF rendering and potential risks.
Ikram, et al.A Study of Third-party Resources Loading 8:17
5.2 Results
Using our sandbox testbed, we next measure and briefly discuss which resources are accessed by
suspicious JavaScript programs, as well as any dropfiles that are generated on the VM.
1.0
0.8
0.6
CDF
0.4
All Lvl-3
0.2 Lvl-1 Lvl-4
Lvl-2 Lvl 5
0.0
0 10 20 30 40 50 60
# of HTTP Requests per Suspicious JS
(a) CDF of number of generated HTTP requests per
suspicious JS at different dependency levels.
1.0 1.0
0.8 0.8
0.6 0.6
CDF
CDF
0.4
Ads NewsAndMedia 0.4 Ads NewsAndMedia
0.2 IT Adult IT Adult
Business Download 0.2 Business Download
0.0
2 4 6 8 10 12 0 10 20 30 40 50
# of HTTP Requests per Suspicious JS # of HTTP Requests per Suspicious JS
(b) CDF of the number of generated HTTP requests(c) CDF of number of generated HTTP requests per
per suspicious JS at Level = 1 suspicious JS at Level ≥ 2
Fig. 9. CDFs of the number of HTTP requests generated per suspicious JavaScript resources viewed: (i) across
different levels of the dependency chain and categories of domains; (ii) Level = 1; and (iii) Level ≥ 2.
5.2.1 HTTP Request Frequency. We start by inspecting the underlying HTTP requests triggered by
the JavaScript programs. Table 7 provides a list of the JavaScript resources that generate the most
HTTP requests (separated into implicit and explicitly trusted). There is significant network activity
generated by the suspicious JavaScript resources within our testbed, with downloads initiated at
various locations in the dependency chain: 44.7% of requests are triggered at level 1 (explicit trust),
whereas 55.3% at level ≥ 2 (implicit trust).
To explore this further, Figure 9a presents the distribution of the number of HTTP requests
generated per suspicious JavaScript. The figure splits the JavaScript programs into their respective
positions in the dependency chains. Although 47% of JavaScript resources generate fewer than
5 requests, there are notable differences among the different levels. JavaScript resources at level
1 generate the fewest HTTP requests (median 2), yet level ≥ 4 are extremely active (median 30
requests). 36% of the JavaScript programs imported from level 5 generate at least 30 HTTP requests
in contrast to 15% of the JavaScript programs sourced from level 2. This is in contrast to a typical
behavior of legitimate JavaScript programs that have been previously measured to generate on
average just 4 HTTP requests [47].
Furthermore, VirusTotal shows that those at level 1 tend to have lower VTscores (average 13),
compared to those at ≥ 2, which tend to have a higher score (average 21). This is worrying as
ACM Trans. Priv. Sec., Vol. 23, No. 02, Article 8. Publication date: March 2020.8:18 Ikram, et al.
resources loaded further down the dependency chain are the most opaque to the website operator.
The most regularly observed JavaScript at level 1 is new-play-1.js, a relatively highly ranked
(22,574 Alexa) script which downloads dropfiles. In contrast, at level ≥ 2, the most regularly observed
JavaScript is blog.js, which show intrusive adverts that perform click fraud.
We are also interested in how behaviours might differ across categories of website. Hence,
Figure 9b and 9c separate the JavaScript resources into their respective content categories. They
then plot the distribution of number of requests per JavaScript within these categories. Whereas
those at level 1 (explicit trust) exhibit relatively similar traits across all categories (Figure 9b), we
find that those at level ≥ 2 (implicit trust) have far more divergence across categories (Figure 9c).
Those classified as Business, IT or Adult are the most active, whereas News, Ads and Download
generate the fewest HTTP requests. This is largely driven by the fact that most Business (i.e., a
subcategory of web-analytics) domains download more JavaScript codes, which then subsequently
trigger further downloads (creating a cumulative effect). In contrast, other categories (e.g., IT, Adult
and Blogs) tend to download more static content, e.g., images (which do not trigger further requests).
When inspecting what exactly the requests contain, we find that the overwhelming majority are
downloading dropfiles (see Section 5.2.3). A remarkable 99.5% of all suspicious JavaScript codes
download at least one dropfile, with the vast majority (98.62%) involving malvertising and click
fraud (as identified via VirusTotal). This creates a heavy traffic footprint: 22% of HTTP requests are
downloading dropfiles (further discussed in Section 5.2.3).
20min.ch 100
amazontrust.com
bing.com
comodoca.com
comodoca4.com 80
digicert.com
energy.gov
globalsign.com
godaddy.com
google.com 60
identrust.com
letsencrypt.org
microsoft.com
msftncsi.com
mydiv.net 40
nazwa.pl
ocsp-certum.com
startssl.com
telenet.be
trust-provider.com 20
uol.com.br
update.googleapis.com
usertrust.com
waptrick.com
yourjavascript.com 0
Number of HTTP Requests by Suspicious JavaScripts
Fig. 10. Heatmap of number of requests to domains by suspicious JavaScript codes and histogram of top 25
contacted domains by suspicious JavaScript codes.
5.2.2 HTTP Request Targets. We next inspect the domains that these requests are accessing, i.e.,
the domains hosting the content and files downloaded. For ease of presentation, we consider the top
25 domains targeted by the suspicious JavaScript codes (in terms of total number of HTTP requests
targeting them). Figure 10 presents a heatmap illustrating the number of requests to them, with the
ACM Trans. Priv. Sec., Vol. 23, No. 02, Article 8. Publication date: March 2020.You can also read