BMO Global Metals & Mining Conference - March 2021 NYSE: CDE - Coeur Mining

Page created by Joel Vargas
 
CONTINUE READING
BMO Global Metals & Mining Conference - March 2021 NYSE: CDE - Coeur Mining
BMO Global Metals & Mining Conference

          March 2021
                                              NYSE: CDE

                                              NYSE: CDE   1

JC 2016
BMO Global Metals & Mining Conference - March 2021 NYSE: CDE - Coeur Mining
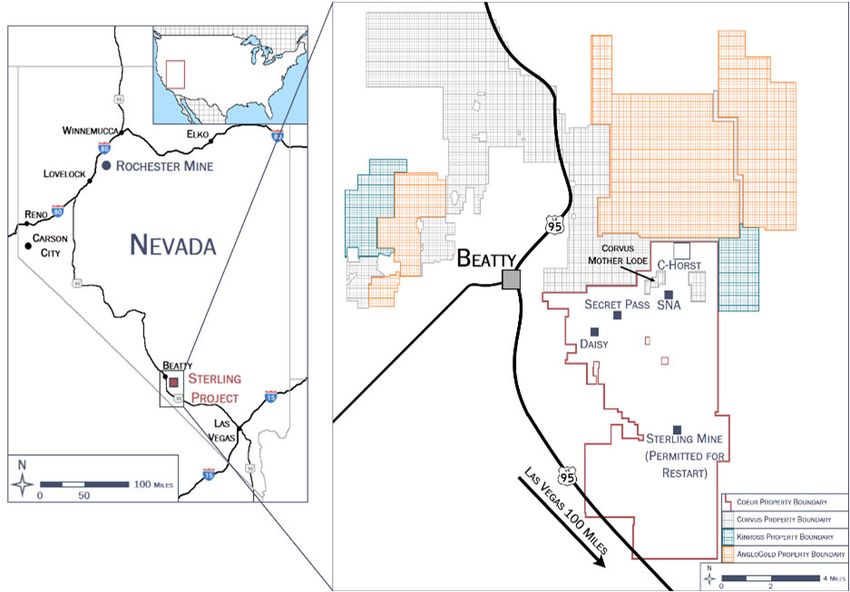
Cautionary Statements
          This presentation contains forward-looking statements within the meaning of securities legislation in the United States and Canada, including statements involving strategic priorities and
          company strategies, expectations regarding environmental, social and governance (“ESG”) initiatives, anticipated production, costs and expenses, exploration and development efforts, health
          and safety protocols, COVID-19 planning and response measures, operations, expectations and initiatives at the Palmarejo, Rochester, Kensington, Wharf and Silvertip mines, throughput,
          mining rates, grades, depletion, tons placed and crushed, mine life, growth, capital allocation, and hedging strategies. Such forward-looking statements involve known and unknown risks,
          uncertainties, and other factors which may cause Coeur's actual results, performance, or achievements to be materially different from any future results, performance, or achievements
          expressed or implied by the forward-looking statements. Such factors include, among others, the risk that the strategies, initiatives and expectations described in this presentation are not
          achieved on a timely basis or at all, the risks and hazards inherent in the mining business (including risks inherent in developing large-scale mining projects, environmental hazards,
          industrial accidents, weather, or geologically related conditions), changes in the market prices of gold, silver, zinc, and lead, and a sustained lower price or higher treatment and refining
          charge environment, the uncertainties inherent in Coeur's production, exploratory and developmental activities, including risks relating to permitting and regulatory delays (including the
          impact of government shutdowns), ground conditions, grade variability, any future labor disputes, or work stoppages, the uncertainties inherent in the estimation of mineral reserves and
          resources, changes that could result from Coeur's future acquisition of new mining properties or businesses, the loss or insolvency of any third-party smelter to which Coeur markets its
          production, the potential effects of the COVID-19 pandemic, including impacts to the availability of our workforce, continued access to financing sources, government orders that may require
          temporary suspension of operations at one or more of our sites and effects on our suppliers or the refiners and smelters to whom the Company markets its production and the communities
          where the Company operates, the effects of environmental and other governmental regulations and government shut-downs, the risks inherent in the ownership or operation of or investment
          in mining properties or businesses in foreign countries, Coeur's ability to raise additional financing necessary to conduct its business, make payments or refinance its debt as well as other
          uncertainties and risk factors set out in filings made from time to time with the United States Securities and Exchange Commission, and the Canadian securities regulators, including, without
          limitation, Coeur's most recent report Form 10-K. Actual results, developments, and timetables could vary significantly from the estimates presented. Readers are cautioned not to put undue
          reliance on forward looking statements. Coeur disclaims any intent or obligation to update publicly such forward-looking statements, whether as a result of new information, future events, or
          otherwise. Additionally, Coeur undertakes no obligation to comment on analyses, expectations, or statements made by third parties in respect of Coeur, its financial or operating results or its
          securities.
          Christopher Pascoe, Coeur's Director, Technical Services and a qualified person under Canadian National Instrument 43-101, reviewed and approved the scientific and technical information
          concerning Coeur's mineral projects in this presentation. Mineral resources are in addition to mineral reserves and do not have demonstrated economic viability. Inferred mineral resources
          are considered too speculative geologically to have the economic considerations applied to them that would enable them to be considered for estimation of mineral reserves, and there is no
          certainty that the inferred mineral resources will be realized. For a description of the key assumptions, parameters and methods used to estimate mineral reserves and resources, as well as
          data verification procedures and a general discussion of the extent to which the estimates may be affected by any known environmental, permitting, legal, title, taxation, socio-political,
          marketing or other relevant factors, Canadian investors should see the Technical Reports for each of Coeur's properties as filed on SEDAR at www.sedar.com.
          Cautionary Note to U.S. Investors - The United States Securities and Exchange Commission permits U.S. mining companies, in their filings with the SEC, to disclose only those mineral
          deposits that a company can economically and legally extract or produce. We may use certain terms in public disclosures, such as "measured," "indicated," "inferred” and “resources," that
          are recognized by Canadian regulations, but that SEC guidelines generally prohibit U.S. registered companies from including in their filings with the SEC. U.S. investors are urged to consider
          closely the disclosure in our Form 10-K which may be secured from us, or from the SEC's website at http://www.sec.gov.
          Non-U.S. GAAP Measures - We supplement the reporting of our financial information determined under United States generally accepted accounting principles (U.S. GAAP) with certain
          non-U.S. GAAP financial measures, including adjusted net income (loss), operating cash flow excluding changes in working capital, adjusted EBITDA, adjusted EBITDA margin, total leverage,
          net leverage, free cash flow and adjusted costs applicable to sales per ounce/pound. We believe that these adjusted measures provide meaningful information to assist management,
          investors and analysts in understanding our financial results and assessing our prospects for future performance. We believe these adjusted financial measures are important indicators of
          our recurring operations because they exclude items that may not be indicative of, or are unrelated to our core operating results, and provide a better baseline for analyzing trends in our
          underlying businesses. We believe adjusted net income (loss), adjusted EBITDA, adjusted EBITDA margin, total leverage, net leverage, free cash flow and adjusted costs applicable to sales
          per ounce/pound are important measures in assessing the Company's overall financial performance. This presentation does not represent an offer of any securities for sale.

                                                                                                                                                                                     NYSE: CDE         2

JC 2016
BMO Global Metals & Mining Conference - March 2021 NYSE: CDE - Coeur Mining
Company Overview
          Headquartered in Chicago, IL, Coeur Mining (NYSE: CDE) is a well-diversified,
          growing precious metals producer with a repositioned portfolio, focused on
          generating sustainable, high-quality cash flow from its North American assets

               Five                     Three               Cash Flow & Returns             Committed                Best-in-class
          quality operations      top jurisdictions                   focused              community partner     corporate governance

                                                                                                               Palmarejo
                                                                                                               Northern Mexico

                                                                                                                Au    Ag

                                                                                                               Rochester
                                        S ILVERTIP                                                             West-Central Nevada

                          K ENSINGTON                                                                           Ag    Au

                                                                                                               Kensington
                                                                                                               Southeast Alaska

                                                                                                                Au
                                                             W HARF
                                                     ROCHESTER                                                 Whar f
                                                                      C ORPORATE O FFICE                       Black Hills South Dakota

                                                                                                                Au

                                                          PALMAREJO                                            Silver tip
                                                                                                               Northern British Columbia

                                                                                                                Ag    Zn    Pb

                                                                                                                              NYSE: CDE    3

JC 2016
BMO Global Metals & Mining Conference - March 2021 NYSE: CDE - Coeur Mining
Key Messages

                 Rebuilt        Coeur has established a healthy culture, developed a solid strategy, and
               Foundation       assembled a strong, aligned team to deliver consistent results

                Industr y       The Company is an industry leader in environmental, social and
              Leader in ESG     governance practices

             Transformational   The expansion of Rochester is technically sound, provides excellent
               Expansion at     economics, has a solid funding plan, and is expected to fundamentally
                Rochester       reshape Coeur

               High-Impact      The Company’s higher-level of exploration investment is a key
               Exploration      differentiator and is leading to new discoveries, longer mine lives and
                 Growth         higher returns

                Silver tip
                                Recent technical work and exploration results are creating a potentially
                Potential
                 Restar t       compelling path forward

                 Robust         The three-year outlook reflects strong returns from the Company’s
               Three-Year       portfolio followed by an anticipated step change in cash flow post-
                Outlook         Rochester expansion

                                                                                                      NYSE: CDE   4

JC 2016
BMO Global Metals & Mining Conference - March 2021 NYSE: CDE - Coeur Mining
Compelling Strategy Aligned with Stockholder Priorities
               Coeur’s strategy is to safely and responsibly discover, develop and operate a
               balanced portfolio of quality precious metals assets in low-risk jurisdictions to
               maximize cash flow, returns and net asset value
                                                    Priorities                                                               
                                                                                                                             •    U.S.-based and NYSE-listed, mid-tier gold and silver producer
                                                                                                                             •
                                                                                                                                 Balanced portfolio of assets located solely in North America
                                          Purpose                Culture
                                                                                                                                  Targeting higher returns on invested capital and strong free cash
                   Accountability

                                                                                                                             •
                                                                                                                             
                                           “Why”                 “How”

                                                                                          Alignment
                                                                                                                                  flow1 growth via high-impact organic growth
                                                                                                                             •
                                                                                                                                 Industry-leading investment in exploration
                                        Organization             Strategy                                                    •
                                                                                                                                 Recognized as industry leader for ESG programs and initiatives
                                           “Who”                 “What”
                                                                                                                             •
                                                                                                                                 Approaching key inflection point driven by Rochester expansion
                                                    Execution                                                                •
                                                                                                                                 Approximately $47 million ADTV (~1.8% of market cap)2

                                                 Protecting the                                                        Social and                                              Governance
                                                 Environment                                                        Community Impact                                           Performance
                   • Leading tailings management                                                      • 237 high-impact community                             • 50% of independent directors are
                                    procedures and practices                                            partnerships3                                           diverse
                   • Published responsibility report in                                               • Innovative development and                            • Innovative incentive compensation
                                    April 2020                                                          diversity initiatives                                   design aligned with stockholders
                                                                                                                                                              • ISS “1” Quality Score for Governance
                   • Recently entered into first-of-its kind                                          • First precious metals company to
                                    sage-grouse habitat agreement in                                    sign CEO Action for Diversity and                     • Proactive stockholder engagement
                                    Nevada                                                              Inclusion pledge                                      • Winner of 2020 & 2019 Corporate
                   • Partnership with Trout Unlimited to                                              • 71% of employees from                                   Secretary Magazine’s Best Proxy
                                    support abandoned mine legislation                                  surrounding communities                                 Statement Award (mid-/small cap)

          (1) Free cash flow is defined as cash flow from operating activities less capital expenditures.                                                                                 NYSE: CDE    5
          (2) ADTV = Average Daily Trading Volume. Data observed over a 90-day trading period. FactSet as of February 24, 2021.
          (3) Reflects 2019 data.

JC 2016
BMO Global Metals & Mining Conference - March 2021 NYSE: CDE - Coeur Mining
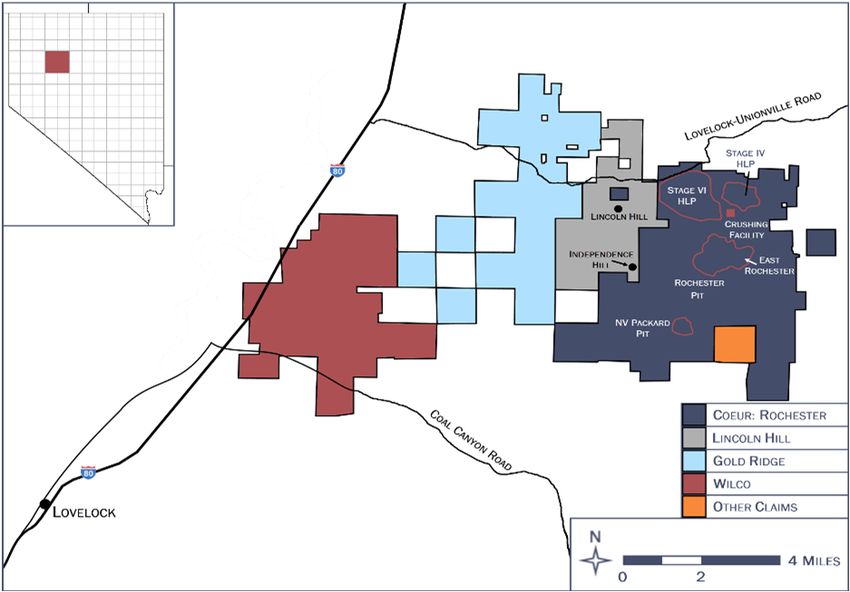
Recent ESG Accomplishments
               Coeur is committed to being an industry leader in its environmental, social and
               governance practices, exemplified by the Company’s accomplishments in
               protecting its people, places and planet

                                                                   Developed TCFD         Completed Community              Completed Pay
                                                                   Reporting Road        Relations Assessment &            Equity Analysis
                                                                        Map              Strategic Planning Effort

                                                                       #1
                                                                   Ranked Among          2020 & 2019 Winner of         Winner of cfi.co, Best
                                                                   Peer Group by          Best Proxy Statement        Miner Governance, North
                                                                   Sustainalytics,         (mid-/small cap) 1              America 2020
                                                                     May 2020
                      Published Responsibility Report

                                                                               Mitchell Krebs,         Korie Hickel, Manager ESG,
                                                                              President & CEO,         named to SASB Extractives
                        ISS QualityScore of ‘‘1’’ for                        named Vice Chair of       Sector Standards Advisory
                       Governance (Highest Possible)                         NMA ESG Task Force                  Group

          (1) Corporate Secretary’s Corporate Governance Awards.                                                                      NYSE: CDE   6

JC 2016
BMO Global Metals & Mining Conference - March 2021 NYSE: CDE - Coeur Mining
Balanced, Low-Risk Portfolio of Precious Metals Assets
                     Metal Sales                                                        2010                                                                              2020

                                                                                     12%                                                                                                                  Palmarejo
                                                                                                                                                                   22%
                                                                                                                                                                                                          Rochester
                                                                                                                                                                                          36%             Kensington
                            Asset                                                     $516M
                                                                                                            45%
                                                                                                                                                                        $785M                             Wharf
                                                                           28%
                                                                                                                                                                                                          San Bartolomé
                                                                                                                                                                28%                                       Other1
                                                                                     5%                                                                                             14%
                                                                                           10%

                                                                  15%                                                                                                                                     U.S.
                                                                                                                                                                                                          Mexico
                                                                  45%                                                                                                                                     Bolivia
                      Geography                                                                                                                                                                           Australia
                                                                  28%                                                                               63%
                                                                                                                                                                                                          Argentina

                                                                   2%                                                                                       36%
                                                                                                                          10%
                                                                                                                                                Ov er $430 m i llion o f U . S. N e t Op e r ating L o s ses 2

                            Metal                                               Ag Au                                                                             Au Ag
                                                                                69%                31%                                                            74%                25%

          (1) Other refers to Coeur Capital (primarily production from the Endeavor silver stream in Australia) and the Martha Mine in Argentina. Both assets have been sold by Coeur.                     NYSE: CDE      7
          (2) As of December 31, 2020.

JC 2016
BMO Global Metals & Mining Conference - March 2021 NYSE: CDE - Coeur Mining
Continued Improvement in Financial Results
                LTM Adjusted EBITDA1                                                              LTM Free Cash Flow1,2
                ($M)                                                                              ($M)

                     +51%                                                    $263                       + $ 5 7M                         $49
                                                                $239
                                                                                                                                 $38
                                                                                                                                                     Increased Production
                                                  $209

                      $174
                                    $195

                                                                                                                                                             +
                                                                                                                   $5
                                                                                                                                                         Lower Costs

                    4Q 2019 1Q 2020 2Q 2020 3Q 2020 4Q 2020
                                                                                                            ($8)          ($7)
                                                                                                      4Q 2019 1Q 2020 2Q 2020 3Q 2020 4Q 2020
                                                                                                                                                             +
                                                                                                                                                        Higher Prices

                Cash & Cash Equivalents                                                           Net Leverage Ratio1
                ($M)                                                                              (Net Debt3/LTM EBITDA1)

                     +67%                                                     $93                                                       (0.7x)
                                                                                                                   1.5x
                                                                                                            1.4x
                                                                                                                          1.3x
                                                                                                                                                 • Stronger Adj. EBITDA1
                                                                                                                                                 

                                                                 $77

                                                   $71
                                                                                                                                                 • Free Cash Flow1,2 Growth
                                                                                                                                                 
                                                                                                                                 0.9x

                       $56
                                                                                                                                         0.7x    • Higher Cash Balances
                                                                                                                                                 
                                     $53

                    4Q 2019 1Q 2020 2Q 2020 3Q 2020 4Q 2020                                           4Q 2019 1Q 2020 2Q 2020 3Q 2020 4Q 2020    • Lower Leverage Levels

          (1) See non-GAAP reconciliation tables in the appendix to this presentation.                                                                                  NYSE: CDE   8
          (2) Free cash flow is defined as cash flow from operating activities less capital expenditures.
          (3) Net debt equals total debt less cash and cash equivalents.

JC 2016
BMO Global Metals & Mining Conference - March 2021 NYSE: CDE - Coeur Mining
Coeur’s Capital Allocation Framework
          Mining is capital intensive and requires a disciplined approach to capital
          allocation with a view toward long-term reserve replacement and growth
                                             Illustrative
                                                Return                      Key Benefits                                 Key Considerations
                           Safety/                           Reflects the Company’s values
                        Environment/              −          Mitigates risk for stakeholders
                        Sustainability                       Establishes and sustains social license

                                                             Highest returns and quickest impact           Finite opportunity set
                       Asset Optimization/                   Low capital intensity
                                               25% +
                         Enhancements                        Lowest risk

                                                             High success/lowest risk exploration         Returns dependent on specific deposit
                           Brownfield                        Low average discovery cost                   All deposits eventually come to an end
                                               20% +
                           Exploration                       Quick payback given existing infrastructure

                                                             Opportunity to meaningfully impact            Limited number of opportunities meet criteria
                          Opportunistic                       company                                       Requires significant organizational commitment
                                               15% +
                             M&A                             Scale and liquidity can be differentiators    Challenging social dynamics
           Capital                                                                     6% - 10% estimated cost of capital
          Allocation                                         Potential to create substantial value from  Low success rate
                           Greenfield         Can vary        new discoveries                             Requires long-term, sustained financial and
                           Exploration         widely                                                       organizational commitment

                                                             Eliminates/reduces interest expense           Low ROI
                             Debt                            Improves balance sheet flexibility            Reduces cash liquidity levels
                                               5% - 6%
                           Repayment                         Mitigates downside metal price risk           Bond buybacks can be expensive

                                                             Reflects Board and management                 Industry’s cyclicality and capital intensity
                           Dividends/                         confidence in long-term outlook               Not a key driver for most investors
                                                  −
                          Repurchases                        Provides discipline                           Limited under indenture and credit agreement
                                                             Opportunity to differentiate among peers
                                                                                                                                              NYSE: CDE       9

JC 2016
BMO Global Metals & Mining Conference - March 2021 NYSE: CDE - Coeur Mining
Multiple High-Impact Organic Growth Opportunities
          Coeur has multiple high-impact expansion, exploration and optimization
          opportunities embedded in its portfolio, which it is prioritizing and pursuing
          based on the Company’s capital allocation framework

                  Expansion                                            Exploration                                  Optimization

                   Rochester POA 11                      Near-Mine               New Discoveries                     Rochester Throughput
                      Expansion                                                                                           and HPGR
                                                      Palmarejo District              Sterling
                                                                                                                  Palmarejo Processing Facility
              Palmarejo Excess Processing          East & West Rochester               Crown
                                                                                                                      Kensington & Wharf
                 Capacity/San Miguel
                                                                                      C-Horst                            Automation
                                                     Kensington District
                 Silvertip Expansion and                                       Camp Creek (Silvertip)                Wharf Crushing Rates
                          Restart                      Silvertip District                                                 La Preciosa

           • Pursuing a higher standard                                     • Aligning organizational structure and incentive compensation

           • Executing largest exploration program in Company history       • Measuring success based on actual results

           • Allocating capital according to Company’s framework            • Striving to achieve higher returns, longer mine lives and
                                                                                margin expansion

                                                                                                                                        NYSE: CDE   10

JC 2016
Prudently Investing in Organic Growth
               Capital Expenditures by Mine                                                                  2021E Capital Expenditures1
               (% companywide total)
                                                                                                             Site                 Range       Commentary
                                                                                            1%
                                                  1%
                              2%                                                                                                              • Underground development and
                                        13%                                         14%          15%                                            equipment replacements
                                                                         2%                                  Palmarejo         $40M - $45M
                                                                                                                                              • Open pit backfill and tailings
                          20%                          26%                   9%
                                                                                                                                                dam raise
                                      2020                                            2021E1
                                       $99M                                        $260M-$325M               Rochester        $155M - $195M • Execution of POA 11 expansion

                                                                                                                                              • Underground development and
                                                                                                             Kensington        $23M - $30M
                                                                                                 60%                                            equipment replacements
                                       38%
                                                                                                                                              • General maintenance and
                                                                                                             Wharf              $5M - $8M
                                                                                                                                                increased infill drilling
                             Palmarejo                  Rochester                 Kensington
                                                                                                                                              • Expansion capital,
                             Wharf                      Silvertip                 Crown/Sterling & Other
                                                                                                             Silvertip         $35M - $45M      underground development and
                                                                                                                                                increased infill drilling

               Capital Expenditures Composition                                                              Crown/Sterling
                                                                                                                                $2M - $2M     • Corporate expenditures
               (% companywide total)                                                                         & Other

                                                                                                             TOTAL            $260M - $325M

                                                                              31%
                                                       40%                                                   Sustaining2                           $80M - $100M
                                      2020                                                2021E1
                                       $99M                                         $260M-$325M
                         60%                                                                                 Development                          $180M - $225M
                                                                                                       69%
                                                                                                             TOTAL                                $260M - $325M

                                                    Developing                Sustaining2
                                                                                                                Includes $17-$21 million allocated to infill drilling
          Note: Capital expenditures includes capitalized exploration.                                                                                            NYSE: CDE      11
          (1) Based on midpoint of guidance as published by Coeur on February 17, 2021.
          (2) Sustaining capital expenditures exclude capital leases.

JC 2016
Rochester: Expansion Expected to Unlock Significant Value1
                  Coeur expects Rochester to generate over $100 million in average annual free
                  cash flow2,3 post-expansion, leading to an after-tax NAV5% of $634 million with
                  an internal rate of return of 31% based solely on proven and probable reserves
                     Low technical execution                                             Top-tier mining                                     18-year mine life with                   Accelerated silver
                              risk                                                         jurisdiction                                         organic growth                           recoveries

                           Open pit, heap leach                                     Nevada and U.S. NOLs                                      Robust project pipeline              68%/2 yrs. vs. 61%/20 yrs.

                              Higher planned                                         $397 million in                                        $100+ million in avg.                    $634 million NAV 5%
                             throughput rates                                      construction capital 4                                  annual free cash flow 2,3               based on P&P reser ves

                     ~28.5 million tons per year                                Funded with cash and debt                                     Significant step-change                With potential upside

                  Value Proposition                                                                                                         Facilitates Multiple Stockholder Priorities
                                         Successful Near-Mine Exploration                                                                    •     Higher overall returns on invested capital
                     +                                                                                                                       •     Sustained, strong free cash flow2
                                                        Economies of Scale
                     +                                                                                                                       •     Further de-leveraging opportunities
                                HPGR Crusher Impact on Silver Recoveries
                                                                                                                                             •     Leading, low-risk exposure to precious metals prices
                                                            Higher Returns                                                                   •     Funding of other high-quality growth opportunities
                     =
                                       Fundamental Step-Change for Coeur                                                                     •     Potential to return excess capital over the long term
          (1)   For additional information on the expansion of Rochester, Canadian investors should refer to the latest Technical Report for Rochester on file at www.sedar.com.                     NYSE: CDE   12
          (2)   Free cash flow is defined as cash flow from operating activities less capital expenditures.
          (3)   Reflects annual average free cash flow from 2023 to 2032.
          (4)   Reflects planned capital expenditures from 2021 to 2023.

JC 2016
Rochester: Expansion Project Timeline
                Major construction activities commenced in January 2021 and are expected to
                be largely completed by late 2022

                                                 2019             2020                                 2021                                  2022                  2023

                                                 4Q     1Q   2Q          3Q        4Q      1Q     2Q          3Q      4Q      1Q      2Q            3Q   4Q   1Q          2Q
                                                                                                                                                                    Ramp-up to
                                 Leach
                   I              Pad1                                                                                                                              Commercial
                                                                                                                                                                    Production

                          Merrill-Crowe
                  II         Plant

                              Crushing
                  III          Circuit

                                       General
                        Infra.
                         Site

                                        Power

                                                             Engineering            Procurement        Construction        Commissioning

                   I                                                          II                                                       III

          (1) Includes ancillary facilities.                                                                                                                   NYSE: CDE       13

JC 2016
Silvertip: Diligently Advancing Toward Potential Restart
          Coeur has made significant progress to advance Silvertip; however, additional
          steps are required for the Company to further de-risk the project and enhance
          the economics of a potential restart

                                                         Front-End Engineering and Design
                Scoping and
                                      Project risk reduction phase with capital optimization, progression of
                Pre-feasibility
                                     engineering to execution level design and schedule, engagement of key
                 Engineering
                                                      partners in permitting and construction

                                     • Continue investing in exploration, extending mine life and project returns
                Feasibility and      • Evaluate potential financing alternatives (e.g., offtake agreements)
                  Front-End
                                     • Progress engineering through Detailed Design phase
                 Engineering
                 and Design          • Finalize project implementation and construction schedule
                                     • Prepare Project and Operational Readiness plans
                                     • Obtain permit amendments for restart and expansion with stakeholder's
                                        support
                                     • Plan to release results of updated technical report in 2H 2021

               Implementation
                and Execution                    Evaluate investment according to Coeur’s capital
                                                              allocation framework

                                                                                                               NYSE: CDE   14

JC 2016
Sustaining a Higher-Level of Exploration Investment
               Coeur successfully completed the largest exploration program in its history in
               2020. The Company expects to maintain its commitment to a higher-level of
               exploration investment in 2021, while maintaining its results-driven focus on
               high-return targets
               Total Exploration Investment                                                          2021E Exploration Investment by Site2
               ($M)
                                                                                                               Expensed                                         Capitalized
                    Expensed
                                                                                         $68                       6%
                    Capitalized                                                                            21%                                                  19%

                                                                                                                                         +
                                                                                                                          19%                                                27%

                                                                                                            $46M-$51M                                           $17M-$21M
                                                                                                                           13%                             26%
                                                                                  $51                    22%
                                                                                                                                                                              17%
                                                                                                                   19%                                                11%
                                                          $44
                                        $42
                                                                                         72%

                                                                            $30                                                              5%
                                                          58%
                      $25                                                         84%                                             15%               21%
                                        72%

                      51%                                                  75%                                                       $63M-$72M
                                                                                                                                                          14%
                                                                                                                             21%

                                                          42%                            28%
                      49%                                                                                                               7%        17%
                                        28%
                                                                           25%    16%

                                                                                                 1
                                                                                                       Palmarejo         Rochester            Kensington           Wharf        Silvertip
                     2016              2017              2018              2019   2020   2021E
                                                                                                                                Crown/Sterling             Other

          (1) Midpoint of guidance as published by Coeur on February 17, 2021.                                                                                              NYSE: CDE       15
          (2) Guidance as published by Coeur on February 17, 2021.

JC 2016
Nevada-Based Exploration Investment Opportunities
               Coeur is uniquely positioned to build out its organic growth portfolio in the U.S.,
               specifically in Nevada – the world’s top mining jurisdiction1. The Company
               believes investing in these opportunities will drive long-term value for
               stockholders
               Northern Nevada                                                   Southern Nevada

               •      Significant potential to further grow reserves and        •   Acquired in late 2018 containing multiple gold deposits
                       leverage Rochester’s existing infrastructure              •   ~35,500 net acres in southern Nevada near existing
               •      East Rochester represents potential for significant            infrastructure
                       higher-grade addition to current reserves and resources   •   New discovery results (e.g., C-Horst) by Coeur adjacent
               •      Acquired property package adjacent to Rochester in late        to other new gold discoveries
                       2018 for ~$19 million                                     •   Future potential sources of low cost, long-life open pit
               •      Total land position of over 40,300 acres                       gold production
          (1) Fraser Institute Annual Survey of Mining Companies (2020).                                                           NYSE: CDE     16
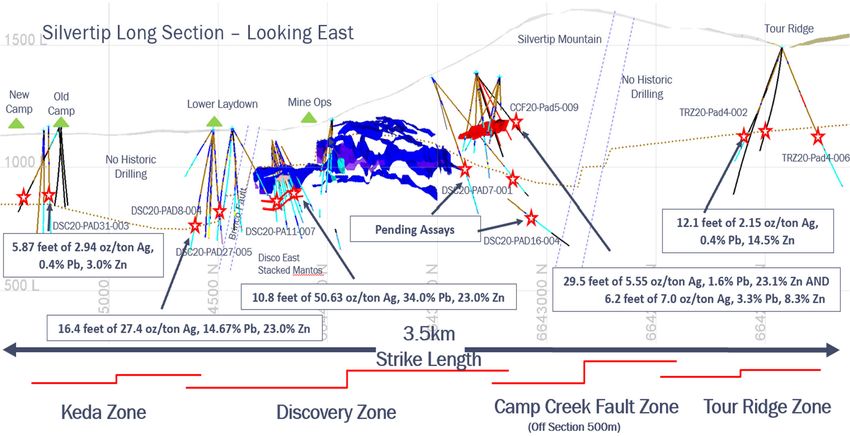
JC 2016
Continued Exploration Success in Canada
               Coeur significantly increased the size of Silvertip’s resource base in 2020,
               following the largest and most successful exploration program in the history of
               the property. Additionally, the Company more than tripled the strike length of
               the high-grade deposit
               Silvertip Long Section (Looking East)

          Note: For complete tables of all drill results published in 2020, please refer to the following links:   NYSE: CDE   17
          https://www.coeur.com/_resources/pdfs/2021-02-17-RR-Exploration-Update-Appendix-Final.pdf;
          https://www.coeur.com/_resources/pdfs/2020-08-11_Exploration_Update_Appendix_-_Final.pdf;
          https://www.coeur.com/_resources/pdfs/2020-12-17-Investor-Day-Exploration-Update-Appendix-Final.pdf.

JC 2016
Expanded Reserve and Resource Base
                Coeur’s 2020 exploration program was highly successful in replacing
                production and growing resources via new discoveries. Continued near mine
                resource expansion and strong results reflect the potential for further mine life
                extensions and organic growth opportunities with continued drilling
                                        Proven & Probable Reserves                                       Measured & Indicated Resources                                              Inferred Resources
                                                          3.1M                  +22% YoY increase                            3.1M                  +18% YoY increase                  2.9M                                    3% YoY decrease
                                                                                                                                                                                                       2.8M
                                        2.6M                                                               2.6M
                                                                            • Significant increases at                                         • Solid growth from                                                       • Decrease largely driven
                  Gold (oz)

                                                                              Palmarejo and Rochester                                            Palmarejo, Kensington                                                     by successful
                                                                            • Partially offset by                                                and Wharf                                                                 conversions
                                                                              depletion at Kensington                                          • Partially offset by                                                     • Modest growth at
                                                                              and Wharf                                                          conversions at Rochester                                                  Rochester and
                                                                                                                                                                                                                           Kensington
                                         2019              2020                                             2019              2020                                                    2019              2020

                                                          259.5M                +42% YoY increase                                                   +5% YoY increase                                                          6% YoY decrease
                                                                                                          244.3M 255.4M
                                        182.9M                              • Significant increases at                                         • ~50% growth in silver               112.7M 105.5M • Decrease largely driven
                  Silver (oz)

                                                                              Palmarejo and Rochester                                            M&I at Palmarejo and                                by successful
                                                                            • Minimal infill drilling                                            Silvertip                                           conversions
                                                                              conducted at Silvertip                                           • Partially offset by                                                     • ~3.8M oz added from
                                                                              during the year                                                    conversions at Rochester                                                  successful drilling
                                                                                                                                                                                                                           campaign at Silvertip
                                          2019              2020                                             2019              2020                                                    2019              2020

                                                                             0% YoY increase in zinc                                           +45% YoY increase in zinc                                                 +69% YoY increase in zinc
                                        295.4M

                                                          296.1M

                                                                                                                             442.1M

                                                                                                                                                                                                       308.7M
                  Zinc and Lead (lbs)

                                                                             2% YoY decrease in lead                                           +50% YoY increase in lead                                                 +37% YoY increase in lead
                                                 196.5M

                                                                   193.2M

                                                                                                           305.0M

                                                                                                                                                                                     182.2M

                                                                                                                                                                                                                143.9M
                                                                                                                                      216.5M

                                                                                                                                                                                              105.3M
                                                                                                                    143.9M

                                                                            • Minimal infill drilling                                          • Growth of measured and                                                  • Successful resource
                                                                              conducted at Silvertip                                             indicated resource base                                                   expansion drilling
                                                                              during the year                                                    at Silvertip                                                              program at Silvertip
                                                                                                                                               • ~628K tons of M&I                                                       • ~476K tons of inferred
                                                                                                                                                 resource added at                                                         resource added at
                                         2019              2020                                             2019              2020               Silvertip                            2019              2020               Silvertip
          Note: See slides in appendix for additional information related to mineral reserves and resources. Canadian investors should refer to the applicable technical reports on file at www.sedar.com.                             NYSE: CDE     18

JC 2016
Recent Balance Sheet Enhancements
               Coeur has recently taken prudent steps to bolster its balance sheet, helping to
               strengthen the Company’s financial flexibility ahead of the next two years of
               capital intensity

                                             •      Increased aggregate capacity of revolving credit facility from $250 million to $300 million
                                                     −       Fully repaid remaining outstanding borrowings1
                                                     −       Expects to extend the maturity from October 2022 to March 2025

                                             •      Issued $375 million 5.125% senior notes due 2029
                                                     −       Lowered interest rate and extended maturity vis-à-vis 5.875% senior notes due 2024
                                                     −       Opportunistically upsized offering to further bolster cash position to help underpin funding
                                                             for key growth projects

                                             •      Recently upgraded by Moody’s from B3 to B22

                                             •      Significantly improved cash position (67% higher year-over-year)

          (1) As of December 31, 2020.                                                                                                           NYSE: CDE   19
          (2) Reflects Corporate Family Rating. 5.125% senior notes due 2029 rated B3.

JC 2016
Balance Sheet and Hedging Summary
               Liquidity Profile1                                                                                                  Debt and Leverage Summary1,2,3
               ($M)                                                                                                                ($M)

                                                                                                      $126.7       $484.5                                                                           Dec. 31, 2020
                                                                                                                                                                                       Dec. 31,
                                                                                                                                                                                        2019 Reported          Pro Forma
                                                                            $92.8         $357.8                                      5.875% senior notes due 2024                      $226.9         $227.6 ($227.6)                      $-
                                  $50.0                                                                                               5.125% senior notes due 2029                                -             -        367.0         367.0
                     $250.0                                  $265.0
                                                ($35.0)                                                                               Revolving credit facility                                   -             -                -            -
                                                                                                                                      Capital lease obligations                             68.6           47.9                  -      47.9
                                                                                                                                   TOTAL DEBT                                           $295.5         $275.5           $139.4        $414.9
                                                                                                                                      Cash and cash equivalents                           $55.6          $92.8          $126.7        $219.5
                      Revolver

                                                                            Equivalents

                                                                                          Liquidity
                                                 of Credit

                                                                                                                   Pro Forma
                                                             Availability
                                  Expansion

                                                                                                      Net Change
                      Capacity

                                                  Letters
                                   Revolver

                                                              Revolver

                                                                                                                    Liquidity
                                                                             Cash and

                                                                                            Total

                                                                                                       in Cash
                                                                                                                                   LEVERAGE RATIOS
                                                                                                                                      LTM adjusted EBITDA                               $173.9         $263.4                   $-    $263.4

                                               December 31, 2020                                        Senior Notes
                                                                                                                                      Total debt / LTM adjusted EBITDA                      1.7x           1.0x                  -      1.6x
                                                                                                        Refinancing                   Net debt / LTM adjusted EBITDA                        1.4x           0.7x                  -      0.7x

               Summary of Metal Sales Hedges                                                                                       Snapshot of Metal Sales Hedges
                                                                                                                                                            1Q            2Q             3Q             4Q              Total
                                     • Opportunistically executing hedges to support                                                                       2021          2021           2021           2021             2021         2022
                                       funding of POA 11
                   Strategy                                                                                                             Ounces
                                              − Targeting up to 50% of expected gold                                                                      39,675        39,675         39,675         39,675 158,700 126,000
                                                                                                                                        Hedged
                                                production through 2022

                                     • Zero-cost collar gold hedge                                                                   Avg. Ceiling
                                                                                                                                                          $1,868        $1,868         $1,882         $1,882        $1,875           $2,030
                                                                                                                                       ($/oz)
                                              − No upfront costs
                 Instrument
                                              − “Guarantees” price floor and provides upside
                                                price participation up to a specified ceiling                                         Avg. Floor
                                                                                                                                                          $1,600        $1,600         $1,600         $1,600        $1,600           $1,626
                                                                                                                                       ($/oz)
                 Settlement • Financially, against monthly average LBMA4 pricing

          (1) Pro forma figures reflect adjustments for issuance of $375 million of 5.125% senior notes due 2029, assuming all $230 million outstanding of 5.875% senior notes due 2024 are tendered and purchased by       NYSE: CDE             20
              Coeur. Debt figures presented net of capitalized expenses.
          (2) See non-GAAP reconciliation tables in the appendix to this presentation.
          (3) Net debt equals total debt less cash and cash equivalents.
          (4) London Bullion Market Association.
JC 2016
Looking Ahead: Key Priorities for 2021

          • Maintain focus on rigorous health and safety protocols

          • Steadily increase production and continue executing major construction
             on POA 11 expansion at Rochester

          • Remain committed to a higher-level of exploration investment to drive
             reserve and resource growth

          • Continue evaluating potential expansion and restart of Silvertip; release
             results of updated technical report (later in the year)

          • Allocate capital according to framework, prioritizing investments in
             highest-return growth opportunities

          • Deliver consistent operating and financial results across portfolio

                                                                               NYSE: CDE   21

JC 2016
2021 Guidance1
                Production Outlook
                                                                                                                                                                          Gold (oz)                              Silver (K oz)
                Palmarejo                                                                                                                                          100,000 – 110,000                            6,500 – 7,750
                Rochester                                                                                                                                            22,500 – 32,500                            3,200 – 4,400
                Kensington                                                                                                                                         115,000 – 130,000                                    -
                Wharf                                                                                                                                                85,000 – 95,000                                    -
                Consolidated                                                                                                                                       322,500 – 367,500                           9,700 – 12,150

                CAS Outlook2
                                                                                                                                                                        Gold ($/oz)                              Silver ($/oz)
                Palmarejo (co-product)                                                                                                                                  $710 - $810                            $11.00 - $12.00
                Rochester (co-product)                                                                                                                               $1,180 - $1,330                           $15.00 - $17.00
                Kensington                                                                                                                                           $1,010 - $1,110                                    -
                Wharf (by-product)                                                                                                                                     $960 - $1,060                                    -

                Capital, Exploration and G&A
                ($M)
                Capital Expenditures, Sustaining3                                                                                                                                                        $80 – $100
                Capital Expenditures, Growth                                                                                                                                                            $180 – $225
                Exploration, Expensed                                                                                                                                                                     $46 – $51
                Exploration, Capitalized                                                                                                                                                                  $17 – $21
                General & Administrative Expenses                                                                                                                                                         $37 – $41

          Note: The Company’s guidance figures assume $1,850/oz gold and $24.00/oz silver as well as CAD of 1.27 and MXN of 19.50. Guidance figures exclude the impact of any metal sales or foreign exchange hedges.   NYSE: CDE   22
          (1) Guidance as published by Coeur on February 17, 2021.
          (2) See non-GAAP reconciliation tables in the appendix to this presentation.
          (3) Sustaining capital expenditures exclude capital leases.

JC 2016
2021 Production Guidance Detail1
                                              Operation      Guidance Range     Illustrative Production Profile                          Commentary
                                                                                 ~25%    ~27%    ~25%    ~23%
                                                                                                                  • Higher planned mining and throughput rates to offset
                                             Palmarejo      100,000 – 110,000                                       lower expected gold grades due to the depletion of certain
                                                                                  1Q      2Q      3Q      4Q
                                                                                                                    higher gold grade zones
                                                                                 ~22%    ~25%    ~26%    ~26%     • Expecting fewer tons placed due to the generation of
                                                                                                                    over-liner material for the Stage VI leach pad
                                             Rochester       22,500 – 32,500
                                                                                                                  • Targeting ~35,000 crushed tons per day in 1Q; ~38,000
                  Gold Production (oz)

                                                                                  1Q      2Q      3Q      4Q        crushed tons for the remainder of the year2
                                                                                 ~23%    ~26%    ~27%    ~24%     • Plan to incorporate material from the Eureka and Elmira
                                                                                                                    veins into production profile
                                             Kensington     115,000 – 130,000
                                                                                                                  • Anticipating slightly lower grades from the Kensington
                                                                                  1Q      2Q      3Q      4Q        Main deposit and development ore from Elmira
                                                                                         ~26%    ~29%    ~25%
                                                                                 ~19%
                                                                                                                  • Expecting another strong production year, despite plans
                                             Wharf           85,000 – 95,000
                                                                                                                    to mine more tons as a result of increased strip
                                                                                  1Q      2Q      3Q      4Q

                                                                                 ~22%    ~26%    ~27%    ~24%

                                                                                                                  • Anticipating slightly weaker gold production in 1Q;
                                             Consolidated   322,500 – 367,500
                                                                                                                    however, gold production expected to increase in 2Q
                                                                                  1Q      2Q      3Q      4Q

                                               Operation     Guidance Range     Illustrative Production Profile                          Commentary
                                                                                 ~22%    ~27%    ~27%    ~24%

                                                                                                                  • Higher planned mining and throughput rates
                                             Palmarejo        6,500 – 7,750
                  Silver Production (K oz)

                                                                                                                  • Silver grades expected to be slightly lower in 2021
                                                                                  1Q      2Q      3Q      4Q

                                                                                 ~24%    ~24%    ~26%    ~25%

                                                                                                                  • Expecting lower overall silver grades
                                             Rochester        3,200 – 4,400
                                                                                                                  • See gold production commentary for additional details
                                                                                  1Q      2Q      3Q      4Q

                                                                                 ~23%    ~26%    ~27%    ~25%

                                                                                                                  • Silver production expected to increase in 2Q, following a
                                             Consolidated    9,700 – 12,150
                                                                                                                    slightly weaker anticipated 1Q
                                                                                  1Q      2Q      3Q      4Q

          (1) Guidance as published by Coeur on February 17, 2021.                                                                                                   NYSE: CDE   23
          (2) Crusher throughput targets exclude scheduled downtime.

JC 2016
ESG Highlights

                    NYSE: CDE   24

JC 2016
What Matters to Coeur
          Environmental                             •    Training and Development
          •   Climate Change                        •    Health, Safety & Security
          •   Green House Gas Emissions             Society
          •   Water Stewardship                     •    Investment in Local Communities
          •   Waste Minimization                    •    Indigenous Rights
          •   Biodiversity                          •    Human Rights
          •   Tailings Management                   Governance
          •   Closure Planning                      •    Ethics and Governance
          Social                                    •    Compliance
          Human Capital Management                  •    Anti-Corruption
          •   Fair Employment Practices and Equal
              Opportunity

                                                                                           NYSE: CDE   25

JC 2016
Community Relations & Indigenous Rights
          The Company has the highest regard for the dignity, well-being and rights of
          the communities in which it operates, as well as all of its indigenous partners.
          Coeur is proud of the relationships it has built, the agreements it has in place
          and looks forward to working together with its community partners for years to
          come
                                                           We Pursue a Higher Standard
                 1996

                                  2012
          Berners Bay
           Consortium                             2013
          (Kensington)
                             Chinipas
                           (Palmarejo)                            2017
                                           Palmarejo &
                                           Guazapares                             2021
                                           (Palmarejo)
                                                            Guerra Al
                                                             Tirano
                                          Kaska Nations
                                                           (Palmarejo)
                                            (Silvertip)                   Tahltan Nation
                                                                            (Silvertip)

                                                                                     NYSE: CDE   26

JC 2016
Benefits of Community Agreements
          Coeur’s community agreements lay the foundation for strong partnerships and
          shared benefits between the Company and its community partners

                                           Selected Examples of Key Benefits

                           Preferential                                            Right to Bid
                                                        Scholarships
                              Hiring                                              for Contracts

                                           Business                     Direct
                Training                                                                          Internships
                                          Development                  Payments

                                                                                                           NYSE: CDE   27

JC 2016
Precious Metals Are Coeur to Everyday Life
               Coeur is an important part of the supply chains for gold and silver. Due to their
               unique properties, gold and silver have countless innovative uses that shape
               the way we live today and enable a more sustainable, healthier tomorrow

                                                                                                                            Au
                                       Coeur’s Palmarejo, Rochester, Kensington and Wharf mines produce gold, which is a critical component of:

                         Medical Devices                                              Electronics                                         Electrification Devices             Transportation
                   COVID-19 diagnostic test kits,                              Nanotechnology and touch                                 Batteries and circuit boards    GPS technology and catalytic
                     pacemakers, CAT scan                                          screen monitors                                                                      converters in motor vehicles
                      equipment and others

                                                                                                                            Ag
                                                       Coeur’s Palmarejo and Rochester mines produce silver, which is a critical component of:

                         Medical Devices                                           Renewable Energy                                          Household Items                   Public Health
                    Bandages, pharmaceuticals                                   Photovoltaic cells in solar                             Mirrors, clothing and jewelry    Water purification systems
                   and anti-microbial coating for                                        panels
                            equipment

          Source: Mining Association of Canada, MineralsMakeLife.org, The National Mining Association and The United States Geological Survey (USGS).                                     NYSE: CDE    28

JC 2016
Committed to Diversity and Inclusion
              “The tragic death of George Floyd and other horrific events serve as stark
           reminders that, as a society, much work remains to be done to address racism
           and the conscious and unconscious biases that enable its existence. At Coeur,
           we are committed to fostering diversity and inclusion at our company and in our
                                           communities.”
                                                                                  –Mitchell J. Krebs, President & CEO

          • First and only precious      •   Designed to highlight and   •   Coeur sponsored ‘reading     •   Partnering with National
             metals mining CEO to sign         engage members of the            playoffs’ event for four          Society of Black Engineers
             the CEO ACTION for                military                         consecutive years
             Diversity & Inclusion pledge                                                                    •   Sponsoring Summer
                                          •   Allows service members to •     Expanding partnership to          Engineering Experience for
          • Hosted a Day of                   use the special skills           include: COVID-19                 Kids program
             Understanding in early            developed during their time      response and staff                − Providing learning
             2020                              of service to help make a        diversity training
                                                                                                                    opportunities and
                                               difference at Coeur’s
              − Created platform for                                                                                access to STEM
                                               operations                  •   Hosting "Learn about
                open dialogue and                                                                                   education
                                                                                Geology with Coeur Mining"
                meaningful                • Provided 72 career                 sessions
                conversations on                                                                             •   Partnering with NSBE
                                             opportunities to current
                diversity and inclusion                                         − Students virtually learn        chapters at universities
                                             and former U.S. Military             from Coeur's geologists         throughout the country for
                                             personnel in 2020
          • Planning second Day of                                               about mining as a               virtual career fairs,
             Understanding for April                                              career and explore their        summer internships and
             2021                                                                 own geology kits                apprenticeships
                                                                                                                                  NYSE: CDE    29

JC 2016
COVID-19 Response and Decision-Making Approach
          Coeur’s principal objective to help combat COVID-19 is to safeguard the health,
          safety and well-being of its workforce, their families and the communities
          where the Company operates

                                                                  Guidance from k ey agencies

                                                   U.S. Centers                   Mexican and        Federal,
                                                   for Disease    World Health     Canadian         state and
                                                   Control and    O rganization   public h ealth      local
                                                    Prevention                      officials      authorities

                                                                        Coeur COVID-19
                                                                          Committee

                                                       Safeguarding the health, safety and well-being of
                                                            workforce, families and communities

                                                              Minimizing business interruption

                                                                                                     NYSE: CDE   30

JC 2016
Activities to Protect People and Places During COVID-19

                      •
                         Social distancing and enhanced cleaning

                      •
                         Multilayered testing strategy

                      •
                         Traditional contact tracing complemented by wearable technology

                      •
                         Remote work for office employees

                      •
                         Only essential business travel

             People   •
                         Pre-work and on-site health screenings

                      •
                         Regular CEO and executive communications; talking points for local leaders

                      •
                         Sick leave policies cover bonus payments to camp employees affected by
                          extended schedules and quarantine
                      •
                         Partner with communities in communication and response efforts

                      •
                         Greatly reduced travel, limiting community risk of exposure

                      •
                         Implementing company-provided testing and contact tracing organization-wide

                      •
                         Donations, including PPE and supplies for vulnerable community members
             Places
                      •
                         Palmarejo clinic open to the public

                                                                                               NYSE: CDE   31

JC 2016
Industry-Leading Safety Performance
            Coeur has held the National Mining Association CORESafety certification since 2017

               Coeur’s injury frequency rate remains significantly below industry averages

               Lost-Time Injury Frequency Rate                                                                                      Total Reportable Injury Frequency Rate
                     Industry average1                                                                                                   Industry average1
                     Coeur Mining2                                                                                                       Coeur Mining2

                                                                                                                                      2.34
                                                                                                                                                  2.23        2.23
                                                                                                                                                                          2.02        1.93
                                                                                                                                      2.27                                                                     1.81
                              1.67        1.64                                                                                                                                                   1.73   1.68
                  1.53                                                                                                                                                                                                1.64
                                                      1.41                                                                                            1.58
                                                                  1.37                                 1.34
                                                                              1.25         1.16                    1.20
                                                                                                                                                                          1.04                   1.03   0.96
                  0.74                                                                                                                                          0.60                                           0.85
                                                                                                                                                                                      0.69                            0.74
                                                      0.43                    0.42
                                0.23 0.26                                                 0.33         0.30        0.25
                                                                  0.20

                                                                                                                           3                                                                                                 3
                 2012 2013 2014 2015 2016 2017 2018 2019 2020                                                                        2012 2013 2014 2015 2016 2017 2018 2019 2020
          (1) Source(s): U.S. Department of Labor Mine Safety and Health Administration (MSHA): Metal Operators Mine Safety and Health Statistics. Injuries per 200,000 employee-hours worked.                   NYSE: CDE       32
          (2) Includes both Coeur employees and contract workers.
          (3) MSHA data January to September 2020 (preliminary).

JC 2016
Demonstrating Our Commitment
          Governance Practices
           Board Refreshment and Succession Planning
            − Two new independent directors added to the Board in February 2018 and four directors – 50% of independent directors – added in last eight years
                     • Also added a new independent director in early 2019, who recently had to resign in connection with a new professional position that did
                       not allow outside board service
            − Active Board succession planning and refreshment
           Robust Board and Committee Evaluations
            − Annual evaluations promote Board and Board committee effectiveness
            − Chairman’s one-on-one meetings with each director promote candor, effectiveness and accountability
           No Related Party Transactions
            − No related person transactions with directors or executive officers
           Board-Level Risk Oversight
            − The Board and Board committees take an active role in the Company’s risk oversight and risk management processes
           Active Stockholder Engagement
            − During 2020, Coeur continued its proactive and robust stockholder outreach efforts on governance, executive compensation and other matters,
               contacting all institutional stockholders of 0.15% or more
           Clawback Policy
            − Added officer misconduct to the scope of clawback policy in addition to financial restatement-driven events
          Stockholder Rights
      •  Annual Election of Directors
          − All directors are elected annually for one-year terms
      • Majority Voting for Director Elections
          − Majority voting in uncontested director elections with a resignation policy
      • Stockholder Right to Call Special Meetings
          − Stockholders owning 20% or more of Coeur’s common stock have the right to call a special meeting of the Stockholders
      • No Poison Pill
          − Coeur does not have a poison pill or similar anti-takeover defenses in place
      • Proxy Access
          − Proactively adopted proxy access in March 2019, which allows stockholders who have satisfied specified requirements under the Company’s
            Bylaws to include director nominees in the Company’s proxy statement and form of proxy (greater of two nominees or 20% Board seats)

                                                                                                                                               NYSE: CDE   33

JC 2016
Diverse Board Led by Independent Chair

          •
             Eight out of nine Directors
              are independent (all except
              CEO); all four main
              committees comprised of
              independent directors only

          •
             Two directors elected in
              February 2018 having skills
              and experiences that
              complement other directors

          •
             Balance of newer and
              longer serving directors; no
              mandatory retirement age

          •
             Half of independent
              directors are diverse
              (gender or ethnicity),
              contributing to a variety of
              viewpoints

                                                   NYSE: CDE   34

JC 2016
Appendix

              NYSE: CDE   35

JC 2016
Palmarejo
                 Ownership                   100%
                 Claims                      67,296 net acres
                 Type                        Underground
                                             Crushing, grinding, flotation, CIL,
                 Processing
                                             Merrill-Crowe precipitation, refining
                 Metals                      Silver and gold doré
                 Mine life                   ~8 years
                                                                                                                                                                                                    Palmarejo
                                                                                                                                                                                                    Chihuahua, Northern Mexico

                Share of Companywide 2021E1 Production                                                                                   2016 & 2020 Reserves & Resources2
                                                                                                                                         P&P Reserves                           M&I Resources                        Inferred Resources

                                                                                                                                                                    59.4
                                                                                                                                                             849

                                                                                                                                                                                                             51.1
                Gold                                                     Silver

                                                                                                                                                                                                                                          280
                                                                                                                                                                                                                                20.5
                                                                                                                                                                                                     613

                                                                                                                                                                                                                          258
                                                                                                                                            592

                                                                                                                                                   40.8

                                                                                                                                                                                                                                                14.5
                                                  30%

                              345,000                                                     10.9M

                                                                                                                                                                                          17.3
                                                                                                                                                                                    237
                                       oz                                                       oz
                                                                                                             65%

                                                                                                                                              2016             2020                  2016             2020                 2016            2020

                                                                                                                                                                           Gold (K oz)                    Silver (M oz)

          (1) Based on midpoint of guidance as published by Coeur on February 17, 2021.                                                                                                                                                NYSE: CDE       36
          (2) See slides in appendix for additional information related to mineral reserves and resources. Canadian investors should refer to the applicable technical report on file at www.sedar.com.

JC 2016
Palmarejo (cont.)
                Production and Cost Performance                                                                  Operating Cash Flow and Capital Expenditures
                                                                                                                 ($M)
                                                                                                                    Operating cash flow

                                                                    $686
                                                                                                                    Capital expenditures
                                               $645                                     $10.06                                                                     $49.7
                          $622                                                                         $9.61
                                                                                                                                                                                    $43.2
                                                                                                                    $41.4
                                                                                         $602
                         $8.79
                                              $8.37                 $8.13                            $542
                             2,029                                                                  35                                $28.9
                                             32 1,835
                        29                                                             29 1,784          1,783

                                                                                                                           $8.6                                                          $8.9
                                                                                                                                            $7.1
                                                                  15 867                                                                                 $4.5             $5.0

                                                                                                                                                    ($3.5)

                       4Q 2019               1Q 2020              2Q 2020              3Q 2020      4Q 2020             4Q 2019        1Q 2020       2Q 2020           3Q 2020       4Q 2020

                                       Gold production (K oz)                     Adj. CAS per AuOz1
                                       Silver production (K oz)                   Adj. CAS per AgOz1

                Costs Per Ton                                                                                                4Q 2019          1Q 2020        2Q 2020      3Q 2020       4Q 2020
                ($)
                                                    UG tons mined                                                                 475,595      491,080        274,126       475,939         519,726

                                                    UG mining costs per UG ton mined                                                 $35           $35            $32            $36            $38

                                                    Processing costs per ton processed2                                              $27           $24            $21            $25            $24

                                                    G&A per ton processed3                                                           $10           $10            $12             $7             $5

          (1) See applicable non-GAAP reconciliation tables in the appendix to this presentation.                                                                                      NYSE: CDE      37
          (2) Excludes third-party refining charges.
          (3) Excludes management fee allocated from corporate.

JC 2016
Rochester
                 Ownership                   100%
                 Claims                      17,044 net acres
                 Type                        Open pit and heap leach
                                             Crushing, dump heap leaching,
                 Processing
                                             Merrill-Crowe precipitation, refining
                 Metals                      Silver and gold doré
                                                                                                                                                    Rochester
                 Mine life                   ~18 years                                                                                              Nevada, U.S.

                Share of Companywide 2021E1 Production                                                                                   2016 & 2020 Reserves & Resources2
                                                                                                                                         P&P Reserves  M&I Resources  Inferred Resources

                                                                                                                                                             1,219

                                                                                                                                                                     185.5
                Gold                                                     Silver

                                                                                                                                                                                                            71.4

                                                                                                                                                                                                                                          409

                                                                                                                                                                                                                                                61.7
                                                                                                                                                                                                     489
                                                                                                                                            803

                                                                                                                                                   112.0
                                                                               35%

                                                                                                                                                                                           38.9
                                                                                          10.9M

                                                                                                                                                                                                                                35.6
                               345,000

                                                                                                                                                                                                                          178
                                                                                                                                                                                    238
                                       oz                                                       oz
                                                    8%

                                                                                                                                              2016             2020                  2016             2020                 2016            2020
                                                                                                                                                                             Gold (K oz)                  Silver (M oz)

          (1) Based on midpoint of guidance as published by Coeur on February 17, 2021.                                                                                                                                                NYSE: CDE       38
          (2) See slides in appendix for additional information related to mineral reserves and resources. Canadian investors should refer to the applicable technical report on file at www.sedar.com.

JC 2016
Rochester (cont.)
                Production and Cost Performance                                                                  Operating Cash Flow and Capital Expenditures
                                                                                                                 ($M)

                                                                                                     $1,537         Operating cash flow                                                                $16.8
                                                                    $1,481
                                              $1,359                                                                Capital expenditures

                         $1,142                                                          $1,148
                                                                                                     $20.18                                                                          $9.8
                                              $14.38                $13.75
                         $13.25                                                                                         $6.9
                                                                                                                                                 $5.1              $5.8
                                                                                         $14.98                                $5.0                                                             $4.7
                                                                                                                                                                              $2.1

                                                                                                    1,020
                        848
                                             687                  728                  740
                                11                                                                          10
                                                      6                                         6                                                         ($5.6)
                                                                           5

                                                                                                                                        ($9.3)
                        4Q 2019              1Q 2020               2Q 2020              3Q 2020      4Q 2020            4Q 2019          1Q 2020            2Q 2020           3Q 2020               4Q 2020

                                        Silver production (K oz)                   Adj. CAS per AgOz1
                                        Gold production (K oz)                     Adj. CAS per AuOz1

                Costs Per Ton                                                                                                   4Q 2019           1Q 2020          2Q 2020        3Q 2020             4Q 2020
                ($)                                 Ore tons mined                                                              2,574,343        3,512,239      5,769,097         4,746,086           4,776,904

                                                    Strip Ratio                                                                       0.4:1             0.6:1             0.1:1             0.1:1         0.0:1

                                                    Mining costs per ton mined                                                        $2.27             $1.47             $1.29         $1.93             $2.17

                                                    Processing costs per ton processed2                                               $4.57             $3.57             $3.30         $3.03             $4.01

                                                    G&A per ton processed3                                                            $1.36             $1.25             $0.98         $0.95             $1.07

          (1) See applicable non-GAAP reconciliation tables in the appendix to this presentation.                                                                                                   NYSE: CDE     39
          (2) Excludes third-party refining charges.
          (3) Excludes management fee allocated from corporate.

JC 2016
Kensington
                 Ownership                   100%
                 Claims                      12,336 net acres
                 Type                        Underground
                 Processing
                                             Crushing, grinding, flotation                                                                                        Kensington
                                             processing                                                                                                           Alaska, U.S.

                 Metals                      Gold concentrate
                 Mine life                   ~3 years

                Share of Companywide 2021E1 Production                                                                                   2016 & 2020 Reserves & Resources2
                         Gold                                                                                                            P&P Reserves                           M&I Resources                   Inferred Resources

                                                                                                                                                                                       871

                                                                                                                                                                                                          830
                                                                                                                                                497
                                                        345,000

                                                                                                                                                                                                                   436

                                                                                                                                                                                                                              394
                                                                                                                                                                 331
                                                                oz

                                                     36%
                                                                                                                                              2016             2020                  2016             2020        2016       2020

                                                                                                                                                                                             Gold (K oz)
          (1) Based on midpoint of guidance as published by Coeur on February 17, 2021.                                                                                                                                  NYSE: CDE   40
          (2) See slides in appendix for additional information related to mineral reserves and resources. Canadian investors should refer to the applicable technical report on file at www.sedar.com.

JC 2016
Kensington (cont.)
                  Production and Cost Performance                                                                                          Operating Cash Flow and Capital Expenditures
                                                                                                                                           ($M)

                                                                                                                                              Operating cash flow2
                                                                                           $1,128                                                                                                            $25.9
                                                                                                                                              Capital expenditures
                            $976
                                                 $928                  $934                                      $919
                                                                                                                                                                              $20.8
                                                                                                                                                                $18.9

                                                   32                   33                                         33                         $15.2
                              30                                                                                                                                                               $14.2
                                                                                              27

                                                                                                                                                                                                   $5.3             $5.8
                                                                                                                                                     $4.3             $4.8
                                                                                                                                                                                     $3.9

                          4Q 2019              1Q 2020              2Q 2020               3Q 2020              4Q 2020                            4Q 2019        1Q 2020          2Q 2020      3Q 2020           4Q 2020

                                        Gold production (K oz)                      Adj. CAS per AuOz1

                  Costs Per Ton                                                                                                                        4Q 2019          1Q 2020      2Q 2020      3Q 2020          4Q 2020
                  ($)                                   Ore tons mined                                                                                      167,499      166,909       168,435         162,572      177,059

                                                        Mining costs per ton mined                                                                             $65           $64            $72           $73              $63

                                                        Processing costs per ton processed3                                                                    $43           $44            $40           $50              $41

                                                        G&A per ton processed4                                                                                 $43           $46            $40           $41              $43

          (1)   See applicable non-GAAP reconciliation tables in the appendix to this presentation.                                                                                                              NYSE: CDE       41
          (2)   Excludes impact of prepayments.
          (3)   Excludes third-party smelting charges, which are reflected in average realized selling prices of concentrate production.
          (4)   Excludes management fee allocated from corporate.

JC 2016
Wharf
                 Ownership                   100%
                 Claims                      7,852 net acres
                 Type                        Open pit and heap leach
                                             Crushing, “on-off” heap leaching,
                 Processing                  spent ore neutralization, carbon
                                             absorption/desorption                                                                                                                                        Wharf
                                                                                                                                                                                                          South Dakota, U.S.
                 Metals                      Electrolytic cathodic sludge
                 Mine life                   ~6 years

                Share of Companywide 2021E1 Production                                                                                   2016 & 2020 Reserves & Resources2
                                                                                                                                         P&P Reserves  M&I Resources  Inferred Resources
                         Gold

                                                                                                                                                                                                           605

                                                                                                                                                                                                                       108
                                                                                                                                                                 720
                                            26%

                                                                                                                                                639

                                                                                                                                                                                                                                    67
                                                        345,000
                                                                oz

                                                                                                                                                                                       128
                                                                                                                                              2016             2020                  2016                 2020        2016         2020
                                                                                                                                                                                             Gold (K oz)

          (1) Based on midpoint of guidance as published by Coeur on February 17, 2021.                                                                                                                                        NYSE: CDE   42
          (2) See slides in appendix for additional information related to mineral reserves and resources. Canadian investors should refer to the applicable technical report on file at www.sedar.com.

JC 2016
Wharf (cont.)
                Production and Cost Performance                                                                Operating Cash Flow and Capital Expenditures
                                                                                                               ($M)
                                                                                                                  Operating cash flow
                                              $1,090                                                              Capital expenditures                          $39.1

                                                                                                        $954

                          $802                                       $804                 $804

                                                                                            33

                            26                                         25                                                                       $19.1
                                                                                                                  $17.0
                                                                                                         19                                                                     $14.1
                                                 16

                                                                                                                                  $2.6
                                                                                                                         $0.8         $0.4            $0.3           $0.5              $1.2

                        4Q 2019              1Q 2020               2Q 2020              3Q 2020     4Q 2020           4Q 2019      1Q 2020         2Q 2020       3Q 2020            4Q 2020

                                        Gold production (K oz)                     Adj. CAS per AuOz1

                Costs Per Ton                                                                                              4Q 2019       1Q 2020      2Q 2020        3Q 2020          4Q 2020
                ($)
                                                    Ore tons mined                                                         1,169,344      921,897     1,376,237      1,320,542        1,327,647

                                                    Strip Ratio                                                                 1.1:1        1.8:1           0.9:1          1.5:1         1.9:1

                                                    Mining costs per ton mined                                                  $3.82        $4.09           $3.93      $3.38             $2.82

                                                    Pad unload costs per ton mined                                              $0.86        $0.59           $1.11      $0.68             $0.45

                                                    Total mining costs per ton mined (incl. pad unload)                         $4.67        $4.67           $5.04      $4.05             $3.25

                                                    Processing costs per ton processed2                                         $3.01        $3.36           $2.33      $3.35             $3.94

                                                    G&A per ton processed3                                                      $2.59        $3.49           $1.84      $2.29             $2.98

          (1) See applicable non-GAAP reconciliation tables in the appendix to this presentation.                                                                                   NYSE: CDE     43
          (2) Excludes third-party refining charges.
          (3) Excludes management fee allocated from corporate.

JC 2016
Silvertip
                 Ownership                   100%
                 Claims                      98,834 net acres
                 Type                        Underground                                                                                                                      Silvertip
                                                                                                                                                                              British Columbia, Canada
                                             Crushing, grinding, flotation
                 Processing
                                             processing, concentrate thickening
                 Metals                      Lead concentrate, zinc concentrate
                 Mine life                   ~5 years

                2019 & 2020 Reserves & Resources1
                P&P Reserves                                                                    M&I Resources                                                                   Inferred Resources

                                                                                                                                                     442.1
                                                                                                                                           17.4

                                                                                                                                                                                                                          308.7
                                                                                                                 305.0
                       15.0

                                                                    296.1
                                 295.4

                                                          14.6

                                                                                                                                                                                                                  12.0
                                                                                                       11.6

                                                                                                                                                               216.5
                                          196.5

                                                                              193.2

                                                                                                                                                                                                 182.2
                                                                                                                           143.9

                                                                                                                                                                                                                                  143.9
                                                                                                                                                                                       8.2

                                                                                                                                                                                                          105.3
                               2019                               2020                                      2019                                   2020                                        2019                      2020
                                                                                                   Silver (M oz)                   Zinc (M lb)         Lead (M lb)

          (1) See slides in appendix for additional information related to mineral reserves and resources. Canadian investors should refer to the applicable technical report on file at www.sedar.com.                    NYSE: CDE      44

JC 2016
Non-GAAP Reconciliations

                              NYSE: CDE   45

JC 2016
Non-GAAP to U.S. GAAP Reconciliation for Guidance
          Unaudited                                              Costs Applicable to Sales Guidance for 2021
          ($ thousands, except metal sales and per ounce amounts)                          Palmarejo         Rochester         Kensington           Wharf
          Costs applicable to sales, including amortization (U.S. GAAP)                         $196,255          $105,557          $188,349             $99,746
          Amortization                                                                            (39,208)          (15,899)          (59,756)           (11,524)
          Reported costs applicable to sales                                                    $157,047            $89,658         $128,593             $88,222
          By-product credit                                                                              -                 -                 -              (2,255)
          Adjusted costs applicable to sales                                                    $157,047            $89,658         $128,593             $85,967

          Metal Sales
          Gold ounces                                                                             107,900            27,200           127,000               89,000
          Silver ounces                                                                         7,128,000         3,807,000                                 93,000

          Revenue Split
          Gold                                                                                         49%               36%            100%                 100%
          Silver                                                                                       51%               64%

          Costs applicable to sales
          Gold ($/oz)                                                                         $710 - $810    $1,180 - $1,330   $1,010 - $1,110      $960 - $1,060
          Silver ($/oz)                                                                    $11.00 - $12.00   $15.00- $17.00

                                                                                                                                                 NYSE: CDE      46

JC 2016
Non-GAAP to U.S. GAAP Reconciliation
                                                                                Costs Applicable to Sales
          Unaudited                                                           12 months ended December 31, 2020
          ($ thousands, except metal sales, per ounce or per pound amounts)          Palmarejo       Rochester       Kensington       Wharf          Silvertip         Total
          Costs applicable to sales, including amortization (U.S. GAAP)                 $170,077        $100,418         $171,204      $102,108           $26,580       $570,387
          Amortization                                                                   (44,873)        (14,306)         (49,477)      (12,473)           (8,923)      (130,052)
          Reported costs applicable to sales                                            $125,204         $86,112         $121,727       $89,635           $17,657       $440,335
          Inventory adjustments                                                             (158)           (447)            (438)        (3,424)                 -        (4,467)
          By-product credit                                                                      -               -                -       (2,503)                 -        (2,503)
          Adjusted costs applicable to sales                                            $125,046         $85,665         $121,289       $83,708           $17,657       $433,365

          Metal Sales
          Gold ounces                                                                    110,822          26,257          124,793        94,379                           356,251
          Silver ounces                                                                 6,301,516      3,054,139                        113,790           158,984       9,628,429
          Zinc pounds                                                                                                                                  3,203,446        3,203,446
          Lead pounds                                                                                                                                  2,453,485        2,453,485

          Revenue Split
          Gold                                                                               54%             42%             100%             100%
          Silver                                                                             46%             58%                                                 NM
          Zinc                                                                                                                                                   NM
          Lead                                                                                                                                                   NM

          Adjusted costs applicable to sales
          Gold ($/oz)                                                                       $609           $1,370            $972             $887
          Silver ($/oz)                                                                     $9.13          $16.27                                                NM
          Zinc ($/lb)                                                                                                                                            NM
          Lead ($/lb)                                                                                                                                            NM

          Note: “NM” means not meaningful.                                                                                                                        NYSE: CDE    47

JC 2016
Non-GAAP to U.S. GAAP Reconciliation (cont.)
                                                                           Costs Applicable to Sales
          Unaudited                                                       3 months ended December 31, 2020
          ($ thousands, except metal sales and per ounce amounts)               Palmarejo          Rochester        Kensington       Wharf           Silvertip        Total
          Costs applicable to sales, including amortization (U.S. GAAP)             $48,672            $36,828           $42,486       $24,300                   -     $152,286
          Amortization                                                              (12,516)            (5,112)          (13,179)       (2,848)                  -       (33,655)
          Reported costs applicable to sales                                        $36,156            $31,716           $29,307       $21,452                   -     $118,631
          Inventory adjustments                                                             (24)               24            (56)             (49)               -            (105)
          By-product credit                                                                    -                -                -           (864)               -            (864)
          Adjusted costs applicable to sales                                        $36,132            $31,740           $29,251       $20,539                   -     $117,662

          Metal Sales
          Gold ounces                                                                 35,359              8,672           31,830        21,539                            97,400
          Silver ounces                                                            1,766,714           912,335                          35,794                   -     2,714,843

          Revenue Split
          Gold                                                                          53%                42%              100%             100%
          Silver                                                                        47%                58%                                                   -

          Adjusted costs applicable to sales
          Gold ($/oz)                                                                  $542              $1,537             $919             $954
          Silver ($/oz)                                                                $9.61             $20.18                                                  -

                                                                                                                                                                 NYSE: CDE     48

JC 2016
Non-GAAP to U.S. GAAP Reconciliation (cont.)
                                                                            Costs Applicable to Sales
          Unaudited                                                       3 months ended September 30, 2020
          ($ thousands, except metal sales and per ounce amounts)                Palmarejo       Rochester         Kensington       Wharf           Silvertip        Total
          Costs applicable to sales, including amortization (U.S. GAAP)              $46,163         $22,382            $43,053       $31,887             $1,185      $144,670
          Amortization                                                               (11,912)         (3,278)           (11,523)       (4,000)            (1,185)       (31,898)
          Reported costs applicable to sales                                         $34,251         $19,104            $31,530       $27,887                   -     $112,772
          Inventory adjustments                                                         (100)                517           (141)             (46)               -            230
          By-product credit                                                                  -                 -                -       (1,007)                 -        (1,007)
          Adjusted costs applicable to sales                                         $34,151         $19,621            $31,389       $26,834                   -     $111,995

          Metal Sales
          Gold ounces                                                                  27,252           6,834            27,815        33,382                            95,283
          Silver ounces                                                             1,765,371        785,887                           40,521                   -     2,591,779

          Revenue Split
          Gold                                                                           48%             40%               100%             100%
          Silver                                                                         52%             60%                                                    -

          Adjusted costs applicable to sales
          Gold ($/oz)                                                                   $602           $1,148            $1,128             $804
          Silver ($/oz)                                                                $10.06          $14.98                                                   -

                                                                                                                                                                NYSE: CDE    49

JC 2016
Non-GAAP to U.S. GAAP Reconciliation (cont.)
                                                                          Costs Applicable to Sales
          Unaudited                                                       3 months ended June 30, 2020
          ($ thousands, except metal sales and per ounce amounts)             Palmarejo       Rochester       Kensington       Wharf           Silvertip        Total
          Costs applicable to sales, including amortization (U.S. GAAP)           $26,095         $21,348          $43,235       $25,653             $1,231      $117,562
          Amortization                                                              (7,270)        (3,012)         (12,853)       (3,181)            (1,231)       (27,547)
          Reported costs applicable to sales                                      $18,825         $18,336          $30,382       $22,472                   -       $90,015
          Inventory adjustments                                                       (106)          (566)            (139)        (3,304)                 -        (4,115)
          By-product credit                                                               -               -                -           (385)               -            (385)
          Adjusted costs applicable to sales                                      $18,719         $17,770          $30,243       $18,783                   -       $85,515

          Metal Sales
          Gold ounces                                                               16,924           5,278          32,367        23,364                            77,933
          Silver ounces                                                           874,642         723,679                         22,707                   -     1,621,028

          Revenue Split
          Gold                                                                         62%            44%             100%             100%
          Silver                                                                       38%            56%                                                  -

          Adjusted costs applicable to sales
          Gold ($/oz)                                                                 $686          $1,481            $934             $804
          Silver ($/oz)                                                              $8.13          $13.75                                                 -

                                                                                                                                                           NYSE: CDE     50

JC 2016
Non-GAAP to U.S. GAAP Reconciliation (cont.)
                                                                               Costs Applicable to Sales
          Unaudited                                                            3 months ended March 31, 2020
          ($ thousands, except metal sales, per ounce and per pound amounts)       Palmarejo        Rochester       Kensington       Wharf           Silvertip          Total
          Costs applicable to sales, including amortization (U.S. GAAP)                $49,149          $19,860          $42,429       $20,267            $23,002        $154,707
          Amortization                                                                 (13,175)          (2,904)         (11,922)       (2,444)            (5,345)         (35,790)
          Reported costs applicable to sales                                           $35,974          $16,956          $30,507       $17,823            $17,657        $118,917
          Inventory adjustments                                                                73          (422)            (101)             (25)        (10,381)         (10,856)
          By-product credit                                                                     -               -                -           (248)                 -            (248)
          Adjusted costs applicable to sales                                           $36,047          $16,534          $30,406       $17,550             $7,276        $107,813

          Metal Sales
          Gold ounces                                                                    31,287            5,473          32,781        16,094                              85,635
          Silver ounces                                                               1,894,789         632,237                         14,768            158,984        2,700,778
          Zinc pounds                                                                                                                                  3,203,446         3,203,446
          Lead pounds                                                                                                                                  2,453,485         2,453,485

          Revenue Split
          Gold                                                                             56%              45%             100%             100%
          Silver                                                                           44%              55%                                                  26%
          Zinc                                                                                                                                                   48%
          Lead                                                                                                                                                   26%

          Adjusted costs applicable to sales
          Gold ($/oz)                                                                     $645            $1,359            $928         $1,090
          Silver ($/oz)                                                                   $8.37           $14.38                                           $11.79
          Zinc ($/lb)                                                                                                                                        $1.12
          Lead ($/lb)                                                                                                                                        $0.74

                                                                                                                                                                   NYSE: CDE     51

JC 2016
Non-GAAP to U.S. GAAP Reconciliation (cont.)
                                                                               Costs Applicable to Sales
          Unaudited                                                        12 months ended December 31, 2019
          ($ thousands, except metal sales, per ounce and per pound amounts)       Palmarejo       Rochester       Kensington       Wharf          Silvertip          Total
          Costs applicable to sales, including amortization (U.S. GAAP)               $201,306        $118,246         $170,194       $92,969         $145,496         $728,211
          Amortization                                                                 (59,379)        (18,041)         (50,592)      (12,280)          (36,738)       (177,030)
          Reported costs applicable to sales                                          $141,927        $100,205         $119,602       $80,689         $108,758         $551,181
          Inventory adjustments                                                            (344)         (4,625)           (913)        (3,617)         (64,610)         (74,109)
          By-product credit                                                                    -               -                -       (1,072)                  -        (1,072)
          Adjusted costs applicable to sales                                          $141,583         $95,580         $118,689       $76,000           $44,148        $476,000

          Metal Sales
          Gold ounces                                                                  116,104           36,052         130,495         84,999                           367,650
          Silver ounces                                                               6,841,380       3,844,556                         64,161       1,164,470        11,914,567
          Zinc pounds                                                                                                                               18,154,521        18,154,521
          Lead pounds                                                                                                                               16,487,847        16,487,847

          Revenue Split
          Gold                                                                             56%             45%             100%             100%
          Silver                                                                           44%             55%                                                 34%
          Zinc                                                                                                                                                 39%
          Lead                                                                                                                                                 27%

          Adjusted costs applicable to sales
          Gold ($/oz)                                                                     $683           $1,193            $910             $894
          Silver ($/oz)                                                                   $9.11          $13.67                                          $12.89
          Zinc ($/lb)                                                                                                                                      $0.95
          Lead ($/lb)                                                                                                                                      $0.72

                                                                                                                                                                 NYSE: CDE    52

JC 2016
You can also read