WP/19/249 Bridging the Mobile Digital Divide in Sub-Saharan Africa: Costing under Demographic Change and Urbanization
←
→
Page content transcription
If your browser does not render page correctly, please read the page content below
WP/19/249

Bridging the Mobile Digital Divide in Sub-Saharan Africa:
 Costing under Demographic Change and Urbanization

 by C. Emre Alper and Michal Miktus

 IMF Working Papers describe research in progress by the author(s) and are published
 to elicit comments and to encourage debate. The views expressed in IMF Working Papers
 are those of the author(s) and do not necessarily represent the views of the IMF, its Executive
 Board, or IMF management.
© 2019 International Monetary Fund 2 WP/19/249

 IMF Working Paper

 African Department

 Bridging the Mobile Digital Divide in Sub-Saharan Africa

 Costing under Demographic Change and Urbanization 1

 Prepared by C. Emre Alper and Michal Miktus

 Authorized for distribution by Benedict Clements

 November 2019

 IMF Working Papers describe research in progress by the author(s) and are published to
 elicit comments and to encourage debate. The views expressed in IMF Working Papers are those
 of the author(s) and do not necessarily represent the views of the IMF, its Executive Board, or IMF
 management.

 Abstract

Digital connectivity, including through the modern cellular network technologies, is expected to play a
key role for the Future of Work in sub-Saharan Africa (SSA). We estimate the cost of introducing a
full-scale 4G network by 2025 in SSA and an operable 5G network by 2040. We adapt the costing
model of Lombardo (2019) by accounting for the significant demographic transformation and rapid
urbanization in SSA. We use the WorldPop and GADM databases and the UN’s medium-variant
population projections to project the population densities at the highest level of administrative division
for each SSA country in 2025 and 2040. For full 4G connectivity, the required capital and operational
costs stands approximately at US$14 billion by 2025 and for 5G connectivity, costs amount to
US$57 billion in 2040, conditional on having the 4G in place by 2025. These costs roughly translate to
8.4 percent of annual subscriber income, on a median basis, by 2025 for 4G and 4.9 percent of
subscriber income by 2040 for 5G. Having the infrastructure in place is not sufficient to bridge the
mobile Digital Divide. In addition, policies are needed to address affordability and knowledge gaps.
JEL Classification Numbers: O33, J11

Keywords: Digitalization, 5G cellular network, Demographics, Urbanization

Authors’ e-mail addresses: EAlper@imf.org, MMiktus@imf.org

1
 We wish to express their gratitude to Ben Clements, Xavier S. Decoster, Jean Phillippe Gillet, Frederico Lima,
Marcello Lombardo, Edward J. Oughton, Laure Redifer, Axel Schimmelpfennig, Murat Yavuz, Harold Zavarce,
and participants at an IMF seminar on August 28, 2019 for useful comments and suggestions.
3

 I. INTRODUCTION

1. Improving of digital connectivity is emerging as a crucial policy area in the context
of demographic expansion and rapid urbanization in SSA. To create a sufficient number
of jobs for its booming population, SSA has to fully exploit the opportunities from the Fourth
Industrial Revolution, by bridging what has been termed the global Digital Divide. 2 Empirical
evidence suggests that if there is an adequate digital infrastructure and a supportive business
environment, new forms of business will flourish, providing employment opportunities for the
educated as well as the less educated. 3 At the same time, changes in technology—along with
climate change and global economic integration—will have an important bearing on growth
and employment (IMF, 2018). In this light, improving digital connectivity, including its mobile
component, is a key policy area to promote job creation and improve growth outcomes.

2. 4G and 5G technologies are revolutionary in terms of creating new economic and
social opportunities. Along with Artificial Intelligence, the advance of 4G and 5G is regarded
as a field of innovation, enabling smarter societies (International Telecommunication Union
(ITU), 2018). The introduction of Fifth Generation networks is expected to supercharge
wireless speeds, power a surge in the Internet of Things (IoT) and usher in a new area of
technological capacities. Harnessing the potential of technology and the data economy could
help support meeting the UN’s Sustainable Development Goals in Africa, from assisting
development and accelerating prosperity to ending poverty. By supporting advanced protocols,
new users, modern devices, and novel applications, it further promises an open platform for
information sharing to anyone and anything, anytime and anywhere (El Hattachi and Erfanian,
2015). Moreover, 4G and 5G are expected to serve to bridge the Digital Divide, with
smartphones serving as a leapfrog technology to connect with the online world.

3. Policy action is needed to reap the benefits from 5G technology to achieve higher
productivity and inclusive growth. Due to high upfront costs and relatively poor returns on
investment, private mobile telecommunications operators frequently lack the financial
incentives to operate in sparsely populated areas where broadband infrastructure is not in place.
In the absence of any government policy action, only urban areas may be upgraded to new
technologies, resulting in a plethora of underserved areas with low connectivity, inferior
quality of service, and higher prices. Hence, widespread implementation of 4G and 5G cellular
networks requires collaboration between the public and private sectors and an updated
Technological Infrastructure Policy. Moreover, the benefits of 5G adoption can be expanded
by appropriate actions to endow the poor with smartphones in rural and undeveloped areas of
SSA and by reconsidering the taxation of mobile phone-based transactions which currently
slows the pace of the ongoing mobile revolution in SSA (Ndung’u, 2019).

2
 The term Digital Divide or digital split owes to Norris (2001).
3
 Among others, see Hjort and Poulsen (2019).
4

4. Apart from infrastructure gaps, affordability and user knowledge also contribute
to the current mobile Digital Divide. Even if the required 5G infrastructure is made available,
uneven access to modern mobile technology adoption may persist if poorer and rural
households cannot afford smart devices and monthly data fees or if they lack the capacity to
access the internet due to insufficient education or skills. Low income per capita combined
with inadequate human capital will stifle the demand for 5G technologies, especially in rural
areas, reinforcing the mobile Digital Divide. This issue, while important, is outside the scope
of the present paper, which focuses on the cost (to either the private or public sector) to provide
the necessary infrastructure to bridge the mobile Digital Divide.

5. Experience from 5G forerunners provides a valuable framework for developing a
costing framework for SSA. The Fifth Generation is becoming a global standard and the
experiences from early adopters like the South Korea, China, or the United States may be
useful to help assess the implementation costs in SSA. At the same time, the SSA countries
face their own unique challenges including the increasing population in the next two decades,
accompanied by rapid urbanization. These also will need to be taken into account in factoring
in the likely costs of providing 4G and 5G in the region.

6. A pronounced increase in population and a rapid expansion in the labor force
characterize the current demographic trends in SSA. Specifically, SSA population is
projected to rise to 1.7 billion in 2040 from 1 billion today, while the labor force will increase
by 20 million per year over the next two decades (IMF, 2018). The expected rise in population
constitutes an opportunity to seize a demographic dividend, while simultaneously requiring an
improved connectivity. Governments should consider infrastructure gaps, with an emphasis on
digital, to leverage the opportunities from the ongoing technological revolution.

7. SSA is also experiencing rapid urbanization and the associated challenges. The
urban population has on average risen by approximately 4.4 percent annually over the last 50
years, with the average urbanization rate now exceeding 40 percent (United Nations, 2018).
Moreover, urban population is expected to double over the next 25 years with higher migration
to cities from rural areas (United Nations, 2017). Urban centers in general play a crucial role
in combatting poverty and sustaining economic growth. Yet, African cities share in general
three challenges that need to be addressed to support high and inclusive growth: they are
crowded, but not economically dense; disconnected; and costly for households and firms (Lall
and others, 2017).

8. This paper aims to estimate the cost of introducing a full-scale 4G network by
2025 in SSA and an operable 5G network by 2040. First, we briefly describe the evolution
of modern cellular technologies with a specific focus on 5G. While there is no consensus on
technology requirements of the Fifth-Generation cellular networks, we enumerate its agreed
use cases, including the need to satisfy the heterogeneous networks and device-to-device
communication. We next investigate the current state of play in mobile digital connectivity in
SSA based on the average monthly mobile data consumption per person and note the existence
5

of significant global mobile Digital Divide. We then outline the costing framework for both
4G and 5G adoption in SSA. Specifically, we follow the methodology developed by Lombardo
(2019) of the European Broadcasting Union which assumes a non-standalone network
architecture. 4 It is based on a synthetic country, the average of France, Germany, Italy, Spain,
and United Kingdom, but we adjust the framework by accounting for SSA-specific
characteristics.

9. Our central contribution lies in accounting for SSA characteristics. Specifically,
we account for demographic transitions, rapid urbanization including by projecting population
densities for highly decentralized administrative areas. We investigate trends in population
densities in highly decentralized administrative areas in each SSA country from 2000 to 2020.
We then use them along with the United Nation’s medium-variant population projections to
infer the population densities for 2025 and 2040 for each SSA country. They are then used to
determine the required mobile digital infrastructure cost and the associated operational
expenditures of implementing full 4G by 2025 and operable 5G by 2040. In the costing
methodology we also account for heterogeneity in the cost of electricity, current 4G coverage
and the number of licensed mobile operators in each country, as well as the potential lack of
fiber backbones.

10. We find that overall costs to implement full 4G in SSA by 2025 would stand at
US$14 billion and, conditional on that, an operable 5G by 2040 would cost an additional
US$57 billion. In annual terms, the required capital and operational costs would stand at
US$2.5 billion (0.04 percent of 2025 SSA GDP) and US$3.9 billion (0.03 percent of 2040 SSA
GDP) for full 4G and operable 5G, respectively. These roughly translate to 8.4 percent of
income per subscriber for 4G connectivity in 2025 and 4.9 percent of income per subscriber
for 5G connectivity in 2040. We decompose annual overall costs into capital spending and
operational spending components: to achieve the full 4G connectivity by 2025, capital
expenditure spending would reach approximately US$2.1 billion and the accompanying
operational expenditure spending would be US0.4 billion. Annual costs for 5G connectivity in
2040 would be US$3.3 billion and US$0.6 billion, respectively, for capital and operational
expenditures in SSA. We also report significant heterogeneity in costs to implement 4G and
5G per subscriber income across SSA countries reflecting largely the differences in current
state of play in mobile infrastructure as well as differences in population growth, urbanization
rates, and real GDP growth projections.

11. The structure of the paper is as follows. Section II briefly describes the evolution of
mobile networks and finally illustrates the global mobile Digital Divide. Section III introduces
the costing methodology, extensively describing the underlying assumptions and illustrating
the framework to address the demographic transition and rapid urbanization to project
population densities in next two decades years. Section IV presents the costs of ensuring the

4
 Non-standalone approach means that mobile operators can use the existing sites/infrastructure and 4G spectrum
as an anchor connection with a densified network of small cells and higher-band spectrum. It would facilitate
high-speed data services requirement of both 4G and 5G.
6

required infrastructure for full coverage of 4G SSA in 2025, and conditional on that, cost of
implementing operable 5G by 2040. Section V concludes.

 II. CELLULAR NETWORKS

12. In this section we focus on modern mobile technologies, including their potential
impact on bridging the mobile Digital Divide. We start with a brief description of the
evolution of cellular networks, starting from the First Generation to the currently evolving
definition of the Fifth Generation. We illustrate the mobile Digital Divide from a global map
of the monthly mobile data consumption per capita in each country. Finally, we characterize
the fundamental economic and business-related aspects of introducing 5G technology, as well
as implications for bridging the mobile Digital Divide.

 A. EVOLUTION OF MOBILE TECHNOLOGY

13. The First Generation of cellular networks was designated uniquely for voice
applications (Figure 1). 1G was first introduced in Japan in 1979 by Nippon Telephone and
Telegraph and followed by Europe and the United States a few years later (Sharma, 2013), 1G
technology consisted of analogue systems employing frequency division multiple access for
the voice call (Hossain, 2013). It was characterized by the indigent voice links, low capacity,
total lack of security and unreliable handoff. 5, 6

14. The Second Generation of wireless mobile technology improved on 1G using
digital signals to enhance transmission. It was introduced in the early 1990s (Sharma, 2013)
with the digital modulation schemes, not only improving voice service, but providing
simultaneously text messaging (Nokia, 2014), broadly known as Short Message Service (SMS)
and e-mail (Elmannai and Elleithy, 2014). Moreover, 2G enhanced the spectral efficiency and
augmented the roaming level of development, allowing the creation of the global system of
mobile communication (GSM) standard. 7 The so-called 2.5G launched the general packet radio
service (GPRS), constituting a substantial step towards the implementation of 3G.

5
 In the context of networks, capacity is the complex measurement of the maximum amount of data that may be
transferred between network locations over a link or network path
6
 In a cellular telephone network, handoff is the transition for any given user of signal transmission from one base
station to a geographically adjacent base station as the user moves around.
7
 In a cellular telephone network, spectrum efficiency equals the maximum number of users per cell that can be
provided while maintaining an acceptable quality of service.
7

 Figure 1. Evolution of Mobile Technology

 Sources: Cisco Visual Networking (2019).

15. The Third Generation of wireless cellular technology enabled mobile internet
access. Launched in 2001, 3G networks allowed for higher capacity for voice services in
connection with the relatively fast and affordable mobile data services (Nokia, 2014). In other
words, e-mail, wireless web base access, video and multimedia services were the flagship
features offered by the Third-Generation cellular network technology (Elmannai and Elleithy,
2014). Continuous improvements in spectral efficiency lead to the broader network capacity
and the Universal Mobile Telecommunication Service system, which enhanced the old GSM
standard.

16. The Fourth Generation of mobile networks allowed fast and secure data transfers.
4G supports significantly higher capacity and both voice and data services. It involves a move
from the operator-centric 3G concept—which emphasizes the importance of voice and
messaging services—to the service-centric one, emphasizing data usage (Janevski, 2009).

 B. 5G NETWORK: DEFINITION IN PROGRESS

17. Fifth Generation is the latest iteration of cellular technology, designed to increase
the speed and responsiveness of wireless networks substantially. The precise definition of
“5G” is evolving. According to one of the leading industry associations in this area, the 3rd
Generation Partnership Project (3GPP, 2018), 5G can be defined as any system using the 5G
NR (5G New Radio) software. Others view 5G as any cellular network system satisfying the
requirements of the ITU (2015), published as the International Mobile Telecommunication
2020 standards (IMT-2020). Despite the lack of worldwide consensus on a precise definition,
there is a general agreement that 5G technology would usher in new paradigms in connectivity
in mobile broadband wireless systems.

8

18. 5G networks meet broad criteria for speed, reliability, and latency. 5G network
speeds is expected to achieve a peak data rate of 20 gigabits per second for the downlink and
10 gigabits per second for the uplink (ITU, 2015). Moreover, the latency in a 5G network could
fall under 4 milliseconds in a mobile scenario and up to 1 millisecond in Ultra Reliable Low
Latency (that is, low time delay) Communication scenarios. It will permit Internet of Things
and will have wide-ranging implications, including self-driving cars and what have been
described as “smart-cities,” such as Seoul (South Korea) or Singapore. 5G networks are also
expected to provide always-on capabilities and aim to be energy-efficient, by minimizing the
power a modem consumes, based on the amount of ongoing traffic. 8 In addition to the
advancements in higher speed, larger capacity, and lower latency, 5G offers network
management features, such as network slicing, which authorizes mobile operators to construct
multiple virtual networks within a single physical 5G network, potentially leading to World
Wide Wireless Web.

19. For the remainder of the paper, we will focus on heterogenous 5G networks that
require concurrent operation of macro-, micro-, pico-cells. Heterogenous networks are
sometimes referred to as a non-standalone network architecture, which is a widely use
technique to cope with increased mobile traffic demand Clerckx and Oestges (2013). They are
created as the classical macro-cell network, overlaid with low power-nodes (micro- and pico-
cells) deployed in the macro-cell area. Due to significantly lower range, micro- and pico-cells
are typically used to extend coverage and capacity in areas difficult or expensive to reach using
the more traditional macro-cell approach. Thus, they are mainly designed for indoor areas
where outdoor signals do not reach well, or to add network capacity in areas with very dense
phone usage, such as train stations or stadiums (Figure 2).

 Figure 2. Network Capacity Areas: Macro-, Micro-, and Pico-cells

 Sources: Qorvo, 2017.

8
 Internet of things denotes a network of connected things, including people, and in general the concept of
connecting any device with an on and off switch to the Internet and/or to each other.
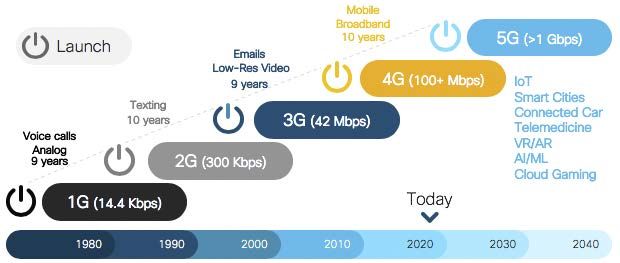
9

20. There are three main 5G network use cases (ITU, 2018). The first one, depicted in
Figure 3, is the enhanced mobile broadband. This is expected to be the primary use case in the
early developments of 5G networks (GSMA, 2018), delivering high-speed mobile broadband
to high population density areas, aimed at the entertainment, video social networking and
multimedia communications with higher resolutions video channels (EU, 2016). It would allow
consumers to enjoy high-speed streaming on demand, while also permitting enterprise
collaboration services to spread. The second use case is the enabling of massive machine-to-
machine type communications, allowing a vast number of low-power, low-cost device
connections with high scalability and increased battery lifetime, driving the evolution of smart
cities and Internet of Things. It would ensure relatively cheap and universal connectivity with
minimal energy consumption. The third and final use case is ultra-reliable and low-latency
communications, sometimes referred to as critical machine-type communications, which are
designed to use the network for mission-critical applications which demand stringent
requirements for uninterrupted, robust, and timely data exchange. 9

 Figure 3. 5G Use Cases

 Sources: ITU, 2018.

 C. MOBILE DIGITAL DIVIDE

21. Despite the proliferation of mobile phones, there remains a global mobile Digital
Divide. SSA remains the fastest expanding region in terms of the number of mobile
subscribers, with a composite average growth rate of 4.6 percent per year and an additional

9
 A mission critical factor is defined as any factor that is substantial to business operation or to an organization,
which failure or disruption may lead to the serious repercussions.
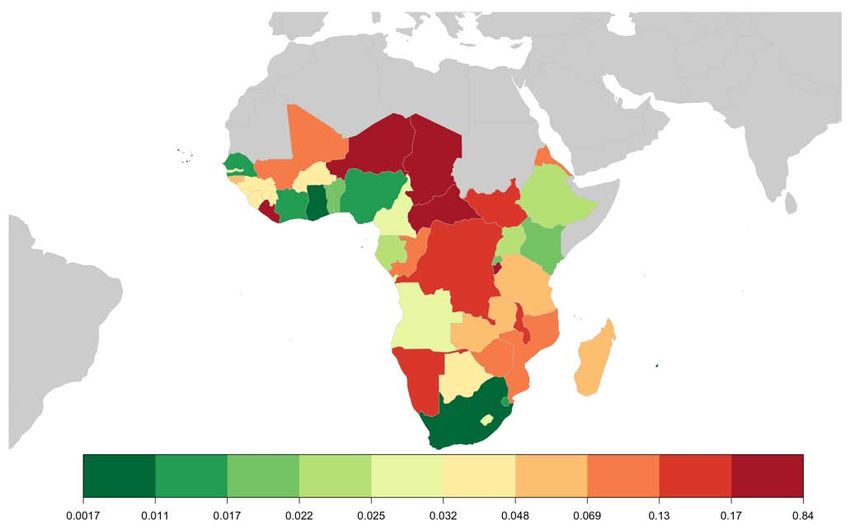
10

167 million subscribers expected to materialize over the period to 2025 (GSMA, 2019a). In
other words, the total subscriber base will increase to slightly over 600 million, representing
around half the population. 10 While the increased availability of smartphones has already
resulted in increased internet access across the socio-economic spectrum globally, there is still
substantial heterogeneity across the world in terms of average monthly mobile data
consumption (often referred to as average monthly traffic), measured in gigabytes (GB) per
person (Figure 4). For instance, while there are several countries with subscribers’ average
monthly traffic exceeding 10 GB (Kuwait, 31 GB; Finland, 23 GB; Saudi Arabia 13 GB), there
are also economies in which subscribers are consuming on average less than 0.08 GB monthly
per capita (Afghanistan, Ukraine, and Bolivia). Moreover, in SSA, subscribers in only three
countries consume more than 2.03 GB per month (global average): Seychelles, Equatorial
Guinea, and Gabon. Alper and Miktus (2019) note the narrowing of the global Digital Divide
from 2005 to 2017. Nevertheless, in the absence of active policies to address issues that hinders
progress in infrastructure, affordability, knowledge, quality, and internet access, the global
Digital Divide may persist—or even widen—in an environment characterized by far-reaching
changes in technology, climate, and global economic integration. 11

 Figure 4. Average Monthly Mobile Traffic (GB per capita)

 Sources: ITU’s ICT Indicators database and authors’ calculations. 12

10
 Coetzee and others (2018) foresee mobile subscriptions in SSA to exceed 900 million by 2023.
11
 See Abdychev and others (2018) on factors affecting the future of work in SSA and Alper and Miktus (2019)
on the construction of digital connectivity sub-indices of infrastructure, affordability, knowledge, quality, and
internet access.
12
 For countries missing average monthly mobile consumption per capita data, we use predicted values based on
a linear regression of monthly average traffic per capita as the dependent variable on GDP per capita in PPP terms,
its square, ratio of population in the largest city (as percent of the urban population), the rural population (as the
percent of total population) and geographic regional dummies. Regression results are available from the authors
upon request.
11

22. The advanced mobile ecosystem is expected to contribute significantly to economic
growth and bridging the mobile Digital Divide emerges as a key policy priority.
Digitalization is estimated to contribute US$12.3 trillion of global economic output by 2035,
with the highest progress in sales activity (HIS, 2017). In SSA, mobile technologies and
services already generate US$144.1 billion, about 8.6 percent of SSA GDP in 2018 (GSMA,
2019a). Moreover, the contribution of 5G in Africa is projected to reach USD 10.5 billion by
2026 from virtually zero currently, with the highest shares expected to materialize in the
manufacturing and energy sectors (Figure 5).

 Figure 5. Projected Contribution of 5G by Sector in Africa by 2026

 US$10.52
 billion

 Sources: Ericsson, 2017.

23. In addition to contributing to new high-tech employment opportunities, 5G has
the potential to revolutionize existing rural jobs, particularly in agriculture. Recent
evidence suggests that the arrival of fast Internet in Africa led to increased employment in both
high and low skilled occupations (Hjort and Poulsen, 2019). 5G technology can increase
agricultural productivity, for instance by allowing a quicker transfer of data related to weather.
Apart from promoting jobs, 5G can improve network connectivity in rural schools, enabling
students to achieve more efficient learning (Ovum, 2018), for instance through the wider access
to information and knowledge. Local government services are also expected to be positively
affected by better mobile connectivity, akin to positive impact of connectivity on the provision
of health care services to rural populations.

24. Active policy intervention would be needed to implement 5G technology to bridge
the mobile Digital Divide. In the early stage of deployment, the investment in 5G will be
12

commercially viable solely for densely populated urban areas. Consequently, rural and sub-
urban areas would risk falling behind in 5G coverage, further widening the Digital Divide, at
least initially. As mentioned earlier, apart from closing the infrastructure gaps, affordability
and knowledge issues already contribute to current mobile Digital Divide and these effects
could persist, given that poorer and rural households may not be able to afford smart devices
or if they lack the knowledge to use them. The gender dimension of digital divide is also
another area where policy intervention is required consistent with finding that leveling the
playing field for female entrepreneurs is to be positively related to higher digital connectivity
(Alper and Miktus, 2019). 13 Taking all the above-mentioned points into consideration,
choosing the right set of policies for 5G network implementation is crucial to pursue in the
SSA region. 14

 III. COSTING METHODOLOGY

25. In this section, we illustrate the modern cellular network costing quantitative
framework developed by Lombardo (2019). We start by evaluating the costs related to the
full introduction of 4G networks in SSA by 2025. The estimates take account of population
density projections and current 4G coverage. Next, we assess implementation of 5G by 2040,
assuming the full implementation of 4G by 2025. We estimate the costs involved in providing
universal coverage of the population. 15

26. The costing methodology accounts for significant heterogeneity across SSA. First,
the SSA economies differ in terms of current 4G technology adoption (Appendix I), hence
those lagging in mobile digital connectivity need to bear a higher cost to achieve full 4G
coverage by 2025 and satisfactory level of 5G ratification by 2040, conditional on the full
implementation of 4G by 2025. Second, there are significant differences in population growth
rates as well as the pace of urbanization not only across SSA region, but within different
regions in a specific country as well, implying heterogeneity of costs and pointing out the
importance of relevant policies in order to provide the equal modern cellular technologies
availability across whole country. Finally, we also account for heterogeneity in electricity
prices.

27. We use GADM and WorldPop databases to assess population densities by
administrative area. For every country in SSA, we start by obtaining the spatial data from

13
 Among others, see Silver and Johnson (2018), Mutsvairo and Ragnedda (2019) on gender aspects of digital
divide in Africa.
14
 We do not preclude other potential connectivity schemes that could reduce Digital Divide in SSA (satellite wifi
hotspot project of Facebook or TV white space project of Microsoft). There is a possibility that the 5G technology
may evolve before 2040 (coming online of post-5G technologies). In other words, countries should consider all
available digital connectivity options based on changes in technology.
15
 Throughout the paper all calculations are done using R and Python software.
13

GADM at the finest level of granularity (Figure 6). 16 Next, we download from the WorldPop
database information on population and area for each SSA country as pictures, with pixel
intensities quantifying the number of inhabitants for 2000, 2010, and 2020. 17 The predicted
number of people per ~100 m pixel is estimated using the random forest model, as described
in Stevens and others (2015).

 Figure 6. Administrative Areas for Africa

 Sources: GADM database and authors’ calculations.

28. Population densities for 2025 and 2040 are projected through Lagrange
polynomials. Having three distinct nodes (2000, 2010, and 2020) for each administrative area,
in each SSA country, defined as the percentage of population living in a given area to the
overall population, quadratic Lagrange polynomials are calculated. The projected population

16
 The coordinate reference system is longitude/latitude and the World Geodetic System 84 datum.
17
 An overview of the data can be found in Tatem and others (2017), while a description of modeling methods is
included in Stevens and others (2015).
14

densities in 2025 and 2040 are then obtained as the values of such polynomials 18 in 2025 and
2040, respectively, multiplied by the ratio of projected population size (from medium-variant
projections of the UN for each country) to the current region’s area. 19

29. We use the costing framework of Lombardo (2019) which draws on data on mobile
traffic demand per user, network capacity per user, and the throughput needed in each
region. 20 We obtain the current mobile traffic demand for each SSA country from the ITU ICT
Indicators database as the average monthly mobile data consumed per month per capita in
GB. 21 We then calculate the busy hours traffic in megabytes per hour per capita by first
converting GB to megabytes through multiplying by 1000, converting months to days by
dividing by 30 and finally assuming that the hourly busy data consumption accounts for 20
percent of the total daily traffic. Next, we calculate the busy hour bitrate which serves as an
input to the network capacity computation. We convert megabytes per hour to megabits per
second by multiplying by 8 and then dividing by 3600 (60 x 60). Then we compute the network
capacity by assuming that the network should be able to provide at least 80 percent of busy
hour bitrate all the time. Finally, the projected population densities are multiplied by network
capacities to derive the area throughput (Box 1).

 Box 1: Calculating Area Throughput

 Monthly traffic
 Busy hour traffic = . ⋅ ⋅

 Busy hour traffic
 Busy hour bitrate = ⋅
 ⋅
 Busy hour bitrate
 Network capacity =
 .
 Area throughput = Network capacity ⋅ Population density

30. Our network costing methodology incorporates population growth and rapid
urbanization within each administrative area in every SSA country. Population densities
in highly disaggregated administrative areas enter as inputs to the required area throughput

18
 Due to the unboundedness of the projected weights, we truncated the distribution by assigning values greater
than 1 to 1 and smaller than 0 to 0. To ensure all weights sum to 1, we divide each weight by their sum. We also
considered an alternative approach by applying soft-max transformation to the projected weights. However, this
led to marginal variability of population densities across regions and thus we dropped it.
19
 We assume unchanged administrative areas in the next two decades. We initially considered applying the
weights of administrative areas in 2020 to 2025 and 2040 to project population densities in each administrative
area but decided not to proceed as it would ignore rapid urbanization in SSA.
20
 Area throughput is a technical term that defines data transfer speed per area for a given amount of energy.
21
 For countries with missing average monthly mobile consumption per capita data, we use predicted values based
on a linear regression of monthly average traffic per capita as the dependent variable on GDP per capita in PPP
terms, its square, ratio of population in the largest city (as percent of the urban population), the rural population
(as the percent of total population) and geographic regional dummies. Regression results are available from
authors upon request.
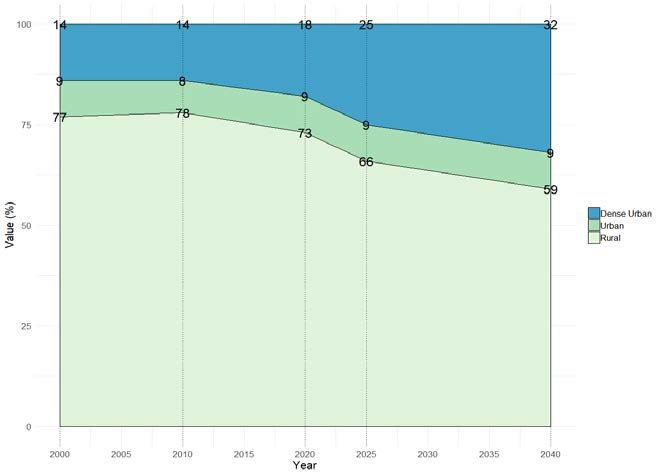
15

calculation. We also use population densities to classify each area into three broad urbanization
categories to account for specific cell characteristics in the costing framework (Table 1).

31. We next include population information to obtain population density in each
administrative region. Specifically, we download information about population for each
country from the WorldPop database. Pixel intensities within each country provides
information about the number of inhabitants. We then juxtapose the population intensity map
with boundaries of administrative areas obtained from GADM database. An illustrative
example for Rwanda in Appendix III.

32. We next categorize the regions into three groups: Rural, Urban, or Dense Urban.
An administrative area is designated as Rural when its population density is less than 500
people per square kilometer; Urban when the population density is greater than 500, but less
than 1,500 people per square kilometers; and finally, an administrative area is designated as
Dense Urban when the population density exceeds 1,500 people per square kilometer. 22

33. Our projections show a significant increase in share of densely urban population
(Figure 7). Based on our projections from the fitted Lagrange polynomials, share of population
in rural areas in SSA would fall to less 60 percent by 2040 from 78 percent in 2010. At the
same time share of population in densely urban areas is projected to increase to roughly a third
of the total population in SSA from below 15 percent in 2010.

 Figure 7. Share of Population in Rural, Urban and Dense Urban Areas in SSA

 Sources: GADM and WorldPop database and authors’ calculations.

22
 Jedwab and others (2019) argue that population density is not necessarily a satisfactory measure of urbanization
and city size. Replication of this exercise, by including regional income or the level of urban technology when
such data is available could be a valuable extension of this paper.
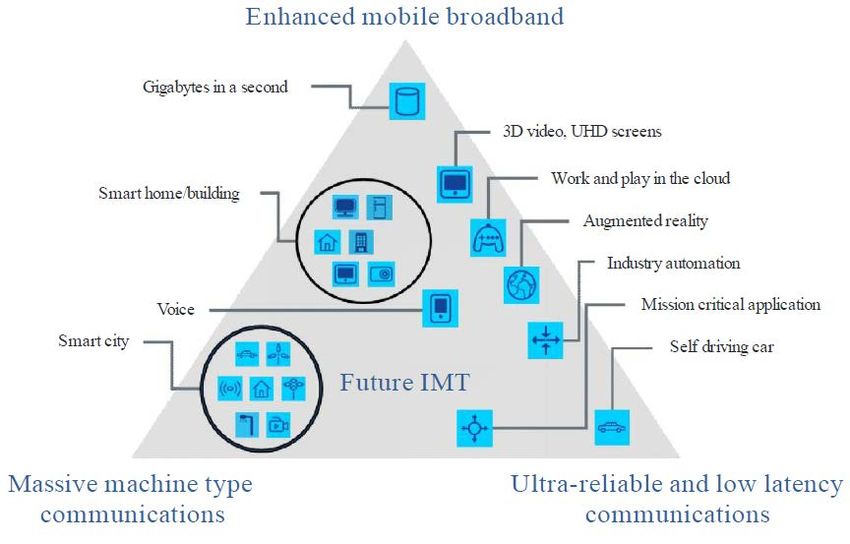
16

34. Rapid urbanization poses a challenge for determining the necessary
infrastructure to implement the 5G cellular network. Based on the population density
projections for each administrative area and the UN’s medium variant population projections
for each country in 2025 and 2040, we plot the share of population living in the three
urbanization groups in SSA and observe the migration away from rural areas towards densely
urban areas and specifically the emergence of mega-cities in SSA by 2040. Urbanization and
overall rising population need to be accompanied by an increase in infrastructure, including
the proper investments in both 4G and 5G cellular network technologies. Higher population
density will likely lead to higher costs, reflecting higher reliance on more expensive micro-
and pico-cells in the presence of increasing structures in such city centers.

35. We then provide key parameter values of the mobile network infrastructure.
Based on the actual list of spectrum allocations per country in SSA, 23 we assume that the
macro-cells will operate on 700 MHz, 24 the micro-cells on 1800 MHz, and the Pico-cells on
2600 MHz. 25 Furthermore, all cell types are assumed to possess 15 bit/s/Hz efficiency for the
4G, while 23 bit/s/Hz for the Fifth-Generation network. Finally, cell radiuses depend on
population densities, and for the sake of simplification are clustered into three broad groups,
in the manner outlined in Table 1.

 Table 1. Cell Radius and Population Density
 Geotype Macro cell Micro cell Pico cell
 Rural
 10 km 2 km 26 Not applicable
 (0 – 500 pop/km2)
 Urban
 2.5 km 1.25 km 0.2 km
 (500 – 1500 pop/km2)
 Dense Urban
 1 km 0.5 km 0.1 km
 (>1500 pop/km2)
Source: Lombardo (2019).

36. We assume hexagons to represent the cell coverage in the network, as commonly
done in the literature. Johansson (2007) shows that the number of base stations for
heterogenous networks with a uniform traffic distribution can be approximated either by the
maximum average aggregate throughput or the cell range (the coverage). Given that the

23
 See https://www.spectrummonitoring.com/frequencies/.
24
 Another possibility is to operate at 800 MHz (CSIR, 2018). It is important to underscore that each spectrum
has different physical characteristics, leading to trade-offs between capacity, coverage, latency, reliability, and
spectral efficiency.
25
 Much higher frequencies and greater bandwidth for higher data rates are currently being commercially tested,
for instance AT&T in the USA at 28 GHz (EC, 2016).
26
 Lombardo (2019) considers 5 km radius for micro cells in rural areas. We take a more conservative approach
and in spirit of BU-LRIC model (Analysys Mason, 2017) assume 2 km radius for micro cells in SSA.
17
primary concern of the paper is to find the cost of bridging the mobile Digital Divide and thus
delivering the improved connectivity for everyone and everywhere, we assume that
implementation of a network that prioritizes coverage is the highest priority. Consequently, for
a hexagonally shaped cell of class , where ∈ {Macro, Micro, Pico}, identified by the
maximum radius , we calculate the required number of base stations to serve the area of size
by:
=
√
Furthermore, assuming a maximum capacity τ , we calculate the throughput provided by
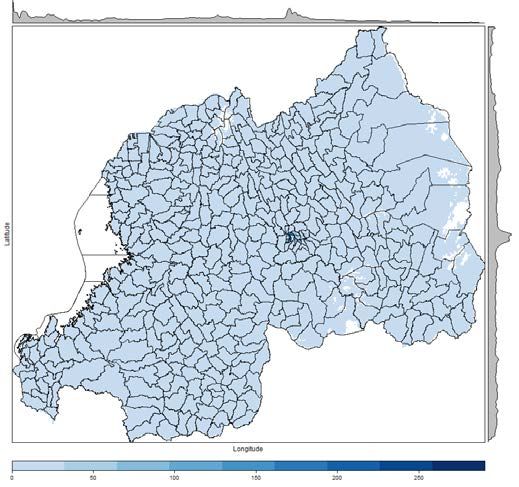
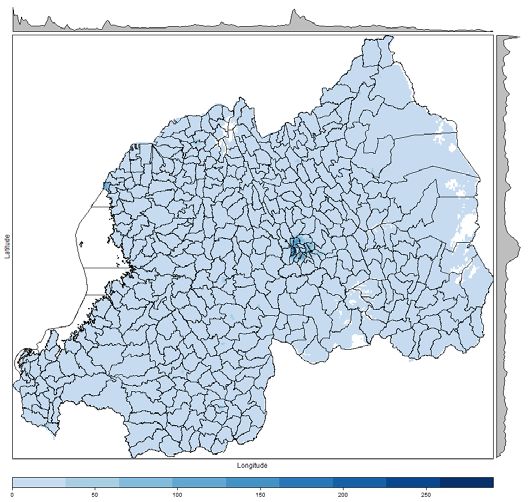
base stations of class in an area of size :
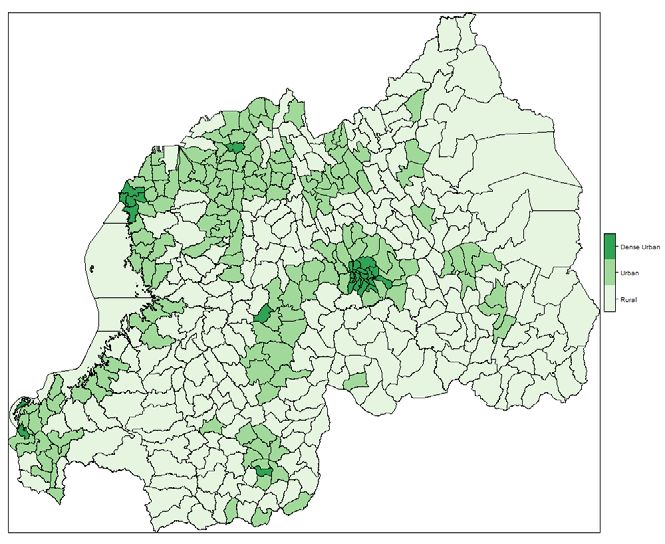
⋅
=
If the estimated throughput is unable to satisfy demand, it is possible to either strengthen the
network by supplying additional stations of class (if there are supplementary providers in the
region) or to provide an extra layer of stations of a different class. 27
37. The projected costs are subject to upside risks. The estimates do not include costs
associated to possible signal loss generated by topology (for instance, vast mountain areas or
deserts) or interference (a significant number of microwaves or unexpected lighting and other
violent electrostatic discharges). Instead, we assume constant throughput in the entire service
area. The calculated costs should thus be seen as a lower bound. A more sophisticated cost
analysis, such as the SEAMCAT model (Oughton and others, 2019), or the nonlinear
constrained discrete demand/coverage/capacity optimization approach (Schneir and others,
2017) could be therefore viewed as a valuable extension, but data requirements do not allow
us to undertake these for all SSA countries.
38. We next calculate the number of required cells for each administrative area in
each SSA country. Starting with the macro-cells, we compute the maximum number of cells
to be installed in each administrative area to guarantee full coverage, simultaneously
calculating their delivered throughput. When 4G/5G mobile demand is fully satisfied, we move
to the next region, otherwise we tend to the densification need. We assume multiple input,
multiple output technology, which combines up to three antennas for a single cell, minimizing
transmission error and optimizing data speed. In other words, we start with a single cell with a
single transmitter and consecutively we supplement additional antennas (up to three) to
increase the capacity. If demand is still not satisfied, we consider two scenarios: if other carriers
are present in a given area (see Appendix II), we add other macro-cell layers (with up to three
27
An alternative approach would be to estimate the demand and the predicted number of users through the Bass
model (Smail and Weijia, 2017).18 transmitters) 28 If the demand is not yet fulfilled, we add other micro-cell layers (if there are other telecoms operating in the region) or pico-cells until the area throughput satisfies the demand. Finally, since the results obtained consider the situation where the technology used is the highest performing for every single cell, we follow Lombardo (2019) and augment the number of cells by 30 percent (Lombardo, 2019). We repeat this procedure and calculate the number of cells for years for 2020, 2025, and 2040 as below. • Calculating number of cells in 2020. We initially assume that the current mobile consumption traffic is uniformly distributed across every administrative area of a country. For 2020 only, we consider an additional step: the final number of cells in a given region is set equal to the product of the percentage of population covered by the 4G network and the number of cells given by . • Calculating number of cells under two scenarios for 4G network in 2025. Under the first scenario, we assume that 23 percent of connections in 2025 are made available through the 4G network, compared to seven percent in 2018 (GSMA, 2019a). We also impose an additional constraint guaranteeing a minimum of 0.5 GB monthly mobile traffic by 2025. Under the second scenario, we use the world mean monthly consumption 5.6 GB and its projected value of 20.1 GB by 2024 (Ericsson, 2019). Using the values that underlie Figure 5, we estimate current global average monthly traffic to equal 2.03 GB. Hence, based on the initial condition differences, we adjust 2.03 the 2025 Ericsson (2019) goal to equal 5.6 ⋅ 20.1 = 7.3 monthly traffic in the 29 second scenario. • Calculating number of cells for 5G network in 2040. We follow the European Broadcasting Union objective of guaranteeing a minimum of 44 GB of monthly mobile traffic by 2040. This goal does not imply that the entire SSA will be using 44GB of mobile data, particularly considering the relatively low smartphone adoption rate at 39 percent currently, predicted to rise to 66 percent by 2025 (GSMA, 2019). Nevertheless, our estimates provide the cost of the infrastructure that would be needed. To allow this use of 44GB of data. 39. Finally, we calculate network costs. We distinguish between two main cost components: capital and the operating expenditures (Pereira, 2007). The capital expenditures component (Capex) includes equipment costs, tower costs, and installation costs, paid at the beginning of each year for simplicity. The operating expenditures component (Opex) incorporates energy consumption, heat dissipation, the site rental, and site operation and maintenance expenses (O&M), paid at the end of the year. The input numbers are given in Table 2. The electricity costs per kW/h are from the World Bank database, following the DB16- 28 We do not assume that the same carriers will operate in a given country in the next decade, nevertheless we impose a constant number of carriers. 29 Throughout the text, the first scenario will be referred to as the GSMA objective, while the second one as the Ericsson goal.
19

19 methodology and are assumed to remain constant in the next two decades. The heat
dissipation component is assumed to double electricity costs. Moreover, the operational
expenses include the labor costs which reflect the 6–7 days of work of an expert annually for
the macro cells and 2-4 days of work for the micro- and pico-cells. In addition, we assume the
operators share parts of Capex and Opex costs (see Box 2). We assume expert availability in
every region, which may underestimate the actual costs especially in low-income areas with
scarcity of skilled labor. To account for such costs and in general large uncertainty
characterizing the 4G/5G costs in SSA, the final costs are augmented by 30–50 percent. 30

 Table 2. Mobile Network Costs 31
 Capital Expenditures 32
 Site categorization Equipment Tower Installation
 Macro €32k €123k €30k
 Micro €5k €20k €10k
 Pico €2k €3k €2k
 Operational Expenditures
 Site categorization Power Efficiency 33 O&M Rental
 Macro 100 W 50% €3.3k €5k
 Micro 50 W 50% €1k €2.5k
 Pico 10 W 50% €0.9k €0.01k
Source: Lombardo (2019).

30
 Oughton and Frias (2018) augment total cost by 10 percent for the United Kingdom. We choose 30-50 percent
to reflect the sparse availability of fiber backhaul in SSA and to account for secondary costs such as air
conditioning equipment. We use a 50 percent mark-up for Capex in light of the inefficiency of investment in SSA
and 30 percent for Opex in SSA. We also do not discount costs for potential competitive bidding dynamics
outlined in Federal Communications Commission (2010).
31
 The exchange rate is assumed to remain constant at 1.1 US$/EUR.
32
 Lombardo (2019) considers macro-cell equipment Capex cost of €5k, and macro-cell tower Capex of €20k.
Numerous studies for Africa project the overall macro-site Capex to the order of magnitude around €100k-€300k,
including Facebook (2015), World Bank Group (2015), and World Economic Forum (2017). We follow Facebook
(2015), augmenting the aforementioned costs to €32k ($35k, assuming the constant exchange rate 1.1 US$/EUR)
and €123k ($135k) respectively, which translates to the overall macro-site Capex of €185k.
33
 This implies a doubling of energy consumption costs. Implementation of modern energy savings schemes can
lead to up to 17% energy savings in macro-cells and up to 33% in micro-cells (Sharma, 2017), similar to the gains
from proper air conditioning (Deruyck and others, 2014).
20

 Box 2: Calculating Network Costs

 Class Cells Sites

 Capex = � � Equipment , + �(Tower + Installation )
 =1 =1 =1

 Class Cells Sites

 Opex = � ��Energy_consumption , + Heat_dissipation , � + �(Rental + O&M )
 =1 =1 =1

40. Projected investment costs account for the lifetime of the equipment. The passive
part, “Tower” component of Capex has an estimated lifetime of around 20-30 years, thus it
does not need to be renewed until 2040. On the other hand, the active part, “Equipment”
component, has a lifetime range of around 5-10 years which necessitates renewal of
active equipment investment in 2020 to be renewed twice, in both 2032 and 2040 and the
renewal of 5G additional cells at least once. We do not have dedicated “Installation” costs for
“Tower” and “Equipment” components, and we assume that installation costs are incurred for
each equipment renewal cycle. 34

41. The current mobile Digital Divide and differences in population growth rates and
urbanization are significant inputs in the costing framework. There is considerable
heterogeneity among SSA countries in terms of mobile technology availability and hence those
lagging in mobile digital connectivity need to bear a higher cost to achieve full 4G connectivity
by 2025. In addition, 5G costing is conditional on the full implementation of 4G by 2025 and
differences in population growth rates as well as the pace of urbanization would imply
heterogeneity of costs across SSA countries in 2040.

 IV. TOTAL COST OF 4G AND 5G CONNECTIVITY IN SSA

42. We next present the estimated annual costs of introducing a full-scaled 4G
network by 2025 and operable 5G network by 2040 in SSA. We calculate total costs for
SSA, assuming Ericsson (2019) goals for 4G in 2025 and the decreased radius of macro-cells
in rural areas scenario in 2040 35. We also provide cost estimates for Capex and Opex compo-

34
 We assume fixed equipment price from 2020–40. A potential refinement in the costing framework could
include 5 to 10 percent annual reduction in unit cost of an active equipment to reflect technological progress or
investment increase in all the technical network value chain, for example reflecting switching from microwave
backbones to fiber backbones to sustain the traffic demand.
35
 We present the results for the Ericsson goal due to their similarity to the outcomes obtained through the second
scenario, while providing significantly higher data traffic. Moreover, we choose to consider the decreased radius
of macro-cells, because of the uncertainty that the higher radius cells could in fact deliver the desired throughput.
The results of alternative scenarios are available from the authors upon request.
21

nents for SSA; and annual costs for SSA as well as at the country leve. Our results indicate
significant heterogeneity in terms of required infrastructure and servicing needs. All costs,
included in Appendix V, are expressed both in the absolute terms (in USD) and relative to the
projected Gross Domestic Product in Purchasing Power Parity terms. 36 .

 Figure 8. SSA: Capex and Opex Costs for 4G and 5G

 Sources: GADM and WorldPop database and authors’ calculations.

43. Our estimates suggest that the required capital and operational expenditures rise
to about US$14 billion for 4G by 2025 and to US$57 billion for 5G by 2040. Specifically,
the Capex cost component for 4G amounts to US$12.5 billion by 2025 for SSA, while its Opex
cost corresponds to US$1.5 billion. Moreover, the 5G Capex cost component is higher in
magnitude than in 4G case, reaching US$49 billion. Similarly, the 5G Opex cost component is
significantly higher, at US$8 billion by 2040 (Figure 8). As discussed earlier, 5G costs are
calculated under the assumption that full 4G connectivity is achieved by 2025. We assume that
the required Capex spending cost is financed uniformly across years (Figure 9). This
assumption implies higher annual Capex cost for 4G implementation by 2025, given that there
are only 5 years to finance the required investment. Consequently, annual Capex spending for
5G implementation by 2040 is lower, as the required annual investment is divided uniformly
to 15 years (2026-2040). This suggests that countries with insufficient initial 4G infrastructure

36
 The required costs related to Capex and Opex for full 4G connectivity by 2025 are expressed as a ratio of 2025
GDP and for 5G connectivity by 2040 as a ratio of 2040 GDP. The GDP projections through 2024 are from IMF
WEO database for August 2019 vintage. Real GDP growth rates for 2025-40 are obtained, where available, from
the IMF LIC DSF database, July 2019 vintage, otherwise assumed to remain constant from 2024.
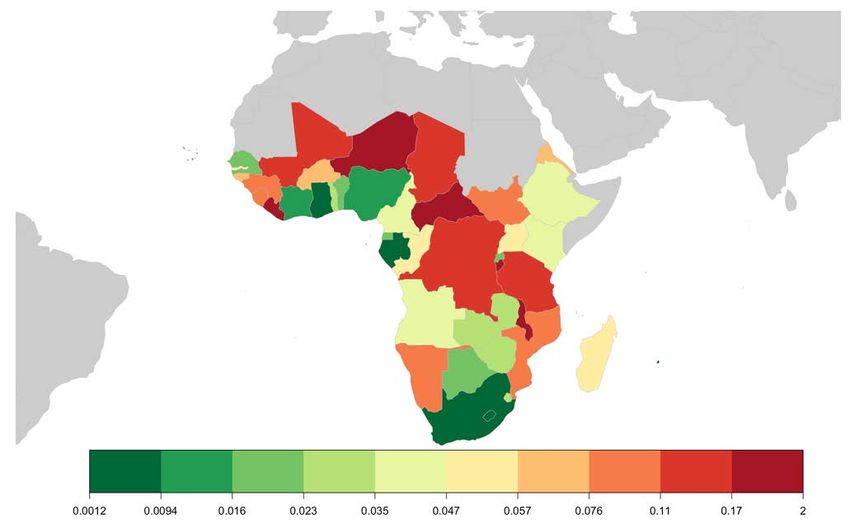
22

and financing constraints in 2018 might choose to delay the full-scale 4G network
implementation to 2030, lowering the significant annual Capex financing needs.

 Figure 9. Evolution of Annual Cost Components for 4G/5G Implementation

 Sources: GADM and WorldPop database and authors’ calculations.

44. We observe significant heterogeneity in required annual Capex spending needs
for 4G/5G implementation across SSA. Aggregate cost estimates for 4G implementation
suggest that the required Capex- and Opex-related costs climb annually to approximately
US$2.5 billion (0.04 percent of SSA GDP) by 2025. While total spending needs for Mauritius
and South Africa are less than 0.004 percent of GDP annually, for Burundi the total annual
cost reaches 2 percent of GDP (Figure 10), reflecting chiefly the current low level of its
infrastructure. Similarly, overall costs of implementing 5G amount to US$3.9 billion (0.03
percent of SSA GDP) annually in 2040 with significant heterogeneity across the region. While
required 5G annual costs for Mauritius, Seychelles and Ghana are less than 0.01 percent of
their projected GDP, annual costs for Burundi stands at 0.36 percent GDP and for Central
African Republic at 0.85 percent of GDP (Figure 11), reflecting differences in growth rates of
population and real GDP as well as the projected pace of urbanization. We also note that a
significant part of the total costs owes to the extent of the rural areas (Figure 12).
23

Figure 10. Annual Cost of Full-Scaled 4G Network in 2025
 (as percentage of GDP)

 Sources: GADM and WorldPop database and authors’ calculations.

Figure 11. Annual Cost of Operable 5G Network in 2040
 (as percentage of GDP)

 Sources: GADM and WorldPop database and authors’ calculations.
24

 Figure 12. Cost Evolution and Population Density

 Sources: GADM and WorldPop database and authors’ calculations.

45. Finally, we consider total costs per subscriber using projected penetration rates.
Implementation of full 4G by 2025 costs correspond annually to 8.4 percent of average
subscriber income in SSA in 2025, while implementation of 5G by 2040 costs 4.9 percent of
subscriber income annually in 2040 on a median basis. We obtain these using the estimated
costs, projected GDP and the population size and by linearly extrapolating for 2025 and 2040
the estimates of the penetration rate for SSA in 2017 from GSMA Intelligence. Specifically,
we calculate the per subscription income costs using the following formula:

 Annual total cost GDP Annual total cost GDP
 / = / =
Unique subscribers Population Population ⋅ Penetration rate Population
 Annual total cost
 =
 Penetration rate ⋅ GDP

The values for 4G in 2025 and 5G in 2040 for each SSA country are included in the Appendix V.

 V. CONCLUDING REMARKS

46. 5G technology could help bridge the mobile Digital Divide in SSA. The
materialization of the benefits from reducing the mobile Digital Divide would depend on
successful policy interventions to address issues beyond the provision of the necessary
infrastructure. These include affordability and knowledge, as well as additional considerations
such as cybersecurity and data privacy, that are beyond the scope of this paper.
25

47. The rollout of 5G technology demands a significant investment in infrastructure.
The Fifth-Generation cellular network requires more cells, capable of providing sufficient
capacity. We adopt the costing model of the European Broadcasting Union to SSA by
accounting for a host of factors including demographic change, urbanization, heterogeneity in
current mobile infrastructure, and electricity costs. Our estimates suggest that the required
capital and operational expenditures climb to approximately US$14 billion for 4G by 2025 and
to US$57 billion for 5G by 2040. In annual terms, we project median annual costs to roughly
correspond to 8.4 percent of subscriber income in 2025 and 4.9 percent of annual subscriber
income by 2040 with significant heterogeneity across countries. Who should bear this cost?
Should it be the public sector or consumers/firms? Should countries with significant mobile
connectivity costs consider delaying the 4G connectivity say until 2030 and reduce annual
capital spending needs at the cost of delaying the catch up? Given the poverty levels, competing
spending needs including on education, health, affordable electricity access, and water and
sanitation, these are important policy discussion that needs to be addressed subsequently by
the policy makers. It is especially important regarding the sizable additional spending
requirement for SSA to meet the Sustainable Development Goals by 2030, estimated at
US$400 billion (0.4 percent of 2030 world GDP), reflecting the region’s lag in development.

48. Policy interventions to facilitate a more enabling environment for mobile
operations is needed to complement infrastructure spending. Regardless of whether the
private or public sector pays for the new infrastructure, policy action to encourage competition,
implement appropriate licensing frameworks to achieve inclusive coverage, and address tax
issues that hamper the provision of mobile services are needed. Policymakers and telecoms
regulators play a crucial role in ensuring affordable connectivity for everyone, including
addressing gender divide. There are several creative country examples of how countries can
address these issues. Countries could consider, for example, selling the available spectrum to
the telecommunication companies under the condition of furnishing full geographical
coverage, similar to the approaches followed by Germany or Australia. Supportive legislation
should establish a forward-looking national strategy and time-bound targets to expand digital
connectivity opportunities beyond mobile. Directed subsidies in the rural areas and by gender,
for instance, in the form of free sim cards or costless subscriptions or incentives to increase
affordability of smartphones, could also be used to complement infrastructure availability.
26

 REFERENCES

1. 3GPP, 2018. Technical Specification Group Services and System Aspects: Release 15.

2. Abdychev, A., Alonso, C., Alper, E., Desruelle, D., Kothari, S., Liu, Y., Perinet, M.,
 Rehman, S., Schimmelpfennig, A., and Sharma, P., 2018. The Future of Work in Sub-
 Saharan Africa, IMF African Department Paper, No. 18/18, Washington, D.C.

3. Alper, E. and Miktus, M., 2019. Digital Connectivity in Sub-Saharan Africa: A Comparative
 Perspective. IMF Working Paper, No. 19/210, Washington, D.C.

4. Analysis Mason, 2017. Mobile BU-LRIC Model Update: Model Documentation.

5. Cisco Visual Networking Index, 2019. Global Mobile Data Traffic Forecast 2017–22.

6. Clerckx, B. and Oestges, C., 2013. MIMO Wireless Networks: Channels, Techniques, and
 Standards for Multi-Antenna, Multi-User and Multi-Cell systems. Academic Press. Chapter
 14: MIMO in LTE, LTE-Advanced and WiMAX.

7. Coetzee, W., Mekuria, F., and Toit, Z., 2018. Making 5G a Reality for Africa, Council for
 Science and Industrial Research in Collaboration with Ericsson .

8. Deruyck, M., Joseph, W., and Martens, L., 2014. Power Consumption Model for Macrocell
 and Microcell Base Stations, Transactions on Emerging Telecommunications
 Technologies, 25(3), pp. 320–333.

9. El Hattachi, R. and Erfanian, J., 2015. NGMN 5G White Paper. NGMN Alliance, February.

10. Elmannai, W. and Elleithy, K.M., 2014. Cost Analysis of 5th Generation Technology.

11. Ericsson, 2017. The 5G Business Potential 2nd Edition.

12. ________, 2019. The Ericsson Mobility Report, June.

13. Facebook, 2015. State of connectivity: A Report on Global Internet Access.

14. Federal Communications Commission, (2010). A Broadband Network Cost Model. OBI
 Technical Report, March.

15. GSMA, 2018. 5G in MENA: GCC Operators Set for Global Leadership.

16. _____, 2019a. The Mobile Economy: Sub-Saharan Africa.

17. _____, 2019b. 2025 Capex Outlook: Financing the 5G Era.

18. Hjort, J. and Poulsen, J., 2019. The Arrival of Fast Internet and Employment in Africa.
 American Economic Review, 109 (3), pp. 1032–79.
You can also read