Pedigree reconstruction reveals large scale movement patterns and population dynamics of wolverines (Gulo gulo) across Fennoscandia - SLU
←
→
Page content transcription
If your browser does not render page correctly, please read the page content below
Department of Wildlife, Fish, and
  Environmental Studies

Pedigree reconstruction reveals large scale
movement patterns and population dynamics
of wolverines (Gulo gulo) across
Fennoscandia

Stephanie Higgins

Master´s thesis • 60 credits
Management of Fish and Wildlife Populations
Examensarbete/Master's thesis, 2019:12
Umeå 2019
Pedigree reconstruction reveals large scale movement patterns
and population dynamics of wolverines (Gulo gulo) across
Fennoscandia
Stephanie Higgins

Supervisor:              Göran Spong, Swedish University of Agricultural Sciences, Department
                         of Wildlife, Fish, and Environmental Studies
Assistant supervisor:    Anita Norman, Swedish University of Agricultural Sciences, Department
                         of Wildlife, Fish, and Environmental Studies
Examiner:                Carl-Gustaf Thulin, Swedish University of Agricultural Sciences,
                         Department of Wildlife, Fish, and Environmental Studies

Credits:                              60 credits
Level:                                Second cycle, A2E
Course title:                         Master Thesis in Biology, A2E – Management of Fish and
                                      Wildlife Populations – Master’s Programme
Course code:                          EX0935
Programme/education:                  Management of Fish and Wildlife Populations
Course coordinating department:       Department of Wildlife, Fish, and Environmental Studies

Place of publication:                 Umeå
Year of publication:                  2019
Title of series:                      Examensarbete/Master's thesis
Part number:                          2019:12
Online publication:                   https://stud.epsilon.slu.se

Keywords:                             wolverine, pedigree, dispersal, genomics, connectivity

  Swedish University of Agricultural Sciences
  Faculty of Forest Sciences
  Department of Wildlife, Fish, and Environmental Studies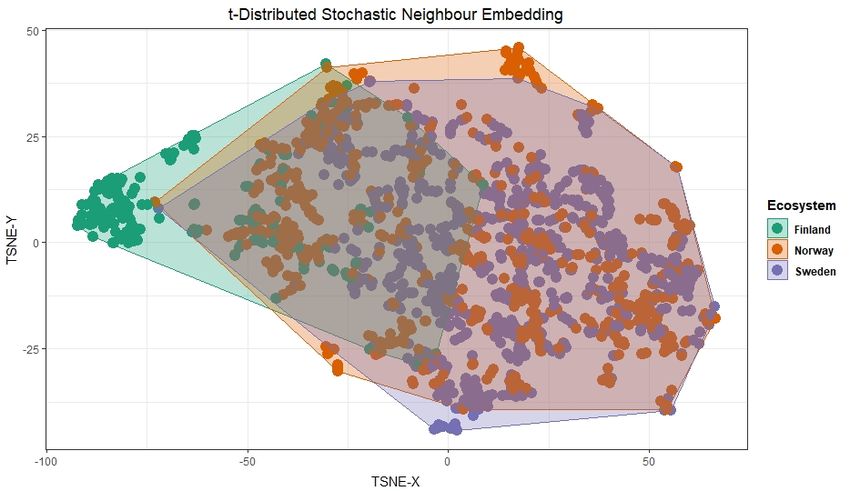
Abstract
Dispersal is a biological imperative for many species, facilitating gene flow and influencing

population dynamics. Modern landscapes are increasingly fragmented, leaving species that

rely on dispersal trapped in ever shrinking areas. Measuring connectivity at the population

level is difficult using traditional tracking methods, especially for species that are rare or

cryptic, but important for both theoretical and applied questions relating to animal movement.

Using genetic monitoring data collected from 2004 to 2018, SNP (single nucleotide

polymorphism) genotyping was used to reconstruct pedigrees of wolverines from the whole

of Sweden, Norway, and Finland. The resulting pedigree contained over 900 individuals, and

six generations. These family triads were then used to identify patterns of natal dispersal for

offspring, and breeding related movement between known mated pairs. The results reveal a

metapopulation of several reproductive cores spread over three countries, with animals

moving across borders in order to breed and disperse. Patterns of movement on this scale

identify sources and sinks across the entire range, with little ambiguity due to sample size or

study site. To achieve favourable conservation status, management scales should reflect the

scales at which populations function.

Keywords: wolverine, pedigree, dispersal, genomics, connectivity
Contents
1 Introduction ........................................................................................................................................... 6
    1.1 Animal Movement ......................................................................................................................... 6
    1.2 Dispersal ....................................................................................................................................... 6
    1.3 Pedigree Reconstruction ............................................................................................................... 7
    1.4 Wolverine ...................................................................................................................................... 9
        1.4.1 Biology ................................................................................................................................... 9
        1.4.2 Genetic Structure and Variation........................................................................................... 10
        1.4.3 Dispersal in Wolverines ....................................................................................................... 11
    1.5 Research Aims ............................................................................................................................ 13
2 Methods .............................................................................................................................................. 14
    2.1 Sampling and Location................................................................................................................ 14
        2.1.1 Norway ................................................................................................................................. 15
        2.1.2 Sweden ................................................................................................................................ 16
        2.1.3 Finland ................................................................................................................................. 16
    2.2 Laboratory Methods .................................................................................................................... 16
        2.2.1 DNA Extraction and SNP Genotyping ................................................................................. 16
    2.3 Analysis ....................................................................................................................................... 17
        2.3.1 Population Assignment ........................................................................................................ 17
        2.3.2 Pedigree Reconstruction ..................................................................................................... 17
        2.3.3 Relatedness Estimation ....................................................................................................... 18
        2.3.4 Dispersal and Movement ..................................................................................................... 18
3 Results ................................................................................................................................................ 18
    3.1 SNP Genotyping ......................................................................................................................... 18
    3.2 Population Assignment ............................................................................................................... 19
    3.3 Pedigree Reconstruction ............................................................................................................. 21
    3.4 Relatedness Estimation .............................................................................................................. 22
    3.5 Breeding-Related Movement ...................................................................................................... 23
    3.6 Natal Dispersal ............................................................................................................................ 25
4 Discussion .......................................................................................................................................... 26
    4.1 Results Summary ........................................................................................................................ 26
    4.2 Pedigree Reconstruction ............................................................................................................. 27
    4.3 Breeding-Related Movement ...................................................................................................... 29
    4.4 Natal Dispersal ............................................................................................................................ 31
    4.5 Metapopulation Dynamics ........................................................................................................... 32
    4.6 Connectivity ................................................................................................................................. 34
    4.7 Transboundary Management ...................................................................................................... 35
5 Conclusions ........................................................................................................................................ 37
    5.1 Applications of Pedigree Analysis ............................................................................................... 37
6 Acknowledgements ............................................................................................................................ 38
7 List of References............................................................................................................................... 38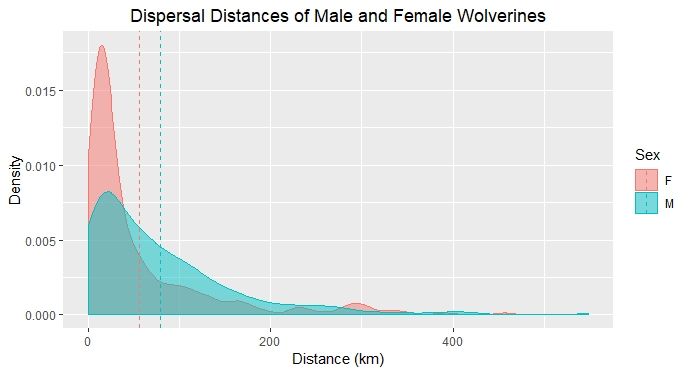
1 Introduction
1.1 Animal Movement

Movement is a vital mechanism for many species worldwide, allowing animals to meet their

nutritional needs, seek protection from changing seasons, find mates, raise young, and

breed. Increasingly, anthropogenic landscape changes have severely diminished the ability

of animals to move, reducing their likelihood of survival (Tucker et al. 2018). Understanding

how animals move across their ranges and between subpopulations is crucial for answering

questions about ecology and conservation (Morales et al. 2010) as well as ensuring

management decisions are well informed and effective in a rapidly changing environment.

Modern wildlife management often limits populations based on administrative boundaries

rather than natural barriers. Many species are monitored on a much smaller scale than that

of their population processes (Trouwborst 2010). To fully understand population dynamics

and movement patterns of a species, it needs to be studied at the scale at which it functions.

Large scale, transboundary cooperation is therefore required in order to best manage the

population.

1.2 Dispersal

Dispersal is the movement of an organism away from their natal range to establish breeding

territory (Matthysen 2012). It is an important driver effecting how populations respond to

landscape-scale changes (Cayuela et al. 2018), and is a vital mechanism facilitating gene

flow, population growth, and contributing to species survival (Lowe & Allendorf 2010). Limited

or non-dispersal is referred to as philopatry, and the combination of dispersal and philopatry

heavily impact the demography of a population (Weaver et al. 1996). There are multiple

reasons for this trait to be selected for, including inbreeding avoidance, kin selection, bet

hedging, and plasticity (Matthysen 2012). For species that rely on dispersal in their life

history, landscape connectivity is an integral part of their ecology and crucial to their long

term persistence. Dispersal ensures adequate gene flow in species that live in low densities

or isolated patches (Brown & Kodric-Brown 1977).

                                                6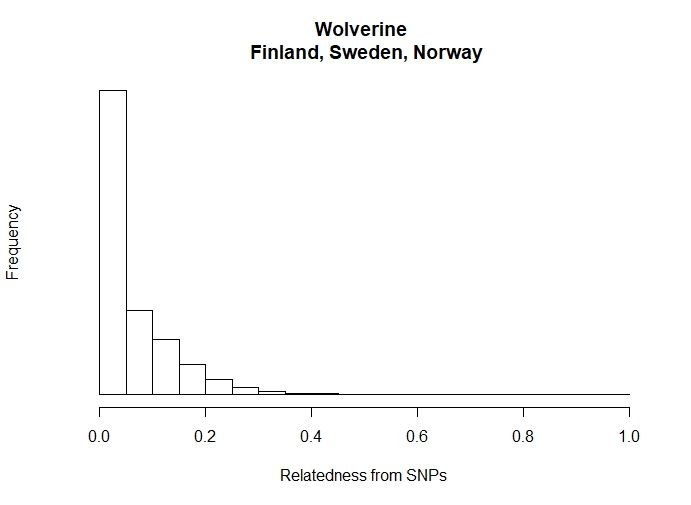
In mammals, dispersal is often sex-biased, with one sex remaining philopatric, and the

opposite sex dispersing, sometimes for extremely long distances (Trakhtenbrot et al. 2005).

This strategy is thought to have evolved due to either inbreeding avoidance or intra-sexual

competition (Pusey 1987). Competition driven dispersal is based on occupancy; if the natal

home range is occupied, only then will there be dispersal to the first suitable unoccupied

territory (Pusey 1987). Dispersal distance and rate are both reliant on turnover rate of

territories (Pusey 1987). Density has been known to affect sex-biased dispersal, with lower

densities resulting in lower competition and less tendency for males to disperse (Costello et

al. 2008).

Dispersal is a crucial aspect of life history for many species, but can be difficult to study

through traditional methods (Spong & Creel 2001). Genetic methods are increasingly used to

answer important ecological questions about evolutionary processes such as dispersal,

plasticity, fitness, selection, and demography (Bérénos et al. 2014).

1.3 Pedigree Reconstruction

Molecular techniques are gaining in popularity, providing new insights into evolution,

behaviour, ecology, and conservation. Genetic information from a population can reveal

barriers to gene flow (Manier & Arnold 2005; Coulon et al. 2004), levels of inbreeding (Keller

et al. 2002; Bulmer 1973), migration patterns (Northrup et al. 2014), mating patterns (Sleater-

Squires 2016), individual reproductive success (Mainguy et al. 2009), and kin relationships

(Kitchen et al. 2005). Genetic techniques also allow novel ways of monitoring populations

and individuals over time (Brøseth et al. 2010; Lucchini et al. 2002).

Direct observations and traditional tracking methods are often unable to provide sufficient

data for meaningful analysis (Spong & Creel 2001). Further, disturbance to the animals and

abnormal behaviour due to capture, handling, and tagging can create bias in the data

(Ibáñez-Álamo et al. 2012). Pedigree reconstruction as a tool for dispersal inference is still

fairly uncommon, but has been shown to be more accurate than traditional mark-recapture

methods (Telfer et al. 2003).

                                                 7
Microsatellites (non-coding, repetitive fragments of DNA) have given way to SNPs (single
nucleotide polymorphisms) as the marker of choice for molecular ecologists conducting
parentage analysis (Flanagan & Jones 2018). In comparisons between the two, SNPs
consistently show equal or better power than microsatellites (Flanagan & Jones 2018). SNPs
are the most common marker used in modern sequencing, but are only emerging in regards
to parentage analysis (Flanagan & Jones 2018). SNPs provide a more reliable and finer
scale of relative differentiation (Huisman 2017). In a comparison between microsatellites (11)
and SNPs (80) during kinship analysis in a population of sockeye salmon (Oncorhynchus
nerka), SNPs provided higher assignment success, especially in analysis of parentage
(Hauser et al. 2011). High resolution SNP data can improve accuracy of pedigree
reconstruction by having a more clear differentiation between types of relatedness. However,
SNPs require more markers in order to have the same accuracy as microsatellites (Huisman
2017).
Pedigree studies have their roots in captive and domestic populations, but are not as widely
used to study wild populations (Haig & Ballou 2002). However, they provide the opportunity
to gain unique and novel insights into individual life-history traits over generations, allowing
fine-scale understanding of populations (Pemberton 2008). Determining levels of inbreeding,
heterozygosity, and kinship, can help us understand the current health of the population, and
also it’s potential for future viability (Haig & Ballou 2002; Keller et al. 2002). Parentage
assignment can be used in management to assess solutions to gene flow barriers, such as
wildlife crossings (Sawaya et al. 2014), and has also been used to manage genetic diversity
and reintroduction of endangered species (McLennan et al. 2018). Population dynamics such
as sources and sinks have also been detected using parentage assignment (Peery et al.
2008).
Pedigree reconstruction has been used to determine relatedness and dispersal patterns in
solitary carnivores (Biek et al. 2006; Zedrosser et al. 2007; Norman & Spong 2015). Modern
research on solitary carnivores has revealed more sociality than previously thought (Elbroch
82017), but their structure and behaviour are exceedingly difficult to document with
observation alone, and often remain unclear without employing genetic methods. However,
new insights can be gained from in depth pedigree analysis for these species. Pedigree
analysis has been used to analyze the relationship between dispersal and harvest pressure
in black bears (Moore et al. 2014), and pedigree reconstruction led to the first evidence of
monozygotic twins in polar bears (Ursus maritimus) (Malenfant et al. 2016).
Reconstructing pedigrees of wild populations provides information on successful
reproductions, individual fitness, survival, and dispersal (Kopatz et al. 2017). This is
especially novel information for species such as the wolverine, that are difficult to observe in
the wild, and where sample sizes for tracking studies have been small due to low density and
capture effort limitations. Genetic sampling has been used to infer spatial behaviour in
wolverines, resulting in very similar home range patterns to traditional telemetry studies
(Bischof et al. 2016).
1.4 Wolverine
1.4.1 Biology
Wolverines occupy tundra, montane, and boreal habitats across circumpolar regions of North
America and Eurasia (Banci 1994). Highly territorial, they occupy large home ranges, which
vary in size depending on region, resource abundance, and mate availability (Sandell 1989).
Wolverine home ranges are variable (Copeland 1996; Banci & Harestad 1990; Hornocker &
Hash 1981), and in Fennoscandia can be anywhere from 25km² to 1,246 km2, with males
averaging 669km², and females averaging 170km² (Persson et al. 2010). They are long
distance dispersers, with previous genetic studies showing they are capable of dispersing
more than 500km (Flagstad et al. 2004).
Due to their large home ranges and territoriality, wolverines live in low densities across their
range (Aubry et al. 2007) which presents an ongoing challenge for monitoring their
populations. In Fennoscandia, densities are approximately one per 500km² (Pasitchniak-Arts
9& Lariviere 1995). Most populations are small and isolated (Ruggiero et al. 2007) and habitat
connectivity is required for adequate gene flow between populations.
Wolverines have slow life history traits, with a low average annual reproduction (Persson
2005). Females reach sexual maturity at 15 months old, but very few females under the age
of three years old were found to reproduce (Persson et al. 2006). Wolverines display high
pregnancy rates but low reproduction (Persson 2005); a high percentage of adult females in
studies of wild populations have been found to be pregnant, however few of these
pregnancies resulted in births (Banci & Harestad 1988). This suggests that the energetic
costs of reproduction are high for this species (Persson 2005). Mustelids with delayed
implantation, such as wolverines, likely experience higher reproductive costs than other
mammals (Harlow 1994). Reabsorbing fetuses is a feature associated with many mustelid
species, and is thought to be related to nutritional requirements (Copeland 1996; Mead et al.
1993).
When pregnancy does lead to live births, kit mortality rate is conservatively one third (Banci
1994). The average female has an interval of >1 years between births, and 2 or more years
is common in some populations (Weaver et al. 1996). The result of this is 0.6 to 1 offspring
per female per year (Magoun 1985), indicating very low reproductive success of wolverines,
but high rates of adult survival at approximately 0.85 annually (Weaver et al. 1996). Females
are not likely to survive or reproduce past eight years (Hash 1987), resulting in the average
female producing only two new females in her lifetime (Weaver et al. 1996). These traits
mean that wolverines are very sensitive to adult mortality factors such as overharvesting.
1.4.2 Genetic Structure and Variation
Studies on genetic structure of isolated populations in Montana and Idaho showed evidence
of significant structuring across the landscape (Kyle & Strobeck 2002; Cegelski et al. 2003).
However, similar studies done on larger, more connected populations in Alaska and Canada
did not detect such evidence of subpopulations (Kyle & Strobeck 2001, 2002). This suggests
wolverines are sensitive to habitat fragmentation and human disturbance, and without
10adequate connectivity are prone to population segregation. Though wolverines do not appear
to treat natural landscape features as dispersal barriers (Kyle & Strobeck 2001), they do,
however, appear to be affected by human development and disturbance (Banci 1994;
Rowland et al. 2003).
In a recent study, Ekblom et al. (2018) sequenced the whole genome of 10 Fennoscandian
wolverines, finding that their genetic diversity is one of the lowest of any species listed with
the IUCN, and significantly lower than many other highly threatened carnivore species.
Wolverines, like other large carnivores in Fennoscandia, were nearly extirpated in the
nineteenth century, shrinking their range to only the most remote mountains on the border
between Norway and Sweden (Walker et al. 2001). This caused a population bottleneck, and
despite legal protections put in place in the 1970’s, too few individuals remained to maintain
genetic diversity (Ekblom et al. 2018). Genetic variation is therefore considerably lower than
the North American wolverine population (Walker et al. 2001).
DNA-based research is not limited to studies on genetics. Genotyping is increasingly used as
a tool for answering broader ecological questions unrelated to the field of genetics, shedding
light on population dynamics, spatial ecology, and fitness (Lamb et al. 2019).
1.4.3 Dispersal in Wolverines
1.4.3.1 Natal Dispersal
Wolverines follow a typical solitary carnivore space use and dispersal pattern (Sandell 1989).
They have the capacity to disperse across large distances; the longest recorded dispersal
event recorded in wolverines is 1,342km by a male animal from Montana to North Dakota
(Packila et al. 2017). Sex biased dispersal is generally accepted to occur in wolverines, with
males being the main dispersers and females being largely philopatric (Banci 1994).
In a Canadian study, male biased dispersal and female philopatry was detected using
mtDNA and allozyme analysis (Wilson et al. 2000). Dalerum et al. (2007) found a high level
of dispersal in their study population of wolverines in Alaska, however there was no evidence
of sex biased dispersal. This could be due to the study population being part of a larger
11metapopulation, making it difficult to detect dispersers within the population (Dalerum et al.
2007).
In a Fennoscandian study, there was no significant difference between male and female
dispersal, in either likelihood or distance (Vangen et al. 2001). Males dispersed 100% of the
time while females dispersed 69% of the time, and females were actually found to disperse
longer distances (60km) than males (51km) (Vangen et al. 2001). This was thought to be due
to heavy control measures on wolverines in the Norwegian study area (Troms), and illegal
hunting in the Swedish area (Sarek National Park) impacting the spatial dynamics of the
study animals (Vangen et al. 2001). In wolverine populations with high harvest pressure,
female territories are frequently left vacant, resulting in higher home range turnover and
promoting lower rates of female dispersal (Vangen et al. 2001). If areas of high mortality are
located near areas of low mortality, this will also influence movement dynamics (Gervasi et
al. 2015). This could have implications for transboundary population health of wolverines in
Fennoscandia, as lack of dispersing females will result in slower population recovery
(Vangen et al. 2001). A more recent study of the Swedish population indicated high site
fidelity among females (Aronsson & Persson 2018).
Previous studies have often failed to detect sex-biased dispersal due to small study areas
(Vangen et al. 2001; Dalerum et al. 2007). The scale of movement in this species would
indicate much larger scales are needed to adequately infer dispersal patterns.
1.4.3.2 Breeding Related Movement
Little is known about wolverine mating systems, or movement unrelated to natal dispersal.
Males can mate with multiple females in a year, and these females are usually holding
territories within the larger male territory (Hedmark et al. 2007). Energetic needs and
reproductive success are the key aspects of female home range size in carnivores (Lindstedt
et al. 1986). For solitary carnivores, the home range size of females is negatively correlated
with population density (Sandell 1989). Female territories rely on resource availability, while
male territories rely on the number of females in the area (Sandell 1989). In Fennoscandia,
12home range size of wolverines tends to be larger than those in North America, resulting in
lower densities (Persson et al. 2010). There are likely multiple reasons for this, including
differences in prey (Lofroth et al. 2007; Koskela et al. 2013), carnivore community (Van Dijk
et al. 2008), anthropogenic disturbance (Scrafford et al. 2018), habitat quality (Lofroth &
Krebs 2007), and human caused mortality (Persson et al. 2009).
Aronsson & Persson (2018) have documented some cases of breeding dispersal in
wolverines, which is exceedingly rare in large mammals. They hypothesize that the high
density of animals in the study area could have led to high competition for space and
resources, forcing females to abandon their territories for less saturated areas.
Harvest pressure in Norway has been implicated as a cause of decreased movement of
females as territory turnover is higher (Vangen et al. 2001; Gervasi et al. 2015). The
imbalance of adult mortality on either side of the Swedish/Norwegian border could have
impacts on population dynamics and movement of wolverines (Gervasi et al. 2019).
1.5 Research Aims
Wolverines have been well studied in specific areas of their range (Landa & Skogland 1995;
Walker et al. 2001; Vangen et al. 2001; Sæther et al. 2005; Hedmark et al. 2007; Persson et
al. 2010), but the species has not been studied at the population level, and much remains
unknown about landscape-scale patterns across their range. Transboundary population level
studies are increasingly important for understanding ecological questions and implementing
successful large scale management issues. Understanding the mechanisms of movement in
a highly vagile species as it relates to political borders is important for successful
management. This study aims to use DNA to reconstruct a pedigree for the entire
Fennoscandian population, and to use this to determine dispersal patterns and population
dynamics across the whole population.
Many wolverine studies have had small sample sizes due to their life history traits, cryptic
nature, and general rarity across their range (Wilson et al. 2000; Vangen et al 2001; Sæther
13et al. 2005). Mark-recapture and telemetry based tracking of wolverines has proven
exceedingly difficult, and generally has resulted in small sample sizes (Copeland 1996;
Wilson et al. 2000). For rare and cryptic species, genetic methods offer the best option for
both routine monitoring and novel research (Norman & Spong 2015; Lamb et al. 2019).
Pedigree reconstruction has previously been used successfully to determine dispersal
distances (Hudy et al. 2010; Cope et al. 2015; Norman & Spong 2015). For species that live
at low densities and are capable of ranging long distances, a larger scale of sampling will
produce more accurate results, ensuring the majority of dispersal events have been captured
in the data. By using a large sample size and large geographical area, patterns of dispersal
are likely to indicate important spatial dynamics on a scale not previously studied, including
sources, sinks, and connectivity in relation to political boundaries.
Using genetic data collected over fourteen years, this research aims to investigate the use of
pedigrees to further understand dispersal patterns and population dynamics of the
Fennoscandian wolverine population. For wide ranging and cryptic species that are
notoriously difficult to study using traditional methods, molecular techniques allow us to
gather more information with far less time, cost, effort and disturbance to the animals.
2 Methods
2.1 Sampling and Location
Fennoscandia is made up of Norway, Sweden, and Finland, and is bordered to the east by
Russia. The area is mostly boreal forest, alpine, and tundra biomes, and today contains the
entirety of the European wolverine population (Linnell 2014).
A total of 1711 individuals (789 males and 922 females) were sampled between 2004 and
2018 through government monitoring of the species in Norway, Sweden, and Finland. By
using long term data collected from Fennoscandia, we are able to get the most complete
picture of the entire remaining wolverine population in Europe. This has resulted in the
largest sample size of wolverines recorded in the literature: n = 632 (Landa & Skogland
1995) n = 671 (Kyle & Strobeck 2002) n = 901 (Aubry et al. 2007).
14Figure 1: Locations of male and female samples across Fennoscandia from
2004-2018 produced with R package ggmap (Kahle & Wickham 2013).
2.1.1 Norway
In Norway, carnivores are monitored by the Norwegian Environment Agency (Miljø-
Direktoratet), and the Norwegian Institute for Nature Research (NINA). Norway maintains
strict controls over population numbers of its carnivores, and the target for wolverines is 39
15reproductions per year (Norwegian Environment Agency 2017). Individuals are culled to
manage both population numbers as well as reduce livestock depredations, and as such
both scat and carcasses were available for DNA analysis. A total of 708 individuals were
sampled in Norway, 396 females and 312 males, between 2004 and 2018.
2.1.2 Sweden
Carnivores in Sweden are closely monitored by the Swedish Environmental Protection
Agency (Naturvårdsverket) through the Swedish County Administration Boards
(Länsstyrelsen) by recording tracks, scats, scent markings, sightings, and livestock
depredations. All animals killed under special licenses, or animals found dead, are sent to
Länsstyrelsen for examination and sampling. This extensive monitoring effort provides a
detailed, longterm dataset with information on a large proportion of the Swedish wolverine
population.
Samples from 821 individuals were collected between 2004 and 2018, consisting of 388
males and 433 females. Samples were collected by the County Administrative Boards in the
counties of Västerbotten, Norrbotten, Västernorrland, Jämtland, Värmland, Södermanland,
Gävleborg, and Dalarna counties. DNA was extracted from scat and tissue samples.
2.1.3 Finland
The Finnish Ministry of the Environment is responsible for carnivore monitoring in Finland.
Natural Resources Institute Finland (Luonnonverkeskus) conducts research and the Finnish
Forest and Park Service (Metsähallitus) conducts routine population monitoring. A total of
182 individuals were sampled in Finland, 89 males and 93 females, between 2004 and 2018.
2.2 Laboratory Methods
2.2.1 DNA Extraction and SNP Genotyping
DNA was extracted from tissue samples using DNeasy Blood and Tissue Kit (Qiagen Inc.,
Hilden, Germany) and from lower quality scat and scent marking samples using Maxwell 16
MDx Instrument (Promega, Madison).
16PCR (polymerase chain reaction) was performed on the Finnish, Norwegian, and some
Swedish samples at NINA (Norwegian Institute of Nature) while most of the Swedish
samples were analyzed at SLU Umeå (Swedish University of Agricultural Sciences). For
quality control and to determine error rates, 104 samples were analyzed in duplicate in both
laboratories.
Specific Target Amplification primer (STA) and Locus Specific Primer (LSP) were used as
pre-amplification for the SNP (single nucleotide polymorphism) regions (Norman & Spong
2015). Genotyping was done using 96 SNPs in a 96 sample x 96 marker chip (Fluidigm, San
Francisco, CA). This set of markers has previously been found to reliably identify animals to
the individual level (Kleven et al. 2019).
2.3 Analysis
2.3.1 Population Assignment
Spatial Analysis of Principal Components (sPCA), multidimensional scaling analysis (IBS
Distance), and T-Distributed Stochastic Neighbour Embedding (t-SNE) were done in R using
packages adegenet (Jombart 2008) and SNPRelate (Zheng et al. 2012).
2.3.2 Pedigree Reconstruction
Parentage assignment was done using FRANz (Riester et al. 2009). Total population (Nmax
3000) was estimated using the last three years of sampling and the most recent census data
indicating a total Fennoscandian population of 1230 animals (Linnell 2014; Gervasi et al.
2015; Natural Resources Institute Finland 2016). This indicated that approximately 58% of
the total wolverine population had been sampled. Maximum number of possible males
(Nmmax 1370) and females (Nfmax 1630) were set using the sex ratio of the sample and
applied to the maximum population size. Only triads were used in pedigree construction, as
dyads do not adequately identify the direction of generations. Pedigree visualization was
done using R package kinship2 (Sinnwell et al. 2014).
172.3.3 Relatedness Estimation Identity by Descent (IBD) was calculated using Maximum Likelihood Estimation (MLE) in the R package SNPRelate (Zheng et al. 2012). 2.3.4 Dispersal and Movement Dispersal and mating distances were estimated using the parent-offspring triads acquired from the pedigree analysis. Dyads were not used in dispersal analysis since the direction of the relationship cannot be determined without both parents. While dispersal distance can be gleaned from dyads, population dynamics would not be evident without directionality. Distances between parents with confirmed offspring, and between each mother and each offspring were measured using the pointDistance function in the R package raster (Hijmans et al. 2015). 15 offspring had been recorded at the same location as their mother during sampling, indicating they were too young to have dispersed, and were removed from further analysis. Mean distances between male and female offspring were compared using an independent two group t-test in R and visualized in a density plot using the package ggplot2 (Kahle & Wickham 2013). 3 Results 3.1 SNP Genotyping Of 1711 individual samples genotyped, 1704 were used in the analysis. Despite the data being previously filtered for duplicates, IBD revealed 7 comparisons where r = >0.9, containing
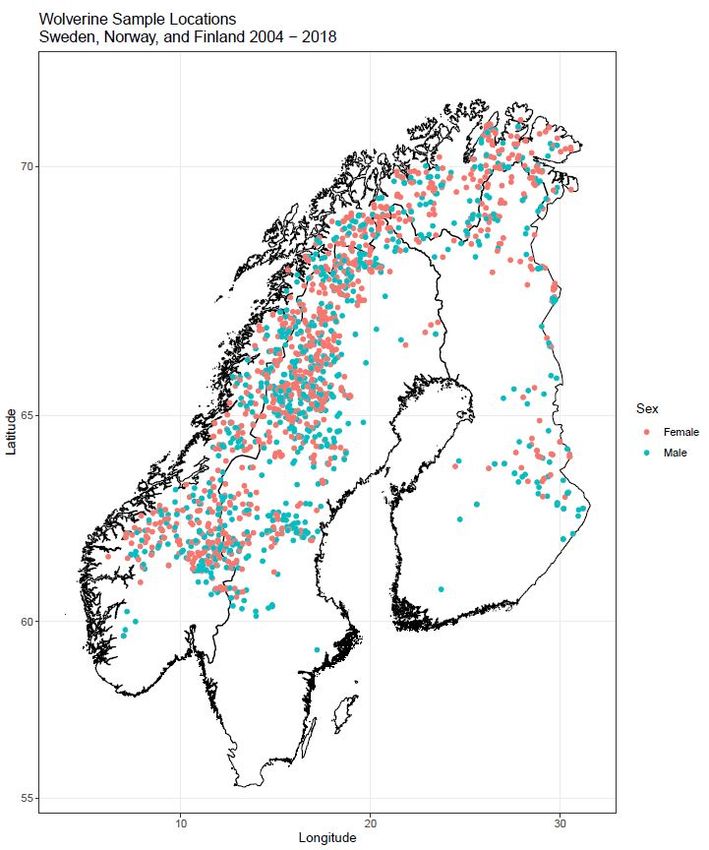
3.2 Population Assignment

                       Figure 2: Multidimensional scaling analysis

                 Figure 3: T-Distributed Stochastic Neighbour Embedding

                                          19
Identity by state (IBS) and t-distributed stochastic neighbour embedding (tSNE) analysis
indicates that the Norwegian and Swedish animals have a lot of genetic overlap, while most
of the Finnish animals are separate. The few Finnish data points mixed in with the Norwegian
population are part of the northern Finnish population, while the cluster that is entirely
separate is the Karelian population. Few animals appear to move from Karelia to northern
Finland, and much of these dynamics could be occurring in Russia.
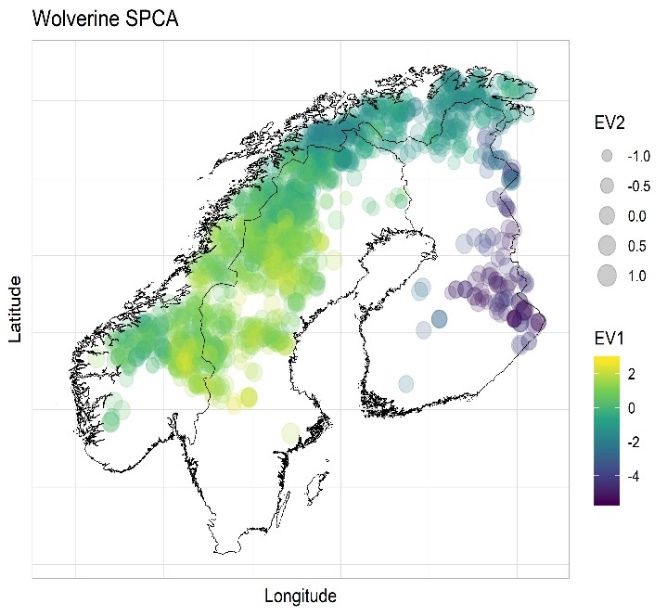
Figure 4: Spatial analysis of principal components
The sPCA shows a clear arc of historical gene flow from southern Norway and Sweden
across the arctic, and down into Finland. The Karelian population in southern Finland (seen
in purple) does not have significant connection to Fennoscandia (seen in green), however
there is some indication of Karelian animals moving north into the high arctic along the
Russian border (Figure 4). Rather than spatial structuring by country, we see the bulk of the
20population in boreal Norway and Sweden (seen in yellow and green) appears to be well connected. The southern population in Norway, often thought to be separate from the main population, appears here to be well connected to the rest of Norway and Sweden. It also looks to have genetic influence from the far north. The high arctic region (seen in blue) contains animals from all three countries, and looks to maintain some distinction from both Karelia and Boreal Norway/Sweden. 3.3 Pedigree Reconstruction Due to the error rate of the samples (3 and posterior probability was
Figure 5: Pedigree plot for all triads in the wolverine population
                between 2004 and 2018. Dotted lines indicate the same individual.

3.4 Relatedness Estimation

In a total of 1,454,365 pairwise comparisons, 0.5 indicating inbreeding. Approximately 3%

(41,935) of comparisons were indicative of second order kin. 55% (799,620) fell between

unrelated and second order kin. Approximately 40% (592,051) of pairwise comparisons were

unrelated.

                                                22
Figure 6: Frequency of coefficient of relatedness (r).
3.5 Breeding-Related Movement
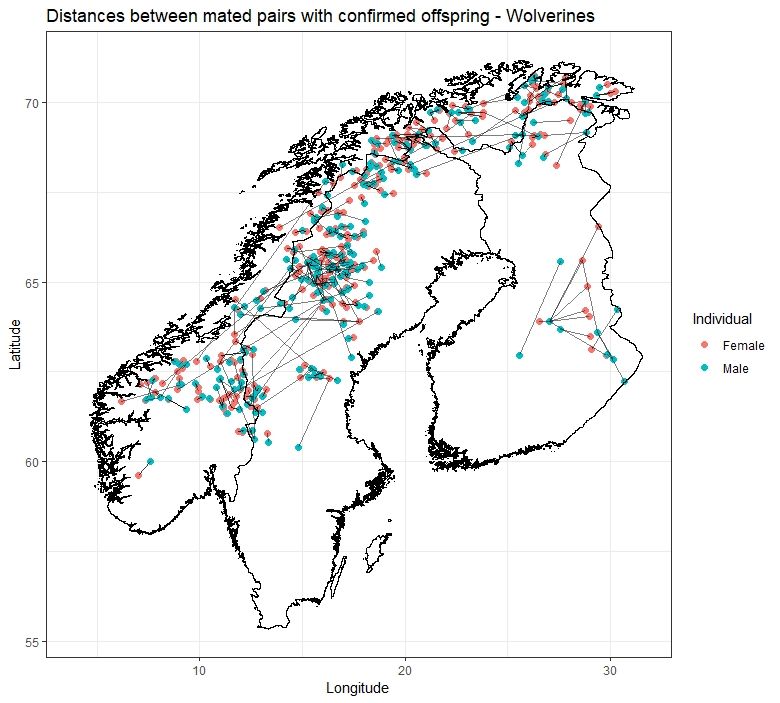
Our data contained 557 matings (pairs of individuals that has produced confirmed offspring)
apparent from the triads used in the pedigree. The distances between these mated male and
female pairs was measured from 0 km to 631.3 km with a mean distance of 42.9 km between
parents. In pairs with a distance of 0 km, it is likely the samples were collected at a den site,
resulting in the exact same coordinate being recorded. Since details on individuals were not
available for the majority of the samples, it is possible some animals were sampled as
juveniles, prior to their dispersal movements (at approximately two years of age), accounting
for such long distances.
23Figure 7: Distances between known mated pairs with confirmed offspring.
Of the 557 recorded matings, 101 involved transboundary movement. The majority of these
movements (47.5%) were males from Sweden traveling to Norwegian females. A large
portion (31.6%) were males from Norway traveling to Swedish females. Between Norway
and Finland, 15.8% were males moving from Finland to Norway, with the remaining 5%
consisting of males moving from Norway to Finland. There were no recorded matings
between animals in Sweden and Finland.
243.6 Natal Dispersal
In total, 542 dispersal events were captured during the study period. Fifteen mother-offspring
pairs were discarded in analysis as they were located at exactly the same coordinates,
indicating sampling at the den location, and the offspring would then be too young to have
dispersed. There was significant difference in dispersal distance between males and females
(p = 0.001, 95% CI -36.77, -9.4). Mean dispersal distance was 55.6 km for females and
78.7km for males. Males ranged from 0.1 km to 548 km. Females ranged from 0.6 km to 456
km. It is possible some of the individuals with very low dispersal measurements were in fact
animals that were still dependent on their mothers, however it can’t be ruled out that these
animals didn’t take over a dead parent’s territory rather than disperse further.
Figure 8: Difference in dispersal distances between male and females wolverines (p = 0.001).
There were 104 animals determined to have dispersed across political borders. Of these, 52
animals dispersed from Sweden to Norway, and 31 animals dispersed from Norway to
Sweden. Less dispersal was seen between Norway and Finland: eight animals dispersed
25from Finland to Norway and 13 animals dispersed from Norway to Finland. There were no
dispersals between Sweden and Finland captured in these data.
Figure 9: Dispersal distances between mothers and their offspring across Fennoscandia.
4 Discussion
4.1 Results Summary
There is evidence of gene flow throughout Fennoscandia, mostly between Sweden and
Norway, but some between Finland and Norway. First order kin did not move at all between
26Sweden and Finland. Pedigree reconstruction revealed 557 triad assignments and over 500
dyad assignments. Pairwise kinship analysis resulted in approximately 3000 first order kin
pairs, and approximately 40,000 second order kin pairs. Males traveled as far as 631 km to
mate with a female, with a mean distance of 42.9 km between mated pairs. Nearly half (47%)
of transboundary matings occurred when males moved from Sweden to Norway and 31%
occurred when males moved from Norway to Sweden. Few (16%) international matings were
males moving from Finland to Norway, with only 5% being males moving from Norway to
Finland. There were no transboundary matings between animals from Sweden and Finland.
Males dispersed significantly further than females, with the longest recorded dispersal at
548km. Transboundary dispersal showed lots of exchange between Norway and Sweden,
with 50% of transboundary dispersals moving from Sweden to Norway, and 30% moving
from Norway to Sweden. 13% of dispersals went from Norway to Finland, and 8% from
Finland to Norway. We recorded no dispersals between Sweden and Finland. There was no
movement between the Finnish Karelian population and the northern Finnish population
recorded in our data.
4.2 Pedigree Reconstruction
Using the triads identified by FRANz analysis, a pedigree of 943 unique individuals was able
to be reconstructed, revealing six generations in this transboundary population. This
information gives a much more complete picture of many aspects of life history than
traditional tracking methods. The depth of information gained from long-term genetic data is
simply not possible to get from traditional observational data for most species.
Some of the pedigrees reconstructed from this sample were incredibly complete, and
showed up to 6 generations (Figure 11). With this information, we can identify individuals that
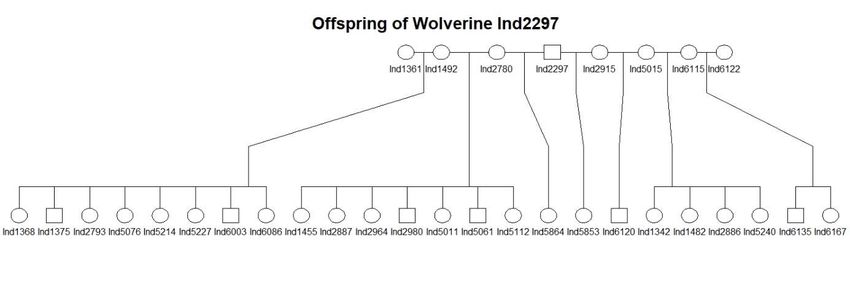
are especially reproductive, such as Ind2297 in Norway (Figure 10). This male fathered at
least 24 kits with 7 different females. Of these, 18 were females, which are a significant
contribution to the population. We can also identify individuals where inbreeding has
occurred, such as Ind5133 (Figure 12), whose father is also her grandfather (r value between
27Ind5133 and Ind1460 = 0.8). This information is valuable in learning about individual fitness
as well as movement, and can be combined with other ecological data to answer further
questions regarding land-use, movement barriers, and habitat patterns (Lamb et al. 2019).
Figure 10: Isolated pedigree for Ind2297 and known offspring and mates
illustrates ability to identify highly successful reproductive individuals
Figure 11: Isolated pedigree for Ind5854 illustrates ability to
capture several generations for one individual
28Figure 12: Isolated pedigree for Ind5133 is a visualization of inbreeding.
The father of Ind5133 is also her grandfather resulting in r = 0.8 between Ind1460 and Ind5133.
4.3 Breeding-Related Movement
The distances measured between mated pairs in this sample are indicative of a single
sample taken at one point in an animal’s lifetime, and as this is a highly vagile species, with
the potential for very large territories, their locations when sampled are not absolute. Figure 7
could be illustrating multiple things at once. It could be capturing individuals before they had
dispersed from their natal ranges. It could be capturing males that are nomadic, although this
is not thought to occur in wolverines as they are considered extremely territorial (Persson et
al. 2010). Overall, figure 7 clearly illustrates that males often end up mating with females a
significant distance from where they were born, or even where they hold territory.
Very little research has been done on breeding-related movement in wolverines (Hedmark et
al. 2007). Since male territories can be up to 1,246 km2 (Persson et al. 2010), it would be
normal for a male to travel the length of his territory to access neighbouring females. The
longest breeding-related movement in our analysis was recorded at 631.3km with a mean
distance of 42.9km. This suggests most males are likely mating with females in neighbouring
29territories, but that some may be traveling longer distances in order to find females. Since
female wolverines are unlikely to reproduce before age 3 (Persson et al. 2006), this could
indicate low availability of females compared to males in some areas. In wolverines, male
home range size and space use is dependent on female density in the area (Persson et al.
2010). In Fennoscandia, where home ranges are some of the largest recorded in the species
(Persson et al. 2010), this could indicate lower densities than found in North America, leading
to more breeding-related movement in order to locate suitable mates.
On the other hand, if breeding-related movement is carried out by the female, it could be due
to high rather than low densities (Aronsson & Persson 2018). Female densities tend to be
based on resource availability, so higher competition for resources in a certain area could
lead females to abandon their territories and seek out less competitive areas (Aronsson &
Persson 2018).
In solitary carnivores, spatial distribution of males and females can change throughout the
year, with males moving towards females during the mating season (Sandell 1989). In brown
bears, male territories on the edges of the population were larger than in core areas (Krofel
et al. 2010). This is likely due to lower competition with conspecifics (Dahle & Swenson
2003). There tend to be more males on the periphery of populations in species with male-
biased dispersal (Kojola et al. 2003). Male bears have been observed to move from the outer
edge of the population into the source areas in order to have access to females (Krofel et al.
2010).
Figure 7 shows the connectivity of the landscape in terms of viability for reproduction.
Wolverines, like many carnivores, rely on large uninterrupted spaces to allow them to meet
their nutritional needs, hold territory, and find mates. In the absence of this, corridors enable
them to move from one space to another in order to enable these important processes. While
dispersal is an important mechanism for inbreeding avoidance and population expansion,
long distance dispersal can also lead to reduced reproductive success as males on the
expansion front have less access to females (Krofel et al. 2010).
304.4 Natal Dispersal
Vangen et al. (2001) found no significant difference in dispersal distances between males
and females, and in that study females actually dispersed further than males (60km and
51km, respectively). However, they used a sample size of 24 individuals from two sites in
what are identified in our results as the core reproductive areas in northern Sweden and
Norway. The results from Vangen et al. (2001) may be representative of the trends in these
areas, but the same overall pattern is not indicated in our results from the rest of the
population.
The results of both the natal dispersal movements and breeding-related movements show
population-wide patterns of genetic exchange. The only entirely isolated population is the
Karelian population in Finland, which had no connections with northern Finland or Sweden in
either natal dispersal or breeding related movement. While the northern Finnish wolverines
have some exchange with Norway, there was no record of any animals moving between
Sweden and Finland in our data, despite a dense cluster of reproduction where the three
countries meet (Figures 7 & 9). We had some samples along the border between central
Finland and Russia, but this areas is clearly not facilitating connectivity. The future of the
Karelian population must rely on the influx of Russian animals, and efforts to maintain
connectivity across that border will likely be important to their continued viability.
Harvest pressure has been strongly linked to dispersal behaviour (Moore et al. 2014). In
wolverine populations with high harvest pressure such as in Norway, female territories are
frequently left vacant, and females disperse less as nearby territories become available more
frequently (Vangen et al. 2001). Female wolverines generally show high site fidelity, but
factors may lead them to disperse later in life, a rare behaviour in large mammals (Aronsson
& Persson 2018).
The evolutionary drivers of dispersal can prove risky in a modern world where anthropogenic
factors are quickly transforming the landscape (Kokko & López-Sepulcre 2006). For
wolverines, dispersal is an important aspect of their life history, preventing inbreeding and
31high densities, which negatively impact their survival (Brøseth et al. 2010), and could be an
important factor in allowing them to adapt to a warming climate (Kokko & López-Sepulcre
2006). Although this trait has led to recolonization of areas where they had previously been
extirpated, it also puts them at risk as they move into areas where conflict with humans
makes them unwelcome. Colonization of new areas, and recolonization of previously
occupied areas, relies on dispersal, but mortality rates for dispersers can be up to 50% (Krott
1982), making the process of population expansion a slow one (Ebenhard 1991).
Over half of adult wolverine mortality in Fennoscandia is caused by humans, with 60% of
deaths attributed to poaching, and 10% due to culling (Persson et al. 2009). Cryptic poaching
has a significant impact, with 37% of human caused mortalities assumed to be due to
undocumented poaching (Persson et al. 2009). Anthropogenic mortality is clearly a
significant driver of wolverine population dynamics in Fennoscandia, with implications for
transboundary population health (Gervasi et al. 2015). Most poaching occurs during the
dispersal phase (Persson et al. 2009), further increasing the likelihood of mortality at this
already risky stage of life (Blankenship et al. 2006). It is important to target dispersal areas
for conservation planning, as these are the areas most likely to experience cryptic poaching,
and are also vital to the connectivity of wolverines.
4.5 Metapopulation Dynamics
Previous studies indicate the population in southern Norway was genetically isolated (Walker
et al. 2001), and describe the species range as occurring primarily in the north of
Fennoscandia (Landa et al. 2000). The sampling locations in this study, however, show their
range as having expanded significantly to the south (Figure 1). Flagstad et al. (2004) found
evidence that the southern Norwegian population was founded by animals from the north,
and still continues to receive immigrants from the north. This is in line with our results (Figure
4), which indicate that the southern population is an admixture of animals from the north of
Norway (blue shading) and Sweden (yellow shading). The results of natal dispersal analysis
(figure 9) show no long distance dispersers from the north to the southern area, and very few
32dispersers coming from the northern population clusters at all. There was evidence of more
breeding-related movement from other areas, however, including one of the longest
movements recorded in our results from northern Norway to southern Norway (Figure 7).
While the map of sample locations (Figure 1) show an apparent continuous population,
analysis of movement gained from the pedigree reconstruction indicates a metapopulation
with varying degrees of connectivity. The core populations are where the breeding individuals
are located and are sources, while the areas between and around them represent sinks or
dispersal corridors. There is significant connectivity between the three core areas in northern
Sweden and northern Norway, with limited connectivity between the southern cluster and the
rest of the population. A small cluster has formed in central Sweden that appears to be the
start of an expansion front, with most disperses coming from the southern cluster. There
were several reproductions here, so this is not likely a sink, but as an area of expansion,
these individuals are at higher risk than those in the core areas (Krofel et al. 2010).
There is less connectivity between the southern cluster and the rest of the population than
anticipated, especially on the Swedish side. The sPCA (Figure 4) indicates there is gene flow
throughout these areas, but that could point to historical connectivity rather than current
movement. Our data only captured 2 dispersal events crossing this void within Sweden, with
more in Norway (Figure 9). There was more activity when looking at mated pairs between the
two clusters, but still a noticeable gap is present within the county of Jämtland (Figure 7).
Similar population patterns are seen in Fennoscandian brown bears, where a significant gap
in density occurs in central Jämtland (Kindberg et al. 2011).
The movement maps (Figures 7 and 9) show some clear clusters of movement, indicating
core reproductive areas. A large productive area in northwest Sweden appears to be a large
cluster, with offspring migrating into Norway, but most of the mothers are located in Sweden,
suggesting a population sink on the Norwegian side. Another large cluster is located at the
northern tip of Sweden where the three countries meet. This one appears to have mothers in
all three countries. The area towards the coast and the Finnish border in northern Sweden
33looks to be a sink, with three female and two male dispersers but no reproduction. The
southern Norway population, once thought to be isolated (Walker et al. 2001) appears well
connected with the southern Swedish population. The Karelian population in southern
Finland, already thought to be disconnected from the rest of Fennoscandia, has a significant
gap in dispersal, and must rely on connectivity with Russia to maintain its numbers.
The southern Norwegian population appears to be functioning well and expanding, with good
connectivity on the Norwegian side. While it’s important to be aware of the potential barrier
existing on the Swedish side in Jämtland County, some individuals are clearly still able to
move between these areas and maintain gene flow.
4.6 Connectivity
By the early 1900’s wolverines had been extirpated in much of their historic range, with
populations remaining in the high arctic and along the border with Norway and Sweden
(Ekblom et al. 2018). Studies from the early 2000’s map the population as a narrow strip
down the mountain range, with separate areas in southwest Norway and eastern Sweden
(Landa et al. 2000). This population bottleneck has resulted in very low levels of genetic
diversity (Ekblom et al. 2018). Today, it is apparent that wolverines are expanding into
previously held territory, similar to other large carnivores in Europe following legal protections
(Trouwborst 2010). It is clear from our data that wolverines are expanding back into their
historical range, with our southernmost animal (a road mortality) recorded just outside
Stockholm (Figure 1). Maintaining genetic diversity moving forward will rely on understanding
movement patterns and identifying sources, sinks, and barriers to connectivity.
Lowe and Allendorf (2010) divide connectivity into three categories: ecological connectivity,
conservation connectivity, and harvest connectivity. Ecological connectivity requires only
enough immigration to maintain the population growth rate. Conservation connectivity
requires enough dispersal events to maintain population viability, and elimination of this
results in an increase in extinction probability. Harvest connectivity requires the most
34immigration, as it needs to maintain population viability and growth rate despite harvest
pressure. Wolverines are subject to heavy harvest pressure in Scandinavia, through both
legal hunting and illegal poaching. Due to this pressure, prioritizing population connectivity at
its highest level is important to maintain favourable conservation status of this species. Areas
with apparent barriers to movement should be prioritized for future management in order to
promote a better connected metapopulation.
While some long extirpated species are now recolonizing previous territories (Milanesi et al.
2017), more are under severe pressure from loss of habitat and population connectivity vital
to their long-term survival (Boakes et al. 2019). Identifying and maintaining these corridors is
important for the survival of many far ranging species in an increasingly anthropogenic world.
4.7 Transboundary Management
Significant movement between Norway and Sweden was expected, with the majority of these
movements originating in Sweden. Still, there were many animals originating in Norway but
moving into Sweden, indicating Norway is not entirely a population sink. Management in
Norway differs drastically from Sweden and Finland, with extensive lethal control and licence
hunting to keep the population low and address sheep and reindeer depredations (Gervasi et
al. 2015).
Despite a large reproductive cluster in the north where the three countries meet, our data
didn’t record a single movement of first order kin between Sweden and Finland. Within our
sample, only 32 individuals were detected as part of triads in Finland, with a distinctive gap
between north and south clusters, indicating barriers to connectivity within Finland. Finland’s
wolverine population is much smaller than those in Sweden or Norway, with only an
estimated 200-250 individuals (Natural Resources Institute Finland 2019). In Finland,
wolverines are estimated to cause more damage than wolves, lynx, and bears combined
(Natural Resources Institute Finland 2019), creating severe conflict within reindeer
husbandry areas. This conflict could be leading to cryptic poaching, and preventing
movement of animals between northern Finland and the Karelian cluster.
35You can also read