Long-term development of fodder quantity and quality of non-intensively managed grasslands in south-western Luxembourg
←
→
Page content transcription
If your browser does not render page correctly, please read the page content below
Tuexenia 41: xx–xx. Göttingen 2021.
doi: 10.14471/2021.41.002, available online at www.tuexenia.de

          Long-term development of fodder quantity and
          quality of non-intensively managed grasslands
                  in south-western Luxembourg
Langfristige Entwicklung der Futtermenge und -qualität extensiv genutzter
              Grünlandbestände im Südwesten Luxemburgs

           Tobias W. Donath1 , Daniel Viain1 & Simone Schneider2, 3*
           1
             Department of Landscape Ecology, Institute for Natural Resource Conservation,
                       Kiel University, Olshausenstr. 75, 24118 Kiel, Germany;
           2
             Intercommunal Syndicate for Nature Conservation SICONA, 12 rue de Capellen,
                                        8393 Olm, Luxembourg;
 3
   National Museum of Natural History Luxembourg, 25 rue Munster, 2160 Luxembourg, Luxembourg
                     *Corresponding author, e-mail: simone.schneider@sicona.lu

                                               Abstract
    Species-rich non-intensively managed grasslands are among the most threatened ecosystems of Cen-
tral Europe. Therefore, they are the focus of various conservation efforts at the regional, national and
international level. In this context, contractual nature conservation schemes are widely implemented to
ensure conservation of these grasslands through adequate agricultural management. These contracts
preclude the use of fertilizer and allow only one to two cuts per year, starting not before June. In this
study, we analysed data from 468 samples of the first and second cut, from 145 non-intensively man-
aged grassland locations of different vegetation types from grasslands in south-western Luxembourg.
The data cover the period 2001 to 2018. With this data set we assessed the long-term impact of low-
input grassland management on parameters of fodder quality and quantity, and whether the patterns
differ between vegetation types. Based on these findings we evaluated the potential to integrate the
harvested fodder into livestock farming. Not surprisingly, the results revealed a decrease in yield over
the study period. During the same period, levels of energy and protein increased from 2001 to 2018,
while crude fibre content decreased. These changes occurred irrespective of vegetation type. In general,
quality parameters indicated that the harvested fodder does not meet highest requirements, i.e. it could
be fed to livestock during periods of low energy demand, but is unlikely to be suitable for livestock
demanding high quality fodder, e.g. during gestation or lactation. We discuss the implications of these
findings for the advancement of the contractual nature conservation schemes. An adjustment of the
compensation payments that remunerate for the observed decline in yield could help to motivate farm-
ers to continue non-intensive farming on species-rich meadows.
Keywords: contractual nature conservation, extensive grassland management, grassland conservation,
mesophilic and wet grasslands, species-rich meadows
Erweiterte deutsche Zusammenfassung am Ende des Artikels

Manuscript received 26 June 2020, accepted 19 January 2021
Published online 21 May 2021
Co-ordinating Editor: Norbert Hölzel                                                                   1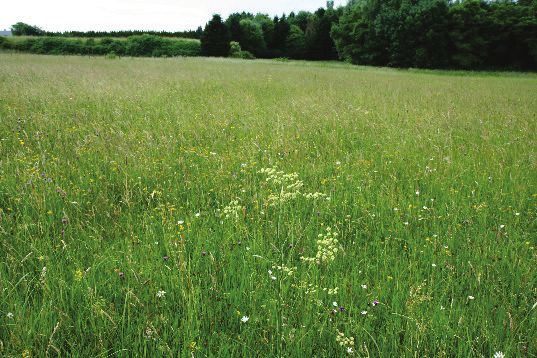
1. Introduction
    Natural and semi-natural grasslands are among the most prominent, largest and species-
rich terrestrial ecosystems in the world (SUTTIE et al. 2005, WILSON et al. 2012, HABEL et al.
2013). The species-rich grasslands in Central Europe evolved in response to continuous
human activities over millennia (BRIEMLE & ELLENBERG 1994, PÄRTEL et al. 2005, HEJC-
MAN et al. 2013) under the prevailing climatic and soil conditions (VANDVIK & BIRKS 2002).
Intensified management, abandonment, and conversion of grasslands into arable fields are
the main reasons for dramatic losses in plant diversity, as well as in associated animal spe-
cies (BLACKSTOCK et al. 1999). Therefore, a wide variety of different plant communities
found in open landscapes are Red Listed and/or protected by the European Union Habitats
Directive (92/43/ECC) and actions to halt and revert this process have been implemented on
national and international levels (SCHNEIDER 2011, 2019).
    The same steep decrease in species-rich grasslands was observed in Luxembourg and
therefore the urgent need to implement long-term conservation schemes became obvious
(SCHNEIDER 2011, 2019). Still, despite intense efforts of Luxembourg to protect and restore
grasslands of high nature conservation value on national and regional levels (MÉMORIAL
2018), the loss of species-rich grassland in Luxembourg continues (EEA 2019). Among the
most prominent and promising efforts to ensure a sustainable conservation of these grassland
habitats is their incorporation in contractual nature conservation (MÉMORIAL 2002, 2012,
2017), where farmers receive compensation payments when they adhere to certain manage-
ment restrictions, e.g. no fertilizers, specified cutting dates. While studies show that these
restrictions are effective in halting diversity loss in grasslands managed accordingly
(PIQUERAY et al. 2016, WOLFF et al. 2020), less information is available about the conse-
quences for fodder quality. The latter has immediate relevance when farmers incorporate the
biomass of species-rich grassland into their farming systems (TALLOWIN & JEFFERSON
1999). In general, the cutting dates imposed by contractual nature conservation tend to lie
outside those periods where highest fodder quality, e.g. high content of crude protein but low
contents of crude fibre, can be expected (TALLOWIN & JEFFERSON 1999, ISSELSTEIN et al.
2005). In addition, the ban on fertilizer may not only lead to a reduction of fodder quantity,
but also of fodder quality (TALLOWIN & JEFFERSON 1999). Even though the relationship
between management and fodder quality and quantity is well established in grass-dominated,
species-poor grasslands (ISSELSTEIN et al. 2005), it seems this knowledge cannot simply be
translated to species-rich grasslands with a higher proportion of forbs, as these, for example,
seem to show greater resilience to losses in fodder quality (TALLOWIN & JEFFERSON 1999,
ISSELSTEIN et al. 2005). While some studies assessed fodder quantity and quality at one point
in time, only a few studies have assessed the long-term effects of management restrictions
imposed within agro-economical management schemes (DIERSCHKE & BRIEMLE 2002).
    In Luxembourg, the nature conservation contracts aimed at non-intensive grassland man-
agement totalled 20 ha in the south-west of Luxembourg in 1993. About 10 years later,
1000 ha were under contract. Currently, about 5200 ha are contractually secured in Luxem-
bourg. Fodder quantity, quality and the value of compensation payments offered are the
linchpins for farmers to take part in contractual nature conservation for grasslands. Although
the compensation payments offered within the framework of contractual nature conservation
schemes aim at compensating losses in fodder quantity and quality that accompany contrac-
tual management restrictions, it is against the self-conception of most farmers to invest
resources to produce biomass without being able to incorporate it into their farming system.

2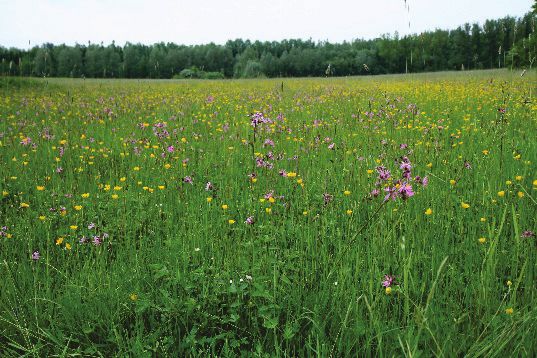
Until the 1960/70s, species-rich grasslands were commonly incorporated into farming
systems, however, progress in agricultural production (mainly increased fertilizer input or
higher cutting frequency) made farmers reluctant to continue this traditional management
(HEJCMAN et al. 2013). Modern management schemes increased the efficiency of grassland
management many-fold, i.e. fodder of high energy content, high crude protein and low crude
fibre in high quantities is by far easier to harvest from species-poor grasslands (TALLOWIN &
JEFFERSON 1999, ISSELSTEIN et al. 2005). Consequently, studies that assess the possibilities
and limits of integrating fodder of species-rich non-intensively managed grasslands into
farming systems are rare (TALLOWIN & JEFFERSON 1999, BULLOCK et al. 2001, FRANKE
2003, DONATH et al. 2004, HOFMANN & ISSELSTEIN 2005, SÜSS et al. 2007, KLEINEBECKER
et al. 2011). It is obvious that in managed grassland systems, productivity – both with
respect to quality and quantity – is inversely related to species diversity (PLANTUREUX et al.
2005, COP et al. 2009). Therefore, there is no immediate economic interest – apart from
subsidies – for farmers to manage grassland systems in compliance with nature conservation
interests. Perhaps, if fodder quantity and quality would at least not deteriorate past a certain
cut-off point in relation to increasing species richness, this would help reconcile the interests
of nature conservationists and farmers.
Therefore, we analysed fodder quality and quantity data from species-rich grasslands
(mainly hay meadows) of different plant communities collected over a period of 18 years by
the Intercommunal Syndicate for Nature Conservation (SICONA). Since 2001, samples have
been taken annually from different, and in some cases the same, areas to document the de-
velopment. Unlike others, our study covers only grasslands that were already classified as
species-rich and of high nature conservation value at the start of the survey.
Specifically, we were interested in answering the following questions: (1) What was the
effect of long-term non-intensive management on fodder quantity and quality? (2) Did the
observed patterns differ between grassland types? (3) What is the overall potential to inte-
grate fodder from non-intensively managed species-rich grassland into livestock farming?
2. Methods
2.1 Grasslands under study
The study sites were located in the south-west of Luxembourg (Fig. 1). This region is a well-known
hot spot for species-rich grassland (SCHNEIDER 2019). Heavy Lias (Medium Lias) soils with high clay
contents dominate in the area (AEF 1995, SERVICE DE PÉDOLOGIQUE 1999). In the central Gutland,
west of the Alzette valley, Luxembourg Sandstone, and further north (near Mersch), Keuper formations
appear (SERVICE GÉOLOGIQUE 1992, AEF 1995). Climatically, the region is under a strong Atlantic
influence with mild winters and relatively cool summers. The mean annual precipitation lies between
850 and 950 mm, and mean annual temperature is 9 °C (AEF 1995, PFISTER et al. 2005). These specific
site conditions and the early initiation of contractual nature conservation more than 25 years ago result
in exceptionally species-rich grasslands (SCHNEIDER 2019).
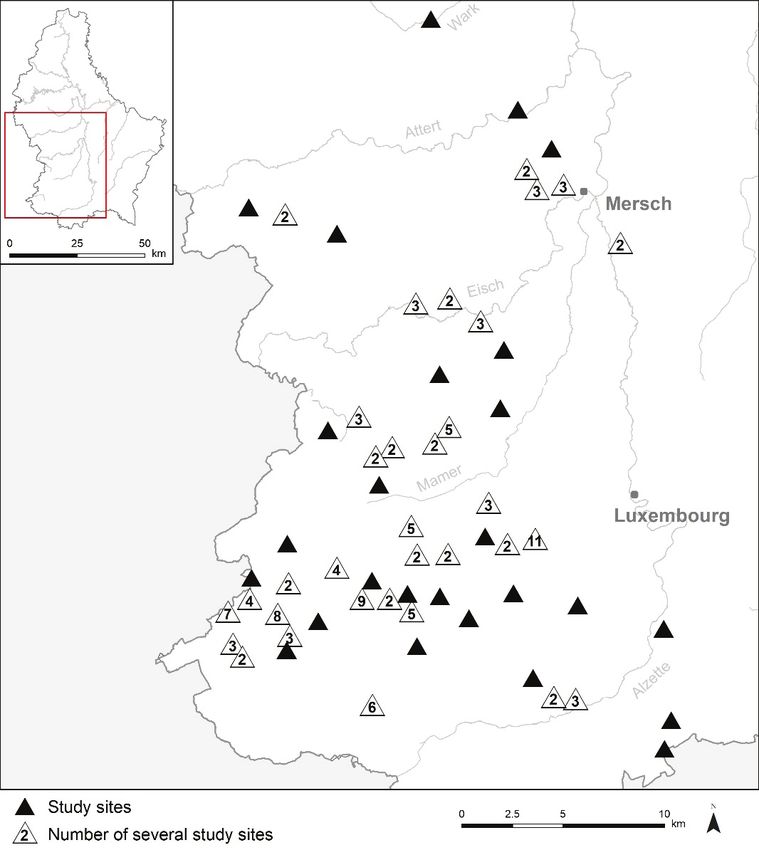
Grasslands included in the present study were classified to four vegetation types according to the
biotope register of Luxembourg (MDDI 2017): lowland hay meadows (FFH 6510), Calthion palustris
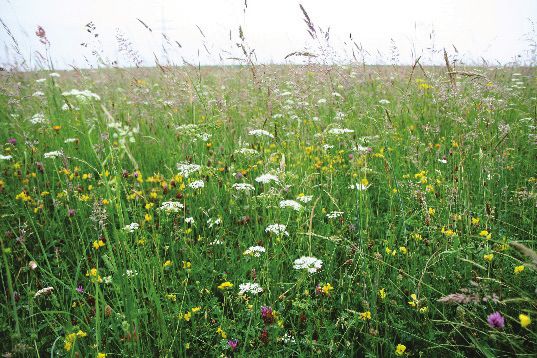
hay meadows, Molinia meadows (FFH 6410) and mesophilic to wet hay meadows (Fig. 2 a–d). The
latter comprises all grasslands that could not be unambiguously grouped to one of the other three vege-
tation types, e.g. for example mostly mesophilic meadows with moist depressions where humidity
indicators dominate the vegetation. Lowland hay meadows are today restricted to only 2900 hectares in
Luxembourg (MDDI 2017); they include the Arrhenatheretum elatioris Braun 1915 in different
3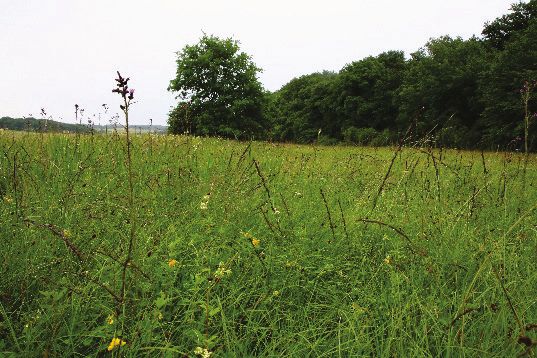
Fig. 1. Location of the study sites. Source map: Topographic map, BD-L-TC, Administration du
Cadastre et de la Topographie Luxembourg.
Abb. 1. Lage der Untersuchungsflächen. Quelle Kartengrund: Topographische Karte, BD-L-TC, Admi-
nistration du Cadastre et de la Topographie Luxembourg.

formations (cf. SCHNEIDER 2011). Calthion meadows (different plant communities of the Calthion
palustris Tüxen 1937, e.g. Bromo-Senecionetum aquatici Lenski 1953) are even rarer, with only about
375 hectares left nationwide; in addition, there are about 620 hectares, which are classified as sedge
marshes, wet fallows and fens (SCHNEIDER 2011, 2019, MDDI 2017). Molinia meadows as Molinion-
alliance (Molinion caerulea W. Koch 1926) are the rarest species community included in the present
study, only occurring on around 8 hectares (SCHNEIDER 2011, 2019, MDDI 2017). This means that
these plant communities can be found in only just below 6% of the total grassland area of Luxembourg.
Most of these formerly widespread species-rich grasslands were lost to intensified management or
abandonment (MDDI 2017, SCHNEIDER 2019).

4
a)                                                    b)

  c)                                                    d)

Fig. 2. The study sites contained mainly a) lowland hay meadows, b) Calthion palustris hay meadows,
c) Molinia meadows, as well as d) a combination category with mesophilic to wet hay meadows (Pho-
tos: S. Schneider, 2008).
Abb. 2. Die Untersuchungsflächen umfassten vor allem a) Magere Flachlandwiesen, b) Sumpfdotter-
blumenwiesen, c) Pfeifengraswiesen sowie d) eine Kategorie mit mesophilen bis feuchten Grünland-
flächen (Fotos: S. Schneider, 2008).

                                2.2 Biomass sampling and analysis
     Starting in 2001, at each grassland under study, a representative area of 100 m2 was chosen for
biomass sampling. Within these 100 m², a frame (wood, metal) of 1 × 1 m was placed five times (sub-
samples in the centre and at each corner) and all biomass within these five square meters was cut with
scissors about 5–7 cm above ground. The biomass of these five subsamples was merged into one sam-
ple, packed in a plastic bag, cooled and immediately sent to the laboratory of the agricultural admin-
istration (Administration des services techniques de l’agriculture). Sampling of the first cut usually took
place a few days before June 15th, which is the earliest mowing date in the nature conservation con-
tracts, and sampling of the second cut took place between early August and late September. The sam-
ples of the first and second cut were taken at the same location within a grassland. The current study
includes data from 2001 until 2018. Due to logistical constraints, no sampling took place in 2004, 2011
and 2016. During the study period, the majority (107) of the grassland locations was sampled once
(i.e. first and second cut), while 38 locations were sampled repeatedly, varying from twice (30 loca-
tions) up to twelve times. Therefore, this study comprises 468 samples from 145 non-intensively man-
aged grassland locations (Fig. 1).
     Biomass samples were analysed by near-infrared spectroscopy (NIRS; VDLUFA 2004, SHENK et
al. 1989). The following parameters were assessed or derived: dry matter (dm, dt/ha), crude protein
(% dm), digestible crude protein (g/kg dm), true protein digested in the small intestine (DVE, g/kg dm;
Dutch system comparable to the German usable crude protein nXP; BRUIJNEN 2009), crude fibre
(% dm), crude ash (% dm), VEM/kg dm (“voeder eenheden melk” / fodder units milk; Dutch system
comparable to the German net energy content for lactation; NEL MJ/kg TS; BRUIJNEN 2009),
VEVI/kg dm (“voeder eenheden vleesvee intensief” / feed units meat livestock intense) as well as

                                                                                                         5
nitrogen (% dm), phosphorus (g/kg dm), potassium (g/kg dm), calcium (g/kg dm), magnesium (g/kg
dm), sodium (g/kg dm). Furthermore, energy yield per ha and year (kVEM/ha) was calculated based on
dry matter yield and energy content (VEM/kg dm).
2.3 Data analysis
To account for differences in sampling intensity between years and short-term variability, data
sampling periods were established, i.e. data from 2001 to 2003, 2004 to 2007, 2008 to 2011, 2012 to
2014 and 2015 to 2018 was combined for the data analysis. Since no data was available for 2004, 2011
and 2016, all sampling periods include data from three different years. Data across vegetation types was
analysed employing a two-factorial ANOVA to assess the influence of the main vegetation type (k = 4)
and sampling period (k = 5), and their effect on the response variables. In case of significant ANOVA
results indicating the existence of relevant general patterns, pairwise differences between sampling
periods were assessed by Tukey-test (QUINN & KEOUGH 2002). Prior to the analysis, residuals were
visually checked for normal distribution and homogeneity of variances (QUINN & KEOUGH 2002). To
assess differences in the response variables between the sampling periods within vegetation types, we
calculated 95% confidence intervals of the means; when these do not overlap this indicates a significant
difference (QUINN & KEOUGH 2002). Data analysis was conducted using SPSS Statistics 24.0 (IBM
CORP. RELEASED 2016).
3. Results
Across vegetation types, total yield declined by about one third from the first to the fifth
sampling period (Fig. 3). Decline did not take place continuously, but was greatest from the
2nd to the 3rd sampling period. Decline in yield varied considerably between vegetation types,
e.g. from 19% in Molinia meadows, to 39% in Calthion hay meadows. This strong decline in
total yield, as well as in yield between the 1st and 2nd cutting date, led to a high significance
of the sampling period, which alone explained between 16% and 23% of variance (Tab. 1).
In contrast, vegetation type was only marginally significant in the case of the 2nd cut yield
(PES = 2%). This and the, in general, non-significant interaction between vegetation type
and sampling period, indicate congruent changes in yield patterns of the grasslands over time
(Fig. 3).
Table 1. ANOVA results for the effects of vegetation type, period, and their interactions on total yield,
as well as yield of the 1st and 2nd cut, respectively; df = degrees of freedom, MSQ = mean sum of
squares, p = error probability, PES = partial eta squared in percent.
Tabelle 1. ANOVA-Ergebnisse für die Auswirkungen von Vegetationstyp, Periode und deren Wech-
selwirkungen auf den Gesamtertrag sowie auf den Ertrag des 1. und 2. Schnittes; df = Freiheitsgrade,
MSQ = mittlere Summe der Quadrate, p = Fehlerwahrscheinlichkeit, PES = partielles eta-Quadrat in
Prozent.
Total biomass 1st cut 2nd cut
Source df MSQ p PES df MSQ p PES df MSQ p PES
Intercept 1 205352 < 0.001 90 1 103247 < 0.001 87 1 17567 < 0.001 76
Vegetation type 3 124 0.32 2 3 186 0.050 4 3 36 0.243 2
[VT]
Period [P] 4 1648 < 0.001 23 4 749 < 0.001 17 4 268 < 0.001 16
P * VT 12 117 0.35 6 12 78 0.348 6 12 21 0.640 4
Error 214 105 213 70 214 25
6Fig. 3. Total biomass yield across vegetation types and separately for the four vegetation types (mean ±
95% confidence interval). In the case of the data across vegetation types, different letters indicate
significant differences between periods assessed by a post-hoc Tukey-test.
Abb. 3. Gesamter Biomasseertrag über alle Vegetationstypen und getrennt für die vier Vegetations-
typen (mittleres ± 95 % Konfidenzintervall). Bei den Daten über alle Vegetationstypen weisen
verschiedene Buchstaben auf signifikante Unterschiede zwischen den Zeiträumen hin, die mit dem
Tukey-Post-hoc-Test bewertet wurden.
Development of the energy content (VEM) of the biomass harvested at the first and
second cut showed a diametrical pattern to total yield (Fig. 4a, b). In both across, as well as
within the vegetation types, statistical analysis (cf. Supplement E1) of energy content
showed an increase over the years that did not significantly differ between vegetation types.
Albeit notable, this increase was relatively small, increasing by about 4% at the first cut and
by about 8% at the second cut. While energy content of the first and second cut was signifi-
cantly influenced by sampling period, only energy content of the second cut differed
between vegetation types (Supplement E1). VEVI, the energy parameter, which provides
information about the adequacy of the fodder for meat production, showed differences
between sampling periods and vegetation types analogous to VEM (Supplement E1).
Despite this increase in energy content, energy yield per ha was halved from the first to
the fifth sampling period (Fig. 5). This pattern was mainly explained by sampling period,
and only for the first cut was a significant vegetation type effect revealed (Tab. 2). In gen-
eral, decline in energy yield per ha differed considerably between vegetation types. While in
mesophilic to wet meadows energy yield per ha dropped by about one third, Molinia mead-
ows showed a drop of 60% in energy yield per ha.
Across vegetation types, the parameters of protein content, i.e. crude protein (Fig. 6),
digestible crude protein and DVE (Supplement E1), were always higher in the second com-
pared to the contents in the first cut. Still, protein parameters in biomass of first and second
cut showed a common pattern of significant increase from first to third and first to fourth
sampling period, respectively, but no significant interaction between vegetation type × sam-
pling period. Only in the case of DVE of the 1st cut did the analysis reveal a significant effect
of vegetation type (p = 0.01). These general trends of sampling period were also found
7a)
b)
Fig. 4. Energy content of biomass at the a) first and b) second cut (mean ± 95% confidence interval). In
the case of the data across vegetation types, different letters indicate significant differences between
periods assessed by a post-hoc Tukey-test.
Abb. 4. Energiegehalt der Biomasse des a) ersten und b) zweiten Schnittes (mittleres ± 95 % Kon-
fidenzintervall). Im Falle der Daten über alle Vegetationstypen weisen verschiedene Buchstaben auf
signifikante Unterschiede zwischen den Zeiträumen hin, die mit dem Tukey-Post-hoc-Test bewertet
wurden.
within vegetation types (Fig. 6, Supplement E1). Since protein content is derived from the
nitrogen content of the biomass, the above patterns are also true for nitrogen content in the
first and second cut.
In contrast to the protein parameters, crude fibre content was higher in the first cut than
in the second cut, where it dropped from 30% to about 25% (Supplement E1). While in the
first cut vegetation type had a significant effect, the vegetation type × sampling period was,
again, not significant. Although levels of crude fibre were significantly lowest in the third
sampling period, differences in absolute numbers were rather small and values were not
8Table 2. ANOVA results for the effects of vegetation type, period, and their interactions on total energy
yield, as well as energy yield of the 1st and 2nd cut, respectively; df = degrees of freedom, MSQ =
mean sum of squares, p = error probability, PES = partial eta squared in percent.
Tabelle 2. ANOVA-Ergebnisse für die Auswirkungen von Vegetationstyp, Periode und deren Wechsel-
wirkungen auf den Gesamtenergieertrag sowie den Energieertrag des 1. und 2. Schnittes; df = Frei-
heitsgrade, MSQ = mittlere Summe der Quadrate, p = Fehlerwahrscheinlichkeit, PES = partielles eta-
Quadrat in Prozent.
Total kVEM/ha 1st cut 2nd cut
Source df MSQ p PES df MSQ p PES df MSQ p PES
Intercept 1 142 *10 < 0.001
7 89 1 702*10 6 < 0.001 84 1 126*10 6 < 0.001 74
Vegetation type
3 220*104 0.054 3 3 279*104 0.004 6 3 131*103 0.593 1
[VT]
Period [P] 4 247*105 < 0.001 35 4 115*105 < 0.001 26 4 268*104 < 0.001 20
P * VT 12 103*104 0.27 6 12 684159 0.34 6 12 117424 0.87 3
Error 214 852299 213 605932 214 206890
Fig. 5. Total energy yield per ha (mean ± 95% confidence interval). In the case of the data across vege-
tation types, different letters indicate significant differences between periods assessed by a post-hoc
Tukey-test.
Abb. 5. Gesamtenergieertrag pro ha (mittleres ± 95 % Konfidenzintervall). Im Falle der Daten über alle
Vegetationstypen weisen verschiedene Buchstaben auf signifikante Unterschiede zwischen den Zeit-
räumen hin, die mit dem Post-hoc-Tukey-Test bewertet wurden.
significantly different between the first and last sampling period (Fig. 7). Crude ash content
showed a significant decrease from the first to the third sampling period in the first and
second cut (Supplement E1).
Phosphorus is not only of relevance for cattle nutrition, but, when present in low concen-
trations, an indicator for potentially species-rich grasslands. Generally, in the last sampling
period, phosphorus content of the first cut was about one sixth lower than in the biomass of
the second cut (2.24 ± 0.09 vs. 2.90 ± 0.14). Differences between vegetation types were
rather small but significant. Although phosphorus content of the biomass across vegetation
9Fig. 6. Content of crude protein in biomass of the first cut in percentage (mean ± 95% confidence interval). In the case of the data across vegetation types, different letters indicate significant differences between periods assessed by a post-hoc Tukey-test. Abb. 6. Rohfasergehalt in der Biomasse des ersten Schnittes in Prozent (Mittelwert ± 95 % Konfidenz- intervall). Im Falle der Daten über alle Vegetationstypen weisen verschiedene Buchstaben auf signifi- kante Unterschiede zwischen den Perioden hin, die mit dem Tukey-Post-hoc-Test bewertet wurden. Fig. 7. Content of crude fibre in biomass of the first cut in percentage (mean ± 95% confidence inter- val). In the case of the data across vegetation types, different letters indicate significant differences between periods assessed by a post-hoc Tukey-test. Abb. 7. Rohfasergehalt in der Biomasse des ersten Schnittes in Prozent (Mittelwert ± 95 % Konfidenz- intervall). Im Falle der Daten über alle Vegetationstypen weisen verschiedene Buchstaben auf signifi- kante Unterschiede zwischen den Zeiträumen hin, die mit dem Tukey-Post-hoc-Test bewertet wurden. 10
types showed some significant differences between years, these variations in time were
rather small and indicated no clear temporal trend (Supplement E1). Again, a non-significant
vegetation type × sampling period interaction indicated that all vegetation types showed the
same response pattern over time.
     Variation over time of minerals relevant for cattle nutrition, i.e. calcium, magnesium,
potassium and sodium were relatively small both across, as well as within, vegetation types.
Only in potassium content of the first cut, and magnesium and calcium content in the second
cut, do significant differences indicate a decrease in the content of these minerals from the
first to fourth sampling period (Supplement E1). Although in almost all cases contents
differed between vegetation types (except for K in the first cut), and trends over time were
quite similar (i.e. the significant interaction in the case of Na [1st and 2nd cut], Mg [2nd cut]
and K [1st cut]), analysis always indicated a quantitative and not a qualitative interaction.

                                       4. Discussion
     In general, the biomass yield of all meadows studied lies between that found by other
authors for non-intensively managed grassland, and about 50% to 80% below the yield of
intensively-managed grassland (SCHMID & JEANGROS 1990, PEETERS & JANSSENS 1998,
TALLOWIN & JEFFERSON 1999, ISSELSTEIN et al. 2005). Yield and energy content were the
two response parameters that showed the most obvious changes over time. While yield
decreased until the third sampling period, energy content increased during the same period.
Energy yield (VEM/ha) still declined because the increase in energy in the biomass was too
small to compensate for the decline in biomass yield. The continuous decline of biomass
yield under non-intensive grassland management without fertilizer input is not surprising
(TALLOWIN 1999, WALTER et al. 2012). This decline was much lower than in studies focus-
sing on changes in these parameters when intensively-managed high-input grassland was
transformed into non-intensively low-input grassland (ISSELSTEIN et al. 2005). In contrast to
such studies, all grasslands included in our study were already species-rich grasslands of
high nature conservation value when first sampled. Only grasslands that meet certain thresh-
olds of floristic quality parameters are accepted into the contractual nature conservation
programme. Even so, in these high-quality grasslands yield still tended to decline until the
third sampling period. There might be two reasons for this pattern to occur. Firstly, some of
these grasslands might have received sporadic and low input of organic fertilizer (mainly
solid manure) before the conclusion of the nature conservation contracts precluded any kind
of fertilization. Secondly, any fertilization of these grasslands might have already stopped
quite some time before they were included in the contractual nature conservation pro-
gramme. In these cases, we might just have observed the continuation of productivity decline
after the cessation of fertilization, which is a process lasting for at least 15 years (BRIEMLE
1987). Still, our data suggests that this decline in yield linked to decreasing nutrient availa-
bility does slow down or even halts when total yield reached a certain threshold around
35 dt/ha (Fig. 3). This suggests that in our study grasslands mineralisation and removal of
nutrients are in balance. Parallel to our finding of decreasing yield under reduced nutrient
availability, WOLFF et al. (2020) found in the same study area that under continuous non-
intensively grassland management overall species composition was conserved and value-
adding grassland species even increased both in number and abundance. This pattern of
increasing species-richness when nutrient availability declines is well established (JANSSENS
et al. 1998, HEINSOO et al. 2020).

                                                                                              11
We found only small differences in yield change over the years between vegetation
types. Interestingly, despite some differences in the size and pattern of decline in total bio-
mass from the first to the third sampling period, total biomass of all vegetation types
declined no further than around 35 dt/ha (Fig. 3). This highlights the generality of the
observed pattern in yield decline, independent of vegetation type and associated site condi-
tions (TALLOWIN & JEFFERSON 1999). It is interesting to note that the decrease in yield was
accompanied by an increase in protein and energy content on the one hand and a reduction
of crude fibre on the other. It is well established that a decrease in nutrient availability
favours forbs over grasses (MARRS 1993). Under the precondition of the relatively late cut,
an increasing abundance of forbs is responsible for the increase in protein and energy
parameters over time. While grasses already show signs of quality decrease (i.e. an increase
of crude fibre and decrease of crude protein) early in the vegetation period when the growth
of the inflorescence sets in, in the biomass of herbs, senescence starts later and occurs at
a slower rate (LEHMANN et al. 1985, OPITZ V. BOBERFELD & THEOBALD 2003). This general
pattern is even pronounced under nature conservation contracts that preclude a first harvest
before the beginning of June. In addition, vegetation of unfertilized grasslands has to rely
solely on those nutrients made available through mineralization, which depends on soil
moisture and soil temperature (LEUSCHNER & ELLENBERG 2017). Thus, biomass growth in
an unfertilized grassland starts later than in a fertilized grassland. This later start of biomass
growth also postpones the onset of biomass senescence, both of grasses and forbs, and tends
to increase fodder quality at later cutting dates. Nutrition tables from the Luxembourg Minis-
try of Agriculture, the German Agricultural Society and the Bavarian State Research Centre
for Agriculture for different livestock (DLG 1997, 1998, LFL 2020, MA 2020) suggest that
the fodder, which is mostly harvested as hay, can be useful in basic rations. This is in ac-
cordance with several authors’ findings (TALLOWIN & JEFFERSON 1999, FRANKE 2003,
DONATH et al. 2004), who confirmed that biomass with a similar date of harvest tended not
to reach the energy levels of high quality forages (NEL > 6 MJ kg−1 dm−1, which is equiva-
lent to VEM of about 830 kg−1 dm−1), however it should be sufficient to cover the basic
requirements of cattle. Since we sampled biomass from species-rich grasslands of high na-
ture conservation value, phosphorus levels were relatively low (TALLOWIN & JEFFERSON
1999). While sodium concentrations were below minimum thresholds for cattle (JARRIGE &
MARTIN-ROSSET 1981, LFL 2020), other minerals met the minimum requirements of basic
rations.
It is a common phenomenon that fodder from high nature conservation grassland will
often meet only the basic requirements of cattle, but rarely those during periods of higher
energy demands, e.g. gestation, lactation, growing or hard work. During these periods, fod-
der of species-rich grasslands can at most only make up a small portion of the total fodder
ration (ARNAUD 2019). Still, even continuous feeding of small amounts will add up to
a surprisingly high amount of fodder that can be integrated into the farming system. Even in
intensive cattle farming, hay from species-rich meadows can be useful as a raw fibre compo-
nent of the total ration. Therefore, local farmers feed 1 kg hay per cow per day from the type
of species-rich meadows under study, which adds up to 365 kg hay per cow per year (SCHU-
MACHER 2016, pers. comm. Biver 2018). Thus, a herd of 83 cows, which is the average size
of a dairy herd in Luxembourg, could consume a total of about 8 ha of species-rich low-input
grassland (cf. Fig. 2). Since the portion of this low-energy fodder can be higher during peri-
ods of lower energy demands, e.g. in the case of dry cows, young stock or suckling cows, the
area integrated into a cattle farm can be even higher (SCHUMACHER 2016, ARNAUD 2019).
125. Conclusion
Our results highlight that for non-intensive grassland management the aims of farmers
and nature conservationists can be aligned (TALLOWIN & JEFFERSON 1999, FRANKE 2003). It
is obvious that the quantity and quality of the fodder harvested from such species-rich grass-
lands do not meet the highest standards of intensive grassland management, but still the
biomass can be well-integrated, even into local cattle farming. Thus, this study supports the
findings that a higher nature conservation value does not preclude agricultural management
(FRANKE 2003, DONATH et al. 2004). This notion is supported by the finding that despite
a decreasing quantity, the quality of the biomass tends to increase and not to decrease with
increasing nature conservation value (FRANKE 2003, DONATH et al. 2004).
In addition to feeding cattle, fodder from such meadows is predesignated to be fed to
horses whose health and well-being precludes high-energy fodder, and which are able to
compensate for lower forage quality by a higher daily intake (DUNCAN et al. 1990, MENARD
et al. 2002). Thus, the production of hay for horses could enable farmers to diversify their
sources of income (DONATH et al. 2015). SCHUMACHER (2007) suggests the production of
hay for small pets, e.g. rabbits, hamster and guinea pigs, as a further option to make use of
the biomass from species-rich low-input grasslands. In the strategy for the conservation of
the species-rich grassland in Luxembourg, this approach is proposed and could even be
financially supported. Additional approaches and concrete recommendations for actions to
preserve species-rich grassland are also elaborated in this strategy (MECDD 2020).
Currently, farmers receive 420 €/ha a year as compensation under the contractual nature
conservation scheme for non-intensively managed grassland in Luxembourg. Within this
programme, farmers are allowed to harvest once or twice a year, but are not allowed to ferti-
lize the grassland. For biotopes, as defined in the nature protection act, an additional top-up
is paid: for biotopes of the highest (A) and second highest (B) category according to the EU
FFH directive, farmers receive an additional premium of 100 €/ha and 50 €/ha, respectively
MÉMORIAL (2017). Acceptance of these compensation payments depends on the marginal
conditions of grassland management, such as productivity or marketing opportunities. With
decreasing quality and quantity of the harvested biomass, compensation payments need to be
increased to keep such nature conservation schemes attractive for farmers (HOFMANN et al.
2010). Thus, the decrease in yield observed in this study over a period of 18 years calls for
an increase of the compensation payments. Based on this observed decline in yield of about
one third during the last 18 years, we recommend an equivalent increase of at least 30%,
both for the basic payment and for the top-up premiums. This is in view of the fact that the
land currently under contract represents the last remnants of non-intensively managed grass-
land types in Luxembourg, and because significantly higher premiums are paid for other
contractual nature conservation programmes with significantly fewer management re-
strictions such as pasture management. However, the specific species composition and diver-
sity of the grassland types analysed in the present study depend on a meadow rather than
pasture management (BRIEMLE & ELLENBERG 1994). Therefore, this increase in premiums
for meadow management is not only a justified, but also a much-needed investment for
maintaining grassland diversity and its associated cultural heritage. In addition, this would
be an adequate reward for those farmers whose low-input management created, and who are
willing to preserve, these species-rich grasslands, which have to preserved at all costs.
13Erweiterte deutsche Zusammenfassung
Einleitung – Trotz vieler Bemühungen, artenreiches Grünland mit hohem Naturschutzwert zu
schützen und erhalten, hält der Verlust an artenreichem Grünland weiter an. Zu den vielversprechends-
ten Bemühungen gehört ihre Einbeziehung in den Vertragsnaturschutz. Futtermenge, Qualität und Höhe
der angebotenen Ausgleichszahlungen sind die Dreh- und Angelpunkte für die Landwirte, sich am
Vertragsnaturschutz zu beteiligen. Würden Futterquantität und/oder -qualität mit zunehmendem Arten-
reichtum relativ stabil bleiben, würde dies helfen, die Interessen von Naturschützern und Landwirten in
Einklang zu bringen. Deshalb analysierten wir Futterqualitäts- und -ertragsdaten von artenreichen
Grünlandflächen verschiedener Pflanzengesellschaften, die über einen Zeitraum von 18 Jahren erhoben
wurden. Konkret waren wir an der Beantwortung der folgenden Fragen interessiert: (1) Welchen Ein-
fluss hatte das langfristige extensive Management auf Futtermenge und -qualität? (2) Unterschieden
sich die beobachteten Muster zwischen den Graslandtypen? (3) Welches Gesamtpotenzial besteht bei
der Verwendung von Futter aus extensiv bewirtschaftetem artenreichem Grünland in der Tierhaltung?
Methoden – Die Untersuchungsflächen lagen im Südwesten von Luxemburg (Abb. 1). Die unter-
suchten Wiesen gehören zu den Mageren Flachlandwiesen (FFH 6510), den Sumpfdotterblumenwiesen,
den Pfeifengraswiesen (FFH 6410) und den mesophilen bis feuchten Magerwiesen. Diese Magerwiesen
sind in Luxemburg selten geworden, und es gilt sie durch eine geeignete Nutzung zu erhalten. Ab 2001
wurde auf jeder untersuchten Grünlandparzelle eine Fläche von 100 m2 für die Biomasseprobenahme
ausgewählt. Die Beprobung des ersten Schnittes erfolgte in der Regel einige Tage vor dem 15. Juni,
dem frühesten Mähtermin im Vertragsnaturschutz, und die Beprobung des zweiten Schnittes fand
zwischen Anfang August und Ende September statt. Insgesamt konnten 468 Proben von 145 Unter-
suchungsstandorten analysiert werden.
Es wurde eine Reihe von Futtermittelparametern ausgewertet, u. a. Trockensubstanz, Rohprotein,
verdauliches Rohprotein, VEM (Futtereinheiten Milch), VEVI (Futtereinheiten Fleischvieh intensiv)
sowie einige wichtige Nährelemente. Um den Unterschieden in der Stichprobenintensität zwischen den
Jahren und der kurzfristigen Variabilität zwischen den Jahren Rechnung zu tragen, wurden Stich-
probenzeiträume festgelegt. Die Daten für alle Vegetationstypen wurden mit Hilfe einer zweifaktoriel-
len ANOVA analysiert, um den Einfluss der Hauptfaktoren Vegetationstyp (k = 4) und Beprobungs-
periode (k = 5) sowie deren Interaktionseffekt auf die Antwortvariablen zu bewerten. Bei signifikanten
ANOVA-Ergebnissen, die auf das Vorhandensein relevanter allgemeiner Muster hindeuteten, wurden
die paarweisen Unterschiede zwischen den Stichprobenperioden mittels Tukey-Test bewertet.
Ergebnisse – Über alle Vegetationstypen hinweg ging der Gesamtertrag von der ersten bis zur fünf-
ten Probenahmeperiode um etwa ein Drittel zurück (Abb. 3). Der Rückgang erfolgte nicht kontinuier-
lich, sondern war von der 2. bis zur 3. Beprobungsperiode am stärksten. Der Ertragsrückgang war je
nach Vegetationstyp sehr unterschiedlich. Die Entwicklung des Energiegehalts (VEM) zeigte ein dia-
metrales Muster zum Gesamtertrag (Abb. 4 a, b). Sowohl über alle als auch innerhalb der Vegetations-
typen zeigten unsere Untersuchungen einen geringen Anstieg des Energiegehalts über die Zeit, der sich
in der Größe zwischen den Vegetationstypen nicht signifikant unterschied. VEVI zeigte analoge Unter-
schiede zwischen Probenahmezeiträumen und Vegetationstypen wie VEM (Anhang E1).
Trotz dieses Anstiegs des Energiegehalts halbierte sich der Energieertrag pro ha von der ersten bis
zur fünften Beprobungsperiode (Abb. 5). Im Allgemeinen unterschied sich der Rückgang des Energie-
ertrags je nach Vegetationstyp erheblich.
Über die Vegetationstypen hinweg waren die Parameter des Proteingehalts (Abb. 6, Anhang E1)
im zweiten Schnitt immer höher als die Gehalte im ersten Schnitt. Dennoch zeigten die Proteinparame-
ter in der Biomasse der ersten und zweiten Ernte ein gemeinsames Muster mit einem signifikanten
Anstieg vom ersten bis zum dritten bzw. ersten bis zum vierten Stichprobenzeitraum, aber keine signi-
fikante Wechselwirkung zwischen Vegetationstyp × Stichprobenzeitraum. Im Gegensatz zu den
Proteinparametern waren die Rohfasergehalte im ersten Schnitt höher als im zweiten Schnitt (An-
hang E1). Während im ersten Schnitt der Vegetationstyp eine signifikante Wirkung hatte, war der
Vegetationstyp × Probenahmezeitraum wiederum nicht signifikant. Obwohl die Rohfasergehalte in der
14dritten Probenahmeperiode signifikant am niedrigsten waren, waren die Unterschiede in absoluten
Zahlen eher gering und die Werte zwischen der ersten und der letzten Probenahmeperiode nicht signifi-
kant unterschiedlich (Abb. 7).
Im Allgemeinen war der Phosphorgehalt des ersten Schnittes in der letzten Beprobungsperiode etwa
ein Sechstel niedriger als in der Biomasse des zweiten Schnittes. Auch hier deutete eine nicht signifi-
kante Wechselwirkung zwischen Vegetationstyp × Probenahmezeitraum darauf hin, dass alle Vegetati-
onstypen im Laufe der Zeit das gleiche Reaktionsmuster zeigten.
Die zeitlichen Schwankungen der Gehalte an anderen für die Rinderernährung relevanten Minera-
lien, d. h. Calcium, Magnesium, Kalium und Natrium, waren sowohl zwischen als auch innerhalb der
Vegetationstypen relativ gering (Anhang E1).
Diskussion – Im Allgemeinen liegt der Biomasseertrag aller Wiesen innerhalb der von anderen Au-
toren für extensiv bewirtschaftetes Grünland gefundenen Werte und etwa 50 % bis 80 % unter dem
Ertrag von intensiv bewirtschaftetem Grünland (SCHMID & JEANGROS 1990, PEETERS & JANSSENS
1998, TALLOWIN & JEFFERSON 1999, ISSELSTEIN et al. 2005).
Es zeigte sich, dass der Ertragsrückgang unabhängig vom Vegetationstyp und den damit verbunde-
nen Standortbedingungen ist (TALLOWIN & JEFFERSON 1999). Interessant ist, dass der Ertragsrückgang
einerseits mit einem Anstieg des Protein- und Energiegehalts und andererseits mit einer Verringerung
der Rohfaser einherging. Es ist gut belegt, dass die Abnahme der Nährstoffverfügbarkeit Kräuter
gegenüber Gräser begünstigt (MARRS 1993). Unter der Voraussetzung des relativ späten Schnittes ist
ein zunehmender Anteil an typischen Wiesenkräutern für den Anstieg der Protein- und Energieparame-
ter im Laufe der Zeit verantwortlich. Während Gräser bereits zu Beginn der Vegetationsperiode Anzei-
chen einer Qualitätsminderung (d. h. Zunahme der Rohfaser und Abnahme des Rohproteins) zeigen,
setzt bei der Biomasse der Kräuter die Seneszenz später ein und verläuft langsamer (LEHMANN et al.
1985, OPITZ v. BOBERFELD & THEOBALD, 2003). Der spätere Beginn des Biomassewachstums in
extensiv genutzten Wiesen verzögert auch das Einsetzen der Seneszenz der Biomasse, sowohl von
Gräsern als auch von Kräutern, und erhöht tendenziell die Futterqualität zu späteren Schnittzeitpunkten.
Nährwerttabellen deuten darauf hin, dass das als Heu geerntete Futter gut in Grundrationen einge-
setzt werden kann. Dies steht im Einklang mit den Ergebnissen mehrerer Autoren (TALLOWIN & JEF-
FERSON 1999, FRANKE 2003, DONATH et al. 2005), die bestätigten, dass Biomasse mit einem ähnlichen
Erntezeitpunkt tendenziell nicht das energetische Niveau von hochwertigem Futtermitteln erreicht;
dennoch sollte sie ausreichen, um den Grundbedarf von Rindern zu decken.
Es ist ein häufiges Phänomen, dass Futter von Naturschutzgrünland oft nur den Grundbedarf der
Rinder deckt, selten aber den Bedarf in Zeiten mit höherem Energiebedarf. In diesen Perioden kann das
Futter von artenreichem Grünland nur einen kleinen Teil der Gesamtfutterration ausmachen (ARNAUD
2019). Doch selbst die kontinuierliche Verfütterung kleiner Mengen wird sich zu einer erstaunlich
hohen Menge an Futter summieren, die in das landwirtschaftliche System integriert werden kann. Selbst
in der intensiven Viehhaltung kann Heu von artenreichen Wiesen gut als Rohfaserkomponente der
Gesamtration eingesetzt werden – es eignet sich gut für die Fütterung von trockenstehenden Kühen,
Jungvieh oder Mutterkühen (SCHUMACHER 2016, ARNAUD 2019, pers. Mitt. Biver 2018).
Schlussfolgerung – Es ist bekannt, dass die Quantität und Qualität des Futters, das von solch arten-
reichem Grasland geerntet wird, nicht den höchsten Standards einer intensiven Grünlandbewirtschaf-
tung entspricht; aber dennoch kann die Biomasse auch in die lokale Viehhaltung gut integriert werden.
Damit unterstützt diese Studie die Ergebnisse, dass ein höherer Naturschutzwert die landwirtschaftliche
Bewirtschaftung nicht ausschließt.
Zusätzlich zur Fütterung von Rindern ist das Futter von solchen Wiesen für die Fütterung von Pfer-
den vorgesehen. Somit könnte die Produktion von Heu für Pferde den Landwirten eine Diversifizierung
ihrer Einkommensquellen ermöglichen (DONATH et al. 2015). SCHUMACHER (2007) schlägt die Pro-
duktion von Heu für kleine Haustiere, z. B. Kaninchen, Hamster und Meerschweinchen, als eine weite-
re Option vor, um die Biomasse von artenreichem, ertragsärmeren Grünland zu nutzen.
15Der beobachtete Ertragsrückgang über einen Zeitraum von 18 Jahren erfordert eine Erhöhung der
Ausgleichszahlungen. Aufgrund des beobachteten Ertragsrückgangs von rund einem Drittel im Zeit-
raum von 2001–2018 und der Tatsache, dass es sich um die letzten Reste dieser Grünlandtypen handelt,
empfehlen wir eine entsprechende Erhöhung der Förderprämie um mindestens 30 %. Dies wäre eine
angemessene Entlohnung für diejenigen Landwirte, die mit ihrer extensiven Bewirtschaftung diese
artenreichen Grünlandflächen geschaffen haben und die weiterhin bereit sind, diese artenreichen Wie-
sen und Weiden zu erhalten.
Acknowledgements
We thank the Ministry for the Environment, Climate and Sustainable Development and the member
municipalities of SICONA for financial support for the sampling and analyses throughout the study.
Our thanks go to the colleagues of the technical department at SICONA who took the samples and
those in the science department for planning the sampling. Many thanks to Liza Glesener and Beatrice
Biro for designing the map. We also thank Liza Glesener for the data management and proofreading of
the manuscript as well as Caroline Grounds for proofreading. Our thanks go also to the Associate Editor
and two reviewers for their constructive comments.
Author contributions
S. Schneider and T.W. Donath developed and supervised the research project. D. Viain performed
the analysis. All authors discussed the results and contributed to the final manuscript.
ORCID iDs
Tobias W. Donath https://orcid.org/0000-0003-1874-1096
Simone Schneider https://orcid.org/0000-0003-3761-2054
Supplements
Additional supporting information may be found in the online version of this article.
Zusätzliche unterstützende Information ist in der Online-Version dieses Artikels zu finden.
Supplement E1. Yield and forage parameters [mean ± S.E.] of non-intensively managed grasslands in
south-western Luxembourg.
Anhang E1. Ertrag und Futterparameter [Mittelwert ± S.E.] extensiv genutzter Grünlandbestände im
Südwesten Luxemburgs.
References
AEF (ADMINISTRATION DES EAUX ET FORETS) (Hrsg.) (1995): Naturräumliche Gliederung Luxem-
burgs. Ausweisung ökologischer Regionen für den Waldbau mit Karte der Wuchsgebiete und
Wuchsbezirke. – Bearbeitet vom Studienbüro EFOR ingénieus-conseils, Ministère de
l’Environnement, Ministère de l’Agriculture, de la Viticulture et du Développement Rural, Adminis-
tration des eaux et forêts. Service central des imprimés de l’état, Luxembourg: 71 pp.
ARNAUD, F. (2019): Valorisation des prairies 6510, Axe « Prairie ». Rapport Final (Valorisation of
6510-meadows, type "meadow") [in Französisch]. – Unpublished report commissioned by l'Ob-
servatoire de l'Environnement du Luxembourg: 41 pp.
16BLACKSTOCK, T.H., RIMES, C.A., STEVENS, D.P., JEFFERSON, R.G., ROBERTSON, H.J., MACKINTOSH,
J. & HOPKINS, J.J. (1999): The extent of semi-natural grassland communities in lowland England
and Wales: a review of conservation surveys 1978–1996. – Grass Forage Sci. 54: 1–18.
BRIEMLE, G. (1987): 17 Jahre ungedüngt - gleicher Ertrag! – Schwäbischer Bauer Nr. 16/1987: 32–35.
BRIEMLE, G. & ELLENBERG, H. (1994): The mowing compatibility of grassland plants. – Nat. Landsch.
69: 139–147.
BRUIJNEN, P. (2009): Vergleich von Parametern zur Bewertung von Gras- und Maissilagen für die
Milchkuhfütterung am Beispiel des deutschen und des niederländischen Verfahrens. – Bachelor-
arbeit, Hochschule Neubrandenburg: 74 pp.
BULLOCK, J.M., PYWELL, R.F., BURKE, M.J.W. & WALKER, K.J. (2001): Restoration of biodiversity
enhances agricultural production. – Ecol. Lett. 4: 185–189.
COP, J., VIDRIH, M. & HACIN, J. (2009): Influence of cutting regime and fertilizer application on the
botanical composition: yield and nutritive value of herbage of wet grasslands in Central Europe. –
Grass Forage Sci. 64: 454–465.
DIERSCHKE, H. & BRIEMLE, G. (2002): Kulturgrasland, Wiesen, Weiden und verwandte Hochstauden-
fluren – Ökosysteme Mitteleuropas aus geobotanischer Sicht. – Ulmer, Stuttgart: 239 pp.
DLG (DEUTSCHE LANDWIRTSCHAFTS-GESELLSCHAFT) (1997): Futterwerttabellen-Wiederkäuer. –
DLG-Verlag, Frankfurt a. M.: 96 pp.
DLG (DEUTSCHE LANDWIRTSCHAFTS-GESELLSCHAFT) (1998): Futterwerttabellen-Pferde. – DLG-Ver-
lag, Frankfurt a. M.: 112 pp.
DONATH, T.W., HÖLZEL, N., BISSELS, S. & OTTE, A. (2004): Perspectives for incorporating biomass
from non-intensively managed temperate flood-meadows into farming systems. – Agric. Ecosyst.
Environ. 104: 439–451.
DONATH, T.W., SCHMIEDE, R. & OTTE, A. (2015): Alluvial grasslands along the northern upper Rhine
– nature conservation value vs. agricultural value under non-intensive management. – Agric. Eco-
syst. Environ. 200: 102–109.
DUNCAN, P., FOOSE, T.J., GORDON, I.J., GAKAHU, C.G. & LIOYD, M. (1990): Comparative nutrient
extraction from forages by grazing bovids and equids: a test of the nutritional model of equid/bovid
competition and coexistence. – Oecologia 84: 411–418.
EEA (EUROPEAN ENVIRONMENT AGENCY) (2019): Conservation status and trends in conservation
status by habitat group – DRAFT (Daten für Luxemburg) – URL: https://www.eea.europa.eu/
themes/biodiversity/state-of-nature-in-the-eu/article-17-national-summary-dashboards/conservation-
status-and-trends [accessed 2020-04-20].
FRANKE, C. (2003): Grünland an der unteren Mittelelbe – Vegetationsökologie und landwirtschaftliche
Nutzbarkeit. – Diss. Bot. 370: 1–181.
HABEL, J.C., DENGLER, J., JANIŠOVÁ, M., TÖRÖK, P., WELLSTEIN, C. & WIEZIK, M. (2013): European
grassland ecosystems: threatened hotspots of biodiversity. – Biodivers. Conserv. 22: 2131–2138.
HEINSOO, K., SAMMUL, M., KUKK, T., KULL, T. & MELTS, I. (2020): The long-term recovery of
a moderately fertilised semi-natural grassland. – Agric. Ecosyst. Environ. 289: 106744.
HEJCMAN, M., HEJCMANOVÁ, P., PAVLŮ, V. & BENEŠ, J. (2013): Origin and history of grasslands in
Central Europe – a review. – Grass Forage Sci. 68: 345–363.
HOFMANN, M. & ISSELSTEIN, J. (2005): Species enrichment in an agriculturally improved grassland and
its effects on botanical composition yield and forage quality. – Grass Forage Sci. 60: 136–145.
HOFMANN, M., KIRSCHIG, J. & RIEHL, G. (2010): Agronomic aspects of a lowland and a mountain hay
meadow under different cutting regime. – Grassl. Sci. Eur. 15: 699–701.
IBM CORP. RELEASED (2016): IBM SPSS Statistics for Windows, Version 24.0. – Armonk, NY: IBM
Corp.
ISSELSTEIN, J., JEANGROS, B. & PAVLU, V. (2005): Agronomic aspects of biodiversity targeted man-
agement of temperate grasslands in Europe – a review. – Agron. Res. 3: 139–151.
JANSSENS, F., PEETERS, A., TALLOWIN, J.R.B., BAKKER, J.P., BEKKER, R.M., FILLAT, F. & OOMES,
M.J.M. (1998): Relationship between soil chemical factors and grassland diversity. – Plant and Soil
202: 69–78.
JARRIGE, R. & MARTIN-ROSSET, W. (1981): Le cheval: Reproduction, selection, alimentation, exploita-
tion. XIII Journées du Grenier de Theix (The horse: Reproduction, selection, feeding, exploitation)
[in Französisch]. – Paris, Institut National de la Recherche Agronomique: 690 pp.
17KLEINEBECKER, T., WEBER, H. & HÖLZEL, N. (2011): Effects of grazing on seasonal variation of aboveground biomass quality in calcareous grasslands. – Plant Ecol. 212: 1563–1576. LEHMANN, J., MEISTER, E. & DIETL, W. (1985): Nährwert von Wiesenkräutern. – Schweizer. Landwirt- schaftl. Forsch. 24: 237–259. LEUSCHNER, C. & ELLENBERG, H. (2017): Ecology of Central European Non-Forest Vegetation: Coastal to Alpine, Natural to Man-Made Habitats. – Springer: 1128 pp. LFL (Bayerische Landesanstalt für Landwirtschaft) (2020): Gruber Tabelle zur Fütterung der Milchkü- he, Zuchtrinder, Schafe, Ziegen. – LfL-Information: 108 pp. MA (MINISTERE DE L’AGRICULTURE, DE LA VITICULTURE ET DU DEVELOPPEMENT RURAL) (Ed.) (2020): Rapport d’activités 2019 du Ministère de l’Agriculture, de la Viticulture et du Développe- ment rural (Activity report 2019 of the Ministry of Agriculture, Viticulture and Rural Development) [in Französisch], 279 pp. – URL: https://gouvernement.lu/dam-assets/fr/publications/rapport- activite/minist-agriculture-viticulture-protection-consommateurs/2019-rapport-activite-ma/2019- rapport-activite-ma.pdf [accessed 2020-06-22]. MARRS, R.H. (1993): Soil fertility and nature conservation in Europe: theoretical considerations and practical management solutions. – Adv. Ecol. Res. 24: 242–300. MDDI (MINISTERE DU DEVELOPPEMENT DURABLE ET DES INFRASTRUCTURES, DEPARTMENT DE L´ENVIRONNEMENT) (2017): Cadastre des biotopes des milieux ouverts. – Shape-file der kartierten Biotope, Version 10.2017. – URL: https://environnement.public.lu/fr/natur/biodiversite/mesure_3_ zones_especes proteges/donnees_gis.html [accessed 2019-01-04]. MECDD (MINISTÈRE DE L’ENVIRONNEMENT, DU CLIMAT ET DU DÉVELOPPEMENT DURABLE) (2020): Strategie zum Erhalt und zur Wiederherstellung des artenreichen Grünlandes in Luxemburg – 2020–2030: 24 pp. MÉMORIAL (2002): Règlement grand-ducal du 22 mars 2002 instituant un ensemble de régimes d’aides pour la sauvegarde de la diversité biologique (Grand-Ducal Regulation of 4 April 2002 establishing aid for the conservation of biodiversity) [in Französisch]. – Journal Officiel du Grand-Duché de Luxembourg, Mémorial A – N° 36 du 4 avril 2002: 584–630. MÉMORIAL (2012): Règlement grand-ducal du 10 septembre 2012 instituant un ensemble de régimes d’aides pour la sauvegarde de la diversité biologique en milieu rural, viticole et forestier (Grand- Ducal Regulation of 10 September 2012 establishing a set of aids for the conservation of biodiversi- ty in the agricultural, viticultural and forestry milieu) [in Französisch]. – Journal Officiel du Grand- Duché de Luxembourg, Mémorial A – N° 198 du 14 septembre 2012: 2808–2857. MÉMORIAL (2017): Règlement grand-ducal du 11 septembre 2017 instituant un ensemble de régimes d’aides pour la sauvegarde de la diversité biologique en milieu rural (Grand-Ducal Regulation of 11 September 2017 establishing a set of aids for the conservation of biodiversity in open land) [in Französisch]. – Mémorial A, Recueil de legislation du Journal officiel du Grand-Duché de Luxem- bourg N° 863 du 11 septembre 2017: 1–70. MÉMORIAL (2018): Loi du 18 juillet 2018 concernant la protection de la nature et des ressources natu- relles et modifiant 1° la loi modifiée du 31 mai 1999 portant institution d’un fonds pour la protection de l’environnement; 2° la loi modifiée du 5 juin 2009 portant création de l’Administration de la na- ture et des forêts; 3° la loi modifiée du 3 août 2005 concernant le partenariat entre les syndicats de communes et l’État et la restructuration de la démarche scientifique en matière de protection de la nature et des ressources naturelles (Law of 18 July 2018 on the protection of nature and natural resources [...]) [in Französisch]. – Mémorial A, Recueil de législation du Journal officiel du Grand- Duché de Luxembourg N° 771 du 05 septembre 2018: 1–48. MENARD, C., DUNCAN, P., FLEURANCE, G., GEORGES, J.-Y. & LILA, M. (2002): Comparative foraging and nutrition of horses and cattle in European wetlands. – J. Appl. Ecol. 39: 120–133. OPITZ V. BOBERFELD, W. & THEOBALD, P. (2003): Performance of common species in the Festuco– Brometea under various conditions. – Ger. J. Agron. 7: 1–12. PÄRTEL, M., BRUUN, H.H. & SAMMUL, M. (2005): Biodiversity in temperate European grasslands: origin and conservation. – Grassl. Sci. Eur. 10: 1–14. PEETERS, A. & JANSSENS, F. (1998): Species-rich grasslands: diagnostic, restoration and use in inten- sive livestock production systems. – Grassl. Sci. Eur. 3: 375–393. 18
You can also read