Energy efficiency for rapeseed biodiesel production in different farming systems
←
→
Page content transcription
If your browser does not render page correctly, please read the page content below
Energy Efficiency
DOI 10.1007/s12053-013-9201-2

 ORIGINAL ARTICLE

Energy efficiency for rapeseed biodiesel production
in different farming systems
Melese Tesfaye Firrisa & Iris van Duren &
Alexey Voinov

Received: 15 February 2012 / Accepted: 26 March 2013
# Springer Science+Business Media Dordrecht 2013

Abstract Due to mounting concerns related to fossil        conclusions about these values but the patterns ob-
fuel use and problems with their supply, the use of        served show that intensifying the production process
alternative sources of energy is increasing. One of the    and increasing yield bears very little or no benefit in
alternative sources is biomass and the European Union      terms of energy produced. Due to a higher amount of
has adopted a biofuel directive that describes targets     organic manure and consequently lower amount of
for the use of biofuels in the transport sector. The       artificial fertilizers used in crop growth in the Nether-
majority of biofuels produced in Europe comes from         lands, the rapeseed biodiesel production system in the
rapeseed. In this study, we focused on analyzing the       Netherlands is more efficient than in Poland. In both
efficiency of rapeseed biodiesel production. Energy        cases, the EROEI is quite low. More detailed spatial
efficiency in terms of Energy Return On Energy             energy efficiency assessments are required to deter-
Invested (EROEI) was analyzed for two EU countries         mine if and where sustainable production may be
(Poland and The Netherlands) with different agro-          possible.
ecological systems. Life Cycle Inventory (LCI)
accounted for inputs, processes and outputs of energy      Keywords Biofuel . Energy efficiency . EROEI .
in the biodiesel production system. Input parameters       LCA . LCI . RME
were derived from literature as well as from farmer’s
interviews. The use of the outputs—straw, meal, and
glycerin—were included in the LCI system boundary.         Introduction
The EROEI values ranged from 1.73 to 2.36 in Poland
and from 2.18 to 2.60 in the Netherlands. The low          Humans are using energy in many ways to improve
number of respondents makes it risky to draw hard          their living standards. The world energy demand is
                                                           increasing because of growing consumption by a
M. T. Firrisa : I. van Duren (*) : A. Voinov               growing population. The International Energy Out-
Faculty of Geo-Information Science and Earth Observation   look 2010 (EIA U.S. Energy Information Administra-
(ITC), University of Twente,
                                                           tion 2010) foresees a growth in the global energy
P.O. Box 217, Hengelosestraat 99,
7500 AE Enschede, The Netherlands                          consumption of 49% from 2007 to 2035. Fossil fuels
e-mail: vanduren@itc.nl                                    are the main energy source that drives the world econ-
M. T. Firrisa                                              omy, however, for a number of reasons it is becoming
e-mail: firrisa21744@alumni.itc.nl                         increasingly unlikely that fossil fuel supply will be
A. Voinov                                                  able to meet this growth in demand. Reserves of fossil
e-mail: voinov@itc.nl                                      fuels are non-renewable and their extraction becomes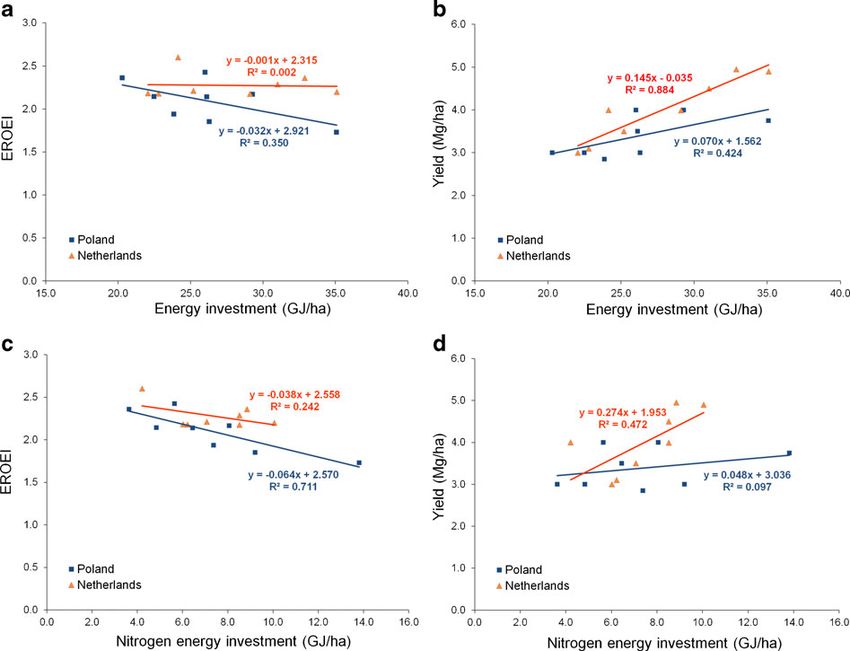
Energy Efficiency

increasingly expensive and risky. Besides, they are the      sector. Not surprisingly, the European Union was the
main source of already unsafe levels of green house          world leader in biodiesel production in 2005 (Baka
gases (GHG) in the atmosphere (Cherubini and                 and Roland-Holst 2009). Out of the total of 10.2
Strømman 2011) and, therefore, the main driver of            billion liters of biodiesel production worldwide in
climate change. Alternative sources of energy, solar,        2007, 60 % was produced within the European Union.
wind, hydro-power, are most promising in terms of                Rapeseed is the main oil crop grown in Europe
environmental impacts, energy security and socio-            (Baka and Roland-Holst 2009; VROM 2010) account-
economic externalities (Bomb et al. 2007; Cherubini          ing for more than half of the biofuel production (Bu-
et al. 2009; European Biodiesel Board 2011; Mc               reau et al. 2010). In 2008 in Europe, rapeseed
Alister and Horne 2009; Nanaki and Koroneos                  accounted for 79 % of all feedstock crops used for
2009). Bioenergy is yet another important alternative        biodiesel production (Ajanovic 2011). It is cultivated
source of energy. In this case, energy is derived from       in almost all European countries (Thamsiriroj and
plants and can be used directly for heating, or electric-    Murphy 2010). However the true costs and benefits
ity production, but most importantly, biomass can be         of biofuels, their efficiency in terms of net energy
converted into liquid fuel (Davis et al. 2009; Halleux       production and the magnitude of associated environ-
et al. 2008) and directly used in the existing transpor-     mental and social impacts need further analysis.
tation infrastructure, which is almost entirely run on           To assess sustainability of biofuel production, all
fossil fuels (cars, buses, airplanes). This substitutabil-   potential environmental impacts over the entire
ity makes biofuels especially attractive and results in      lifespan (i.e., cradle-to-grave) from raw material ac-
much attention and, in many cases, governmental sup-         quisition through production, use and disposal need to
port and economic subsidies that encourage biofuel           be considered. This can be achieved by applying a
production (Kutas et al. 2007).                              Life Cycle Assessment (LCA). The first step in this
    Cherubini et al. (2009) estimated that currently         calculation is a Life Cycle Inventory (LCI), which is
bioenergy supplies 10 % of the total world primary           basically “the result of compiling all environmental
energy, which in most cases is used in residential areas     flows, including resource use inputs and waste or
for domestic purposes such as heating and cooking.           pollution outputs” (Horne et al. 2009). Energy effi-
The majority of biofuels worldwide is produced from          ciency is one of the most important elements of sus-
corn, wheat, barley, sugarcane, rapeseed, oil palm,          tainability analysis (Börjesson 2009). One simple
soybean, sugar beet, potato and sunflower (Ajanovic          indicator of energy efficiency is the measure of Energy
2011; Davis et al. 2009; Demirbas 2008). This creates        Return On Energy Investment (EROI or EROEI)
a major concern that biofuel production is largely           (Cleveland 2008; Hall et al. 2009; Mulder and Hagens
derived from the same crops that are also used for           2008), which is calculated as:
food production (Baka and Roland-Holst 2009;
                                                             EROEI ¼ Eout =Ein
Kavalov 2004), which inevitably pushes food prices
up. Increased interest in biofuel production due to
subsidies and growing demand has an indirect impact          where Eout is the amount of energy produced, and Ein is
on land use and biodiversity (Arvidsson et al. 2011;         the amount of energy used in production.
Crutzen et al. 2008; Mc Alister and Horne 2009;                 Energy production with EROEI of less than or even
Nanaki and Koroneos 2009; Netherlands Environmen-            close to one is meaningless as in this case it would
tal Assessment Agency 2010).                                 require as much or even more energy than what is
    Biofuels, however, are and at least in the short term    produced (The Offshore Valuation Group 2010). Hall
are likely to remain, the main alternative to liquid         et al. (2009) claimed that a minimum EROEI of 3
fossil fuels (Murphy et al. 2011; Hammond et al.             should be achieved in order to support continuing
2008). The chemical compounds produced from these            economic activity and social function. Murphy and
crops are: biodiesel, ethanol, methane, and methanol         Hall (2010) produced an overview of EROEI values
(Ajanovic 2011; Börjesson and Tufvesson 2011;                in a comparison of different energy sources.
Brecha 2008). In contrast to North and South America            The EROEI index has been criticized (Wu and
where the focus is on ethanol, in Europe biodiesel is        Sardo 2010) for inappropriately favoring energy pro-
the main type of biofuel produced for the transport          duction with low input values. Indeed as energy input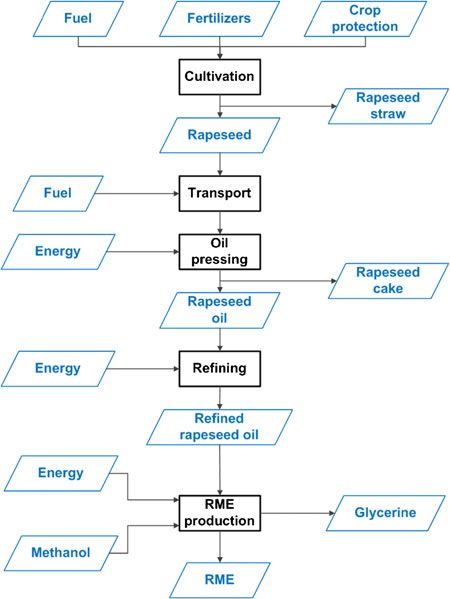
Energy Efficiency

approaches zero EROEI tends to infinity. As an alter-       order EROEI. The third order EROEI adds up all the
native, it is suggested to look at net energy (NE)          social and environmental externalities associated with
produced:                                                   the whole production system (e.g. mitigating health
                                                            problems or erosion or other forms of environmental
NE ¼ Ein  Eout
                                                            deterioration). It then allocates energy values to them
                                                            in addition to what is included in the second-order
   EROEI is more about efficiency of energy produc-         EROEI calculation.
tion and tells us how much energy is produced per unit         A key parameter in the EROEI calculation is crop
of energy used. NE would favor energy production at         yield. Crop yield and consequently the energy effi-
higher costs as long as the net output of energy is         ciency of biofuel production are affected by various
higher. While both indices are worth considering, we        agricultural technologies that may be applied
prefer EROEI because in most cases there are many           (Börjesson 2009; Johnston et al. 2009). The yield
other factors in the energy production process that         can be increased by applying manure, mineral fertil-
may be hard to account for in only energetic terms.         izers, herbicides, pesticides or fungicides, as well as
Such externalities include land use conversion, im-         by improving agricultural practices through cultiva-
pacts on water quality, soil loss, biodiversity impacts     tion, irrigation, etc. But since production and applica-
and other environmental effects, as well as possible        tion of chemicals and advanced farming techniques
esthetic, cultural and other aspects, which are difficult   always require additional energy, the energy input in
to account for in terms of energy and which are always      crop growth also increases. It is not always obvious
higher when the operations are more energy intensive.       whether the energy output will be a net benefit or loss
In this case, EROEI indirectly favors the production        if we do apply these advanced technologies. The pro-
that is less energy intensive even if the net energy        cesses relevant for a second-order EROEI calculation
produces may be somewhat lower.                             are presented in a causal loop diagram in Fig. 1.
   One other important caveat relates to energy                In this paper, we focus on analyses of energy effi-
quality, which is not directly included in the              ciency of rapeseed biofuel production for different
EROEI equation. For example, if we have abun-               agro-ecological systems: Poland and the Netherlands
dant electric energy, but are badly in need of              who are on the same latitude but have somewhat
liquid fuels, it may still make sense to produce            different climate and soils, and a more substantial
such liquid fuels even if the energetic value of            difference in farming practices. Most LCA studies
electricity input is higher than the energy pro-            depend entirely on literature (Batchelor et al. 1995).
duced. In this case, we need to distinguish be-             In our study, we also interviewed farmers engaged in
tween the various types of energy that we are               rapeseed production to validate inputs and outputs.
considering. Besides, EROEI analysis is “highly             The engagement of farmers in our study was not
sensitive to assumptions about both system bound-           intended as a comprehensive survey of practitioners
aries and key parameter values” (Hall et al. 2009;          to cover all the range of growing conditions and prac-
Farrell et al. 2006). Nevertheless, the EROEI ap-           tices. Instead we saw it mostly as a “reality check” for
proach is based on solid thermodynamic principles           the LCA that we were performing, as a way to discuss
and is, therefore, a good first step into understand-       and validate the various steps of the production pro-
ing the efficiency of energy production.                    cess with those who knew most about it.
   Mulder and Hagens (2008) classify the level of              In both countries, rapeseed is grown both as sum-
EROEI analysis into three orders. In the context of         mer and as winter crop and in both cases it is part of a
rapeseed biofuel production and in line with the dif-       crop rotation system. Winter rapeseed is more abun-
ferent EROEI accounting methods, first-order EROEI          dant due to a higher achievable crop yield compared to
includes energy input from cultivation, transportation      summer rapeseed and because having a crop on the
and energy for conversion of the feedstock at refinery.     land during winter reduces soil erosion. Therefore, in
The direct energy output is in Rapeseed Methyl Ester        this paper, we compare the energy efficiency of bio-
(RME). Second-order EROEI calculation includes in-          fuel production from winter rapeseed.
direct energy inputs and energy costs of by- and waste         Our objective is to improve the quantification of the
products in addition to what is included in the first-      energy production estimates for rapeseed and to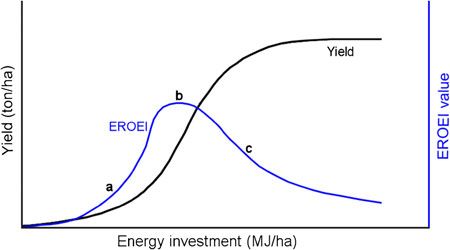
Energy Efficiency
Fig. 1 Causal loop diagram of Energy Return on Energy Input (EROEI) for the rapeseed biodiesel production system. All processes
that require or produce energy (boxes with bold lines) are connected via positive or negative cause-effect relationships
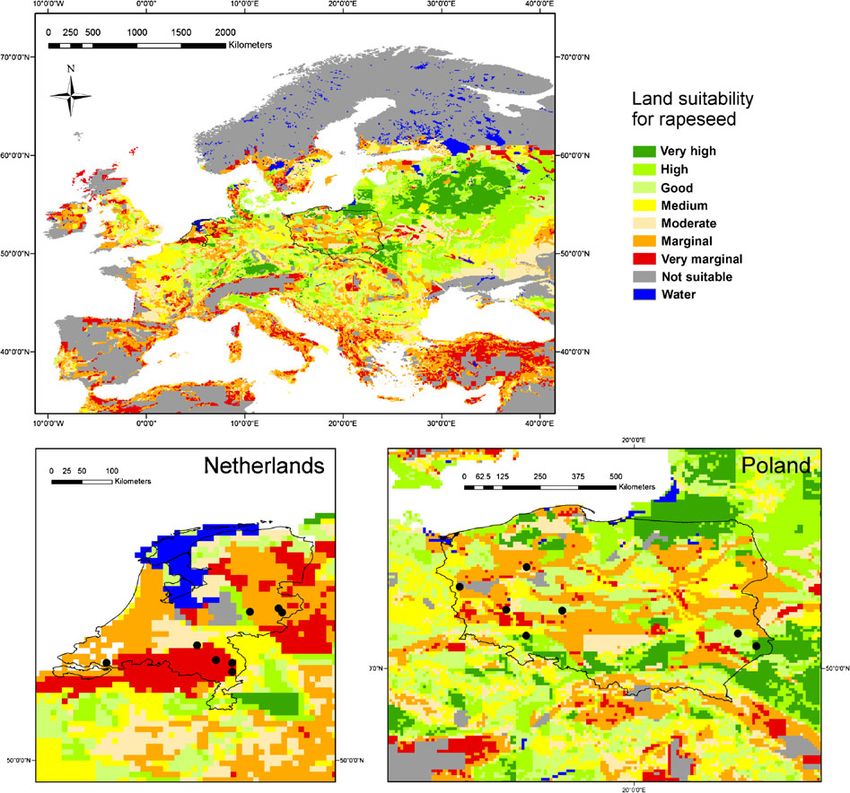
demonstrate that higher yields (agricultural goal) do rapeseed crop suitability map based on various climat-
not necessarily translate into higher bioenergy poten- ic, topographic, soil, and crop requirement parameters
tial. We also aim at providing information to policy (Fischer et al. 2002). We used this map in Fig. 2 to
and decision makers for optimizing biofuel energy show the European rapeseed suitability with enlarge-
production efficiency. ments of Poland and the Netherlands on which the
locations are plotted of the farmers who were
interviewed. According to the FAO statistics Poland
Materials and methods used on average 830,817 ha land over the period
2007–2011 to grow rapeseed while in the Netherlands
Study area description only 2,606 ha of land was used to grow this crop. In
Poland, this means more than 2.5 % of the land is used
Poland and the Netherlands are found on the same to grow rapeseed while in the Netherlands this is less
latitude (52° N) but differ somewhat in climate with than 1 %
Poland having lower temperatures in winter and over- Based on the suitability map, it appears that Poland
all less rainfall, especially in summer. The Internation- has a better potential to grow rapeseed compared to
al Institute for Applied Systems Analysis calculated a the Netherlands. On the other hand, the farmingEnergy Efficiency Fig. 2 GAEZ (Global Agro-Ecological Zones) suitability maps for rain fed rapeseed cropping in Europe (Fischer et al. 2002) overlaid by location maps of Polish and Dutch rapeseed farmers contributing to this study system in the Netherlands is more advanced than in common because of difficulties with precise identifi- Poland. The Dutch are widely using precision farming, cation of parcel borders. Stimulated by the Govern- in particular GPS and other hi-tech methods; there are ment, however, this seems to be changing now agro businesses offering services such as site specific (Molenaar 2007). sampling for detailed soil fertility maps and yield maps (Molenaar 2007). Agriculture in Poland is char- Life cycle assessment for energy efficiency acterized by fragmentation of land ownership and a relatively low level of modernization. After World LCA was conducted to estimate energy efficiency War II, lands where divided into small holdings, which only. The general framework and principles for LCA were given to private farmers. Application of precision are described in the ISO 14040 and 14044 standards farming is rare. For example, the use of GPS is not (ISO 14040 2006 and ISO 14044 2006). After
Energy Efficiency

defining the goal and the scope, a Life Cycle Invento-    system. In the calculation, only the 2009 and 2010
ry was performed. Based on literature and interview       production seasons were taken into account.
data, amounts of energy were allocated to the various
processes and products in the biofuel production          Life cycle inventory
chain. Ultimately, energy efficiency in terms of
EROEI was calculated to compare the efficiency of         The LCI determined the baseline for the EROEI cal-
energy production from rapeseed in the two countries.     culation for the entire rapeseed biofuel production
   The goal of the LCA analysis was a comparative         process. In addition to reviewing literature, we
energy efficiency assessment for two countries with       interviewed practicing farmers to compile and refine
different rapeseed crop production systems. The ener-     the list of all inputs and outputs within the boundaries
gy outputs of RME and by-products were related to all     of the rapeseed biofuel production system.
energy inputs required during crop production, trans-         The next step was calculating the energy require-
port and biomass conversion for energy production         ments for each process for both Poland and the Neth-
(EROEI) in Poland and the Netherlands.                    erlands. Ideally, here we would want to have as many
   The energy inputs and outputs at farm level were       respondents as possible distributed across different
expressed as energy (in megajoule) per hectare (ha).      agro-ecological regions, and covering a diverse range
The second-order EROEI calculation performed in           of farming practices. First, farmers were contacted by
this study included the energy inputs to produce rape-    telephone to explain the purpose of the research and to
seed and the amount of fertilizers and chemicals for      ask if they were willing to spend about 15–20 min to
crop protection provided during rapeseed crop growth      fill in a questionnaire composed of 30 questions.
as well as the energy required for transport and the      When they indicated their willingness to cooperate,
conversion of biomass to RME. Figure 3 shows all          they received a questionnaire (translated into their
inputs, processes and outputs of the rapeseed biofuel     own language). The questionnaire included questions
                                                          on the location of the farm, the distance to the fields
                                                          where rapeseed was grown and the distance to the
                                                          biofuel production plant. Furthermore, questions were
                                                          included on the types and quantity of fertilizers and
                                                          crop protection chemicals used.
                                                              In the Netherlands, we received a list of farmers
                                                          growing rapeseed in 2009 and 2010 via LTO Nether-
                                                          lands (the Dutch farmers’ organization). Because the
                                                          response rate of the farmers was low we tried unsuc-
                                                          cessfully to increase the sample by contacting the local
                                                          farmer cooperatives or beekeepers who advertised that
                                                          their honey was from rapeseed. A practical solution to
                                                          increase the number of respondents was by contacting
                                                          farmers of fields where rapeseed was visually ob-
                                                          served. This resulted in two more on-farm interviews.
                                                          Based on the recommendation and contact addresses
                                                          provided by the Rapeseed Farmers Association, Polish
                                                          farmers were also contacted face to face, over the
                                                          phone and by mail.
                                                              Unfortunately the response rate was low. We have
                                                          ended up with eight farmers in each country
                                                          responding to our survey. Farmers were reluctant to
                                                          discuss numbers that were somehow associated with
                                                          the productivity of their farms or their profits and
                                                          losses. In other cases, they were probably too busy
Fig. 3 System diagram for rapeseed biodiesel production   or did not connect the research with their needs or
Energy Efficiency
interests. Nevertheless, they have provided important product from milk and meat production, and Dutch
information about their farming practices, were instru- farmers, for example, pay additional costs to get rid of
mental in validating the processes in our computation- it. Janulis (2004) uses, however, 1993.5 MJ/ha energy
al model, and gave us valuable estimates for energy costs for the production of bio-fertilizer, which is an
inputs and outputs in terms of fertilizers, crop protec- order of magnitude less than the cost of mineral fertil-
tion, transportation, yield, straw production, etc. (see izers, but not zero. The sensitivity of the EROEI value
the systems diagram in Fig. 3). for our assumption was tested.
Computational model Crop Protection Energy (CPE): The energy required
for production of insecticides, herbicides and fungi-
The EROEI calculations were performed on a per- cides. The application quantities (I, H, F, respectively,
hectare basis using the following formulas: in liter per hectare) were provided by the farmers. The
energy conversion factor of 274.1 MJ/kg for all three
Energy inputs types of crop protection chemicals was based on Mor-
timer et al. (2003) and converted from l/ha in kg/ha
Cultivation Energy (CE) The amount of energy in the assuming that the density of the chemicals is equal to
form of diesel fuel used, called here cultivation fuel that of water.
(CF in liter per hectare) for driving the tractor and
operating the machinery to cultivate the land. This CPEðMJ=haÞ ¼ 274:1ðMJ=kgÞ
includes running the tractor to distribute fertilizers, ½Iðkg=haÞ þ Hðkg=haÞ þ Fðkg=haÞ
chemicals or manure. There were large discrepancies
in the numbers derived from the interviews, and we Transportation Energy (TE): The energy required for
ended up using estimates from literature (Downs and round trips between the farm house and field (TF) and
Hansen 1998; Grisso et al. 2010) for the operations from the field to the market (TM) (in most cases this
identified in the interviews. The energy content of was the RME production plant). The average total
35.9 MJ/l for diesel was adopted from the report by distances (in kilometer) over the cultivation period
the European Commission (2005). were calculated from the interviews and doubled to
account for the return trips. Fuel consumption rate for
CEðMJ=haÞ ¼ 35:9ðMJ=lÞ CFðl=haÞ a tractor was assumed at 32.8 l diesel/100 km as
suggested by Lewis (1997)1 and the energy content
Fertilizer Production Energy (FE) The energy re- for diesel was 35.9 MJ/l diesel (European Commission
quired for the production of the three major mineral 2005).
fertilizers: nitrogen, phosphorus and potassium. The TEðMJ=haÞ ¼ 2 0:328ðl=kmÞ 35:9ðMJ=lÞ
quantities of fertilizers (N, P, and K, respectively, in
kilogram per hectare) used for rapeseed production ½TFðkmÞþTMðkmÞÞ=ðfield areaðhaÞ
were derived from the interviews. The energy conver-
sion factors (in megajoule per kilogram) were based
on Lewis (1997) with a more recent conversion factor Feedstock Production Energy (FPE): The total energy
for N-fertilization based on Jenssen and Kongshaug (MJ) required to produce the per-hectare feedstock and
(2003). deliver it to the biofuel processing plant. It is the
FEðMJ=haÞ ¼ 40:3ðMJ=kgÞ Nðkg=haÞ 1
It would make sense to assume that trucks instead of tractors
would be used to deliver the yield to markets, especially over
þ 8:6ðMJ=kgÞ Pðkg=haÞ longer distances. This may be the case but it hardly changes our
results, because fuel consumption of heavy trucks is almost the
þ 6:4ðMJ=kgÞ Kðkg=haÞ same as for tractors. Natural Resources Canada reports in a 2000
survey that the average fuel consumption of its fleet was
39.5 l/100 km (http://oee.nrcan.gc.ca/transportation/business/
When raw manure was used as a substitute for
documents/case-studies/fuel-effic-benchm.cfm?attr=16). Even
mineral fertilizers, we assumed its energy production assuming that this has improved over the past 12 years, we get
costs to be zero. Manure can be seen as waste or side results similar to what we have for tractors.Energy Efficiency
summation of the energy inputs above: produced. Their energy allocation factors were
FPEðMJ=haÞ ¼ CEðMJ=haÞ þ FEðMJ=haÞ 3.38 MJ/kg biodiesel for extraction of crude rape-
seed oil from the rapeseed yield (EE), 0.34 MJ/kg
þ CPEðMJ=haÞ þ TEðMJ=haÞ biodiesel for refining the crude oil into refined
rapeseed oil (RE) and 7.7 MJ/kg biodiesel for the
The next step was calculating the energy input to conversion of refined rapeseed oil into biofuel
convert the feedstock into biofuel. (BPE). From their mass balance, it was derived
that 1 kg of biodiesel requires 2.66 kg of rape-
Conversion energy (CoE): The energy for extrac- seed, which means 1 kg of rapeseed produces
tion, refining and RME production is dependent 0.376 kg biofuel. This results in energy allocations
on the rapeseed yield and amount of biodiesel per kilogram of rapeseed, which can be further
produced from it. Campbell and McCurdy (2008) multiplied by Y, yield (in kilogram per hectare)
described the different conversion products. They to recalculate on a per-hectare basis:
expressed energy input per kilogram of biodiesel
EEðMJ=haÞ ¼ 3:38ðMJ=kg biofuelÞ 0:376ðkg rapeseed=kg biofuelÞ Yðkg rapeseed=haÞ ¼ 1:27ðMJ=kgÞ Yðkg=haÞ
REðMJ=haÞ ¼ 0:34ðMJ=kg biofuelÞ 0:376ðkg rapeseed=kg biofuelÞ Yðkg rapeseed=haÞ ¼ 0:13ðMJ=kg rapeseedÞ
Y ðkg rapeseed=haÞ
BPEðMJ=haÞ¼7:7ðMJ=kg biofuelÞ0:376ðkg rapeseed=kg biofuelÞYðkg rapeseed=haÞ¼2:89ðMJ=kg rapeseedÞ
Yðkg rapeseed=haÞ
The total amount of energy necessary for the con- biodiesel has the same energy content as 1.00 kg of
version of rapeseed biomass in biofuel (RME) is: fossil diesel. This means that 1.00 kg of biodiesel has
the same energy content as 0.926 kg of fossil diesel,
CoEðMJ=haÞ ¼ EEðMJ=haÞ þ REðMJ=haÞ
which gives us the energy conversion factor of 0.926×
þ BPEðMJ=haÞ 35.9 =33.2 MJ/kg biofuel based on the fossil fuel
diesel energy content 35.9 MJ/kg (European Commis-
Total energy invested (TEI): The summation of all the sion 2005) and 1 kg of rapeseed produces 0.376 kg
energy required for cultivation, fertilizer production, biofuel (Campbell and McCurdy 2008):
crop protection chemicals production, transport and
the conversion energy. ERMEðMJ=haÞ ¼ 33:2 ðMJ=kg biofuelÞ
TEIðMJ=haÞ ¼ FPEðMJ=haÞ þ CoEðMJ=haÞ 0:376ðkg biofuel=kg rapeseedÞ
Energy outputs Yðkg rapeseed=haÞ
The by- and waste products considered in the cal-
All energy outputs are converted to values that are culation were rapeseed straw, meal (cake), and
expressed in the amount of energy produced per unit glycerin.
farm area (MJ/ha). Since most output energy conver-
sion factors and values found in literature were related Energy from Straw (ES): Rapeseed is mainly grown
to the weight of biofuel produced, we converted those for its seeds but leaving straw, roots and empty pods
values to energy per kilogram rapeseed feedstock and after harvesting the seeds on the land causes an as-
then multiplied it by yield (Y) in kilogram per hectare. sumed reduction of 32.5 kg of N/ha fertilization to
grow the next crop. This energy reduction is called the
Energy output in the form of biodiesel or RME “preceding crop effect” (ES) and is equivalent to
(ERME): This was calculated as follows: According 2122.5 MJ/ha (Gärtner and Reinhardt 2003). This is
to Campbell and McCurdy (2008), 1.08 kg of an average value used in many LCAs and it assumesEnergy Efficiency
that the amount of straw that becomes available as Now the final step, the calculation of the energy
fertilizer is not dependent upon yield. efficiency in the form of energy return on energy
investment (EROEI) can be made.
ESðMJ=haÞ ¼ 2122:5ðMJ=haÞ
EROEI ¼ TERðMJ=haÞ =TEIðMJ=haÞ
Energy from Meal (EM): The mass balance of
Campbell and McCurdy (2008) shows that per
The calculation of EROEI was performed for every
2.66 kg rapeseed feedstock, there is 1.6 kg rape-
farmer. In case a farmer had not filled in all questions,
seed meal and 0.1 kg glycerin produced while
we assumed that this farmer used the average of the
producing 1 kg RME. The real energy content of
other farmers. This resulted in an average EROEI
rapeseed meal is unknown and, therefore, Camp-
value as well as estimates of EROEI with minimum
bell and McCurdy (2008) used economic values to
or maximum energy input.
allocate the energy content value of 5.08 MJ/kg
biodiesel or 1.91 MJ/kg rapeseed feedstock. In this
case, their calculations were based on substituting
Results
rapeseed meal with another animal feedstock with
a known energy value and an equal price.
Survey outcomes
EMðMJ=haÞ ¼ 1:91ðMJ=kg rapeseedÞ Yðkg rapeseed=haÞ
The interviews with farmers showed that rapeseed
The energy production in the form of glycerin was cultivation practices varied between farmers within a
according Campbell and McCurdy (2008) 13 % of the country as well as between farmers in the different
total energy requirements to produce biodiesel. countries, Poland and the Netherlands.
All energy inputs were quantified per hectare rape-
EGðMJ=haÞ ¼ 0:13 TEIðMJ=haÞ
seed cropland. Table 1 shows the summary of the
different inputs in the two countries, including the
The total energy return (TER) from the rapeseed
minimum, average and maximum input per country.
biofuel production chain is the summation of all the
Although the figures are based on a low number of
individual output processes.
farmer’s responses, the pattern that can be observed is
TERðMJ=haÞ ¼ ERMEðMJ=haÞ þ ESðMJ=haÞ clear and consistent. Fertilizer (NPK) input appears to
be higher in Poland compared to the Netherlands
þ EMðMJ=haÞ þ EGðMJ=haÞ while the crop yield is lower. This is in spite of the
Table 1 Inputs and outputs in rapeseed cropping based on per hectare) derived from the interviews appeared to be incon-
farmers interviews in Poland and the Netherlands. Cultivation sistent. Estimates from literature (Downs and Hansen 1998;
includes running tractors, machineries and land operations car- Grisso et al. 2010) were used instead
ried out in the field. The numbers for cultivation fuel use (in liter
Inputs and outputs Poland (n=8) Netherlands (n=8)
Minimum Average Maximum Minimum Average Maximum
Nitrogen (kg/ha) 90 183 342 55 135 200
Phosphorus (kg/ha) 12 69 102 0 29 80
Potassium (kg/ha) 16 110 160 0 73 150
Insecticide (l/ha) 0.3 1.1 2.0 0 0.2 0.8
Herbicide (l/ha) 2.0 2.3 3.0 1.5 2.1 4.0
Fungicide (l/ha) 0.8 1.4 2.0 0 0.5 1.5
Distance to field (km) 1 2 5 0.5 4 10
Distance to market (km) 10 84 300 2 61 100
Yield (Mg/ha) 2.9 3.4 4.0 3.0 4.0 5.0Energy Efficiency
fact that Poland enjoys relatively large areas with EROEI calculation based on LCI
better agro-ecological conditions for rapeseed produc-
tion (Fig. 2). Average herbicide use in both coun- The EROEI values in Poland ranged from 1.73 to 2.36
tries seems to be quite similar. But it looks like and in the Netherlands from 2.18 to 2.60 (Fig. 4a and c).
more insecticide is applied in Poland than in Neth- To help to understand and interpret the results, the
erlands whereas fungicide application is lower in calculations are broken into relatively small steps. It
the Dutch farming system. The farm to market should be noted that the “lowest EROEI value” is dif-
transport distances are longer in Poland compared ferent from “the EROEI value resulting from the lowest
to the Netherland. But it seems Polish farmers input”. In Table 2, first all energy inputs are presented
travel less from their farm to the field and vice followed by the calculated and summed energy outputs.
versa compared to the Dutch farmers. We should The last row shows the resulting EROEI value. In this
be careful, however, with making hard claims table, a comparison is made between the average inputs,
based on these figures as the number of respon- outputs and resulting EROEI of all interviewed farmers
dents was too low to consider our two farmers’ per country and the EROEI calculations for the farmer
surveys fully representative for the entire country. with the lowest energy input and the one with the
Nevertheless, these numbers are sufficient to ana- highest energy input in crop growth.
lyze how on-farm practices influence the energy In terms of energy investment, farmers in Poland
efficiency of the energy production process in both have on the average a higher energy input compared to
countries. their Dutch colleagues. This is mainly due to applica-
tion of larger amounts of mineral fertilizers, which
Rapeseed crop production contribute 33.1 and 22.2 % of the total energy invested
in Poland and Netherlands, respectively. Higher fertil-
Polish farmers plough and sow rapeseed in August. izer application does not result in a higher yield: the
They apply fertilizers two to four times and depending average Polish rapeseed yield was 3.4 Mg/ha, while
on the appearance of weeds, pests, and fungi they the Dutch farmers produced an average 4.0 Mg/ha
apply crop protection chemicals three to four times (Table 1). The energy required for the conversion of
(0.3 to 3 l/ha) during the growing season. In rotation rapeseed biomass to energy is the same when calcu-
with rapeseed, other crops are grown by farmers, of lated per kg rapeseed but since the yields are larger in
which the most common ones are wheat, barley, the Netherlands the conversion energy per hectare is
maize, and legumes. The average yield of rapeseed is larger in the Netherlands compared to Poland.
3.4 Mg/ha. Almost all farmers sell the yield produced The fertilizers considered for the energy calculations
to temporary storage companies, oil producing facto- are mineral fertilizers (NPK) and bio-fertilizer (manure,
ries, and biofuel producing refineries by themselves or as common in the Netherlands). We assumed the energy
through farmer cooperatives. production costs of bio-fertilizers to be zero, since ma-
Dutch farmers also sow in August after plowing nure in many cases is considered as a nuisance and
and fertilizing the land. Due to precision farming farmers actually have to pay to get rid of it. If we need
techniques they can use less fertilizers compared to to factor in the energy costs of bio-fertilizers, we can
Polish farmers. Dutch farmers apply organic manure assume the number provided by Janulis (2004), in
during land preparation and rapeseed sowing. This which case the EROEI value of the Dutch rapeseed
was not common practice in Poland (personal commu- farmers will drop by 0.16. The difference in the type
nication with Szymon Kuczyński 2011, and inferred of fertilizers applied in the two countries results in
from the survey outcome). The tractors and combine different energy costs for rapeseed production. Out of
harvesters are comparable in the two countries. Agro- the three commercial fertilizers, nitrogen has the highest
chemicals (0 to 4 l/ha) are used depending on the energy production cost (40.3 MJ/kg). In Poland, average
infestation threat. Farmers commonly grow wheat, nitrogen application was 183 kg/ha, which translates
barley, and maize in rotation with rapeseed. The aver- into 7,375 MJ/ha spent on N-fertilizer. Compared to
age yield for rapeseed is 4.0 Mg/ha. Rapeseed pro- the total energy investment of 26,183 MJ/ha this is
duced was sold to biodiesel factories in the 28.1 %. For the Netherlands, N-fertilizer energy require-
Netherlands or in some cases exported to Germany. ments are 19.1 % of the total energy investment.Energy Efficiency Nitrogen fertilizers are most energy demanding and take with the lowest energy investment produced the low- over 85 % of energy required for production of mineral est yield resulting in a relatively low EROEI. Howev- fertilizers in Poland and the Netherlands (Table 2). Note er, it was almost the same as for the farmer with the that the EROEI values that result from the lowest, aver- highest energy investment. When comparing energy age and highest energy input are different from the return on energy invested it shows that in general highest, average and lowest EROEI values, respectively. Dutch farmers produce rapeseed more efficiently than The distances from the farm to the refinery are some- Polish farmers and the downward trend in Fig. 4a is what larger in Poland, resulting in a higher energy in- more pronounced in Poland than in the Netherlands. vestment for transport. The conversion processes from Obviously, in both countries, additional energy invest- biomass to energy are assumed to be the same for Poland ments in the form of N-fertilization do produce higher and the Netherlands but due to higher yields in the yields (Fig. 4d). However, the additional energy need- Netherlands the per-hectare energy gain is higher there. ed to grow and process this higher yield is not “worth” In both countries, a larger energy investment does the investment as shown in Fig. 4c. not result in higher energy production efficiency al- The comparison in Fig. 4d between Polish and though a higher crop yield is produced (Fig. 4a and b). Dutch farmers regarding the effect of nitrogen input The highest energy efficiency is generally achieved on the yield shows that energy investments in nitrogen when crops are produced with the least energy hardly improve the yields of Polish farmers while it invested. In the Netherlands, the interviewed farmer does have an effect for the Dutch farmers. The slope of Fig. 4 EROEI and yield graphs based on farmers interviews in Poland and the Netherlands (n=8 for both countries)
Energy Efficiency

Table 2 Energy input, output and EROEI values for Poland and          to cultivate the land (CE) was not derived from interview data
the Netherlands with average, minimum and maximum total               but estimated based on literature (Downs and Hansen 1998;
energy investment. Energy investment for operating machinery          Grisso et al. 2010)

                                                               Poland                             Netherlands

                                                               Minimum Average         Maximum Minimum Average           Maximum

Energy investment (in MJ/ha)
CE (Cultivation Energy)=35.9×CF                                1,615.50    1,615.50    1,615.50   1,615.50    1,615.50   1,615.50
FE (Fertilization Energy)=40.3×(N)+8.6×(P)+6.4×(K)             4,671.00    8,668.96    15,679.27 4,667.25     6,158.44   9,388.00
Organic manure                                                                                    1,993.50    1,993.50   1,993.50
CPE (Crop Protection Energy)=274.1 (I+H+F)                     1,123.81    1,333.95    1,644.60   853.14      763.63     1,014.17
TE (Transportation Energy)=2×0.328×35.9×(TF+TM)/(field 18.25               32.54       51.81      56.52       35.26      71.47
 area)
PTE (Production and Transport Energy)=CE+FE+CPE+TE 7,428.56                11,650.95 18,991.18 9,185.91       10,566.33 14,082.64
EE=1.27×Y                                                      3,810.00    4,302.13    4,762.50   3,810.00    5,070.93   6,223.00
RE=0.13×Y                                                      390.00      440.38      487.50     390.00      519.07     637.00
BPE=2.89×Y                                                     8,670.00    9,789.88    10,837.50 8,670.00     11,539.36 14,161.00
CoE (conversion energy)=CoE×Y                                  12,870.00 14,532.38 16,087.50 12,870.00 17,129.36 21,021.00
TEI (Total energy investment) PTE+CoE                          20,298.56 26,183.33 35,078.68 22,055.91 27,695.68 35,103.64
Energy return (in MJ/ha)
ERME (Energy in RME)=33.2×0.376×Y                              37,449.60 42,286.84 46,812.00 37,449.60 49,843.63 61,167.68
EM (Energy in meal)=1.907×Y                                    5,721.00    6,459.96    7,151.25   5,721.00    7,614.38   9,344.30
ES (Energy in straw)=2122.5                                    2,122.50    2,122.50    2,122.50   2,122.50    2,122.50   2,122.50
EG (Energy in glycerin)=0.13×TEI                               2,638.81    3,403.83    4,560.23   2,867.27    3,600.44   4,563.47
TER (Total Energy Return)=ERME+EM+ES+EG                        47,931.91 54,273.13 60,645.98 48,160.37 63,180.95 77,197.95
EROEI=TER/TEI                                                  2.36        2.07        1.73       2.18        2.28       2.20

the trend lines for energy and nitrogen investment in                 resulted in EROEI values going down by 0.03. This
relation to yield (Fig. 4b and d) of Dutch farmers is                 means that producing bioenergy from straw seems to
relatively more similar than respective slopes of trend               provide less energy than the energy saved when straw
lines for the Polish farmers. In terms of energy gains,               is left on the land to reduce the input energy in the
these investments are not useful for them. It appears                 form of fertilization for the next crop.
that fertilizer input, especially nitrogen fertilizer, can
dramatically reduce efficiency of biodiesel production
(Fig. 4c). Still we should be careful with these obser-               Discussion
vations, because in all cases we are looking at results
from different farms with potentially different agro-                 Rapeseed biofuel production is seen as an opportunity
climatic conditions. This means that we do not really                 to reduce greenhouse gas emissions and societal de-
know what would be the yield if fertilizers were not                  pendency on non-renewable fossil fuels (European
applied or alternative agricultural practices would be                Biodiesel Board 2011). Since yield is one of the vari-
implemented.                                                          ables for calculation of EROEI, every unit change in
   The energy allocation for straw was in both coun-                  yield changes the EROEI value. Lewis (1997) indicat-
tries the same as it was not based on the energy                      ed that energy inputs and yield per hectare depend on
content of straw but on a standard estimated preceding                the different cultural practices and agro-climatic con-
crop effect (Gärtner and Reinhardt 2003). Running the                 ditions. This is clearly shown in the two case study
calculation again, using the estimated amount of straw                countries, which have different agricultural practices
indicated by the farmers did not result in substantially              and agro-ecologies as indicated from the interview
different EROEI values. In both countries, this                       results. Both Lewis (1997) and Janulis (2004)
Energy Efficiency
described that energy efficiency depends on “agro- showed sufficient differentiation in rapeseed cropping
climatic conditions” and practices and technology activities. This makes us believe that the calculations
used for the production of biofuel crops. Looking at on energy inputs and outputs provide useful insight on
the rapeseed suitability map in Fig. 2, it seems that in energy efficiency of rapeseed biodiesel production.
terms of agro-ecology, Poland would be a more effi- Also quite fortunately, the farmers’ responses came
cient place to produce rapeseed biofuels than the from quite variable agro-ecological conditions (see
Netherlands but our calculations show that currently Fig. 2), covering all the predominant suitability classes
the situation is the opposite. The main difference be- in both countries, including marginal, very marginal
tween farming practices in the two countries is in the and suitable areas in the Netherlands, as well as highly
use of high-tech precision farming techniques (use of suitable, very highly suitable and good areas in
manure and targeted application of fertilizers) in the Poland.
Netherlands as described by Molenaar (2007). It ap- From other studies (Bernesson et al. 2004;
pears that this may be influencing crop yields more Börjesson et al. 2010; Lewis 1997) it was already
than climate or ecological conditions. Growing rape- known that mineral fertilizers, and nitrogen in partic-
seed crops in best agro-ecological conditions, consid- ular, have a relatively large impact on the energy
ering soils, elevation, slope, and climate, will also efficiency of rapeseed biofuel production. This re-
boost the efficiency. However, in this case, biofuels search, based on interviewing farmers validated this.
become especially dangerous by encroaching into The fact that it is still profitable for the farmers to
prime agricultural lands and directly competing and apply large amounts of fertilizers in attempt to increase
displacing food production. This is exactly what may the yield can mean only that the current market prices
be happening if biofuels are further subsidized, and for fertilizers do not reflect their true energy cost.
market preferences are distorted. Again subsidies and failure to account for true envi-
In this study, much time and effort was spent to ronmental and social costs of energy blur the picture
prepare and execute the interviews with farmers. and lead to distorted efficiencies. This is yet another
Searching for names and contact details of rapeseed reason why objective measures of energy efficiency,
farmers, and contacting the farmers before we could such as EROEI, are important to understand the true
interview them was time consuming. The law on the picture.
protection and preservation of privacy rights of indi- Additionally our study also showed that there is
viduals does not allow easy access to this type of substantial variation in the amounts of fertilizers used.
information via Governmental offices or large farmers The entire package of farming activities, and conse-
organizations. Therefore, we had to directly contact quently the total energy input affects the yield. How-
farmers’ cooperatives, local farmers’ organizations ever, in Poland, nitrogen fertilization had a relatively
and track farmers based on personal observations of weak relationship with the yield. In the Netherlands,
them growing rapeseed. This certainly could result in the link between energy investment in nitrogen and an
some bias in the farmer’s distribution over the coun- increase in crop yield is obviously stronger. In both
tries. In the Netherlands, we were able to contact more cases, however, there was a negative relationship be-
farmers in the East and South of the country than in tween total energy investment and EROEI. The trend
the West and North of the country. line for Poland went down steeper compared to the
After identifying rapeseed farmers, it remained a one of the Netherlands. This is again contributed to a
challenge to contact them and convince them to par- fairly large investment in N fertilization with hardly
ticipate in our research. The time slot when farmers any effect on the yield. We conceptualized this rela-
could be reached by telephone to explain the purpose tionship in Fig. 5. In case of low energy input (a), an
of the research or to make an appointment for sending increase in input leads to higher yields and higher
a questionnaire or to plan a visit is very limited. EROEI values. In point (b), the maximum EROEI
Several farmers who said that they were willing to fill value is reached in the stage where an increase in input
in a questionnaire eventually never responded. The energy balances the increase in output energy. Further
benefits of their participation are unclear and it was increasing the input energy increases the yield but not
based on their good will only. Although the number of the net energy that can be produced from it (c). It
responding farmers was lower than planned, they should be noted that this application of manure couldEnergy Efficiency
compared to the Netherlands as suggested by the
suitability map of the IIASA (Fischer et al. 2002).
We should remember that there are a lot of uncer-
tainties in doing these kinds of substitutions and gen-
eralizations. After all for each individual farm we have
a unique combination of ecological (soil quality, ter-
rain, etc.), climatic (temperature, wind, soil moisture,
etc.) and agricultural (sowing practice, application
schedules for fertilizers and pesticides, harvesting,
storage, etc.) conditions, which also translate into
Fig. 5 Conceptual diagram of energy investment related to unique energy performance results. We can only ob-
yield and EROEI serve a general trend that more energy investment does
not seem to result in more net energy produced. How-
be also considered as waste disposal and treatment, ever, locally, this conclusion may not hold.
and therefore does not have to come as an energy cost. If we take into account the energy quality issue, the
Manure disposal is a very hot issue in farming and in use of energies of other quality (say wind and solar
most cases farmers have to pay additional fees and electricity) as input energy may make rapeseed biofuel
spend additional energies to get rid of the manure. In still an attractive product. For instance, assuming that
case we do not treat manure as a side product from all energy conversion (CoE) expenses, as well as fer-
another production process and do allocate energy tilizer (FE) and pesticide (PTE) production can all be
costs to its application, the EROEI value for Dutch covered by electricity derived from renewable sources
farmers goes down by 0.18. (wind, solar, etc.) and limiting our EROEI estimates
Checking the FAO statistics database reveals only to the liquid phase (biodiesel), we can get sub-
that over the last 10 years reported in the database stantially higher values of 31.3 in Poland and 16.2 in
(2000–2009) Poland and the Netherlands achieved the Netherlands. Optimizing the use of by- and waste
average countrywide yields of 2.5 and 3.4 Mg/ha, products can also contribute to a higher efficiency of
respectively, (FAOSTAT 2011). This is substantial- biofuel production. All this can potentially make bio-
ly less compared to the average yields reported by diesel a viable alternative to fossil fuels.
the farmers in our study for 2010. We hypothesize Also, alternative uses of by- and waste products as
that farmers with relatively high yields were more energy sources can produce savings on the energy
likely to participate, being proud of their results input side and boost the overall efficiency of the
and not afraid to show them to researchers. If we process in terms of a specific energy type (liquid
take the average FAO yield over the last 10 years fuels). There are a number of stages in the process
for both countries as a basis of our calculations where energy of a different type of quality can be
and assume the average energy input the same as used, which can make biofuels still a viable substitute
reported by the farmers participating in our study, at least for the transition period. However, without
then the EROEI values would drop 0.24 in Poland those improvements and adjustments the future of
and 0.12 in the Netherlands. However, if these biodiesel looks quite bleak.
yields were obtained with lower energy inputs Other important aspects that may determine the
and if we take these inputs from the trend lines attractiveness of rapeseed biofuel is variability in crop
in Fig. 4b, then the corresponding input invest- yields (Fig. 4 and FAOSTAT 2011) and fluctuations in
ments would be 15 GJ/ha for Poland (for a yield market prices (FAOSTAT 2011) for farmers as these
of 2.5 Mg/ha) and around 24 GJ/ha in Netherlands may cause undesired fluctuations in the feedstock
(for a yield of 3.4 Mg/ha). Feeding these figures availability. This is more or less related to the current
into our computational model (explained in the issues of indirect effects of biofuel productions on
“Computational model” section) results in an food crops such as rapeseed.
EROEI of 2.67 for Poland and 2.26 for the Neth- Life cycle analyses are relaying on literature refer-
erlands, which would confirm the better potential ring to quantities of inputs and outputs including by-
for efficient rapeseed biofuel production in Poland and waste products as well as conversion factors.Energy Efficiency
Some of these references are already quite old, not depends on the yield of the feedstock, increasing
taking into account recent developments in produc- yields without substantial additional inputs of energy,
tion techniques or energy use. In this research, we for example by using manure instead of mineral fer-
have conducted farmers’ interviews to extend and tilizers, can improve the EROEI of the process.
double check the data available from literature in The fact that it is still profitable for the farmers to
attempt to improve the quantification of different apply large amounts of fertilizers in attempt to increase
energy inputs and outputs in rapeseed production. the yield can only mean that the current market prices
The relatively low number of responses of farmers for fertilizers do not reflect their true energy cost—
was, however, a factor that had to be taken into another reason to evaluate sustainability of biofuels
account while interpreting the absolute EROEI with objective measures of energy efficiency, such as
figures but the patterns observed are clear. EROEI.
Like other researchers involved in EROEI as- Searching for possibilities to use renewable energy
sessments, we ran into the difficulty of unclear sources as input in rapeseed biofuel production and
reporting on boundary conditions or methodologies optimizing the use of by- and waste products can
in various reports, which made comparison with result in substantial savings on the energy input side
other studies tricky. and boost the overall efficiency of the process.
Validation of energy efficiency in refining plants Collecting data about actual on-farm practices and
was not possible as none of the contacted refineries resulting crop yields is a challenge. Farmers do not
wanted to cooperate in this study. It seems they feel often respond to on-line questionnaires as they are too
that outcomes of studies like this one are not beneficial busy or they do not see any benefit for themselves.
for their business. However, updating conversion factors by including
information on what farmers actually do on their land
and to which crop yield this leads, will definitely
Conclusions contribute to more realistic bioenergy production effi-
ciency figures.
Our analysis has confirmed that, currently, EROEI
of biodiesel production is quite low. Improving the Acknowledgments This study was enabled by European
funding in the form of an Erasmus Mundus Scholarship for
energy efficiency of rapeseed biodiesel is certainly
the first author. We are highly indebted to the Polish and Dutch
crucial if we want it to become a viable substitute rapeseed farmers, who participated in this research. We also
for fossil fuels such as oil and gas, which still would like to thank Antoon Kleverkamp (Colzaco) and Joep
have much higher EROEIs. It has been depicted Hermans (Carnola) for their valuable information on rapeseed
farming and rapeseed biofuel production. Joanna Sopyło is
that different inputs and processes have different
acknowledged for translating the questionnaire into Polish and
impacts on overall energy efficiency. The study assisting in interviewing farmers during the study. A. Voinov
concluded that fertilizer input, especially nitrogen was partially supported by the BE2.0 (Bioenergy for Overijssel)
fertilizer, could dramatically reduce efficiency of project. We also thank the reviewers for their valuable com-
ments on the manuscript.
biodiesel production. The fact that it is still prof-
itable for the farmers to apply large amounts of
fertilizers in attempt to increase the yield can mean
only that the current market prices for fertilizers
References
do not reflect their true energy cost. Again subsi-
dies and failure to account for true environmental
and social costs of energy blur the picture and Ajanovic, A. (2011). Biofuels versus food production: does
biofuels production increase food prices? Energy, 36(4),
lead to distorted efficiencies. This is yet another 2070–2076. doi:10.1016/j.energy.2010.05.019.
reason why objective measures of energy efficien- Arvidsson, R., Persson, S., Fröling, M., & Svanström, M.
cy, such as EROEI, are important to understand (2011). Life cycle assessment of hydrotreated vegetable
the true picture. oil from rape, oil palm and Jatropha. Journal of Cleaner
P ro d u c t i o n , 1 9 ( 2 – 3 ) , 1 2 9 – 1 3 7 . d o i : 1 0 . 1 0 1 6 /
Generally, we show that investing more energy to j.jclepro.2010.02.008.
boost rapeseed yields in most cases results in lower Baka, J., & Roland-Holst, D. (2009). Food or fuel? What Euro-
EROEI values. Of course, since output of biofuels pean farmers can contribute to Europe’s transport energyEnergy Efficiency
requirements and the Doha Round. Energy Policy, 37(7), Davis, S. C., Anderson-Teixeira, K. J., & DeLucia, E. H. (2009).
2505–2513. doi:10.1016/j.enpol.2008.09.050. Life-cycle analysis and the ecology of biofuels. Trends in
Batchelor, S. E., Booth, E. J., & Walker, K. C. (1995). Plant Science, 14(3), 140–146.
Energy analysis of rape methyl ester (RME) produc- Demirbas, A. (2008). Biofuels sources, biofuel policy, biofuel
tion from winter oilseed rape. Industrial Crops and economy and global biofuel projections. Energy Conver-
Products, 4(3), 193–202. doi:10.1016/0926-6690 sion and Management, 49(8), 2106–2116. doi:10.1016/
(95)00032-8. j.enconman.2008.02.020.
Bernesson, S., Nilsson, D., & Hansson, P.-A. (2004). A limited Downs, H.W., & Hansen, R.W. (1998). Estimating Farm Fuel
LCA comparing large- and small-scale production of rape Requirements. Colorado State University Extension. Fact
methyl ester (RME) under Swedish conditions. Biomass Sheet No. 5.006, www.ext.colostate.edu. Accessed 22 Jan-
a n d B i o e n e rg y, 2 6 ( 6 ) , 5 4 5 – 5 5 9 . d o i : 1 0 . 1 0 1 6 / uary, 2013.
j.biombioe.2003.10.003. EIA U.S. Energy Information Administration (2010). Interna-
Bomb, C., McCormick, K., Deurwaarder, E., & Kåberger, T. tional Energy Outlook 2010—Highlights. Report DOE/
(2007). Biofuels for transport in Europe: lessons from EIA-0484(2010) U.S. Energy Information Administration.
Germany and the UK. Energy Policy, 35(4), 2256–2267. Washington, USA.
doi:10.1016/j.enpol.2006.07.008. European Biodiesel Board (2011). What is biodiesel? http://
Börjesson, P. (2009). Good or bad bioethanol from a greenhouse www.ebb-eu.org/biodiesel.php#whatis. Accessed 17 May
gas perspective—what determines this? Applied Energy, 86 2011.
(5), 589–594. doi:10.1016/j.apenergy.2008.11.025. European Commission (2005). PURSUANT TO ARTICLE 4(1)
Börjesson, P., Tufvesson, L., & Lantz, M. (2010). Life Cycle OF DIRECTIVE 2003/30/EC: on the promotion of the use
Assessment of Biofuels in Sweden. http://www.miljo.lth.se/ of biofuels or other renewable fuels for transport. Brussels,
svenska/internt/publikationer_internt/pdf-filer/Re- Belgium.
port%2070%20-%20LCA%20of%20Biofuels%20(1).pdf. FAOSTAT (2011). Data related to Food and Agriculture (2011).
Report Number: 70, Lund University Department of Tech- FAO. http://faostat.fao.org/. Accessed 20 May 2011.
nology and Society Environmental and Energy Systems Farrell, A. E., Plevin, R. J., Turner, B. T., Jones, A. D., O’Hare,
Studies. Accessed 18 May 2011. M., & Kammen, D. M. (2006). Ethanol can contribute to
Börjesson, P., & Tufvesson, L. M. (2011). Agricultural crop- energy and environmental goals. Science, 311(5760), 506–
based biofuels—resource efficiency and environmental 508. doi:10.1126/science.1121416.
performance including direct land use changes. Journal of Fischer, G., van Velthuizen, H., Shah, M., & Nachtergaele, F.
Cleaner Production, 19(2–3), 108–120. doi:10.1016/ (2002). Global Agro-ecological Assessment for Agricul-
j.jclepro.2010.01.001. ture in the 21st Century: Methodology and Results. Report
Brecha, R. J. (2008). Emission scenarios in the face of fossil- RR-02-02. International Institute for Applied Systems
fuel peaking. Energy Policy, 36(9), 3492–3504. Analysis (IIASA) in collaboration with FAO. Laxenburg,
doi:10.1016/j.enpol.2008.05.023. Austria.
Bureau, J. C., Disdier, A. C., Gauroy, C., & Treguer, D. (2010). Gärtner, S. O., & Reinhardt, G. A. (2003). Life Cycle Assess-
A quantitative assessment of the determinants of the net ment of biodiesel: update and new aspects. Heidelberg,
energy value of biofuels. Energy Policy, 38(5), 2282–2290. Germany: Institute for Energy and Environmental Re-
doi:10.1016/j.enpol.2009.11.089. search (IFEU).
Campbell, A., & McCurdy, M. (2008). Primary Energy and Grisso, R., Perumpral, J.V., Vaughan, D., Roberson, G.T., &
Greenhouse Gas Emissions from Biodiesel Made from Pitman, R. (2010). Predicting Tractor Diesel Fuel Con-
Southland Rapeseed.: Report No. 08–11583. CRL Energy sumption. Virginia Cooperative Extension, PUBLICA-
Ltd. Lower Hutt, New Zealand. TION 442–073.
Cherubini, F., Bird, N. D., Cowie, A., Jungmeier, G., Hall, C., Balogh, S., & Murphy, D. (2009). What is the mini-
Schlamadinger, B., & Woess-Gallasch, S. (2009). mum EROI that a sustainable society must have? Energies,
Energy- and greenhouse gas-based LCA of biofuel 2(1), 25–47.
and bioenergy systems: key issues, ranges and recom- Halleux, H., Lassaux, S., Renzoni, R., & Germain, A. (2008).
mendations. Resources, Conservation and Recycling, Comparative life cycle assessment of two biofuels ethanol
53(8), 434–447. from sugar beet and rapeseed methyl ester. International
Cherubini, F., & Strømman, A. H. (2011). Life cycle assessment Journal of Life Cycle Assessment, 13(3), 184–190.
of bioenergy systems: state of the art and future challenges. doi:10.1065/Ica2008.03.382.
Bioresource Technology, 102(2), 437–451. doi:10.1016/ Hammond, G. P., Kallu, S., & McManus, M. C. (2008).
j.biortech.2010.08.010. Development of biofuels for the UK automotive mar-
Cleveland, C. J. (2008). Energy return on investment (EROI). In ket. Applied Energy, 85(6), 506–515. doi:10.1016/
C. J. Cleveland (Ed.), Encyclopedia of the Earth. Wash- j.apenergy.2007.09.005.
ington: National Council for Science and the Environment Horne, R., Grant, T., & Verghese, K. (2009). Life cycle assess-
(NCSE). ment; principles, practice and prospects. Australia:
Crutzen, P. J., Mosier, A. R., Smith, K. A., & Winiwarter, W. CSIRO.
(2008). N2O release from agro-biofuel production negates ISO 14040 (2006). Environmental management—Life cycle
global warming reduction by replacing fossil fuels. Atmo- assessment—Principles and framework. Geneva, Switzer-
spheric Chemistry and Physics, 8(2), 389–395. land: International Organization for Standardization,
doi:10.5194/acp-8-389-2008. Switzerland.You can also read