Farmers' Attitudes towards Risk-An Empirical Study from Poland - MDPI
←
→
Page content transcription
If your browser does not render page correctly, please read the page content below
agronomy
Article
Farmers’ Attitudes towards Risk—An Empirical
Study from Poland
                          ˛ 1, * , Paweł Kobus 1 , Kinga Pogodzińska 1 ,
Piotr Sulewski 1 , Adam Was
Magdalena Szymańska  2  and Tomasz Sosulski 2
 1   Institute of Economics and Finances, Warsaw University of Life Sciences—SGGW, 02-787 Warsaw, Poland;
     piotr_sulewski@sggw.edu.pl (P.S.); pawel_kobus@sggw.edu.pl (P.K.);
     kinga_pogodzinska@sggw.edu.pl (K.P.)
 2   Agricultural Institute, Warsaw University of Life Sciences—SGGW, 02-787 Warsaw, Poland;
     magdalena_szymanska@sggw.edu.pl (M.S.); tomasz_sosulski@sggw.edu.pl (T.S.)
 *   Correspondence: adam_was@sggw.edu.pl; Tel.: +48-22-59-342-18

 Received: 25 August 2020; Accepted: 6 October 2020; Published: 13 October 2020

 Abstract: Risk aversion is an important research area in the field of agricultural economics in
 the last years. Creating effective and efficient risk management tools in an increasingly volatile
 economic and natural environment requires proper recognition of farmers’ behavior and attitudes
 towards risk. In this context, the main aim of the paper was to estimate farmers’ attitudes towards
 risk and identification of farm’s and farmer’s characteristics in dependency on risk aversion
 level. The assessment of farmers’ preferences towards risk was based on hypothetical games
 in a representative sample of 600 Polish farms—participants of Farm Accountancy Data Network
 (FADN). Based on the interviews with farmers, a relative risk aversion coefficient has been estimated.
 Results revealed that on average Polish farmers have quite a strong risk aversion. Their attitudes
 towards risk are strongly linked with their self-assessment regarding their way of making decisions
 under risk. Some relations between farmers’ risk aversion and perception of selected risk factors
 could also be observed. The results revealed that the application of specified risk management tools
 by farmers and their potential reaction to a significant income drop are related to risk aversion level.

 Keywords: risk aversion; expected utility; risk perception; farm income; farmers’ behavior;
 Polish farmers

1. Introduction
     The problem of risk aversion has been one of the critical research areas in the field of agricultural
economics in the last years [1,2]. Recognition of risk perception and farmers’ response to risk is a
crucial factor in understanding their decisions in uncertain situations [3,4]. As emphasized by many
researchers [5–7], knowledge of farmers’ preferences towards risk is essential for farmers themselves,
for advisory services, industry (providing production and food processing agents), and policymakers.
By knowing their own risk preferences, farmers can better manage their farms. The policymakers can
pursue an agricultural policy that increases the efficiency of the sector through better spending of
public funds. For the industry providing production resources (fertilizers, plant protection chemicals,
machinery, financial services), being aware of farmers’ risk attitudes can allow them to offer innovative
products and services better suited to the needs of farmers. The processing industry can better
anticipate fluctuations in the supply of agricultural raw materials.
     As Kumbhakar [8] noticed, producers’ attitudes toward risk are substantial in input allocation
decisions. Hence, it is desirable to consider a model that includes not only production risk but also
producers’ attitudes towards risk. Consequently, all components of technology are also affected by

Agronomy 2020, 10, 1555; doi:10.3390/agronomy10101555                        www.mdpi.com/journal/agronomy
Agronomy 2020, 10, 1555 2 of 21
the presence of risk. Many years ago, Feder [9] emphasized that risk-averse farmers were using a
lower amount of inputs than optimal, which could lead to decreasing potential of the farm’s efficiency.
Ullah et al. [4] point out that “farmers’ risk attitude and risk perceptions are crucial factors that affect
their farm production, investment and management decisions.” Understanding the mechanisms of
making production decisions by farmers under uncertainty has become more and more substantial due
to the declining stability of production and economic conditions in agriculture in recent years. It results
from increasing climate change [10–12], progressive liberalization of the conditions of international
trade in agricultural products [13,14], as well as changes in agricultural policy [15–17]. The growing
instability of farming conditions in agriculture, manifested by increasing volatility of crops, prices and
agricultural income, poses a long-term threat to the stability of the entire agricultural sector and food
supply. It prompts policymakers to seek and offer farmers adequate mechanisms by supporting risk
management in the current situation [7,15,16,18–22]. Identifying farmers’ preferences towards risk can
be considered an essential element in creating effective and efficient risk management mechanisms [23].
In recent years, there have been many studies on risk aversion and the factors shaping it. As emphasized
by Iyer [7] (p. 12) after a detailed review of literature on this subject, “to date this ( . . . ) topic remains
under-investigated although the developments in other methodological approaches seem to help
addressing this research question.” Moreover, Picazo-Tadeao and Wall [24] emphasize that research on
the factors shaping risk aversion nowadays focuses mainly on developing countries, and relatively few
analyses concerned European countries. The issue of risk management has been an area of particular
interest in the Common Agricultural Policy for several years [19,25–27]. However, the latest Common
Agricultural Policy (CAP) reforms and the growing instability due to climate changes justify updating
previous studies.
This issue is particularly important in countries where the problem of risk has been rarely studied
so far, and the knowledge of management methods among farmers is relatively low. One of such
countries is Poland, which is also one of the largest EU food producers [28] and a significant beneficiary
of the EU agricultural budget [29]. Contrary to many other large European and non-European food
producers [20,21,30], experience in providing Polish farmers with system solutions in the field of
risk management is relatively small [31,32]. The basic mechanism supporting risk management in
agriculture is the Crop and Farm Animal Insurance Act of 7 July 2005 with subsequent amendments [33],
introducing financial support for insurance premiums. Despite multiple amendments, the Act did not
meet the expectations as the farmers complained about too high premiums prices [34], while insurance
companies still reported losses [32,35]. Insurances, in the case of agricultural production, still play
a relatively small role in effective risk management as less than 10% of farmers are buying corp
insurances [32,34]. The Ministry of Agriculture is still looking for a way to build an effective and
efficient risk management support system in agriculture [36]. At the same time, unlike many other
countries, Poland did not take advantage of the possibility of implementing the Income Stabilization
Tool [19] under the Rural Development Programme (RDP) 2014–2020 [37], allowing allocation of CAP
funds to the development of modern risk management tools such as mutual funds [38,39]. As a result,
Polish farmers have at their disposal an ineffective system of subsidized agricultural insurance [32,35]
or can undertake individual initiatives at the farm level. The second, however, requires an active
approach and appropriate knowledge and skills, while the available research indicates that farmers
adopt relatively passive attitudes towards risk management [40].
Relatively little is also known about the attitudes of Polish farmers towards risk, especially in
the context of the changing conditions of farming in recent years. However, the design of an effective
risk management system should be based, among other things, on the right diagnosis of the attitudes
of farmers [41]. In this context, the article aims to estimate risk aversion of farmers and compare
the estimates with the characteristics of farms and the opinions of farmers. The research covered a
representative sample of 600 farms participating in the FADN (Farm Accountancy Data Network)
system. The farmer’s attitude to risk was estimated using a hypothetical lottery approach [42].
The level of risk aversion was then compared with farm characteristics, farmers’ self-assessment,Agronomy 2020, 10, 1555 3 of 21
their perception of risk factors, and applied risk management practices. The remainder of the paper
is organized as follows. In Section 2, we present the theoretical framework and literature review on
risk aversion measurement and farmers’ attitudes towards risk. Section 3 explains our methods and
empirical strategy. Section 4 describes the obtained results, and finally, Section 5 includes discussion
and conclusions.
2. Farmers’ Risk Preferences—Theoretical Framework and Empirical Approaches
2.1. Risk Aversion and Methods of Eliciting Risk Preferences
Recognizing the available options and selecting the appropriate method to elicit risk aversion is a
crucial step for researchers investigating decision-making processes under uncertainty. Risk aversion
means an attitude of reluctance to take risky decisions, which, however, cannot be avoided in any
economic activity, including agriculture. The issue of farmers’ choices under risk has been a subject
of interest of agricultural economics from years [43]. Risk in agriculture is usually defined in the
category of the distribution of outcomes (variance, standard deviation). In a more general approach,
measures of dispersion are linked to an expected value, and risk can be reflected in the coefficient
of variation [44]. Probabilities applied in risk analysis can be elicited based on the objective or
subjective perspective [45,46]. However, risk measures based only on probability distribution and the
expected value of outcomes do not fully reflect the approach of decision-makers representing different
attitudes towards risk. The risk aversion might be considered in absolute and relative terms. The most
straightforward measure of absolute risk aversion is expressed by the function named Arrow-Prat risk
aversion coefficient and described by the formula (Equation (1)) [47–49]:
00
−U (X)
Ra = (1)
U (X )0
00
where U(X)0 represent the first and U(X) the second derivative of the utility function U(X). It is
necessary to remember that absolute risk aversion is not a simple indicator but a function reflecting
the impact of changes in wealth on risk aversion. It is expressed in monetary units, which can be a
source of difficulties during farms comparisons. Hardaker [49] indicates that a better measure of risk
aversion may be “relative risk aversion coefficient,” which can be calculated according to the formula
(Equation (2)):
Rr = Ra X (2)
where Ra is Arrow-Pratt absolute risk aversion coefficient, and X is an argument of the utility function
(e.g., the value of agricultural production).
According to Hardaker [49], the relative risk aversion coefficient is a pure number that can be
used even in an international comparison of risk aversion. What is more, some authors concluded
that Rr is much more constant than Ra as wealth changes [48–51]. Anderson and Dillon [43] suggested
assigning levels of relative risk aversion coefficient Rr in dependence on generally observed farmers’
risk aversion (very low or no risk aversion Rr = 0.5; average (normal) risk aversion Rr = 1; rather clear
risk aversion Rr = 2; strong risk aversion Rr = 3; very strong risk (extremely) aversion Rr = 4).
Charness et al. [52] (p. 43) emphasize that “assessing and measuring the risk preferences of
individuals is critical for economic analysis and policy prescriptions.” Science has developed an
intuitively understandable theoretical model presenting the significance and place of risk aversion
in the decision-making process. In practice, so far, no fully effective tools (methods) for eliciting and
assessing decision makers’ risk aversion have been acquired.
Methods of eliciting individual risk preferences can be divided into two primary groups [7], i.e.,:
• based on observed economic behaviour from secondary data, including econometric and
mathematical methods. The underlying assumption of these methods is to estimate risk
preferences based on “observed behaviour of agricultural producers with respect to inputAgronomy 2020, 10, 1555 4 of 21
and output choices to behaviour predicted by theoretical models incorporating risk and risk
preferences” Iyer et al. [7] (p. 6). Examples of such an approach to determine risk aversion can be
found in numerous studies [53–58],
• based on elicited preferences from primary data, including multi-item scales and lottery-choices
tasks. The methods based on multi-item scales specify the attitude towards risk by obtaining an
answer to a series of multi-item and scale-based questions. This type of research takes the form of
various types of surveys and questionnaires. It is aimed at identifying actual decisions (preferences)
and actions taken by decision-makers [59,60] and presented by many researchers [3,38,61–64].
As an alternative approach to the assessment of risk preferences based on primary data, experiments
in which decision-makers select one option among the available hypothetical alternatives or lotteries
have been used [52,65–71]. Such an approach allows to determine the type of utility function, and thus,
allows for the estimation of risk aversion [72]. Such an approach usually seeks the point where the
decision maker is indifferent between the guaranteed amount (lower than the expected value) and
taking a risky game to gain more than the guaranteed amount [73]. Holt and Laury [71] drew attention
to the issue of differences between risk aversion in the case of large and small payouts, stating that
the differentiation of decisions at small potential payouts is more remarkable than with the big ones,
although the “average decision” does not change.
In this study, we attempted to assess farmers risk attitudes elicited from hypothetical lotteries in
the context of socioeconomic characteristics of farm and farmers.
2.2. Farmers Risk Aversion
The theme of risk aversion was also taken up in many economic and agricultural studies,
and is associated with a particular role of risk in agriculture [74]. Most of the analyses carried
out concerning farmers showed that they are usually characterized by an attitude of high risk
aversion [4,7,31,61,71,75–77]. Some studies indicate a decreasing absolute risk aversion, which means
that farmers are willing to risk a higher value of their property as wealth increases [78,79]. However,
the issue of the nature of risk aversion is not unequivocally settled [80]. Some authors question the
correctness of research on the nature of risk aversion, emphasizing that most analyses focused on the
“optimal value function” rather than the actual parameters of the utility function [1].
Moreover, some studies have shown that decision-makers may be characterized by both risk
aversion and risk-seeking concerning various spheres of activity, suggesting that the attitude towards
risk may result from the context in which the decision-maker is found [81]. One of the areas of
empirical research on risk aversion is the search for relationships between attitudes towards risk,
such as the level of education or wealth [82], as well as various parameters of farm and farmer
characteristics [4,31,61,83,84]. As emphasized by Picazo-Tadeao and Wall [24], research on the
relationship between various factors of the socioeconomic characteristics of farmers and farms and
preferences focuses mainly on developing countries [85–88]; a more extensive review of such studies
can be found, for example, in the study by Ullah et al. [4]. Less frequently, this issue is raised concerning
agriculture in highly developed countries, including European ones, where studies focus more on the
farmers’ risk preferences study itself, using various methodological approaches. A comprehensive
review of studies on framers risk preferences can be found in the study by Iyer et al. [7]. However, also in
these geographical areas, one can find studies addressing the issue of the relationship between risk
preferences and the socioeconomic characteristics of farms [24,31,61,83,84,89–91]. Authors studying
the phenomenon of risk aversion among farmers indicated its relationship with socio-demographic
characteristics of farmers, such as age of farmer, level of education, experience in running a farm
or after heir sitting, and farm features such as farm size, income, non-farm income or technological
character [4,8,24,31,84,92,93]. From an economic point of view, a particularly interesting issue is the
impact of the level of risk aversion on the level of production indicators of a farm and, consequently,
on the aggregate food supply. Concerning the agricultural sector, an attempt to analyze the impact
of farmers’ attitudes towards risk on the formation of aggregate supply was undertaken in the 1990sAgronomy 2020, 10, 1555 5 of 21
by Chavas and Holt and Moschini [94,95]. Earlier, Sandmo [96] based on measures of risk aversion
Agronomy
proposed 2020,
by10, x FORargued
Arrow, PEER REVIEW
that the greater the level of risk aversion displayed by producers, the 5lower
of 21
their propensity to increase production. In this context, Hennessy [97] noted that supporting agriculture
increasing production by individual farmers and, consequently, increasing the supply of agricultural
(through direct payments) favors increasing production by individual farmers and, consequently,
products. According to the mentioned author, payments to farmers increase the level of their wealth,
increasing the supply of agricultural products. According to the mentioned author, payments to
which, assuming a decreasing absolute risk aversion, means that a wealthier farmer is willing to risk
farmers increase the level of their wealth, which, assuming a decreasing absolute risk aversion, means
more, and this translates into an increase in production (and consequently an increase in food
that a wealthier farmer is willing to risk more, and this translates into an increase in production (and
supply).
consequently an increase in food supply).
3.3.Materials
Materialsand
andMethods
Methods
3.1.
3.1.Case
CaseStudy
StudyArea—Background
Area—BackgroundInformation
Informationon
onPolish
PolishAgriculture
Agriculture
Poland
Polandisisthe seventh-largest
the seventh-largestagricultural producer
agricultural in the
producer inEuropean UnionUnion
the European [28] (Figure 1). Polish
[28] (Figure 1).
farms
Polishconstitute 1/8 of all
farms constitute 1/8farms in the in
of all farms European UnionUnion
the European and therefore havehave
and therefore a significant impact
a significant on
impact
the
on European market
the European of agricultural
market products,
of agricultural as well
products, as on
as well as the natural
on the environment
natural environment[98].[98].
Figure
Figure1.
1.Poland
Polandon
onthe
themap
mapof
ofEurope.
Europe.Source:
Source:own
ownresearch.
research.
Familyfarms
Family farmswith
witha asmall
smallarea
area dominate
dominate in in Poland.
Poland. TheThe average
average sizesize
of a of a farm
farm in Poland
in Poland is 10.3is
10.3
ha ha The
[99]. [99].largest
The largest
shareshare (31.5%)
(31.5%) of farms
of farms are those
are those with with
an areaan area of 52 ha
of 2 to to 5and
ha and
73.5%73.5% of farms
of farms are
are between
between 1 and1 and 10 ha.
10 ha. However,
However, duedue to the
to the strong
strong polarization
polarization ofof farmstructure
farm structureininPoland
Poland[100],[100],
commercialfarms
commercial farmshave
haveaaprevalent
prevalentshareshareregarding
regardingthe theagricultural
agriculturalarea,area,the
thenumber
numberof oflivestock
livestockand and
thevalue
the valueof ofproduction.
production.
Farms are
Farms are most
most often
often passed
passed downdown fromfrom generation
generation to to generation.
generation. According
Accordingto to the
the Central
Central
StatisticalOffice
Statistical Office[99],
[99],about
about45%45%of offarm
farmowners
ownershave haveagricultural
agriculturaleducation,
education,but butonly
only3%3%have
havehigher
higher
education,and
education, and17%
17%arearepeople
people who
who completed
completed agricultural
agricultural training.
training.
InPoland,
In Poland,mixed
mixedproduction
productionfarms farmspredominate
predominate(44%), (44%),andandalmost
almostaaquarter
quarterof offarms
farmsspecialize
specialize
in field
in field crops. The third place place is
is occupied
occupiedby bydairy
dairyfarms
farms(15%).
(15%).The Theremaining
remaining categories
categories of of
farms
farmsdo
notnot
do constitute
constitute more
morethan
than5%.5%.
Polish farmers
Polish farmersstruggle
struggle with many
with risk factors.
many Research
risk factors. to date by
Research tovarious
date by authors [31,37,64,101]
various authors
shows that theshows
[31,37,64,101] most substantial
that the most risk substantial
factor is drought and, toisadrought
risk factor lesser extent,
and, other atmospheric
to a lesser extent, factors
other
such as frost or hail. Due to the high frequency of occurrence of drought,
atmospheric factors such as frost or hail. Due to the high frequency of occurrence of drought, in in contrast to other natural
factors, to
contrast drought remains
other natural practically
factors, drought uninsurable in Poland uninsurable
remains practically [102]. The reports
in Polandof IUNG (Institute
[102]. The reports of
Soil
of IUNGScience and Plant
(Institute Cultivation)
of Soil Science and [103] also
Plant indicate the[103]
Cultivation) objective importance
also indicate of drought
the objective in Poland.
importance
Other
of risk in
drought factors indicated
Poland. by Polish
Other risk factorsfarmers
indicated include animal
by Polish disease,
farmers priceanimal
include volatility, marketing
disease, price
difficulties,
volatility, prices of inputs,
marketing political
difficulties, measures
prices and technological
of inputs, political measuresprocesses
and [31,64,104].
technological processes
[31,64,104].Agronomy 2020, 10, 1555 6 of 21
Agronomy 2020, 10, x FOR PEER REVIEW 6 of 21
3.2.
3.2. Data Collection
Collection
The
The study
study covered
covered thethe population
population ofof farms in the field of observation of the FADN [105] system.
This
Thissystem
systemcovers
covers farms
farmswith a standard
with output
a standard of more
output of than
morefour
thanthousand Euro. The
four thousand farmsThe
Euro. included
farms
in the FADN
included database
in the FADNare representative
database of the mostof
are representative significant
the most farms in terms
significant of area
farms and production.
in terms of area and
Farms represented
production. in FADN produce
Farms represented in FADN93%produce
of the total
93%agricultural production production
of the total agricultural in Poland, occupy an
in Poland,
area of 85%
occupy of the
an area agricultural
of 85% land, almost
of the agricultural 97%
land, of livestock
almost and about
97% of livestock 2/3about
and of the2/3
employed people
of the employed
work
peopleonwork
farmsoncovered by FADN
farms covered by(Table
FADN1).(Table 1).
Table 1. The
Table characteristic
1. The of of
characteristic thethe
Farm Accountancy
Farm AccountancyData
DataNetwork
Network (FADN) sample
(FADN) in in
sample relation to to
relation the
general population of Polish farms.
the general population of Polish farms.
Farm FADN
FADN Field of
Field of
Farm Population FADN Field
FADN Fieldofof
Category
Category Units
Units Population Observation in
in Poland in Observation
Observation
Observation in
Farm Population
Poland Farm Population
Standard
Standard production mlnmln PLNPLN* * 73,699
73,699 68,563
68,563 93.0%
93.0%
production
UAA
UAA area
area th.
th. ha
ha 14,447
14,447
12,291
12,291
85.1%
85.1%
Number
Numberofoflivestock LU ** 10,377,506 10,055,995 96.9%
LU ** 10,377,506 10,055,995 96.9%
Labour resources
livestock AWU *** 2,811,622 1,868,527 66.5%
Labour resources
Source: AWU ***
[106] * ex.rate PLN/USD~3.7 2,811,622
** LU–livestock 1,868,527Work Unit (2120
unit, *** AWU–Annual 66.5%
hours).
Source: [106] * ex.rate PLN/USD~3.7 ** LU–livestock unit, *** AWU–Annual Work Unit (2120 h).
The farm sample providing data to the FADN in Poland includes 12 thousand farms. The
The farm
research sample
covered providing
a sample of 600data
FADNto the FADN
farms in Poland
in which includes 12survey
an additional thousandwasfarms. The
carried research
out. Farms
covered
selectedafor
sample of 600
survey FADNabout
covered farms 5%
in which
of theanFADN
additional survey
sample. Thewas carriedofout.
number Farms selected
surveyed farms wasfor
survey covered
determined, aboutinto
taking 5%account
of the FADN sample. The
a compromise number
between theofpossible
surveyed farms was
precision determined,
of the taking
analysis and the
into account
inputs a compromise
necessary to conductbetween thesurvey
a reliable possiblethroughout
precision ofthethecountry.
analysisTheandgeneral
the inputs necessary
principle to
of the
conduct a reliable survey throughout the country.
construction of the test sample is shown in Figure 2. The general principle of the construction of the test
sample is shown in Figure 2.
Figure 2. The
Figure2. The general
general principle
principle of
of the
the research
researchsample
sampleconstruction.
construction. Source:
Source: own
own research.
research.
The
The sample
sample of
of 600
600 surveyed
surveyed farms
farms was
was selected
selected using
using the
the stratified
stratified random
random selection procedure,
selection procedure,
which
whichincluded:
included:
• 44 layers
layers due
due to
to the specialization criterion,
criterion,
• 33 layers
layers due
duetotothe
theeconomic
economic size
sizecriterion
criterion measured
measured by
by the
the standard
standard output
output (below
(below 25,
25, between
between
25 and
25 and 100,
100, and
and above 100 thousand EUR),
EUR),
• 44 layers
layers due
due to
to the localization within
within the
the FADN
FADN regions
regions (see
(seeFigure
Figure3).
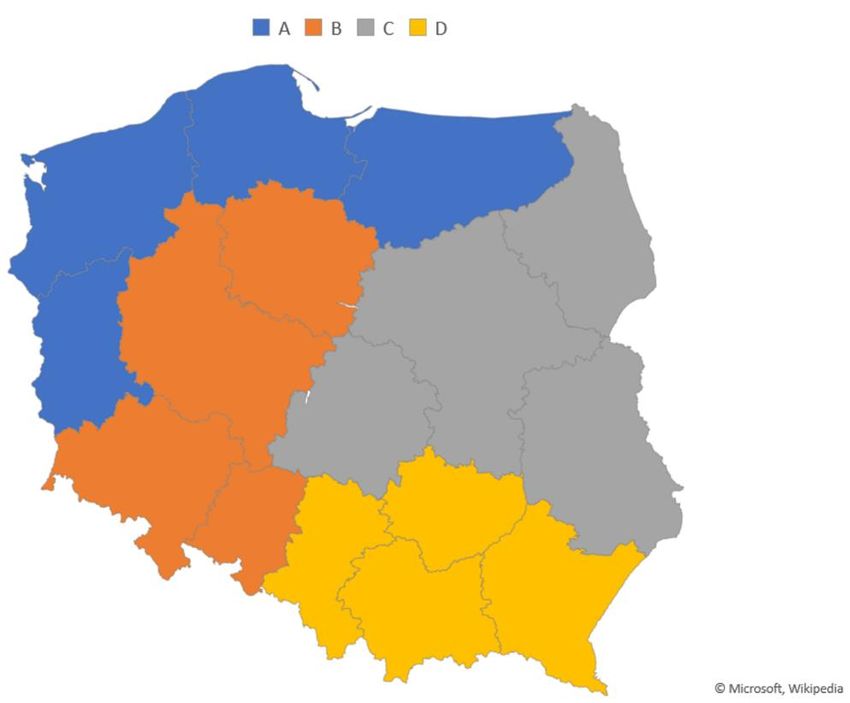
3).Agronomy 2020, 10, 1555 7 of 21
Agronomy 2020, 10, x FOR PEER REVIEW 7 of 21
84 farms
255 farms
179 farms
82 farms
Figure 3. The distribution of surveyed farms within FADN regions in
in Poland.
Poland. Source: own research.
Strata of
of farms
farmsdistinguished
distinguishedbased onon
based thethe
typology usedused
typology to select the FADN
to select sample
the FADN [106] (p.15),
sample [106]
due to the specialization criterion, included the following production types:
(pp.15), due to the specialization criterion, included the following production types:
• crop production farms—this includes farms specializing in field crops (TF1), horticultural crops
permanent crops
(TF2), permanent crops (TF4);
(TF4);
• cattle farms—this includes farms specializing in rearing dairy cows (TF5) and herbivorous
animals (TF6);
animals (TF6);
• pig farms—this includes
pig farms—this includes units
units specializing
specializing in rearing
in rearing animals
animals fedconcentrated
fed with with concentrated feed
feed (mainly
(mainly pigs TF 71 and poultry
pigs TF 71 and poultry TF 72); TF 72);
• mixed farms—this
mixed farms—this includes
includes mixed
mixed farms
farms (TF8).
(TF8).
The number of researched farms in each stratum was determined using the Neyman method
The number of researched farms in each stratum was determined using the Neyman
[107,108] in a manner analogous to the method used to determine the size of the FADN sample
method [107,108] in a manner analogous to the method used to determine the size of the FADN
(Equation (3)):
sample (Equation (3)):
NNhhσσ
hh
nh n=h =nn P
∑L
L Nk σk
k=1
(3)
(3)
k=1 Nk σk
where: nh—sample size in stratum h,
where: nh —sample size in stratum h ,
n—sample size,
n—sample size,
Nh—population size in stratum h,
Nh —population size in stratum h,
σh—standard deviation of standard output in the h stratum,
σh —standard deviation of standard output in the h stratum,
L—number of strata.
L—number of strata.
In each of the distinguished stratum, the number of farms to be surveyed was calculated with
In each of the distinguished stratum, the number of farms to be surveyed was calculated with
Neyman’s method (Equation (3)), and then randomly selected from all FADN farms belonging to this
Neyman’s method (Equation (3)), and then randomly selected from all FADN farms belonging to this
stratum. In case the farmer, due to any reason, refused to take part in the survey, another farm from
stratum. In case the farmer, due to any reason, refused to take part in the survey, another farm from the
the selected stratum was drawn. Due to the applied methodology of selecting farms, the sample
selected stratum was drawn. Due to the applied methodology of selecting farms, the sample structure
structure corresponded to the structure of the entire FADN population. The distribution of the
corresponded to the structure of the entire FADN population. The distribution of the studied sample in
studied sample in terms of the criterion of economic size groups and groups separated by type of
terms of the criterion of economic size groups and groups separated by type of production is presented
production is presented in Table 2.
in Table 2.Agronomy 2020, 10, 1555 8 of 21
Table 2. Number of farms in test sample regarding economic size and type of farming.
Economic Farm Size Standard Output [Thousand EUR]
Total
Type of Farming Below 25 25 < 100 Above 100
Crop production 133 111 23 267
Granivores (pigs & poultry) 0 10 22 32
Cattle 38 93 8 139
Mixed 69 64 29 162
Total 240 278 82 600
Source: own elaboration.
To fulfil regulations on the protection of the identity of farmers participating in the FADN
system, the agricultural extension officers, who regularly collect FADN data, performed the interview.
The completed questionnaires were anonymized and passed on to the national FADN office, where
answers were joined to the accountancy records of surveyed farmers.
Regarding the economic size, the surveyed population was dominated by farms with an economic
size in the range from 25 to 100 thousand EUR and the smallest farms with standard production up to
25 thousand EUR. The smallest group was the largest farm, which reflects the structure of farms in
Poland. In terms of the criterion of the type of farming, the most numerous group were crop farms and
mixed farms, and the least numerous were farms of the granivores.
3.3. Methods
The conducted analysis covers two stages: the first is the assessment of farmers’ preferences
towards risk carried out with the use of hypothetical games, while the second part covers the analysis
of selected farm and farmer characteristics depending on the level of risk aversion identified in the
first part.
The basis of the developed set of questions was the literature on the subject concerning the
empirical research of risk in agriculture, including in particular such studies as Meuwissen et al. [64],
Handschke et al. [104] and Berg et al. [26]. The questionnaire was designed to assess farmers’ perception
of risk factors, used risk management tools and hypothetical games to estimate their aversion to risk.
After designing the initial version of the questionnaire, a pilot study was carried out, including the
preparation of several dozen sample questionnaires, which enabled the introduction of the necessary
corrections to the original version of the interview questionnaire and the development of the final
version of the questionnaire, which was handed over to interviewers for field research. The risk-ratio
assessment was carried out based on hypothetical lotteries. Two variants were adopted: the small wins
variant and the big wins variant [68]. The approach proposed by Eckel and Grossman [42] was used to
estimate the level of risk aversion in the variant with small wins. To assess the risk aversion coefficient
in the case of large wins, the proposed by Dohmen et al. [109] simplified hypothetical investment
problem. In both cases, the size of the winnings was modified to some extent, adjusting them to the
Polish realities.
During the interview, farmers were presented with two hypothetical situations. In the first one,
they were offered participation in a hypothetical game of tossing a fair coin, in which participation
requires an initial fee of 2000 PLN (~540 USD), which was about the minimal monthly salary in Poland
at the moment of surveying farmers. The respondents were to indicate the most preferred variant of
the game. The least risky game was the payment of the risked amount regardless of the outcome of the
coin toss (the farmer gained nothing and lost nothing). In the extreme case, it was possible to gain
an additional PLN 3100 (~840 USD) or lose PLN 1700 (~460 USD). In the second situation, farmers
were asked to indicate what part of the lottery winnings of 1 mln PLN, which is equal to the mainprize
of the most popular state lottery (~270 thousand USD), and corresponds to the value of an average
commercial farm, they would be willing to invest in a project in which they could double the amount
invested or lose half of the funds. It was tested with two different probabilities of investment successAgronomy 2020, 10, 1555 9 of 21
(variant 50/50 and 80/20). The purpose of examining these two situations with diametrically different
levels of possible gains and losses was to identify farmers’ attitude to risk with a relatively low and
high level of losses. The analysis of hypothetical lotteries resulted in assigning individual farmers to
one of the three levels of risk aversion, i.e., low, medium and high. The group of low-risk aversion
consisted of farmers presenting a risky attitude, at least in one of the games and not indicating strong
risk aversion in any of the games. The high-risk aversion group consisted of farmers who strongly
avoided risk in all game variants. Other cases were classified to the medium-risk aversion group.
The remaining part of the article describes the characteristics of farms with different levels of risk
aversion of their owners.
4. Results
4.1. Farmers’ Risk Aversion and Farms’ Economic Size and Production Type
In the first stage, farmers were divided into three groups regarding their risk aversion coefficient
calculated based on the results of the hypothetical game from the survey. The low-risk aversion group
had an average relative risk aversion coefficient of (Rr ) 0.04, medium of 0.87 and high of 1.44.
In general, it might be concluded that farmers are relatively risk-averse; however, some differences
between farm types and economic size could be noticed. The results of the risk aversion assessment
for the analyzed farm population are presented in Table 3.
Table 3. Share of farmers according to their risk aversion.
Risk Aversion
Grouping Criterion and Farm Classes Low Medium High
Share of Farmers [%]
below 25 20.8 57.8 21.5
Economic size
25–100 24.9 47.7 27.4
[th. EUR SO]
above 100 26.8 51.8 21.4
Cattle 29.9 54.9 15.3
Mixed 16.4 52.7 30.9
Farm type
Crop 23.7 52.6 23.7
Pig 21.1 52.6 26.3
Total 23.0 53.2 23.8
Source: own research.
Overall, slightly more than half of the surveyed farmers were classified as a medium risk level.
On average, an almost identical percentage of farmers were classified as having low- and high-risk
aversion. The smallest number of risky farmers was in a group of mixed farms. At the same time,
in this group there was the highest percentage of farms with high-risk aversion. It can be observed
that a slightly higher percentage of farmers with low-risk aversion were recorded in the group of the
largest farms and cattle type.
4.2. Farmers’ Risk Aversion and Their Attitudes Toward Specified Risky Situations
To determine the consistency of farmers’ attitudes determined based on hypothetical lotteries,
they were compared with the declared farmers’ statements concerning selected decisions in the farm
operation. Table 4 shows the distribution of farmers’ responses to selected statements reflecting the
self-assessment of the respondents.Agronomy 2020, 10, 1555 10 of 21
Table 4. Farmer self-assessment concerning deciding their risk aversion.
The Farmer’s Self-Assessment of the Degree of
Compliance with a Given Statement
Type of Statement Risk Aversion Definitely Not Neither Yes Rather Yes or Chi2 p-Value
or Probably Not nor No Definitely Yes
Share of Answers [%]
low 36.2 17.4 46.4
“I sometimes make
medium 48.0 20.7 29.8
risky decisions on 17.246 0.0017
high 55.9 19.6 23.1
the farm.”
total 47.2 19.7 32.0
low 34.8 16.7 48.6
“I have concerns medium 28.5 14.7 56.7
8.452 0.0763
about taking loans.” high 20.3 16.1 62.9
total 28.0 15.5 56.3
low 21.0 5.8 73.2
“I implement new
medium 22.6 15.0 62.4
technologies and 10.961 0.0270
high 18.2 17.5 62.9
plant varieties.”
total 21.2 13.5 65.0
“I accept a narrow low 47.8 10.9 41.3
production medium 48.9 17.6 33.2
7.412 0.1156
specialization on high 56.6 13.3 29.4
the farm.” total 50.5 15.0 34.2
Source: own research.
This comparison shows that in the group of farmers with high-risk aversion, the percentage of
farmers identifying with the statement “I sometimes make risky decisions on a farm” is lower than
in the other groups (23.1% against 46.4% in the group with low aversion). At the same time, in the
group with high-risk aversion, the share of radicals who do not agree with this statement is higher
than in the group with low-risk aversion (55.9% compared to 36.2%). The obtained distribution of
responses indicates that farmers with high-risk aversion avoid making risky decisions. The differences
were statistically significant at 0.05.
Another aspect of the analysis concerned the propensity to take out loans, which can be treated as
a symptom of the attitude towards risk. The conducted research shows that in the group with high-risk
aversion there were more such farmers (almost 62.9%) avoiding taking loans than in the group with
low-risk aversion (48.6%). This difference was also significant at level 0.05.
One of the manifestations of risk acceptance is the tendency to implement new, innovative
solutions. Such situations are usually associated with high uncertainty as to the possible effects of
the introduced solutions. Hence it can be expected that people with a high level of risk aversion
may be more reluctant to introduce changes, e.g., applying innovative technologies. The results
generally confirm this assumption, as a higher percentage of farmers likely to adopt new solutions was
observed in the group with low-risk aversion (73.2%) than in the group with high risk aversion (62.9%).
This difference was also statistically significant at 0.05. It should be emphasized that the number of
farmers willing to implement new technologies was relatively high in all groups. Probably this results
from the fact that Polish agriculture is continuously undergoing a process of transformation, hence the
contact with new solutions for many farmers is quite common.
Diversification is one of the primary risk reduction strategies. Concerning the farm operation,
it means the production of various categories of agricultural products, which, in the event of poor
production conditions or low prices for one product, leaves a chance for positive economic results.
Diversification reduces the overall risk of a farm, but requires skills and equipment for different types
of production, increasing the total operating costs. However, the condition for the effectiveness of
such a strategy is a low (or even negative) correlation between yields and prices for different products,
which is often difficult to achieve in agriculture. In the surveyed group of farmers, over 1/3 of the
respondents were willing to accept narrow specialization, and the percentage of such people wasAgronomy 2020, 10, 1555 11 of 21
higher in the group with low risk aversion: 41.3% compared to 29.4% in the group with high-risk
aversion; however, this difference was not significant at 0.05.
4.3. Farmers’ Risk Aversion and Perception of Production Risk Factors
It can be assumed that farmers with a high-risk aversion assess individual risk factors as more
often and more threatening to the farm than farmers with low-risk aversion. Table 5 shows the
percentage of farmers who perceived the indicated phenomena as frequent and highly threatening to
the farm. The study focuses on climate risk factors, which in the context of increasing climate change
constitute the main challenge for risk management in Polish agriculture because the frequency of losses
caused is already significant and will probably increase. Considered factors are listed in the Crop and
Farm Animal Insurance Act [33], thus are substantial for the functioning of the current support system
insurance. Those factors constitute an area of particular interest for public authorities, as opposed to
other categories of risk factors that can be limited by the market (e.g., price risk) or other insurance
systems (e.g., national social security farmers scheme).
Table 5. Percentage of farmers who perceive the indicated risk factors as frequent and severe.
Risk Factors
Farmer Risk
Aversion Crop Pest and Poor
Drought Spring Frosts Hail Storm
Diseases Overwintering
share of farmers indicating a frequent occurrence of the risks factors [%]
low 72.5 60.1 36.5 21.2 14.8 5.4
medium 82.4 64.2 49.4 23.0 24.3 3.7
high 83.2 56.0 54.9 29.6 24.3 4.0
total 80.3 61.3 47.7 24.1 22.1 4.1
Chi2 7.062 3.2001 10.249 3.153 5.434 0.7471
p-value 0.0292 0.2018 0.0059 0.2066 0.0660 0.6882
share of farmers indicating a substantial threat resulting from a given risk factor [%]
low 86.2 61.6 67.4 52.2 49.3 61.6
medium 94.0 61.1 63.9 53.0 57.1 61.1
high 94.4 60.1 67.1 57.3 60.8 60.1
total 92.3 61.0 65.5 53.8 56.2 61.0
Chi2 9.443 .0671 .726 .955 4.031 1.113
p-value 0.01539 0.96697 0.69545 0.6202 0.13319 0.57318
Source: own research.
The comparison shows that farmers with high-risk aversion slightly more often than others
indicated the occurrence of such threats as drought, frosts, hail and poor overwintering. However,
differences regarding the drought and frosts were significant at 0.05. On average, in the entire
population, the factor indicated as the most common was a drought (on average, frequent occurrence
was indicated by over 80% of respondents, and pests and diseases of plants and animals came second
(61.3% of respondents)). The least frequent was a storm (4.1% of respondents). Farmers with lower
risk aversion perceived droughts as less frequent and less threatening for their activities. A similar
pattern could also be observed in the case of spring frosts and winter damages.
4.4. Farmers’ Risk Aversion and Preferred Risk Management Tools
In the context of the high level of threats perceived by farmers related to the presence of various
risk factors, the critical challenge is the skillful use of adequate strategies and risk management tools.
The first step in this process is to build farmers’ awareness of possible actions to counteract the
risk. Table 6 contains information on the percentage of farmers noticing the usefulness of the risk
management methods mentioned above, depending on the level of risk aversion.Agronomy 2020, 10, 1555 12 of 21
Table 6. Assessment of the usefulness of the selected risk management methods regarding the level of
farmers’ risk aversion.
Risk Management Method
The Effects of Adverse Weather
Acquiring New Knowledge
the Production Based on
Raising Qualifications,
Improvements to limit
Using Crop Insurance
Improvement of Crop
Developing Off-Farm
Production Structure
Crop Sales Contracts
Market Information
Protection Practices
Cooperation with
Diversification of
Taking Off-fArm
Other Farmers
Employment
Technology
Planning
Business
Farmer Risk
Aversion
share of farmers confirming the usefulness of given risk management methods [%]
low 61.6 51.4 53.6 65.9 67.4 89.1 73.2 70.3 55.8 31.2
medium 62.4 54.2 52.0 67.1 67.7 82.1 63.9 66.1 59.6 28.5
high 61.5 55.9 46.2 57.3 69.2 83.2 61.5 62.2 61.5 26.6
total 62.0 54.0 51.0 64.5 68.0 84.0 65.5 66.2 59.2 28.7
Chi2 0.042 0.585 1.861 4.255 0.135 3.596 4.942 2.034 1.002 4.249
p-value 0.9790 0.746 0.3942 0.1191 0.935 0.1655 0.0844 0.3616 0.606 0.1194
Source: own research.
In general, relatively small and statistically insignificant differences were observed in this case.
The highest percentage of people positively responded to activities such as improving qualifications
(84% of respondents), making contracts with product recipients (66.2%), cooperation with other farmers
(65.5%), technology improvements to reduce the effects of risk (64.5%) and plant insurance (68%).
The farmers noticed the least usefulness in undertaking non-agricultural farming skills (28.7% of
respondents). However, only differences in the case of cooperation between farmers were statistically
significant at 0.1.
Although farmers’ declarations regarding the assessment of the usefulness of various strategies
or risk management methods may constitute a source of information about their actual needs or
preferences regarding the choice of particular tools in the future, it is worth supplementing this
knowledge with an analysis of activities undertaken in the past. The results in Table 7 show the share
of farms where selected risk management methods were implemented in the last five years.
It is visible that the share of farmers undertaking actions is smaller than the share of farmers
who indicated the usefulness of various risk management methods. On average, the most frequently
implemented measure to reduce the risk in the surveyed farms was improvements in plant protection
methods (this was indicated by almost 70% of the respondents). On average, there were more such
farmers in the high-risk aversion group, which may suggest that fear of risk prompts them to introduce
changes, which may also be associated with additional uncertainty. However, the results are not
unequivocal. The crop irrigation was more often implemented on farms of farmers with low-risk
aversion, as it is a relatively large investment which generates additional financial risk and is more
challenging to implement than changes to the crop protection technology. Some of the measures
under consideration were, on average, more often implemented by farmers with average risk aversion
(e.g., installations protecting perennial plantations), which, however, should probably be associated
with the production structure. Moreover, most of the differences were statistically insignificant,
which did not allow for a clear statement that the differences in attitudes towards risk translate into the
observed actions.Agronomy 2020, 10, 1555 13 of 21
Table 7. The percentage of farmers who implemented the selected risk management methods in the
last five years regarding their level of risk aversion.
Risk Management Method
Protecting Multi-Perennial
Developing Infrastructure
Cultivation Technologies
Crop Storage Facility
Crop Sales Contracts
Developing New
Improvement of
Developing of a
Crop Protection
Sales Channels
Crop Irrigation
New Crop
Farmer Risk
Practices
Crops
Aversion
share of farmers who introduced specified risk management method in the last five years [%]
low 12.9 59.4 8.8 33.3 26.2 38.1 18.8
medium 12.4 71.8 12.6 38.0 24.1 36.5 20.7
high 6.0 74.8 7.0 37.2 23.5 41.3 14.4
total 11.0 69.7 10.6 36.7 24.4 38.0 18.8
Chi2 4.562 9.114 2.071 0.850 0.2900 0.922 2.367
p-value 0.1021 0.0104 0.3549 0.6537 0.8650 0.6305 0.3061
Source: own research.
Looking for the relationship between farmers’ attitude towards risk and their behavior,
we additionally attempted to identify possible actions of farmers in the event of a significant deterioration
of financial results. Table 8 presents the share of farmers who, in response to a hypothetical drop in
income by over 20%, declared that they would take the selected adjustment measures.
Table 8. Share of farmers declaring the implementation of the indicated adjustment measures in the
event of a decrease in agricultural income by over 20%.
Possible Adaptation Measures
Decreasing Investment
Developing Off-Farm
Commercial Farming
Production Structure
Decreasing On-Farm
without Changes
Taking Off-Farm
Present Strategy
Adjusting Farm
Increasing the
Expenditures
Employment
Employment
Production
Giving Up
Continue
Business
Scale of
Farmer Risk
Aversion
% of farmers
low 39.1 29.7 28.3 38.4 48.6 39.1 60.9 5.1
medium 27.3 23.2 35.7 43.6 59.2 36.7 64.9 8.2
high 25.9 21.0 28.7 38.5 59.4 32.2 76.2 10.5
total 29.7 24.2 32.3 41.2 56.8 36.2 66.7 8.0
Chi2 7.785 3.270 3.611 1.629 5.013 1.551 8.417 2.820
p-value 0.0203 0.1949 0.1643 0.4427 0.0815 0.4603 0.0148 0.2440
Source: own research.
These activities are not specific risk management tools but indicate the general direction of possible
adjustments at the farm level. On average, the most common answer was cutting down investment
expenditures (66.7% of respondents). Limiting capital expenditure in a crisis can be considered a
reasonably natural action, as it enables the transfer of funds to cover current liabilities, which improvesAgronomy 2020, 10, 1555 14 of 21
the current financial liquidity and reduces the risk of a more severe financial outbreak. The highest
share of reduction of investments was observed in the group with high-risk aversion. It can also be
observed that farmers with a low aversion to risk were most inclined to increase the size of their
activities to compensate for the decline in income. In both cases, the differences were statistically
significant at 0.05.
The second choice was changing the production structure (56.8% of respondents), which should
be considered a reasonably understandable choice, provided that such a shift would be preceded by a
proper market analysis. Regarding the frequency of indications of this solution, there are quite clear
differences between individual groups of farms (significant at 0.1). Farmers with low-risk aversion
seemed more likely to take more radical actions such as abandoning farming, which confirms their
lower fear of the “unknown.”
5. Discussion and Conclusions
The results of analyses showed that most farmers exhibit at least a medium or high level of risk
aversion. This is consistent with many other research results which indicated that farmers, as a rule,
show risk aversion, although not necessarily too strongly [20,31,61,110]. Farmers characterized by
low-risk aversion were more likely to belong to the group of the largest farms, i.e., with standard
production above EUR 100,000. That was already noticed many years ago by Sandmo [96], and it is still
consistent with other studies [9,30,31,111]. Our analyses also show that among all the identified groups
of farmers with high-risk aversion, the highest percentage was recorded in the mixed farms, which can
also be considered as expected—a high level of risk aversion prompts the diversification of activities.
This is one of the typical risk management strategies, which is explained in detail by Markovitz’s
portfolio (concerning financial assets) [112]. Similarly, in agriculture, carrying out various activities
reduces the risk. Hence farmers with a greater aversion to risk more often choose diversified activities.
More specialized activities require a higher degree of risk acceptance [30], hence in specialized farms,
a higher percentage of farmers with low-risk aversion can be observed. Most are in cattle, where the
production cycle is long and the most complicated.
The classification of farmers to three levels of risk aversion, carried out in our study, was confronted
with a survey of opinions indicating the actual behavior of farmers. This study shows that the actual
behavior of farmers, declared during the interviews, in many cases indicates that the results are
consistent. It was found among others that farmers who declared frequent risky decisions more often
also belonged to the group with low-risk aversion. Similarly, farmers who declared greater fear of
taking loans also mostly belonged to the group with high-risk aversion. Similar relationships also
occurred in the case of other activities illustrating the attitude towards risk, which indicates that
the results obtained are consistent with the hypothetical lottery method and the method of direct
behavior and attitude research. However, these issues in the subject literature are not unequivocally
resolved [113]. For example, Dohmen et al. [114] indicated that the results obtained with different
methods (for the non-agricultural population) were consistent.
Similarly, Pennings and Garcia [72] pointed to the convergence of different results. In contrast,
Bard and Barry [5] and Fausti and Gillespie [115] emphasized the discrepancies between the assessment
of risk aversion obtained by various methods. In turn, Meuwissen et al. [61] showed that risk aversion
assessed based on contextualized business questions specific to farming was correlated with risk
management choices. The results showed that farmers who differ in their risk aversion perceive
individual risk factors in a slightly different way, which suggests differences in the perception of risk
depending on their attitude (aversion), e.g., frequency of droughts or spring frosts. This issue has
rarely been the subject of comprehensive empirical analyses, although the phenomena of perception
and risk aversion have been analyzed by various authors [38,64,116]. However, it is challenging to
formulate unambiguous conclusions as to the direction of and the strength of dependency. Meraner and
Finger [117], referring to the results of analyses of such authors as Flaten et al. [3], Meuwissen et al. [116]
and van Winsen [41] (p. 338) emphasize that “so far, the empirical relationship between perceivedAgronomy 2020, 10, 1555 15 of 21
sources of risks and responses has been ambiguous.” Menapace et al. [110] indicated that “farmers who
are more (less) risk averse tend to perceived greater (smaller) probabilities of farm losses occurring,”
which, at least in the case of the most important risk factors, was confirmed in our research. Our research
shows that the surveyed farmers perceive drought as the most significant risk factor, which was
also observed in other analyses carried out in various countries [64,118–120]. A comparison of the
perception of this phenomenon between the selected groups shows that farmers with high-risk aversion
more often indicate the occurrence of drought and a greater scale of threats resulting from this factor.
Similar relationships were also observed concerning the remaining risk factors included in the study,
although only in some cases were the differences statistically significant. Thus, it supports the thesis
that the perception of the strength of the impact of risk factors depends, among others, on the degree
of risk aversion. It is in line with Meraner and Finger’s [117] (p. 7) observation, indicating that “risk
perception varies between individuals depending on the objective risk they are exposed to and the
subjective interpretation of risks.”
There were also some differences in the scope of actions taken to cope with the risk. However,
the obtained results do not allow for a clear conclusion that a higher level of risk aversion is conducive
to a sturdier determination of farmers in seeking a way to reduce the risk. As emphasized by Newbery
and Stiglitz [44], farmers focus on income volatility and its impact on the consumption possibilities
of the agricultural family, rather than on prices or crops. On the other hand, recent studies among
Polish farmers suggest that in small family farms price fluctuation is perceived as one of the main
economic risk factors. The farmers in small farms have difficulties in estimating the exact value of
income, as agricultural production and household expenditure are difficult to separate [121]. However,
taking into account that the FADN sample covers commercial farms, we decided to investigate the
potential vulnerability of farmers regarding income deterioration, assuming that farmers who are
taking part in the collection of accountancy data are conscious of their income.
However, only in the case of a few methods of risk reduction, it turned out that there are significant
differences between farmers with different attitudes towards risk. The studies of other authors also
indicate that there are some differences among farmers with different levels of risk aversion concerning
the selected methods and strategies of risk reduction. However, it is difficult to indicate a specific
pattern of behavior here [110,122,123]. For example, Akcaoz et al. showed that “growing more
than one crop was the most important risk strategy for both risk averse and risk-seeking groups of
farmers, while the spreading sales was the most important strategy for risk neutral groups of farmers.”
Our research shows that decisions regarding the choice of risk management methods and the scale
of activities to a small extent depend on the degree of the risk aversion. Van Winsen et al. [124]
concluded that the risk attitude does have a significant impact on the intention of applying any of the
risk strategies.
Nevertheless, in our study, it turned out that farmers with higher risk aversion more often declared
changes in plant protection methods in recent years, as well as entered into contract crops with
product recipients. This indicates that in conditions of declining stability they consider undertaking
actions to reduce the variability of financial results. It was also observed that in the case of a further
significant drop in income, farmers with higher risk aversion would be less likely to increase the scale
of production or develop non-agricultural activities. This observation is partially consistent with the
results of the Meraner and Finger’s [117] study, which showed that farmers with higher risk aversion
are likely to prioritize on-farm risk management over off-farm strategies.
In conclusion, we can say Polish farmers are on average quite risk averse. Their attitude towards
risk is strongly linked with their self-assessment regarding their way of making decisions in the
farm management process. It is also possible to notice links between farmers’ risk aversion and
their assessment regarding frequency and threats of selected risk factors and also with farm type
and economic size. Farmers’ risk aversion has little relation to the perception and application of risk
management methods. However, farmers’ declared reactions to a potential significant income drop are
differentiated regarding farmers’ risk aversion.You can also read


