Mycobiome Composition and Diversity under the Long-Term Application of Spent Mushroom Substrate and Chicken Manure - MDPI
←
→
Page content transcription
If your browser does not render page correctly, please read the page content below
agronomy
Article
Mycobiome Composition and Diversity under the Long-Term
Application of Spent Mushroom Substrate and Chicken Manure
Magdalena Frac
             ˛ * , Giorgia Pertile                   , Jacek Panek        , Agata Gryta, Karolina Oszust, Jerzy Lipiec
and Bogusław Usowicz

                                          Institute of Agrophysics, Polish Academy of Sciences, Doświadczalna 4, 20-290 Lublin, Poland;
                                          g.pertile@ipan.lublin.pl (G.P.); j.panek@ipan.lublin.pl (J.P.); a.gryta@ipan.lublin.pl (A.G.);
                                          k.oszust@ipan.lublin.pl (K.O.); j.lipiec@ipan.lublin.pl (J.L.); b.usowicz@ipan.lublin.pl (B.U.)
                                          * Correspondence: m.frac@ipan.lublin.pl; Tel.: +48-81-7445061; Fax: +48-81-7445067

                                          Abstract: Waste exogenous organic matter, including spent mushroom substrate (SMS) and chicken
                                          manure (CM), can be used as the basis of a soil-improving cropping system in sustainable agriculture.
                                          However, there is—as yet—a lack of information about important quality indicators such as the
                                          fungal community relative abundance, structure and biodiversity in soils treated with these additives.
                                          In this study, the responses of the soil fungal community composition and mycobiome diversity to
                                          SMS and CM application compared to the control soil were evaluated using a combination of the
                                          following molecular approaches: quantitative polymerase chain reactions, denaturing gradient gel

                                   electrophoresis, terminal restriction fragment length polymorphism, and next-generation sequencing.
                                          The most abundant phylum for both treatments was Ascomycota, followed by Basidiomycota.
Citation: Frac,
             ˛ M.; Pertile, G.; Panek,
                                          The application of SMS and CM increased the abundance of fungi, including Tremellomycetes and
J.; Gryta, A.; Oszust, K.; Lipiec, J.;
                                          Pezizomycetes for the SMS additive, while the Mortierellomycetes, Pezizomycetes, and Leotiomycetes
Usowicz, B. Mycobiome Composition
and Diversity under the Long-Term
                                          levels increased after CM addition. SMS and CM beneficially reduced the relative abundance of
Application of Spent Mushroom             several operational taxonomic units (OTUs) which are potential crop pathogens. The results provide
Substrate and Chicken Manure.             a novel insight into the fungal community associated with organic additives, which should be
Agronomy 2021, 11, 410. https://          beneficial in the task of managing the soil mycobiome as well as crop protection and productivity.
doi.org/10.3390/agronomy11030410
                                          Keywords: fungal fingerprinting; microbiome; mycobiota; phytopathogens; exogenous organic
Academic Editors:                         additives; soil fungal diversity
Małgorzata Szczepanek,
Anna Piotrowska-Długosz and
Iwona Konopka

                                          1. Introduction
Received: 31 January 2021
Accepted: 21 February 2021
                                               The addition of exogenous organic matter to soil is important, because it has a signifi-
Published: 24 February 2021
                                          cant influence on the chemical, physical and biological properties of the soil, and because it
                                          plays a role in carbon sequestration. Fungi play a significant role in the decomposition of
Publisher’s Note: MDPI stays neutral
                                          organic additives in the soil environment [1,2].
with regard to jurisdictional claims in
                                               Spent mushroom substrate (SMS) is a recycled composted organic material that re-
published maps and institutional affil-   mains after harvesting a mushroom crop. In general, SMS consists of agricultural residues
iations.                                  with the addition of poultry manure, coal, peat and other substances. High amounts of
                                          SMS are generated during mushroom production, especially in China, Italy, the USA, the
                                          Netherlands, Poland, Spain and France. For every 1 kg of mushrooms produced, 5 kg of
                                          SMS are generated [3]. The physicochemical properties of SMS vary with its composition.
Copyright: © 2021 by the authors.
                                          It has a pH in the range of 6.13–6.70 and also has a higher content of nitrogen, phosphorus,
Licensee MDPI, Basel, Switzerland.
                                          calcium and magnesium than manure [4]. The porosity and water-holding capacity of
This article is an open access article
                                          SMS vary between 14.50 and 26.20%, and 28.00 and 41.00%, respectively [5]. SMS is also
distributed under the terms and           characterized by a high content of organic matter and a low toxic element content [4,6].
conditions of the Creative Commons        Therefore, in recent years, spent mushroom substrate has been investigated in various
Attribution (CC BY) license (https://     research studies as a soil additive [7,8]. To date, the reported beneficial effects of the
creativecommons.org/licenses/by/          application of SMS to soil include improving the soil structure, managing plant diseases,
4.0/).                                    and the biodegradation and biosorption of organic contaminants [3,9]. The application of

Agronomy 2021, 11, 410. https://doi.org/10.3390/agronomy11030410                                            https://www.mdpi.com/journal/agronomy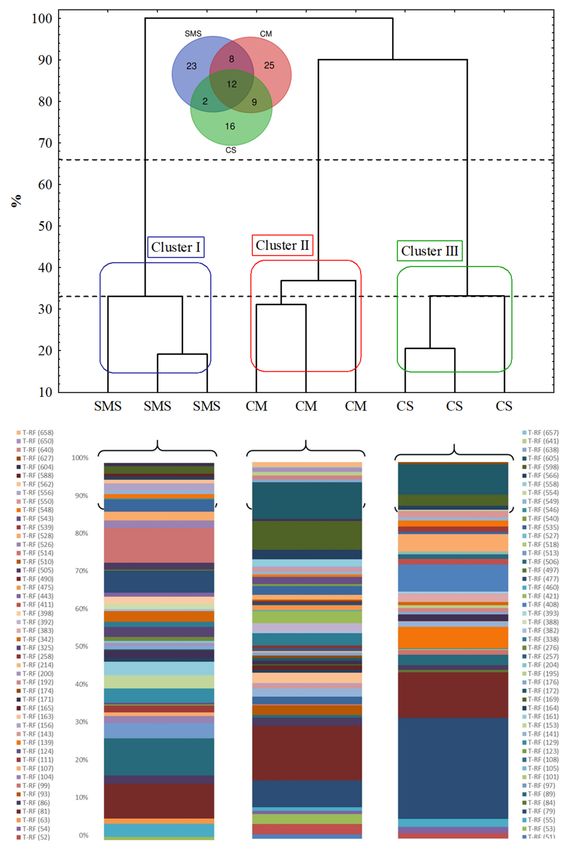
Agronomy 2021, 11, 410                                                                                            2 of 24

                         SMS to soil has positive effects on microbial activity, the organic matter content and soil
                         fertility [10].
                               Chicken manure (CM) is a rich organic fertilizer containing significant amounts of
                         nitrogen due to the presence of high levels of protein and amino acids. Moreover, it
                         contains all of the essential nutrients (P, K, Mg, Ca, S) that support crop production and
                         enhance the physical and chemical properties of the soil [11]. The application of chicken
                         manure improves soil water retention and the uptake of plant nutrients. In addition, the
                         application of chicken manure can influence the soil’s microorganism abundance, structure,
                         and activity [12]. However, the regular use of this organic additive may cause soil fungal
                         community shifts which can influence plant growth and soil health [13–15].
                               We hypothesized that fungal communities would be strongly influenced by exogenous
                         organic matter—such as spent mushroom substrate and chicken manure—and that the
                         abundance and richness of the mycobiota would increase, whereas the pathogen content
                         would decrease after SMS and CM addition into the soil.
                               The aim of this study was to determine the effects of the long-term application of spent
                         mushroom substrate and chicken manure on the relative abundance and fingerprinting
                         patterns of the fungal community in the soil, in order to assess the usefulness of these
                         exogenous organic materials in sustainable crop production. We applied a combined
                         methodological approach using quantitative PCR (qPCR), denaturing gradient gel elec-
                         trophoresis (DGGE), terminal restriction fragment length polymorphism (t-RFLP), and next
                         generation sequencing (NGS) through Illumina MiSeq technology in order to determine
                         the soil fungal composition and diversity for each type of applied organic additive, and to
                         understand the holistic long-term effect of SMS and CM on soil mycobiota. Comprehensive
                         molecular analyses with the different methods can give more insight into the fungal rela-
                         tionship in soil environment after exogenous organic matter amendments, including the
                         fungal abundance, structure, biodiversity and composition of the fungal community. The
                         DGGE and t-RFLP are ‘old school’, reliable techniques for microbial community screening
                         to describe ecological diversity, and are related to about a 1% cut-off, reflecting the interac-
                         tions of the dominant microorganisms among themselves and with their environment [16].
                         Moreover, in order to identify the dominant fungi, TRiFLe analysis [17] was performed
                         based on the size of the most abundant T-RF fragments. High-throughput gene amplicon
                         sequencing techniques also provide a more in-depth microbial community profile [18,19].
                         Therefore, we decided to combine these approaches and assays in this study; to the best of
                         our knowledge, the fungal responses to the long-term application of SMS and CM additives
                         have not been investigated before.

                         2. Materials and Methods
                         2.1. Site Description and Soil Sample Collection
                               The experimental site was located in Trzebieszów, in the Podlasie Region of Poland.
                         The region consists mainly of Podzol soils [20] of glacial origin, which are considered to be
                         low-productivity soils. They contain 86% sand, 12% silt, and 2% clay, and they are acidic
                         (pH 3.9–5.0). The weather conditions have a mean annual temperature of 7.1 ◦ C, and an
                         annual precipitation of 550 mm. The altitude of the study site is about 150 m.a.s.l. The
                         Trzebieszów commune is of a typical agricultural character, with about 62% arable land,
                         18% meadows and pastures, and 14% forests [21].
                               The treatments of the study are as follows: SMS—the soil was enriched with the spent
                         mushroom substrate (20 t ha−1 ) (N 51.994215; E 22.55112); CM—chicken manure-enriched
                         soil (10 t ha−1 ) (N 51.990203; E 22.59253); and CS—control soil with mineral fertilization (N
                         51.99773; E 22.54812) from a completely randomized field experiment with plots areas of
                         10 m2 . SMS and CM were applied over 20 years, and the crop rotation during this time
                         included rape-wheat-maize-triticale. Although we were not focused on potentially harmful
                         trace elements like arsenic, copper and zinc in the present study, based on the previous
                         study [4,22] and information collected from farmers who used these materials, it can be
                         confirmed that the content of heavy metals in SMS and CM is very low, and is included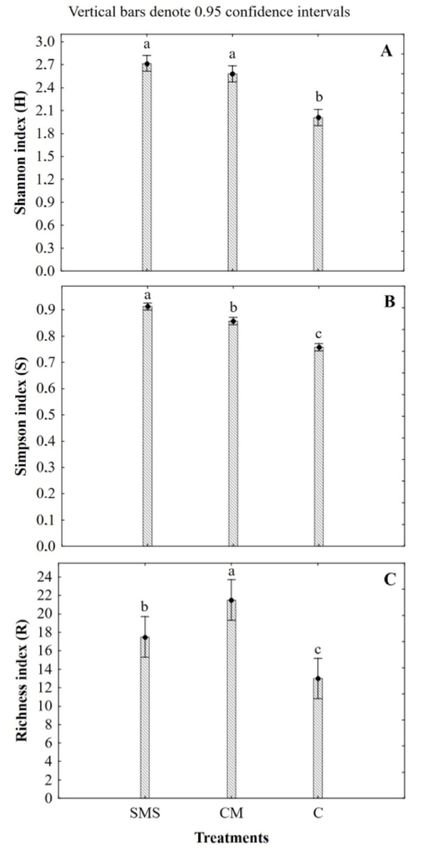
Agronomy 2021, 11, 410                                                                                            3 of 24

                         in the range allowing this waste material to fertilizer. Moreover, in order to prevent pest
                         growth and development in the SMS, this type of organic matter consisted of composted
                         chicken manure and lime.
                               In total, 60 soil samples were collected from each treatment. The soil samples were
                         collected as 3 subplots from each field using random composite sampling. For each subplot,
                         the soil samples were collected randomly, avoiding untypical soil areas from 20 sites in
                         order to obtain representative soil samples for each field. The fields were far apart from
                         each other, from 0.4 km to 2.9 km, as presented on a map (Figure S1).
                               The experimental site was described in the monograph under the redaction of Usowicz
                         et al. [21]. The soil samples from the fields under cereal cultivation were collected on 29th
                         June 2016 from 20 points for each subplot (~1 kg) at a depth of 0-20 cm, placed on ice, and
                         transported to the laboratory. The soil samples for the molecular analyses were stored at
                         -20 ◦ C until the tests were performed. Each soil sample was mixed in order to homogenize
                         it, before being passed through a 2-mm sieve and analysed. The air-dried and frozen soils
                         were used for the chemical and microbial analyses, respectively.

                         2.2. Analysis of the Soil’s Chemical Properties
                              The levels of the total concentration of phosphorus, potassium and magnesium were
                         determined according to the Polish Standards [23–25]. The soil pH was measured poten-
                         tiometrically. The total organic carbon (TOC) was assessed via the Tiurin method, and
                         the total nitrogen by was measured by the Kjeldahl method [26]. These parameters were
                         determined by the District Chemical and Agricultural Station (Lublin, Poland) according
                         to the standard procedures. Soil water content was determined by weight method using
                         moisture analyzer (Radwag, Radom, Poland). Analyses were performed as triplicates.

                         2.3. Extraction of the Total Genomic DNA from the Soil Samples
                              The total genomic DNA was extracted from nine soil samples, three for each fertil-
                         ization treatment, using a previously described procedure [27]. In brief, 0.5 g soil was
                         mixed with a solution from a FastDNA® SPIN Kit for Faeces (MP Biomedicals, USA), and
                         the DNA was extracted according to the manufacturer’s protocol. The amount of DNA
                         was determined spectrophotometrically using a NanoDrop (Thermo Scientific, USA) at a
                         wavelength of 260 nm. The efficiency of the DNA extraction and its quality were evaluated
                         through ratios of OD reads at 260/280 and 260/230 nm.

                         2.4. Analysis of the Fungal Abundance by qPCR
                              The fungal DNA was amplified by the use of the primers for the region ITS2, with
                         an expected amplicon length 330 bp with the primer sequences presented below. The
                         quantification of the total fungal DNA was determined using an external standard curve
                         composed of eight serially-diluted points from 10ˆ7 to 10ˆ-2. It was generated from the
                         serial dilution of the whole ITS fragment of fungal DNA obtained from Petriella setifera,
                         Byssochlamys fulva, Neosartorya fischeri, Talaromyces ruber, Fusarium oxysporum, and Botrytis
                         cinerea. The fungal DNA was extracted using the Plant & Fungi DNA Purification kit
                         (EURx, Poland). The amplification plot and the melting curve of the standard and negative
                         template control obtained from the quantification of the fungal abundance are included
                         in the Supplementary Materials as Figure S2. The PCR mixture contained a 0.5X Taq PCR
                         Master mix (2X) (50 mM Tris-HCl pH 9 at 25 ◦ C, 50 mM NaCl, 5 mM MgCl2 , 200 µM
                         each dNTP, 10 µg activated calf thymus DNA, and 0.1 mg/mL BSA) (EURx, PL), 0.5X
                         SG qPCR Master mix (2X) (EURx, PL), 0.2 µM primer ITS3 and ITS4 (50 - GCA TCG ATG
                         AAG AAC GCA GC -30 , Tm – 53.8 ◦ C and 50 - TCC TCC GCT TAT TGA TAT GC -30 , Tm –
                         49.7 ◦ C) [28], 0.2 µg/µl Bovine Serum Albumin (Thermo Fisher Scientific, USA) and 2 µL
                         0.1 ng/µL extracted DNA. The amplification of the fungal ITS2 regions was performed
                         with the following amplification cycle: 95 ◦ C for 5 min, followed by 35 cycles at 95 ◦ C
                         for 15 s, 55 ◦ C for 30 s, 76 ◦ C for 30 s, and 80 ◦ C for 30 s (in this step, the machine made
                         the data collection). All of the reactions were performed in quadruple replications in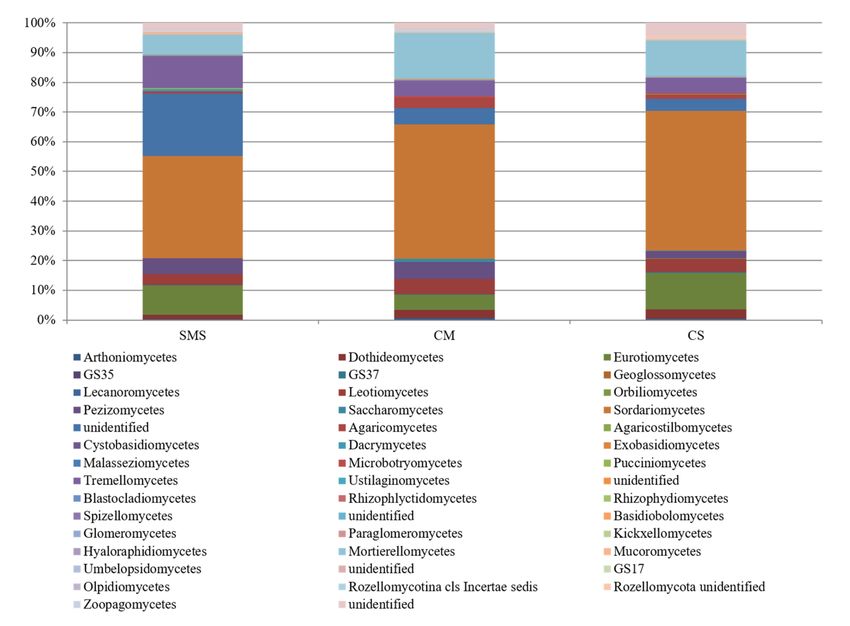
Agronomy 2021, 11, 410                                                                                            4 of 24

                         optical-grade 96-well plates on an ABI Prism 7500 Fast Real-Time PCR system (Applied
                         Biosystems). The instrument automatically calculated the cycle threshold (CT), efficiency
                         % (E%), and R2 . The qPCR validation was evaluated using agarose gel electrophoresis,
                         a melting curve analysis, and qPCR efficiency. The fungal abundance consisted of four
                         technical replications for each sample. The copies of the fungal ITS2 were calculated per
                         the dry weight of the soil.

                         2.5. Analysis of the Fungal Community Using the DGGE Approach
                                The variations in the soil’s fungal diversity were determined by the amplification of the
                         region ITS1 through a nested PCR. In fact, at the first stage of the reaction, the whole region
                         of ITS (ITS1 + 5.8S + ITS2) was amplified by using ITS1/ITS4 primers, but then in nested
                         PCR only was the ITS1 fragment amplified with CG-ITS1/ITS2 primers [28]. 2.5. Analysis
                         of the Fungal Community Using the DGGE Approach. All of the reactions were executed
                         in a Veriti® 96-well Fast Thermal Cycler (Applied Biosystems, Foster City, CA, USA) in a
                         20 µL reaction mixture. Each reaction on the first PCR contained: 1X REDTaq® ReadyMix™
                         PCR Reaction Mix (20 mM Tris-HCl pH 8.3 with 100 mM KCl, 3 mM MgCl2 , 0.002% gelatin,
                         0.4 mM dNTP mix and 0.06 unit/µL of Taq DNA Polymerase) (Sigma-Aldrich, USA),
                         0.2 µM of both the primers ITS1 (50 - TCC GTA GGT GAA CCT GCG G -30 , Tm – 55.4 ◦ C)
                         and ITS4 (50 - TCC TCC GCT TAT TGA TAT GC -30 , Tm – 49.7 ◦ C) [28], 0.2 µg/µL Bovine
                         Serum Albumin (Thermo Fisher Scientific, USA) and 2 µL of extracted DNA diluted 1:10
                         with the total amount of DNA 2 ng in reaction. The thermocycling program for the Veriti®
                         96-well Fast Thermal Cycler (Applied Biosystems, Foster City, CA, USA) was performed in
                         a similar way to a method which was reported by [29] with a modification in the extension
                         step. The program consisted of an initial step of 3 min at 94 ◦ C, followed by 35 cycles of
                         denaturation at 94 ◦ C for 1 min, annealing at 55.5 ◦ C for 2 min, and elongation at 72 ◦ C for
                         2 min. The last cycle was followed by an extension at 72 ◦ C for 30 min. The size of the PCR
                         products ranged from ~500 bp to ~700 bp, due to the huge variability in the length of the
                         ITS region for the fungi [30], which was visualized on a 2% agarose gel. The example of a
                         gel picture from our study was presented on Figure S3 in the Supplementary Materials.
                         Successively, 1 µl of the PCR-product was used for a nested PCR with primer CG-ITS1
                         (50 - CGC CCG CCG CGC GCG GCG GGC GGG GCG GGG GCA CGG GGG GTC CGT
                         AGG TGA ACC TGC GG -30 , Tm – 88.9 ◦ C) and ITS2 (50 - GCT GCG TTC TTC ATC GAT
                         GC -30 , Tm – 53.8 ◦ C) [28]. The reaction mixture of the second PCR was the same as that of
                         the first PCR, and the thermocycling program for the Veriti® 96-well Fast Thermal Cycler
                         (Applied Biosystems, Foster City, CA, USA) was performed in a similar way to the method
                         that was reported by [27], with the following modifications. The program consisted of
                         an initial step of 5 min at 94 ◦ C, followed by 35 cycles of denaturation at 94 ◦ C for 1 min,
                         annealing at 56 ◦ C for 1 min, and elongation at 72 ◦ C for 1 min. The last cycle was followed
                         by an extension at 72 ◦ C for 30 min. The PCR products were visualized on 3% agarose gel.
                         The ITS1 rDNA-DGGE was performed with 80 ng DNA on 8% polyacrylamide gel with
                         a 20–50% denaturing gradient. The electrophoretic run lasted for 16 h at 60 V and 60 ◦ C,
                         using a TAE 1X running buffer. Two replicates for each sample were analysed.

                         2.6. Analysis of the Soil Fungal Community Using a t-RFLP Approach
                              The whole ITS region was amplified to evaluate soil fungal diversity via t-RFLP
                         analysis. The genomic DNA was amplified using a dilution of 1:10 of each sample analysed
                         with a total amount of DNA in a reaction equal 2 ng. The reaction mixture included: 1X
                         REDTaq® ReadyMix™ PCR Reaction Mix (20 mM Tris-HCl pH 8.3 with 100 mM KCl, 3 mM
                         MgCl2 , 0.002% gelatin, 0.4 mM dNTP mix and 0.06 unit/µL of Taq DNA Polymerase)
                         (Sigma-Aldrich, USA), 0.2 µM of primer ITS1 with a 50 FAM fluorescent label (50 - 6-FAM-
                         TCC GTA GGT GAA CCT GCG G -30 , Tm – 55.4 ◦ C), 0.2 µM primer ITS4 (50 - TCC TCC
                         GCT TAT TGA TAT GC -30 , Tm – 49.7 ◦ C) [28], 0.2 µg/µL Bovine Serum Albumin (Thermo
                         Fisher Scientific, USA), 2 ng extracted DNA and nuclease-free water to arrive at a total
                         volume of 20 µL. The PCR condition was the same as that used in the first run for the
Agronomy 2021, 11, 410                                                                                           5 of 24

                         DGGE analysis. The 500-700 size of the PCR-products were visualized on a 2% agarose
                         gel. The PCR-product was digested separately with HaeIII (EURx, PL) and MseI (New
                         England Biolabs, USA) restriction enzymes in a final volume of 30 µL containing 20 µL of
                         the PCR-product, 1X Buffer and 4 U of restriction enzyme. The samples were incubated
                         at 37 ◦ C for 2 h and this was followed by deactivation at 80 ◦ C for 20 min for the HaeIII
                         enzyme and 65 ◦ C for 20 min for the MseI enzyme. After digestion, 1 µl of each sample
                         was mixed with 9 µL of Hi-Di Formamide (Applied Biosystems, USA) and 0.5 µL of
                         GS-600 LIZ Standard (Applied Biosystems, USA). Before analysing the fragments, the
                         samples were incubated at 95 ◦ C for 3 min and at 4 ◦ C for 3 min. The fragment size
                         analysis consisted of three technical replications for each sample and was carried out
                         with an Applied Biosystems 3130 Genetic Analyser (Applied Biosystems, Foster City, CA,
                         USA). The obtained results were analyzed using GeneMapper v. 4.0. software (Applied
                         Biosystems, Foster City, CA, USA). The analysis included restriction fragments with a size
                         range from 50 bp to 660 bp within the samples including peaks area higher than 1%. Based
                         on in silico analysis using TRiFLe software tool [17] the terminal restriction fragments
                         (T-RFs) were identified using The National Center for Biotechnology Information (NCBI)
                         database (https://www.ncbi.nlm.nih.gov/, accessed on 19 February 2021) [31].

                         2.7. Analysis of the Soil Fungal Community Composition Using Illumina MiSeq Platform
                         Sequencing
                               An analysis of the fungal community structure was performed based on the ITS1
                         region. The set of primers ITS1FI2/5.8S (50 - GAACCWGCGGARGGATCA -30 ; 50 - CGCT-
                         GCGTTCTTCATCG -30 ) [32,33] was used to amplify the ITS1 region. The PCR amplification
                         was carried out in a Q5 Hot Start High-Fidelity 2X Master Mix according to the conditions
                         included in the manufacturers’ protocols. The DNA library was sequenced using an Illu-
                         mina MiSeq platform with pair-end (PE) technology, at 2x250 bp, using the v2 Illumina
                         kit following the manufacturers’ instructions. MiSeq Reporter (MSR) v2.6. software was
                         used for a preliminary elaboration of the data, and the Quantitative Insights into Microbial
                         Ecology (QIIME) tool was used to process the raw sequence reads [34]. First, the raw reads
                         were analysed by Cutadapt (v. 1.9.1) in order to cut the remaining sequences of adaptors
                         and primers. Subsequently, the filtering of the sequences was based on the read quality,
                         with a threshold equal 20 (q20), which was used to trim low-quality ends from the reads
                         before the adapter removal, and for read lengths with a threshold equal 30 bp (m30), in
                         order to discard the pair if one of the reads was too short. Then, the analysis included
                         the following steps: read joining and quality evaluation via fastq-join [35], the removal
                         of low quality sequences (quality filter at Phred ≥ Q20) and chimeras (usearch61), the
                         generation of operational taxonomic units (OTUs), which were defined by clustering at
                         97% similarity. Then, low-abundance OTUs (minimal OTT size 10) were filtered out. The
                         taxonomical classification of the OTUs was achieved using a Basic Local Alignment Search
                         (BLAST) against the UNITE database. The next generation sequencing was performed
                         in Genomed S.A. (Warsaw, Poland). Finally, the FUNGuild online application was used
                         to assign functional information, including the trophic mode and ecological guild of the
                         fungi [36], to the OTUs obtained in the high-throughput sequencing datasets.

                         2.8. Statistical Analysis
                               An analysis of variance (ANOVA) and a post-hoc test Tukey’s HSD were used to
                         determine the differences in the number of ITS2-copies (qPCR), Shannon, Simpson and
                         Richness indices between the treatments, based on three replicates of soil for each treatment,
                         as described in the section on sample collection (2.1.). Based on a cluster analysis, the
                         dendrograms were prepared with a scaled similarity % on the axis (Ward’s method and the
                         Unweighted Pair Group Method with Arithmetic Mean—UPGMA), and a boundary was
                         marked according to Sneath’s criteria. A heat map and a Venn diagram which show the
                         relative abundances of the identified fungal sequences at species level > 1% in the sample
                         were generated based on the OTUs (NGS) and t-RFs fragments (t-RFLP) via the online
                         tool http://bioinformatics.psb.ugent.be/webtools/Venn/(accessed on 19 February 2021).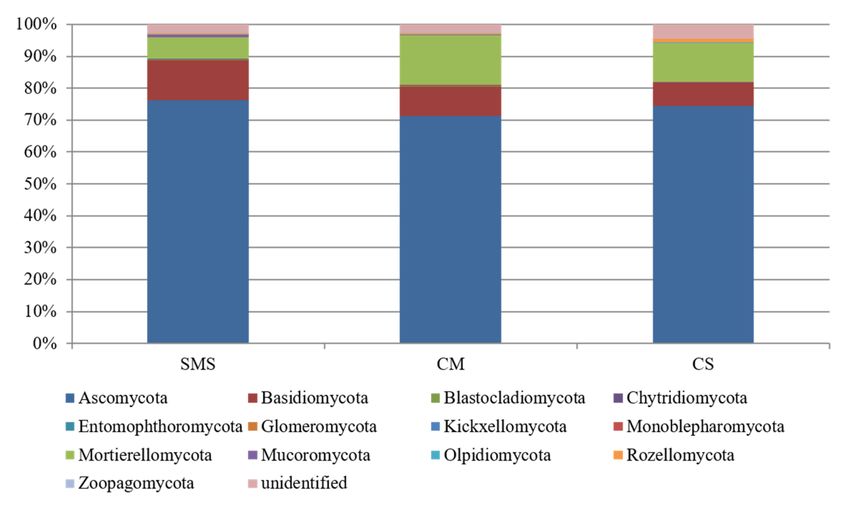
Agronomy 2021, 11, 410                                                                                                      6 of 24

                                 The fungal α-diversity was assessed following Shannon and Simpson’s diversity indices,
                                 and the richness of relative abundance. The analyses were performed using the following
                                 software: R v.3.2.5 and Statistica v.13.1.

                                 3. Results
                                 3.1. Soil Properties
                                      The effects of the spent mushroom substrate (SMS) and chicken manure (CM) on
                                 the soil chemical properties are summarized in Table 1. Both additives increased the soil
                                 nutrient concentrations—including N, P, K and Mg—compared to the control soil (CS).
                                 The soil pH was 4.95 for the control; it increased to 7.08 and 6.68 after the addition of SMS
                                 and CM, respectively. Furthermore, the total organic carbon content increased by about
                                 four and five times after the application of CM and SMS, respectively, compared to the
                                 control soil.

     Table 1. Properties of soil under different treatments. Explanations: SMS—spent mushroom substrate, CM—chicken
     manure, CS—control soil, SWC—soil water content (moisture), TOC—total organic carbon.

                                      SWC               TOC              N               P               K             Mg
  Treatments             pHKCl
                                       (%)              (%)            (g/kg)        (mg/100 g)      (mg/100 g)     (mg/100 g)
      SMS                 7.08        11.43             2.73            2.69             50              30            13
      CM                  6.68        11.43             2.03            0.87             49              18            17
       CS                 4.95         1.38             0.50            0.59             24               9             4

                                 3.2. Effect of Organic Fertilization Treatments on Soil Fungal Abundance
                                       The fungal abundance in all of the soils was determined using qPCR that targeted the
                                 ITS2 region of the ribosomal RNA gene. The abundance of the fungi varied from 8.59 × 10⁷
                                 to 3.75 × 10⁸ the quantity of ITS2 per gram of dry soil across all of the samples (Figure 1).
                                 The soil fungal abundance significantly increased both in the SMS- and CM-treated soil by
                                 about 430% compared to the control soil. The efficiency, R2, and the slope of the standard
                                 curve were 104%, 0.99, and −3.2, respectively. As was mentioned in Section 2.4, the melting
                                 curve is presented on Figure S2.

                                 3.3. Effect of the Organic Fertilization Treatments on the Soil Fungal Diversity
                                       The DGGE profile of the fungal community based on the ITS1 region is shown in
                                 Figure 2. The fungal DGGE profiles in all of the tested soils comprised 17 bands on average.
                                 The fungal community patterns differed between the treatments. The typical bands were
                                 detected for each treatment. For both tested replicates, four (1–4), two (6–7) and one (5)
                                 bands were specific for the SMS, CM and CS treatments, respectively. The rest of the visible
                                 bands were common for all of the tested treatments. The fungal DGGE profiles obtained
                                 from the chicken manure treatment did not differ significantly from those of the control soil.
                                 However, the relative intensities of the selected bands from the SMS-treated soil increased
                                 compared with those resulting from the CM and CS treatments.
                                       The dendrogram of the soil fungal similarity obtained by the DGGE analysis showed
                                 the similarities and differences among the treatments (Figure 2). The clustering of the fungal
                                 communities, based on 66% of Sneath’s similarity criterion, revealed the existence of two
                                 groups, indicating relatively large differences between the SMS and the other treatments.
                                 The similarity matrix (Table S1) confirmed the distance between the tested treatments.
                                 The similarities between the SMS and CM or CS were 36.53% and 36.90%, respectively.
                                 However, the percentage of similarity between the CM and CS was 65.75%. The similarity
                                 of the DGGE profiles based on the Dice similarity coefficients was consistently high (more
                                 than 86%) among all of the tested pairs of profiles (Figure 2, Table S1).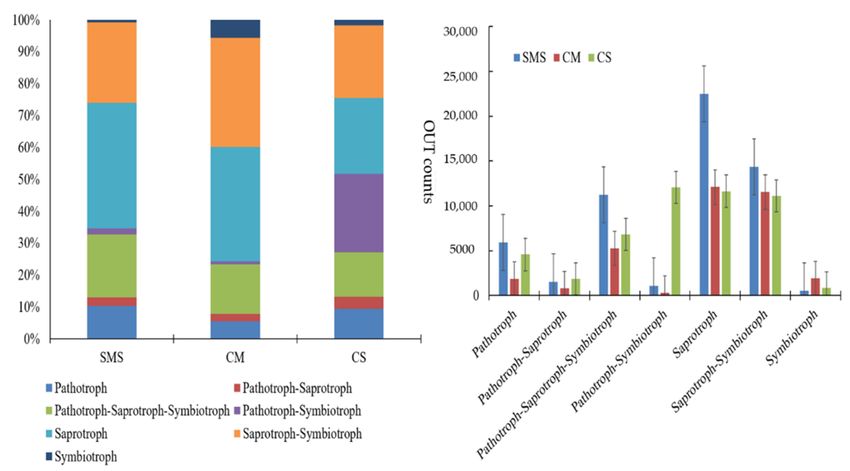
Agronomy 2021, 11, 410                                                                                                     7 of 24

     Figure 1. The abundance of fungi as indicated by the number of ITS2 copies as measured using quantitative PCR (qPCR).
     Different letters above columns denote a significant difference (p < 0.05, Tukey’s test). SMS—spent mushroom substrate,
     CM—chicken manure, CS—control soil; n = 12; 4 replications for each treatment.

     Figure 2. The DGGE profile of the fungal communities in soil treatments and the UPGMA dendrogram generated is based
     on the DGGE profiles. The numbers and arrows on the gel indicate specific bands related to the treatments. SMS—spent
     mushroom substrate, CM—chicken manure, CS—control soil.

                                3.4. The Fungal Community, as Determined by t-RFLP
                                      The t-RFLP approach, based on the whole ITS region, revealed especially signif-
                                icant changes in the fungal communities between the different tested soil treatments
                                (Figures 3 and 4). Several peaks were detected from the fungal T-RFs that were within
                                the range of the signal marker (20-600 bp) used, that is, from 55 to 658 bp (HaeIII) and
                                51–657 bp (MseI). The average T-RF richness, as derived from the number of peaks gener-
                                ated from the treatments tested, reached its highest level (31 – HaeIII, 27 – MseI) using both
                                restriction enzymes (Figure 3C). The lowest number of restriction fragments was found in
                                the control soil (22 – HaeIII, 18 – MseI). However, following the SMS treatment, the richness
                                of the T-RF was 25 and 21 for the HaeIII and MseI restriction enzymes, respectively.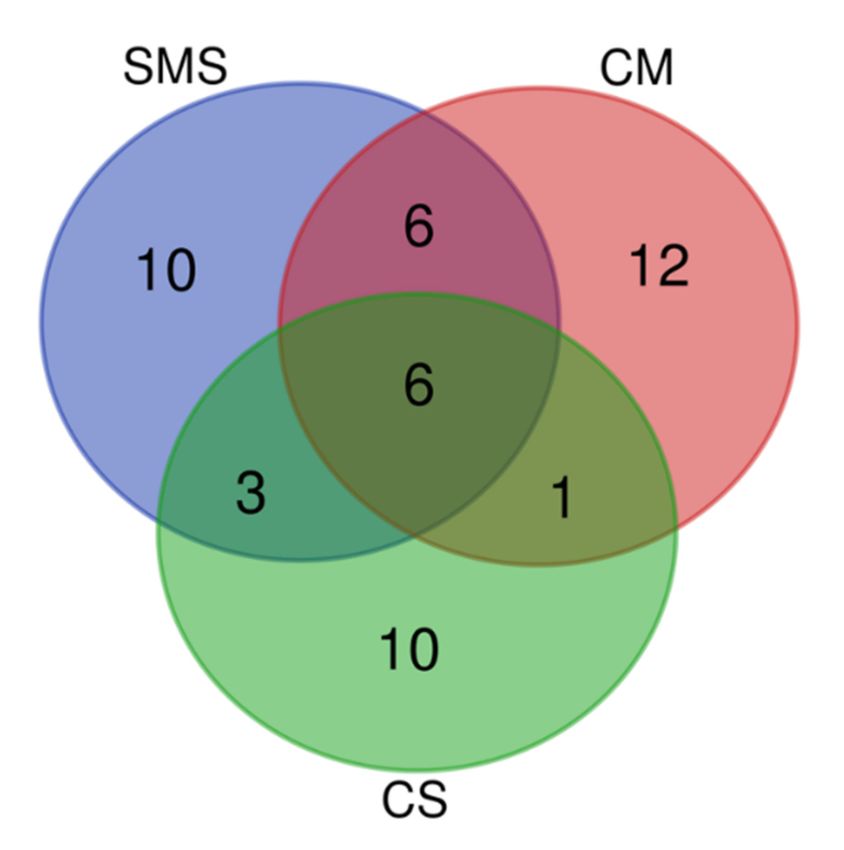
Agronomy 2021, 11, 410                                                                                              8 of 24

                         Figure 3. The diversity indices Shannon (A), Simpson (B) and Richness (C) are based on fungal ITS
                         analysis by t-RFLP calculated based on the average of both restriction enzymes. Different letters
                         above columns denote a significant difference (p < 0.05, Tukey’s test). SMS—spent mushroom
                         substrate, CM—chicken manure, CS—control soil.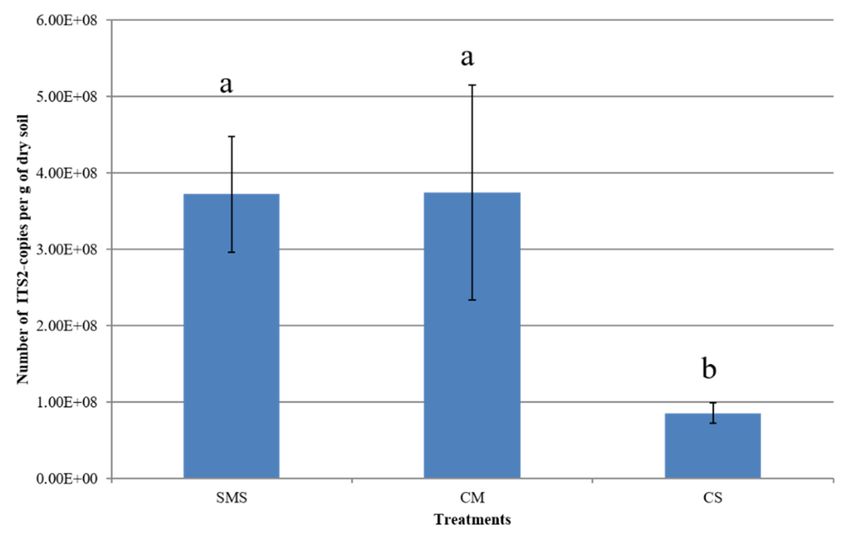
Agronomy 2021, 11, 410                                                                                                        9 of 24

     Figure 4. A dendrogram and Venn diagram based on the t-RFLP profiles of the fungal communities of ITS from all the
     treatments (above). The relative abundance of soil fungal t-RFs after the long-term organic amendment application (below).
     SMS—spent mushroom substrate, CM—chicken manure, CS—control soil. The cluster analysis was based on the Euclidean
     distances and Ward clustering method.
Agronomy 2021, 11, 410 10 of 24
The diversity indices, estimated by Shannon and Simpson’s formulae, were signifi-
cantly higher under SMS and CM compared to the control soil. The Shannon and Simpson’s
diversity indices reached their highest point following SMS treatment using both restriction
enzymes (Figure 3A,B, Table S2).
The distribution in the abundance of various fragment sizes between the tested
treatments is shown in Figure 4. The assessment of the abundance pattern of the fragment
sizes in SMS and CM suggests that there is a tendency to increase the overall number of
peaks and decrease their intensity compared to the control soil, with a lower number of
peaks but with greater intensity, especially for the larger fragments. The t-RFLP diversity
patterns obtained from all of the samples indicated the presence of more than 100 distinct
T-RFs (Figure 4). Most of them were found in the CM (54) and SMS (45) treated soils,
whereas 39 T-RFs were detected in the control soil. In detail, as presented in the Venn
diagram (Figure 3); 12 T-RFs of 55, 81, 86, 89, 171, 176, 528, 535, 548, 566 and 598 bp were
present in all of the soil samples. Furthermore, 8 T-RFs of 53, 164, 172, 338, 382, 477, 556 and
604 bp were detected in the SMS- and CM-treated soils, but not in the control soil. Finally,
16 T-RFs of 84, 101, 139, 192, 195, 383, 393, 411, 506, 513, 518, 527, 539, 554 and 627 were
only observed in the control soil (Table S3). Based on the in silico analysis with the TRiFLe
software tool [17], a predicted identification of fungi based on t-RFs fragment size was
performed (Table S4). The predominant T-FRs 139 in the control soil could be represented
by Metarhizium sp. (Table S4). The T-RFs 86, 548 and 566 present in all tested treatments
(SMS, CM, CS) could be representatives of Trichoderma sp., Lophiostoma sp. and Derxomyces
sp., respectively, while T-RF 89 could be represented by 13 different genera (Table S4) based
on the in silico prediction analysis mentioned above.
A cluster analysis of the similarity values generated in this study was obtained using
the UPGMA algorithm (Figure 4). The cluster diagram indicates that there is a very close
grouping of the soil samples from each treatment (Cluster, I, II, III). In addition, analyzing
Figures 2 and 4, we can observe that the CM and CS treatments were similar to each other
in both types of analyses, DGGE and t-RFLP, while the SMS-treated soil was out of the
cluster created by the CM and CS treatments, indicating the higher distance and diversity
of the fungal community in this treatment. The cluster profile of the ITS fragments (ITS1 for
DGGE and whole ITS for t-RFLP) obtained in both of the mentioned analyses demonstrated
a clear separation between the fungal communities in the SMS-treated soil and those of the
CM-treated soil and the control soil (Figures 2 and 4).
3.5. Relative Abundance of the Fungi and Their Taxonomic Classification, as Determined by NGS
The amount of raw Illumina sequences before the quality filtering was from 143,157
(CM) through 167,302 (CS) to 211,978 (SMS). In total, 393,102 high-quality ITS1 sequences
were obtained from all of the samples. The sequences were classified as fungal ITS1 se-
quences by the UNITE databases, 60,377 to 140,400 sequences were obtained per treatment
(Table 2; Table S5). The mean read length was 251 bp. When grouped at the 97% similar-
ity at the genus level, there were 884 different phylotypes for all of the treatments, with
282, 283 and 319 phylotypes for SMS, CM and CS, respectively. The Illumina sequencing
data were uploaded to the NCBI Sequence Read Archive database with accession number
SRP130056. The number of sequences was normalized by the performance of rarefaction
analyses. In order to obtain normalized sequences, the OTU table was subsampled by the
pseudo-random number generator (an implementation of the Mersenne twister PRNG).
Moreover, it is worth mentioning that the relative abundance, which is a fixed percentage
composition, is independent of the number of reads.
The fungal sequences were classified into seven phyla across the entire data set. The
following percentages of the dataset reads were assigned to particular taxonomic level
Kingdom, Phylum, Class, Order, Family, Genus and Species: 100.00%, 97.98%, 74.74%,
67.57%, 56.45%, 43.19%, 37.71% for SMS, 100.00%, 97.27%, 91.26%, 77.12%, 63.89%, 53.38%,
34.69% for CM and 100.00%, 95.35%, 90.72%, 81.33%, 73.49%, 68.24%, 54.69% for CS,
respectively (Table S5). The dominant fungal phyla across all of the soil samples wereAgronomy 2021, 11, 410 11 of 24
Ascomycota, Basidiomycota and Mortierellomycota, with the relative abundances of the
OTUs ranging from 76.24% through 12.61% to 6.68% for SMS; from 71.33% through 9.14%
to 15.35% for CM; and from 74.47% through 7.15% to 12.05% for CS (Figure 5). In addition,
Chytridiomycota, Mucoromycota, Rozellomycota and Zoopagomycota were minor phyla,
with the lower relative abundances being 0.32%, 0.26%, 0.13%; 0.80%, 0.20%, 0.19%; 0.58%,
0.59, 1.15% and 0.38%, 0.50%, 0.11% for the SMS, CM and CS treatments, respectively.
The relative abundances of Glomeromycota were not detected in the SMS-amended soil,
and were low in the other treatments, that is, 0.15% and 0.20% in CM-treated soil and
CS, respectively. However, Blastocladiomycota were only present in the soil treated with
SMS and CM at a low level of 0.08% and 0.25%, respectively. The results showed that, in
soil treated with spent mushroom substrate, the relative abundance of Ascomycota and
Basidiomycota were higher than in the control soil, while Mortierellomycota were lower
compared to the CS. However, in soil treated with chicken manure, the relative abundance
of Ascomycota decreased, and Basidiomycota and Mortierellomycota increased compared
to the control soil.
Table 2. Illumina MiSeq sequenced fungal data and fungal community α-diversity indices based on the ITS1 gene at the
genus level in soil amended with the spent mushroom substrate (SMS) and chicken manure (CM), and the control soil (CS).
Explanations: OTUs, Operational Taxonomic Units. The observed OTUs, Shannon, and Simpson indices were calculated
based on data normalized to an equal sequencing depth (at a reading depth of 60,000).
Number of OTUs
Treatments Shannon Index Simpson Index Total Number of Reds Total Number of Genus
(Richness Index)
SMS 796 5.95 0.94 140400 241
CM 848 6.96 0.97 60377 245
CS 972 6.86 0.98 82296 276
Figure 5. The relative abundance of the soil fungal phylum after the long-term organic treatment. SMS, spent mushroom
substrate; CM, chicken manure; CS, control soil. The fungal communities were examined through the next-generation
sequencing (NGS) of the ITS1 region using Illumina MiSeq technology.Agronomy 2021, 11, 410 12 of 24
The results indicated the evident differences among the treatments at the class level
of taxonomic classifications (Figure 6). Based on the total high-quality sequences, Sor-
dariomycetes, Tremellomycetes, Mortierellomycetes and Eurotiomycetes were the four
dominant classes in all of the treatments, accounting for 34.35%, 10.78%, 6.68% and 9.88%
for SMS-treated soil, 45.23%, 5.02%, 15.35% and 5.04% for CM-treated soil, and 46.94%,
5.13%, 12.01% and 12.40% for the CS, respectively. Furthermore, four other classes of fungi—
Leotiomycetes, Pezizomycetes, Dothideomycetes, and Agaricomycetes, which accounted
for an average of 4.42%, 4.40%, 2.43%, and 1.89% of the total sequences, respectively—were
detected in the present study. The remaining 30 classes that appeared along with the
relatively abundant ones accounted for a relatively small proportion of the total amount
of fungus; they ranged from 0.01% to 1.18%. The addition of spent mushroom substrate
increased the abundance of Tremellomycetes, Pezizomycetes and another unidentified
Ascomycota, whereas it reduced the abundance of Sordariomycetes, Leotiomycetes, Doth-
ideomycetes, Eurotiomyctes and Mortierellomycetes. However, increases in the relative
abundance of Mortierellomycetes, Leotiomycetes and Pezizomycetes, and decreases in the
levels of Sordariomycetes, Tremellomycetes and Eurotiomycetes were observed in the soil
treated with chicken manure.
Figure 6. The relative abundance of the soil fungal class after the long-term organic treatment. SMS, spent mushroom
substrate; CM, chicken manure; CS, control soil. The fungal communities were examined through the next-generation
sequencing (NGS) of the ITS1 region using Illumina MiSeq technology.
Further taxonomical classification at the genus level revealed that 241–276 fungal
genera were detected in this study, which indicated the differences in the fungal community
among the tested treatments (Table S6). A thorough investigation of each genus selected
according to their relative abundance (≥1%) in each treatment is presented in Table 3.
The results showed that the fungal community in all of the treatments was dominated byAgronomy 2021, 11, 410 13 of 24
Mortierella and Solicoccozyma. However, the sequence number of Mortierella was the highest
for CM-treated soil (14.91%); it was lower for CS soil (11.85%), and the lowest for SMS-
treated soil (6.52%). The relative abundance of Solicoccozyma in the SMS-treated soil (4.50%)
was greater than that of the CM-treated soil (2.00%) and the CS (2.90%). The percentage of
Fusarium and Humicola was quite high, and was similar in all of the tested soils, with a level
of 0.86%, 1.09%, 1.81% and 1.10%, 1.34%, 0.76% for the SMS-treated soil, CM-treated soil,
and CS, respectively. The Cephalotrichum, Cutaneotrichosporon, Chrysosporium and Scutellinia
for the SMS treated soil (1.34%, 2.74%, 4.18%, 1.09%) surpassed that for CM treated soil
(0.09%,Agronomy 2021, 11, 410 14 of 24
Table 3. The relative abundance of the phylogenetic genus in the different amended soils, according to its relative abundance (≥1%) in each treatment.
Relative Abundance (%)
Phylum Class Order Family Genus
SMS CM CS
Ascomycota Dothideomycetes Pleosporales Phaeosphaeriaceae Ophiosphaerella 0.02 0.11 1.01
Eurotiomycetes Chaetothyriales Herpotrichiellaceae Exophiala 1.08 2.77 0.66
Eurotiales Trichocomaceae Aspergillus 0.18 1.07 0.13
Penicillium 1.07 4.76 0.35
Onygenales Onygenaceae Chrysosporium 4.18 2.26 1.22
unidentified unidentified 1.77 1.21 2.19
Leotiomycetes Helotiales Helotiales Cadophora 0.03 0.13 2.24
Thelebolales Pseudeurotiaceae Pseudogymnoascus 2.45 3.02 0.73
Pezizomycetes Pezizales Ascobolaceae Ascobolus 0.79 1.25 1.99
Pyronemataceae Pseudaleuria 0.19 0.77 1.44
Scutellinia 1.09 0.04 0.58
unidentified 1.92 0.93 2.56
Sordariomycetes Glomerellales Plectosphaerellaceae Plectosphaerella 0.06 0.09 1.00
Hypocreales Clavicipitaceae Metarhizium 0.63 13.96 0.40
Hypocreaceae Trichoderma 0.35 0.66 1.08
Hypocreales Acremonium 0.06 1.87 0.18
Nectriaceae Fusarium 0.86 1.81 1.09
unidentified 4.21 1.10 1.86
unidentified unidentified 0.27 1.04 0.48
Microascales Microascaceae Cephalotrichum 1.34 0.12 0.09
unidentified unidentified 7.07 0.17 0.02
Sordariales Chaetomiaceae Humicola 1.10 0.76 1.34
Lasiosphaeriaceae Apodus 0.84 0.20 1.09
Cladorrhinum 0.16 0.79 1.54
Podospora 0.17 1.37 0.92
unidentified 5.49 1.49 3.69
Sordariaceae unidentified 0.03 0.26 1.39
unidentified unidentified unidentified 0.58 3.37 8.52
unidentified unidentified unidentified unidentified 6.85 9.02 12.35
Basidiomycota Agaricomycetes unidentified unidentified unidentified 22.57 3.93 5.72
Tremellomycetes Filobasidiales Piskurozymaceae Solicoccozyma 0.01 0.10 1.04
Trichosporonales Trichosporonaceae Cutaneotrichosporon 4.50 2.90 2.00
Mortierellomycota Mortierellomycetes Mortierellales Mortierellaceae Mortierella 2.74 0.05 0.00
unidentified unidentified unidentified unidentified unidentified 6.52 11.85 14.91Agronomy 2021, 11, 410 15 of 24
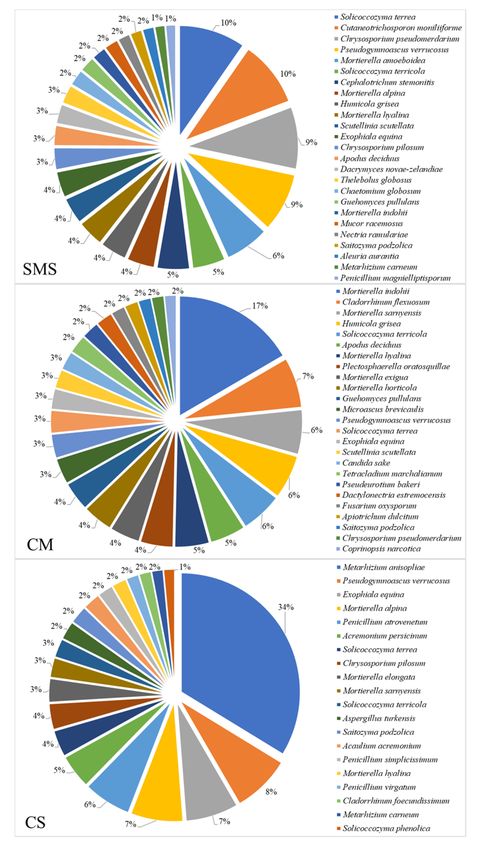
Figure 7. The relative abundance of soil fungal species, which constitute at least 1% among iden-
tified species, after the long-term organic treatment presented as core mycobiome. The percent of
sequences classified to a fungal species for each treatment was as follows: 37.71% (SMS), 34.69%
(CM), 54.69% (CS). SMS—spent mushroom substrate, CM—chicken manure, CS—control soil. Fungal
communities were examined through next generation sequencing (NGS) of the ITS1 region using
Illumina MiSeq technology.Agronomy 2021, 11, 410 16 of 24
Figure 8. Venn diagram of fungal species in soil treatments, showing the number of shared and
unique species in the treatments based on identified operational taxonomic units (OTUs) ≥1%.
The numbers in the overlapping circles show the species shared by two or three treatments of the
fungal community and the intersections of the circles indicate the coexisting fungal genera in those
treatments. SMS—spent mushroom substrate, CM—chicken manure, CS—control soil.
In the fungal community, 48 species were detected as a core mycobiota in all of the
tested soil treatments. Only one species was shared by the respective communities of
the chicken manure amended soil and the control soil. Three species were shared by the
mycobiome of the spent mushroom substrate and the control soil. For the chicken manure
and the spent mushroom substrate fertilized soil, a core mycobiota of six species were
identified. According to the Venn diagram for the most abundant identified OTUs (≥1%),
six species were common for all of the treatments, as well as 10, 12 and 10 species were
specific for SMS, CM and CS, respectively (Figure 8).
Functional guilds prediction of the fungal community included seven trophic modes
(pathotroph, pathotroph-saprotroph, pathotroph-saprotroph-symbiotroph, pathotroph-
symbiotroph, saprotroph, saprotroph-symbiotroph, symbiotroph) observed in all tested
soil treatments. The two groups including saprotroph and saprotroph-symbiotroph were
present in all tested treatments, but they were dominant for SMS- and CM-treated soils
(Figure 9). The OTUs counts as well as relative abundances of the saprotrophs, saprotrophs-
symbiotrophs and pathotrophs-symbiotrophs in CS soil were at similar level (Figure 9).
Moreover, based on FunGuild analysis it was observed that the relative abundance of some
potentially pathogenic fungi including plant pathogens (Gibberella zeae, Mycosphaerella tas-
siana, Leptosphaeria sp., Slopeiomyces cylindrosporus, Sporothrix inflata) and animal pathogens
(Exophiala equina) decreased after the application of SMS and CM (Table S7). Application
of these exogenous organic matter caused an increase in the abundance of Cephalotrichum
stemonitis and Penicillium aurantiogriseum, which according to FunGuild analysis was classi-
fied as a plant pathogen. Moreover, the counts of fungal parasite such as Syncephalis sp.
and Trichoderma polysporum increased in soil treated with CM and SMS (Table S7).Agronomy 2021, 11, 410 17 of 24
Figure 9. The relative abundance and OTUs counts for fungal functional groups (trophic modes) for each treatment based
on FunGuild tool. SMS—spent mushroom substrate, CM—chicken manure, CS—control soil. Fungal communities were
examined through next-generation sequencing (NGS) of the ITS1 region using Illumina MiSeq technology.
4. Discussion
4.1. Effects of Additives on Soil Properties
The spent mushroom substrates may enrich soils with organic matter, nitrogen, and
carbonates, improving their fertility and preventing soil degradation [6]. To date, a large
volume of research has indicated that soil properties—such as pH, organic carbon content,
bulk density, enzymatic and microbial activity—are improved by different organic addi-
tives [37–39]. Several studies have assessed the effects of organic matter application in
the long-term experiments, but with additives such as biochar, composts, sewage sludge
and farmyard manure [40–42]. The influence of spent mushroom substrate and chicken
manure on soil properties has only been tested in a few short-term experiments [3–9]. From
a comparison of the results between the short-term and our 20-year studies, it is apparent
that the positive effects of spent mushroom substrate (SMS) and chicken manure (CM)
on the soil characteristics—such as the content of nutrients, water, and organic carbon—
were cumulative compared to control soil (CS). Similar effects were observed with the
application of biochar [43,44].
4.2. Effects of Organic Additives on Soil Fungal Abundance
To the best of our knowledge, this is the first such comprehensive report concern-
ing changes in soil fungal community abundance and diversity as a result of the spent
mushroom substrate and chicken manure treatment. Different molecular tools—including
qPCR, DGGE, t-RFLP and NGS—were used to investigate the exogenous organic matter’s
(SMS, CM) effects on fungal communities. In order to obtain the complex responses of
the fungal community to the application of the exogenous organic matter into the soil, we
decided to combine a quantitative approach (qPCR) widely applied in microbial ecology to
quantify the abundance of fungal gene markers within the environment [45], old-school
reliable techniques for the screening of the diversity of fungal community and shifts and
pattern changes (DGGE, t-RFLP) [16,46], tools for the identification of fungi based on
T-RFs size (TRiFLe) [17], and high throughput sequencing, which provides insight into the
soil fungal community structure, composition and functional guilds, and is a useful and
effective approach for the characterization of the microbial communities [18,47]. Although,
in the last three years, many papers concerning changes in the fungal community were
published [14,40,41,48,49], to date, no-one else has tested organic waste such as spent
mushroom substrate and chicken manure. Moreover, the evaluation of the fungal commu-Agronomy 2021, 11, 410 18 of 24
nity changes under the influence of different factors is relevant and important, but it has
not yet been explained to a satisfactory extent. In this study, the soil fungal abundance
increased with SMS and CM treatment; this result is consistent with a study showing that
the application of organic matter promoted soil fungal growth [40,48,50]. The explanation
for the increasing fungal abundance after SMS and CM treatment may be related to the
changes in the soil environment caused by the addition of exogenous organic matter [40];
this may improve soil water retention, bulk density, and soil porosity, and may increase
water repellence [51,52], pH, nutrient and moisture contents [40], and therefore provide a
better habitat for soil microorganisms [53,54].
4.3. Effects of the Organic Additives on the Soil Fungal Community Structure
Enhancing the level of understanding of the soil fungal community structure after
the organic matter application is very important because these organisms constitute a
significant part of the biodiversity and biomass in soils, and they also play an essential
role in soil processes connected with the functioning of the ecosystem [55]. Most of the
current knowledge concerning microbial diversity in the soil is related to bacteria; therefore,
the information concerning fungal communities in soils is fragmentary and still needs to
be improved.
The fungal community structure in arable and forest soils was also previously deter-
mined using pyrosequencing [56] and MiSeq [41] methods. In the present study, Ascomy-
cota, Basidiomycota and Mortierellomycota were the top three phyla occurring in all of
the treatments tested. This corresponded to the previous studies concerning agricultural
soils [41,57,58] and forest soil [59], in which Ascomycota and Basidiomycota were the two
most abundant phyla. Ascomycota accounts for approximately 75% of all of the fungi
described. Several of them were classified as litter decomposers, plant, animal, or human
pathogens, endophytes and saprotrophs [55], as well as many Ascomycota representatives,
which are also symbionts for plants [59,60]. However, Basidiomycota includes some of the
most familiar fungi that are widely known for the production of large fruit bodies, as well
as fungi that are plant parasites, cause wood decay, and are litter decomposers. This group
may be helpful to plants due to their symbiotic relationship with plant roots and their
role in improving the storage of water, minerals, and metabolites [61]. Mortierellomycota
was another phylum identified in all of the soil treatments, but with a lower abundance
compared to Ascomycota and Basidiomycota. Fungi from this phylum are commonly
found in various environments, and are found in the bulk soil, the rhizosphere, and plant
tissues; therefore, they play a very important role in the carbon cycle and organic matter
decomposition. They are also known as plant growth-promoting fungi [62]. In contrast
to our results, in Amazon farmland, the other phyla were most abundant, rather than
Ascomycota [63], but the results were based on other markers than ITS1. In our study, the
relative abundance of Glomeromycota was lower in the tested soil treatments than in the
studies of other researchers [49,64]. However, it is worth stressing that although the internal
transcribed spacer (ITS) region is the accepted DNA barcode of fungi [65], Glomeromycota,
being the most widespread fungal symbionts of plants [66], are better characterized by
alternative markers, such as the 18S rRNA region specific to arbuscular mycorrhizal fungi
(AMF) [67]. Therefore, that Glomeromycota is probably underrepresented in our dataset
targeting the ITS1 region. Moreover, because only 30–35% of Glomeromycetes are present
in databases [68], perhaps the majority of AMF are not identifiable from environmental
samples [67].
Ectomycorrhizal fungi usually dominate the forest soil [69]. Tremellomycetes and
Dothideomycetes were the dominant fungal classes in forest soils [70], whereas Sordar-
iomycetes and Dothideomycetes are the most abundant classes in agricultural soil [41].
In the present study, Sordariomycetes, Tremellomycetes, Mortierellomycetes and Euro-
tiomycetes were dominant for all of the soil treatments (SMS, CM, CS). As reported by [71],
Sordariomycetes increased with N’s addition to the soil. Moreover, [41] observed an in-
crease in this class of fungi after the incorporation of inorganic fertilizer and manure. TheseAgronomy 2021, 11, 410 19 of 24
observations may explain the highest abundance of Sordariomycetes in all of the tested
treatments, in the control soil with mineral fertilization, and in the treatments with chicken
manure and spent mushroom substrate in our study.
The most evident differences in the fungal community were the higher relative abun-
dance of the Tremellomycetes and Pezizomycetes classes after the application of SMS
and Mortierellomycetes, Leotiomycetes and Agaricomycetes following CM treatment.
Tremellomycetes are a nutritionally heterogeneous group that includes saprotrophs, animal
parasites and the fungicolous species of yeasts [61,72]. Whereas, most Pezizomycetes are
saprotrophic species with the ability to degrade the components of plant cell walls and
play an important role in organic matter decomposition [69]. Therefore, an increase in the
relative abundance of this class in SMS-amended soil may be stimulated by an increase in
the level of appropriate substrates for degradation after the addition of organic additives
to the soil and mobilization of nutrients from organic substrates. That is a way, they may
benefit plant growth [49]. The Mortierellomycetes class, stimulated by the application
of CM, includes both saprobes and root endophytes [73]. Nevertheless, those fungi, as
soil-inhabiting saprobic organisms, participate in the decomposition of organic matter.
Many species possess the ability to accelerate the organic compound transformation and
fatty acids production [74]. Moreover, it was found that Mortierellales representatives
increased in treatments fertilized with phosphorus biofertilizer [75]. The class of fungi
which decreased after SMS and CM addition to the soil was Dothideomycetes, which is
involved in the decay of cell walls [14] and is important in biomass degradation, and as the
saprophyte is engaged in carbon cycling [76]. However, representatives of this class infect
almost every major crop [77], and the class includes important fungal pathogens of plant
involved in the production of food, feed, fiber and biofuel [78].
Although the application of organic matter decreases the degree of antagonism and
mutualism in the soil [79], it can also stimulate the growth of fungi important to maintain
the ecological functions of soil and the health of ecosystems. The relative abundance of
Chrysosporium, Ascobolus, Fusarium, Solicoccozyma and Mortierella was dominant for the
CM treatment, whereas for SMS treated soil Chrysosporium, Humicola, Solicoccozyma and
Mortierella prevailed. Moreover, we found that the abundance of Humicola and Apodus
increased as a consequence of both SMS and CM treatments. These findings suggest that
these organisms were very sensitive to the addition of SMS and CM. Some of these fungi are
known to be potentially pathogenic for plants and can cause a reduction in plant growth, as
well as they can participate in decomposition processes serving one of the most important
ecological roles of fungi [49,60].
It is worth to mention that a high relative abundance of Trichoderma was observed
in CM-treated soil based on t-RFs fragments and OTUs sequences in both t-RFLP and
NGS molecular approaches. Moreover, both these molecular techniques confirmed the
presence of the most abundant Metarhizium representatives in control soil. Therefore,
molecular approaches, especially metagenomics, were an effective and sensitive tool for
fungal community characterization of soil enriched with chicken manure and spent mush-
room substrate providing comparative results concerning diversity indices and mycobiota
composition across the treatments. Obtained results are important in the context of agricul-
ture management including organic farming, due to relationships and communication of
microbes in the soil environment. As it was previously underlined, core microbiota is a
part of microbiome study, important for understanding stability, plasticity and functioning
across complex microbial assemblages [80].
4.4. Effects of Organic Additives on Soil-Borne Pathogens and Functional Guild Groups
The application of organic additives was proposed as a strategy for the control of
diseases caused by soil-borne pathogens [41]. One of the most noteworthy findings in this
study is the observation of a decrease in the relative abundance of Metarhizium, Acremonium
and some fungi belonging to the Leotiomycetes class with the addition of SMS and CM.
Many species of Metarhizium are entomopathogenic fungi [81]. However, AcremoniumAgronomy 2021, 11, 410 20 of 24
belonging to the Ascomycota phylum is also a common soil fungus, which can also grow
on decaying wood or tree bark. Many species from this genus are known to plant pathogens
and cause plant diseases [82]. Leotiomycetes are ecologically diverse and include plant
pathogens [73]. Our findings suggest that the long-term SMS and CM treatment decreases
the population of entomopathogenic and some soil-borne plant pathogenic fungi, and may
suppress crop disease occurrence. However, to the best of our knowledge, this is the first
direct evidence that the population of some soil-borne plant pathogenic fungi is decreased
by SMS and CM treatment, based on a next generation sequencing method and further
studies is required.
Although the positive impact of the spent mushroom substrate and chicken manure
on the reduction of some soil-borne fungal pathogens has been confirmed, the relative
abundance of Fusarium, containing many crop pathogen species [83], was at the same level
for all of the treatments tested. However, it is necessary to underline that Fusarium genus
does not only comprise plant pathogenic species but also nonpathogenic symbiotrophs [84],
and can also contain plant promoting species [85]. Our findings suggest that the appli-
cation of SMS and CM reduced the relative abundance of some potentially pathogenic
fungi such as Gibberella zeae, Mycosphaerella tassiana, Leptosphaeria sp., Slopeiomyces cylin-
drosporus, Sporothrix inflata and Exophiala equina and caused an increase in the abundance of
Cephalotrichum stemonitis and Penicillium aurantiogriseum, which are plant pathogens. There-
fore, in this context the effect of the waste exogenous organic matter used is ambiguous and
requires further research. However, it is worth to mention that a trend in phytopathogens
reduction in soil microbial community after SMS application was visible, therefore this
type of exogenous organic matter could be considered as a carrier for biopreparations
in agroecology.
5. Conclusions
The study demonstrated that long-term (20 years) spent mushroom substrate (SMS)
and chicken manure (CM) treatment increased soil fungal abundance and changed the
fungal community structure at the genus and species level, but not completely at the
phylum level. It was found that SMS and CM addition decreased the relative abundance of
several OTUs of potential crop pathogens.
In addition, the changes in the soil fungal community abundance were related to the
total soil organic carbon and labile organic carbon contents, which suggests that the long-
term influence of exogenous organic matter (SMS, CM) on the soil fungal community was
directly and indirectly affected by organic impact and soil property changes, respectively.
This study also provides more insights into the response of the soil fungal community
composition to different types of organic matter addition, which should prove helpful in
managing the soil mycobiome for sustainable agricultural productivity. The molecular
approaches allowed for a description of fungal diversity and community composition,
as well as functional guild group occurrence in response to the long-term application of
spent mushroom substrate and chicken manure. However, further research, including a
consideration of the methodical aspect of throughput sequencing methods, is still required
in order to identify the unknown portion of the as-yet unidentified fungi occurring in the
soil environment.
Supplementary Materials: The following are available online at https://www.mdpi.com/2073-439
5/11/3/410/s1, Figure S1: The map showing the location of the treatments and the distance between
fields. SMS–spent mushroom substrate; CM–chicken manure; CS–control soil. https://umap.
openstreetmap.fr/pl/map/cs-sms-cm_550327 (accessed on 19 February 2021). Map created with
uMap https://umap.openstreetmap.fr/ (accessed on 19 February 2021), Figure S2: The amplification
plot (A) and the melting curve (B) of the standard and negative template control obtained from the
quantification of the fungal abundance. The blue circle underlines the negative template control
(NTC), Figure S3: The example of a gel picture showing the PCR-products ranged from ~500 bp
to ~700 bp, that were used for nested PCR to obtain amplicons for DGGE analysis. SMS–spent
mushroom substrate; CM–chicken manure; CS–control soil, M–DNA marker used as weight standardYou can also read