White-tailed Deer (Odocoileus virginianus) Density and Habitat Use on the Beaver Island Archipelago Using a Camera Trap Array - Michigan Natural ...
←
→
Page content transcription
If your browser does not render page correctly, please read the page content below
White-tailed Deer (Odocoileus virginianus) Density and Habitat Use on
      the Beaver Island Archipelago Using a Camera Trap Array

                                                   Does/mi2

                                   Prepared by:
                                  Clay M. Wilton
                        Michigan Natural Features Inventory
                                  P.O. Box 13036
                              Lansing, MI 48901-3036

                                           For:
                     Little Traverse Bay Bands of Odawa Indians
                   Natural Resources Department; C/O Bill Parsons
                                     April 27, 2021

                                Report No. 2021-05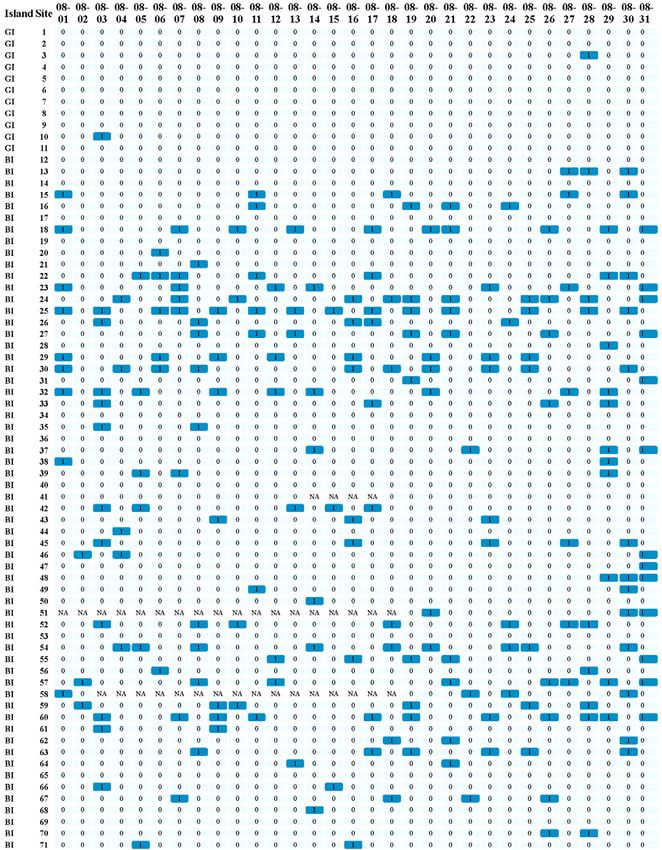
Acknowledgments
We thank the Little Traverse Bay Bands of Odawa Indians (LTBB) for financial and logistical support during this
survey. LTBB Odawa Natural Resources Department staff were instrumental in the success of field operations
and logistical support, including Maxwell Field, Kevin Haynes, Archie Kiogima Jr., Noah Jansen, and Bill Parsons.
We thank Jennifer Kleitch (Michigan Department of Natural Resources) for logistical support. We are grateful
to the many Beaver Island residents who were kind enough to allow us access to their property and Ryan
Fogg, Pamela Grassmick, and Bill McDonough for donating their time and resources to our field efforts; their
collective support made this project possible. We also thank the Central Michigan University Biological Station,
Little Traverse Conservancy, Port St. James Association, St. James Township, and Peaine Township for granting
access to their properties. Many thanks to Pat Bills and the Michigan State University High Performance
Computing Center for making it possible to rapidly classify an overwhelming amount of camera trap images.
Tyler Petroelje (SUNY ESF) provided insightful conversations and assistance with study design and data analysis,
as well as many helpful comments that greatly improved this report. We thank Brian Klatt, Michael Monfils,
and Ashley Adkins for continued scientific and logistical support at MNFI throughout this project.

Suggested Citation:
Wilton, C.M. 2021. White-tailed Deer (Odocoileus virginianus) Density and Habitat Use on the Beaver Island Archipelago
Using a Camera Trap Array. Michigan Natural Features Inventory Report Number 2021-05, Lansing, MI. pp. 39.
Cover Photo: White-tailed deer (Odocoileus virginianus) photographed on remote camera traps during this survey.
Copyright 2021 Michigan State University Board of Trustees. Michigan State University Extension programs and materials
are open to all without regard to race, color, natural origin, gender, religion, age, disability, political beliefs, sexual
orientation, marital status, or family status.
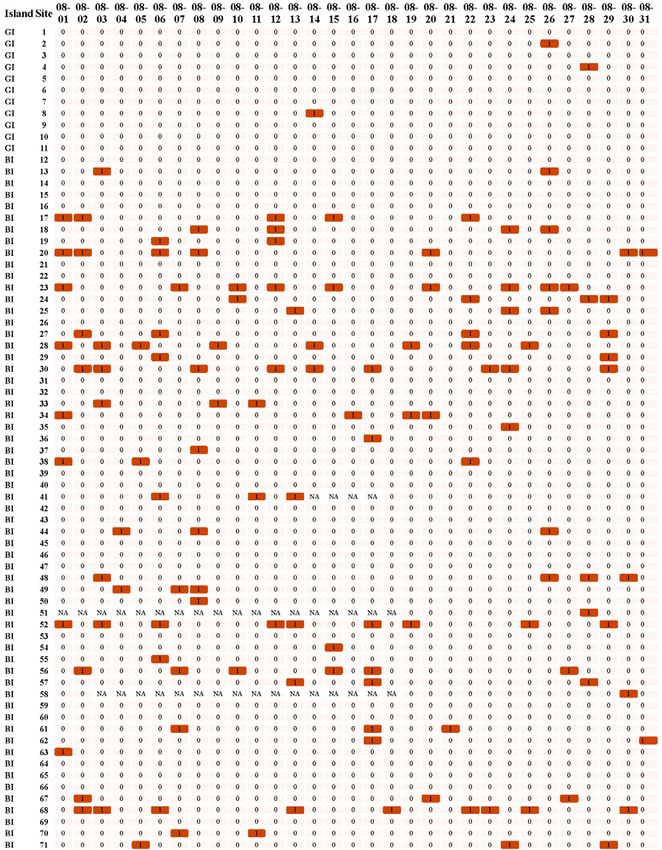
Table of Contents
Abstract . . . . . . . . . . . . . . . . . . . . . . . . . . . . . . . . . . . . . . . . . . . . . . . . . . . . . . . . . . . . . . . . . . . . . . . . . . . . . . . . 1
Introduction . . . . . . . . . . . . . . . . . . . . . . . . . . . . . . . . . . . . . . . . . . . . . . . . . . . . . . . . . . . . . . . . . . . . . . . . . . . 2
Methods . . . . . . . . . . . . . . . . . . . . . . . . . . . . . . . . . . . . . . . . . . . . . . . . . . . . . . . . . . . . . . . . . . . . . . . . . . . . . . . . 3
Study Area. . . . . . . . . . . . . . . . . . . . . . . . . . . . . . . . . . . . . . . . . . . . . . . . . . . . . . . . . . . . . . . . . . . . . . . . . . . . . . . . .3
Sampling Design. . . . . . . . . . . . . . . . . . . . . . . . . . . . . . . . . . . . . . . . . . . . . . . . . . . . . . . . . . . . . . . . . . . . . . . . . . . .5
Field Sampling . . . . . . . . . . . . . . . . . . . . . . . . . . . . . . . . . . . . . . . . . . . . . . . . . . . . . . . . . . . . . . . . . . . . . . . . . . . . .5
Image Processing. . . . . . . . . . . . . . . . . . . . . . . . . . . . . . . . . . . . . . . . . . . . . . . . . . . . . . . . . . . . . . . . . . . . . . . . . . .7
Abundance Modeling. . . . . . . . . . . . . . . . . . . . . . . . . . . . . . . . . . . . . . . . . . . . . . . . . . . . . . . . . . . . . . . . . . . . . . . .7
Results. . . . . . . . . . . . . . . . . . . . . . . . . . . . . . . . . . . . . . . . . . . . . . . . . . . . . . . . . . . . . . . . . . . . . . . . . . . . . . . . . . 9
Field Sampling . . . . . . . . . . . . . . . . . . . . . . . . . . . . . . . . . . . . . . . . . . . . . . . . . . . . . . . . . . . . . . . . . . . . . . . . . . . . .9
Image Processing. . . . . . . . . . . . . . . . . . . . . . . . . . . . . . . . . . . . . . . . . . . . . . . . . . . . . . . . . . . . . . . . . . . . . . . . . .10
Abundance Modeling. . . . . . . . . . . . . . . . . . . . . . . . . . . . . . . . . . . . . . . . . . . . . . . . . . . . . . . . . . . . . . . . . . . . . . .13
Discussion . . . . . . . . . . . . . . . . . . . . . . . . . . . . . . . . . . . . . . . . . . . . . . . . . . . . . . . . . . . . . . . . . . . . . . . . . . . . . 20
Conclusions & Recommendations. . . . . . . . . . . . . . . . . . . . . . . . . . . . . . . . . . . . . . . . . . . . . . . . . . . . . . 22
References . . . . . . . . . . . . . . . . . . . . . . . . . . . . . . . . . . . . . . . . . . . . . . . . . . . . . . . . . . . . . . . . . . . . . . . . . . . . . 24
Appendix . . . . . . . . . . . . . . . . . . . . . . . . . . . . . . . . . . . . . . . . . . . . . . . . . . . . . . . . . . . . . . . . . . . . . . . . . . . . . . . 30
I. Camera Setting Protocol. . . . . . . . . . . . . . . . . . . . . . . . . . . . . . . . . . . . . . . . . . . . . . . . . . . . . . . . . . . . . . . . . . .30
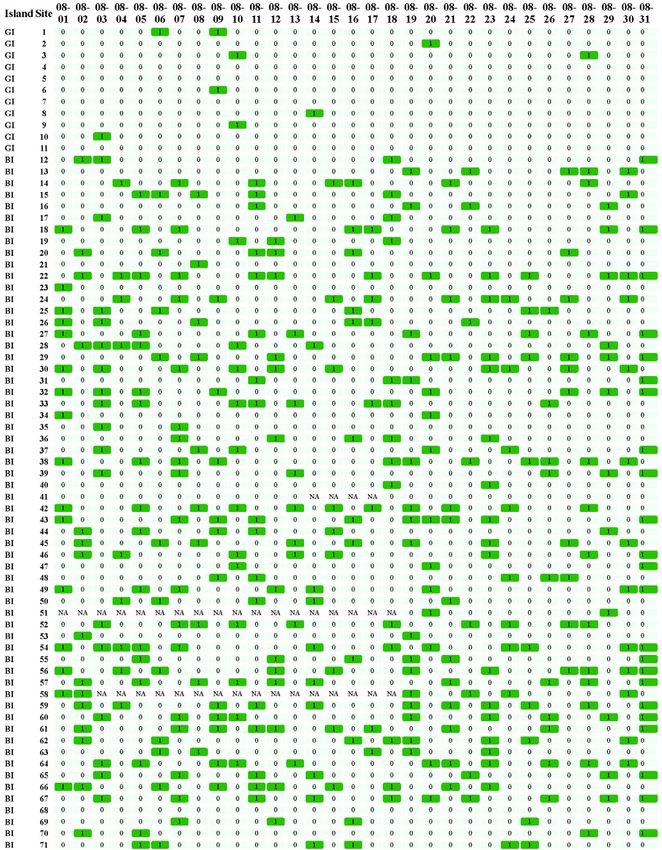
II. Deer Detection Histories . . . . . . . . . . . . . . . . . . . . . . . . . . . . . . . . . . . . . . . . . . . . . . . . . . . . . . . . . . . . . . . . . .34
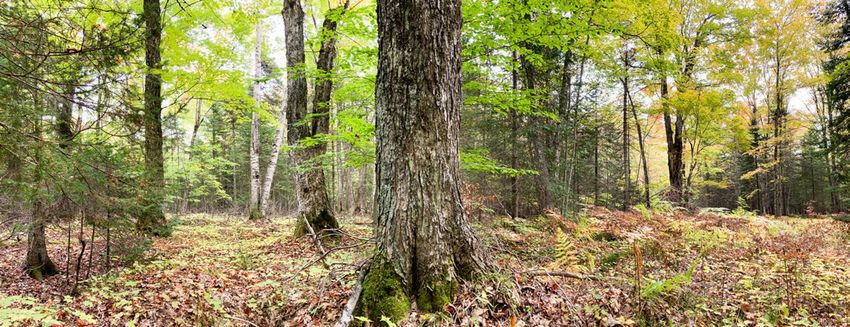
Study area showing upland mixed forest on Beaver Island (left) and boreal forest on Garden Island (right).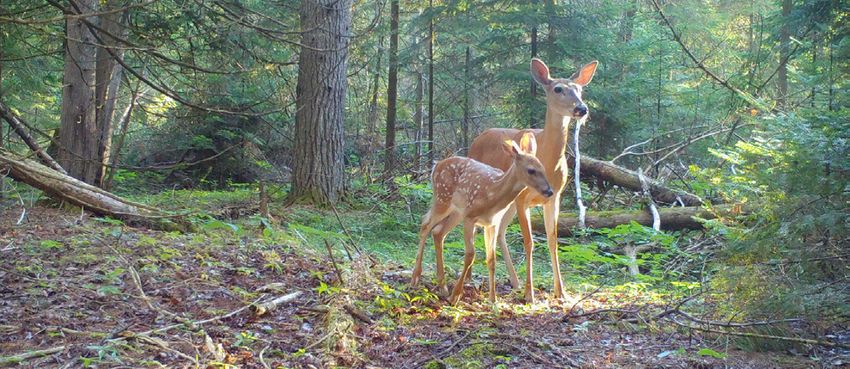
Abstract
White-tailed deer (Odocoileus virginianus) are an adaptable keystone herbivore occurring in nearly every
landscape across Michigan, from densely populated suburbs of the southern Lower Peninsula to the dense
forests of the Upper Peninsula. They simultaneously generate substantial revenue through hunting while
incurring substantial costs through conflict with humans and environmental impacts. Therefore, they make
up an important component of Michigan’s ecological, cultural, social, and economic landscape and present
a unique challenge to natural resource managers tasked with navigating diverse conservation needs and
value systems. Understanding deer abundance and population demographics is important for implementing
effective conservation and management decisions but obtaining reliable estimates of these parameters within
an efficient framework is a critical challenge to their sustainable management. The deer population inhabiting
the Beaver Island Archipelago is of interest to wildlife managers and island residents concerned with the
overall size and health of the deer herd as well as the density dependent ecological effects of deer to the
environment. We used a non-baited camera trap array within an occupancy modeling framework to estimate
habitat-specific deer density and demographic composition in the Beaver Island Archipelago. We deployed
71 (60 on Beaver Island, 11 on Garden Island) passive infrared camera traps during July–October 2020 and
estimated density and sex-age ratios for each island using images collected during August. We also evaluated
the influence of dominant land cover classes on the spatial distribution of deer density within our study area.
Density varied spatially by land cover classes for adult females and adult males, with upland deciduous forest
being the greatest positive predictor of density. However, estimated fawn density was constant across assessed
land cover classes. Overall estimated density on Garden Island (5 deer/mi2 [95% CI = 3–14]) was much lower
than on Beaver Island (32 deer/mi2 [95% CI = 18–53]), with a similar relationship across sex-age classes. Indices
of buck to doe ratios were equivalent (33:100) between Beaver Island and Garden Island, whereas fawn to doe
ratios on Beaver Island were 2.6 times greater than estimated on Garden Island. Although density estimates
appeared to accurately reflect relative abundances within and among islands, estimates also displayed wide
variance. However, application of camera traps substantially reduced effort and financial investment compared
to other more precise but costly survey methods, while simultaneously collecting standardized information
on demographic composition across small and large spatial extents. Our camera trap survey to estimate deer
density on Beaver Island and Garden Island provides a first step toward developing a scientifically informed
and spatially-explicit foundation for understanding the population ecology of white-tailed deer and their
relationship to various conservation and management objectives in a Great Lakes island ecosystem. Obtaining
science-based and cost-effective population trends specific to this Deer Management Unit may be especially
important for natural resource management decision making in an archipelago comprised of diverse and
sometimes conflicting stakeholder interests.

1 | White-tailed deer density and habitat use on the Beaver Island Archipelago. MNFI 2021-05
Introduction
White-tailed deer (Odocoileus virginianus; hereafter deer) are an important component of Michigan’s
ecological, cultural, social, and economic landscape. The Michigan Department of Natural Resources (MDNR)
is tasked with managing the state’s deer population within this diverse and sometimes competing landscape
using sound scientific management principles (MDNR 2016). Understanding deer abundance and population
demographics is important for implementing effective conservation and management decisions. The deer
population inhabiting the Beaver Island Archipelago is of interest to wildlife managers and island residents
concerned with the overall size and health of the deer herd as well as the density dependent ecological
effects of deer to the environment (MDNR 2017). Therefore, deer management objectives on Beaver Island
encompass two primary goals: 1) impact management and 2) hunting opportunities (MDNR 2015). Impact
management broadly includes actions that reduce the negative effects imposed by deer populations, including
degradation of plant communities and forest management operations, disease transmission, and conflicts
between humans and deer. Hunting opportunities incorporate the promotion of deer hunting as an important
social and cultural activity that is used as the primary tool to reach population targets, including those related
to impact management (MDNR 2016).
Deer are generalist herbivores that inhabit nearly every available land cover type throughout Michigan (Ozoga
et al. 1994, Hiller et al. 2008, Duquette et al. 2015, MDNR 2017, Petroelje et al. 2021). The negative effects of
deer populations on natural community dynamics (Goetsch et al. 2011, Nuttle et al. 2014, Habeck and Schultz
2015), as well as on the effectiveness of forest management (Parker et al. 2020, Walters et al. 2020) have been
well documented in the scientific literature and throughout the Great Lakes region specifically (King 1970, Case
and McCullough 1987, Fisichelli et al. 2013, Hummel et al. 2018). Comparison between historical and modern
surveys of vegetation composition within the Beaver Island Archipelago implicate deer browse pressure in
the degradation of several natural community types (Bartlett 1938, Cohen 2017) and overall biodiversity loss
(King 1970, Soule 1993). However, the relationship between deer density and deer browse impacts to plant
community composition and successional dynamics depends on numerous interacting factors, including
landscape composition, land-use history, legacy effects of deer browse and forest management, species-
specific browse sensitivity, and nonlinear mechanisms functioning over gradients of deer density (Horsley et al.
2003, Nuttle et al. 2011, Royo et al. 2017, Russell et al. 2017).
Although some evidence suggests deer occurred within the
Beaver Island Archipelago prior to the twentieth century
(Andrews 2012), there was no documented population
within the Beaver Island group until 1927 when 17 deer (3
male, 14 female) were translocated to Beaver Island by the
Department of Conservation and an island resident (Bartlett
1938). Following 10 years of sustained population growth,
the first hunting season was opened in 1938, with ≤750 deer
reported on the island. Deer forage and habitat was reported
as plentiful because of logging activity and fires occurring
prior to 1900 in the southern region of the island that created
abundant hardwood regeneration. Bartlett (1938) also noted
large areas of lowland conifer forests with abundant ground-
hemlock (Taxus canadensis) showing little evidence of deer
browse. Within the Beaver Island Archipelago, deer are only
known to occur on Beaver, Garden and South Fox islands
(MDNR 2017). The most recent known survey to estimate
deer density on Beaver Island indicated about 27 deer/
mi2 (Duvendeck 1958). Current management of the islands
comprising the archipelago have since broadened scope to

                         White-tailed deer density and habitat use on the Beaver Island Archipelago. MNFI 2021-05 | 2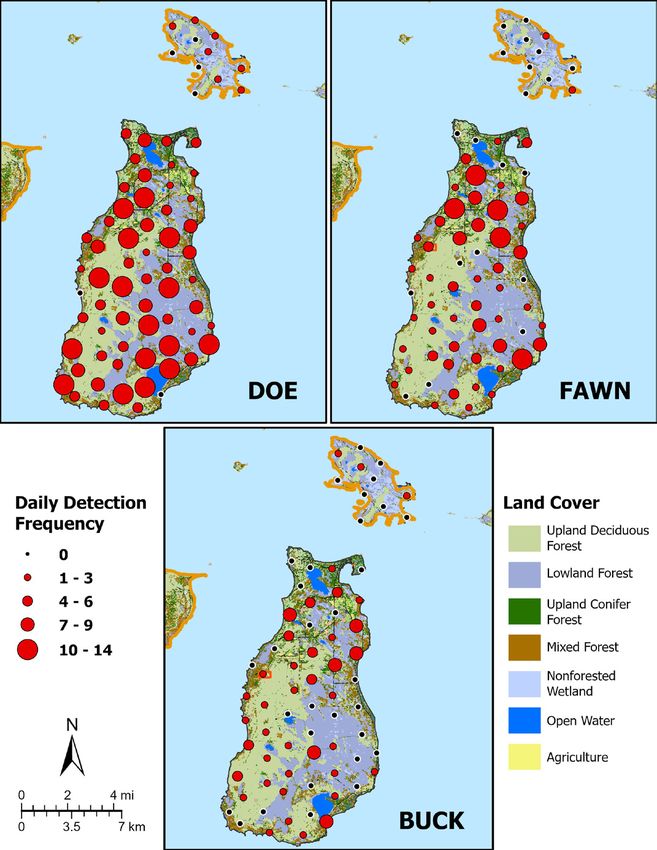
incorporate and emphasize diverse interests in addition to game species management, including rare species
and natural community conservation, wildlife habitat management, outdoor recreation, and historic and
cultural preservation (MDNR 2017).
A key component of deer management in Michigan is the application of sound science-based methods to
inform decision making (MDNR 2016). Accurate estimates of population abundance and growth, achieved
within an efficient framework, are integral to the sustainable management of deer and conservation of the
environments they inhabit. However, these parameters are difficult to reliably estimate at the landscape
scales necessary for effective management (Found and Patterson 2020). Numerous methods to estimate
deer population size across a range of spatial scales and for diverse objectives have been applied throughout
Michigan over the years (MDNR 2010). Methods have advanced considerably since the first effort to obtain
a deer census was done in 1928 by the Department of Conservation (Bartlett 1939), including pellet group
surveys to estimate regional deer density (Mayhew 2003), Sex-Age-Kill (SAK) models to reconstruct pre-
harvest population size (Eberhardt 1960), and a variety of other direct and indirect survey methods (MDNR
2010). Several of these methods have been abandoned due to biases in methodology (Cook 2001) as well as
a paradigm shift towards a desire to emphasize general deer population trends and the relationships between
relative deer densities and their impacts on herd condition, the environment, and people (MDNR 2016).
Recent advancements in survey technologies and
statistical modeling have generated new methods for
assessing these complex relationships. Camera traps
are increasingly being used to collect large-scale data
on a variety of population parameters of interest to
applied wildlife management and research (Burton
et al. 2015). Moreover, a suite of statistical models
exist that leverage such data in a flexible framework
for explicitly testing relationships between animal
abundance and the environment (Kery and Royle
2016). This approach has been tested and applied to
the estimation of deer density and demographics in
the Upper Peninsula, Michigan (Duquette et al. 2014,
Kautz et al. 2019, Petroelje et al. 2020). We applied and adapted this methodology to estimate deer density
and demographic composition in the Beaver Island Archipelago. Our specific objectives were to: (1) estimate
habitat-specific deer density on Beaver Island and Garden Island from detection/non-detection camera trap
data using a binomial-mixture model, (2) estimate an index of buck:doe and fawn:doe ratios derived from
camera trap detection rates, and (3) provide these estimates as baseline information to wildlife biologists,
natural resource managers, and other stakeholders of the archipelago.
Methods
Study Area
The Beaver Island Archipelago (Amikwaganda) is located in northern Lake Michigan, Charlevoix and Leelanau
Counties, Michigan about 19 miles from the nearest shoreline in the Northern Lower Peninsula (Beaver
Island to mainland) and about 11 miles from the nearest shoreline in the Upper Peninsula (Garden Island
to mainland). The archipelago consists of 14 islands ranging from < 1 to 145 km2 and other unidentified
islands < 1 km2 (Figure 1). The State of Michigan owns about 101 km2 of land across the archipelago, which is
administered by the DNR Wildlife Division and designated within the Beaver Islands State Wildlife Research
Area (MDNR 2017).
The archipelago has a rich and complex history of human use and occupation by various Native American
peoples and European settlers (Anthony 2009). The archipelago was first occupied by Native American
peoples ≤ 10,000 years ago (Shott 1999), including occupation initially by the Amikwa and later by bands
3 | White-tailed deer density and habitat use on the Beaver Island Archipelago. MNFI 2021-05
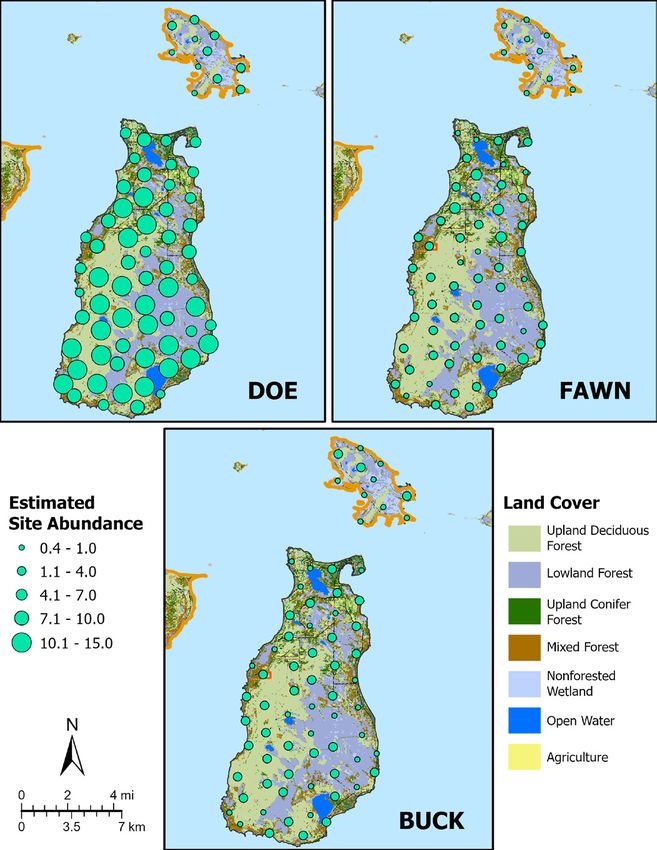
Figure 1. Beaver Island Archipelago in northern Lake Michigan showing primary land ownerships and road
infrastructure.
belonging primarily to the Chippewa and Odawa Tribes since recordkeeping began in the early seventeenth
century (Anthony 2009, Andrews 2012). Europeans began establishing permanent settlements during the mid-
nineteenth century, leading to the disruption, translocation, and resettlement of the Native Americans residing
on Beaver (Waquaong), Garden (Taganing), and High (Nezewebagon) Islands (Andrews 2012). Following the
Treaty of Detroit 1855, Garden and High Islands were incorporated within the Little Traverse Bay Bands of
Odawa Indians (LTBB) Reservation (Figure 1).
Beaver Island is the largest island in the archipelago at 145 km2 (56 mi2) and is the only island with a
permanent population (577 residents, 7.9 people/mi2; U.S. Census Bureau 2019), concentrated in the northern
third of the island. Land ownership is divided primarily between state-owned and private properties, with
about 33% of the land area administered by the MDNR Wildlife Division within the Mackinaw State Forest and
concentrated in the southern half of the island (Figure 1). State forest lands on Beaver Island are managed for
various objectives, including wildlife habitat maintenance, timber management, hunting opportunities, and
non-consumptive recreation (e.g., hiking, birding) (MDNR 2013). The remaining land ownerships are held by
various county and local departments, tribal governments (LTBB, Grand Traverse Band of Ottawa and Chippewa
Indians), Central Michigan University, and non-governmental organizations (e.g., Little Traverse Conservancy)
(Figure 1). Beaver Island is characterized by flat topography overall, with steep dune topography scattered
along the shoreline. About 84% of the island is forested, with 56% in upland forest and 28% in lowland forest
(Table 1, Figure 2). Upland forests are characterized by a dominance of northern hardwoods (Acer saccharum,

                         White-tailed deer density and habitat use on the Beaver Island Archipelago. MNFI 2021-05 | 4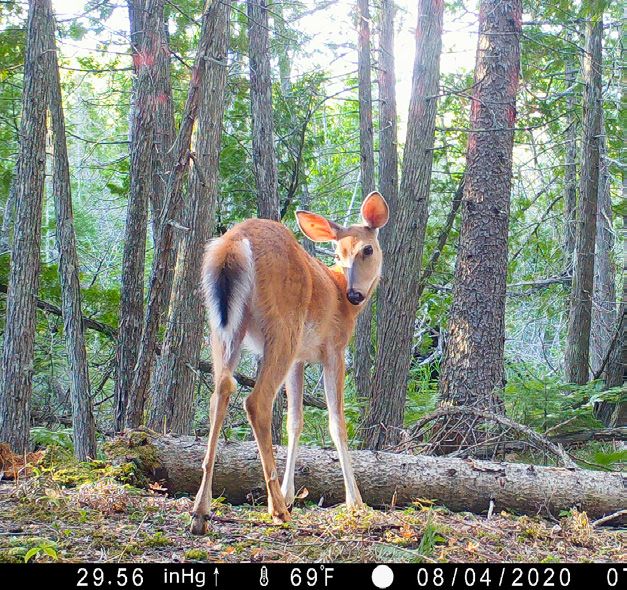
Table 1. Land cover classification in acres and percent of
total island area (source: LANDFIRE; Rollins 2009).
                              Beaver         Garden
 Land Cover                               %               %
                              Island         Island
 Upland Deciduous Forest      14,101.4    38 900.3        20
 Lowland Forest               10,439.9    28 1,634.8      36
 Mixed Forest                 3,544.5     10 371.2        8
 Developed                    3,146.4     9 -             0
 Upland Conifer Forest        3,065.7     8 194.8         4
 Open Water                   1,158.2     3 157.2         3
 Other Nonforested            709.2       2 72.1          2
 Nonforested Wetland          584.7       2 1,201.6       27
 Agriculture                  184.4       0 0.7           0

Fagus grandifolia), intermixed with A. rubrum, Betula papyrifera, Fraxinus spp, Pinus spp, Populus spp, Tsuga
canadensis, and Quercus spp. Lowland forests are dominated by a mix of conifer (Thuja occidentalis, Abies
balsamea, Picea spp), and deciduous (A. rubrum, Fraxinus spp, Populus spp) tree species.
Garden Island is the second largest island in the archipelago at 18 km2 (7 mi2) and is about 2.1 km (1.3 miles)
north of Beaver Island from their nearest shorelines (Figure 1). About 98% of the island is state-owned land
administered by the Wildlife Division and occurs within the 1855 LTBB Reservation. Forests cover about 68%
of the island and occur on mostly flat to rolling topography with about 36% of the land cover residing in
lowland forest, 32% in upland forest, and 27% in nonforested wetlands (Table 1, Figure 2). Lowland forests
are characterized by high-quality boreal forest and rich conifer swamp, with Thuja occidentalis dominating
the canopy and overstory associates including A. balsamea, B. papyrifera, Picea glauca, Populus tremuloides,
and Pinus strobus. Upland forests are characterized by high-quality mesic northern forest, with A. saccharum
dominating the canopy and associates including Quercus rubra, Betula alleghaniensis, B. papyrifera, and
Fraxinus americana (Cohen 2017). Numerous rare plant and animal species have also been documented
throughout Garden Island (Higman et al. 2012). The diversity of high-quality natural communities and rare
species documented on Garden Island underscore the ecological and cultural value of this island to the
archipelago.

Sampling Design
We used ArcGIS Pro (ESRI 2020) to establish a 3-km2 hexagonal grid over the study area to allocate survey
effort randomly and evenly over the landscape. We then selected grid cells intersecting with Beaver Island
or Garden Island, resulting in 60 and 11 grid cells per island, respectively (Figure 2). The geographic center
of each randomly derived grid cell served as an initial location for selecting camera trap placement, with one
camera trap per grid cell. This design ensured that a minimum distance of 1.6 km (1.0 mile) was maintained
between nearest neighbor sites. This distance was large enough to contain an average doe 95% circular home
range (1-km2 [0.4-mi2]; Kautz et al. 2019), thereby minimizing the potential for detecting the same deer at
multiple camera trap sites during the survey period. Meeting this assumption of site independence is critical
for minimizing bias in parameter estimates (Royle and Nichols 2003).

Field Sampling
We deployed 71 (60 on Beaver Island, 11 on Garden Island) passive infrared camera traps (Browning Spec-
Ops Advantage, model BTC-8A, Birmingham, Alabama, USA) at non-baited sites programmed to take 2 photos
per trigger (Rapidfire mode) with a 1-second delay between consecutive triggers. Cameras were set on both
publicly and privately owned lands (Figure 2). We deployed cameras during 13–31 July 2020 and retrieved all

5 | White-tailed deer density and habitat use on the Beaver Island Archipelago. MNFI 2021-05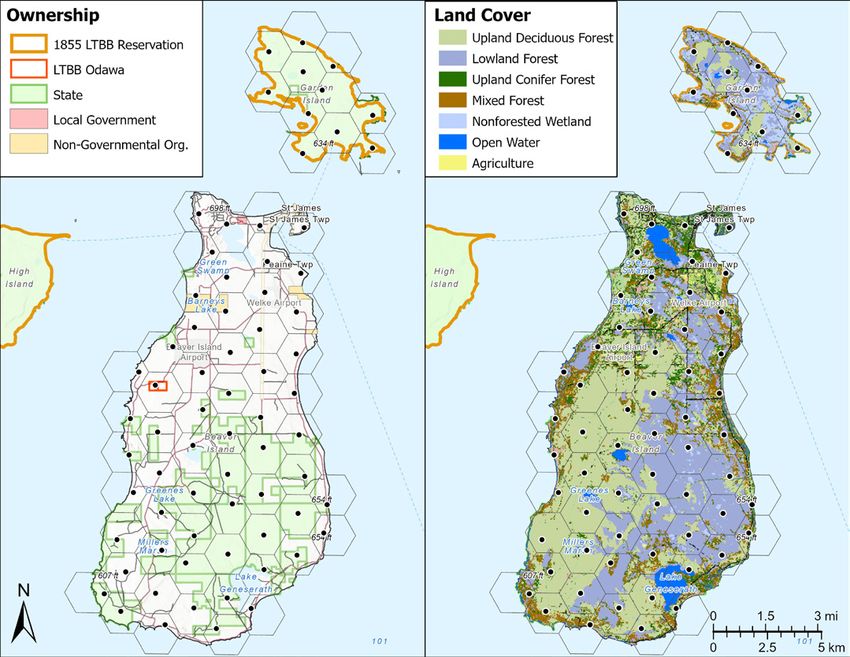
Figure 2. Camera trap sites (black circles) in relation to land ownership (left panel) and land cover (right panel).

cameras during 05–08 October 2020. We revisited camera sites during 17–20 August 2020 to replace memory
cards, change batteries, and maintain proper camera operation.
Within a 100-meter radius of the initial random location in each cell, we searched until a location having a
suitable field of view to allow deer to be photographed was found. Camera site selection was further refined
by aiming the camera’s detection zone towards available fine-scale features that may facilitate deer movement
and detection (e.g., game trail, ORV trail, topographic features) (McCoy et al. 2011). If the initial random
camera location was inaccessible, we used the nearest accessible location within the grid cell having the same
or similar land cover type, if possible.
Cameras were mounted about 0.6–1.0 meter above ground to a tree and about 3–5 meters from the target
detection zone. We aimed cameras facing North, if possible, to minimize false triggers caused by exposure to
the sun’s rays. If applicable, we mounted cameras at about a 45-degree angle to linear features (e.g., game
trail) to maximize detection of traveling animals. We trimmed vegetation obstructing the camera’s detection
zone and vegetation that may falsely trigger the camera.
We measured the maximum distance a camera was able to detect a passing animal (Detection Distance)
by setting the camera to Motion Test mode and walking back-and-forth in front of the camera at increasing
distance until the camera was no longer triggered. This metric serves as an index of horizontal vegetation
density or topography that may obstruct a camera’s view and detection probability. We described basic

                          White-tailed deer density and habitat use on the Beaver Island Archipelago. MNFI 2021-05 | 6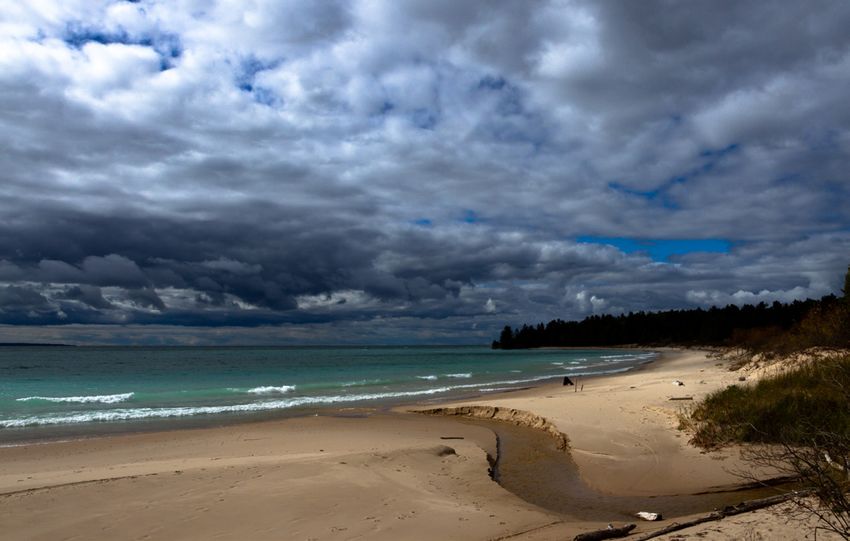
dominant species composition of the canopy and sub-canopy, as well as general characteristics of the
immediate habitat surrounding a camera site to validate against GIS-based land cover layers. We triggered
cameras upon arrival and before leaving each site by holding an informational whiteboard with date, time,
camera ID, visit #, and observer initials. This provided a confirmation of a camera’s operational status and a
basic digital backup of a site’s datasheet (Appendix I).

Image Processing
We downloaded images from memory cards after each camera check and organized images into folders
distinguished by camera site (e.g., BI1 = Beaver Island site 1) and subfolders by camera visit number (e.g.,
“visit1”). This folder structure was designed to facilitate data extraction using package camtrapR (Niedballa et
al. 2016) in RStudio (v. 1.2.5033; R Core Team 2019), which reads images according to this specified structure
and renames each image file with its respective site ID, visit number, date taken, time taken, and image
sequence number (e.g., BI41__visit1__2020-08-07__14-51-19(25)).
We used a two-stage method for filtering and classifying species in camera trap images. The first stage
implemented a coarse filter to detect animal presence (not species) in images. This process leveraged an
open-source generalizable machine-learning model (MegaDetector; Beery et al. 2019) to filter images
into 5 categories based on predicted image content (animal, person, vehicle, multiple, empty), where
“multiple” encompasses images with > 1 detected object of interest. To enable rapid object detection, we
uploaded image files to the Michigan State University High Performance Computing Center and executed the
MegaDetector model using parallel computation over multiple Graphics Processing Unit (GPU) accelerators.
During the second stage we used Adobe Lightroom Classic CC software (hereafter Lightroom; Adobe, San
Jose, CA, USA) to further classify images identified as “animal” or “multiple” by the MegaDetector model. We
also reviewed image classifications in the other three categories (i.e., person, vehicle, empty) to correct any
false negative model predictions. Images containing deer were identified to sex and/or age class (adult male
[hereafter buck], adult female [hereafter doe], juvenile [hereafter fawn]) or “unknown deer” when image
quality precluded demographic classification. We also classified all images of coyote (Canis latrans); all other
non-target animal detections were classified as “other”.
Lightroom utilizes a hierarchical keyword structure that we customized to add species and sex-age
classifications back into the EXIF metadata of each image (e.g., Species > [Coyote, Deer]; SexAge > [Buck,
Doe, Fawn). These keyword tags form the foundation of converting a collection of images into a data set
for statistical analysis. This process is critical for efficient database management and quality control as each
image classification is permanently associated with
the physical image. To facilitate queries of the image
database for users without access to Lightroom, a
species’ common name or sex-age class for deer can be
searched using a computer’s File Explorer (Windows)
search bar. For example, typing ‘Doe’ will filter and
display images tagged with this keyword (this can be
done at any level of the database’s folder structure).
We can also provide subsets of the image database for
any species or species group of interest upon request.

Abundance Modeling
We developed deer detection histories (Appendix II)
by treating each survey day as a replicated sampling
period for each camera trap site in which a deer (doe,
fawn, buck) can either be detected or not detected on

7 | White-tailed deer density and habitat use on the Beaver Island Archipelago. MNFI 2021-05
a given day. Sex and age-specific daily detection rates were used to estimate an index of sex and age ratios for
each surveyed island. We then used each sex-age specific detection history to model abundance and density
for each island during 01–31 August 2020. We estimated deer abundance and density using the Royle-Nichols
occupancy model (Royle and Nichols 2003), which jointly estimates occupancy probability (probability a deer
occurs at a site) and detection probability (the daily probability that a deer at a site will be detected by a
camera trap), where site-level heterogeneity in detection probability is related to heterogeneity in abundance.
To extrapolate estimated site abundances to a meaningful geographic area, we assumed site abundances
reflected the number of deer within a 1-km2 circular buffer around each camera trap site (Keever et al. 2017),
which represents a detection radius equivalent to the average adult female deer home range during August
in the west-central region of the Upper Peninsula, Michigan (Kautz et al. 2019). We then related the resulting
distribution of site-level abundances to deer density by dividing site abundance by 1-km2. We summed site-
level abundances to derive an estimated total abundance for each island, where total abundance relates to the
number of deer within the total area of all 1-km2 buffers on each island (i.e., 60 km2 [23 mi2] on Beaver Island
and 11 km2 [7 mi2] on Garden Island). It is important to note that total abundance estimates do not reflect
total abundance of the entire island area since we cannot infer site-level abundances for areas of the island
beyond the total surveyed area. Although it is possible to extrapolate density estimates to acquire an island-
wide relative abundance estimate, we caution that spatial variation in deer abundance not captured within our
surveyed camera sites may bias results.
We evaluated occupancy covariates to investigate factors influencing the spatial distribution of deer density
within our study area. For each covariate, we used ArcGIS Pro to extract values within each camera site’s
1-km2 deer detection radius. We used LANDFIRE’s Existing Vegetation Type (EVT) classification layer (30-
m2 resolution) to extract all land cover covariates (Rollins 2009) and reclassified 2 focal EVT Group Name
types into an ‘upland deciduous forest’ classification, and 2 EVT Group Name types into a ‘lowland forest’
classification (Table 2). We calculated the proportion of upland deciduous forest (UDF) and lowland forest (LF)
within each camera’s 1-km2 buffer. We included these cover types because they are the most dominant natural
land cover classes in the study area (Table 1) and may be important drivers of seasonal and demographic
variation in abundance (Duquette et al. 2020). We also included island (Island) as a fixed covariate in all models
as we were interested in explicitly measuring variation in parameter estimates between Beaver and Garden
Island. We also evaluated a temporal effect (Week) on deer detection probability to account for possible
weekly (7-day) changes in detection probability during the survey period.
Application of the Royle-Nichols model requires adherence to 3 assumptions: (1) animal detections are
independent, (2) detection probability of a single animal is assumed to be constant across time, and (3)
abundance at a site remains constant throughout the survey period. We minimized violation of the first
assumption by restricting nearest neighbor camera traps to ≥ 1.6 km apart, and the second and third
assumptions by subsetting the survey duration to a period where deer movement rates were presumed to be
at their lowest (i.e., August).
We fit the Royle-Nichols occupancy model to each sex-age specific detection history using function occuRN in
package unmarked (Fiske and Chandler 2011) in RStudio (v. 1.2.5033; R Core Team 2019). We tested support
for all combinations of model covariates, with the ‘Island’ covariate fixed in all models. We based inference on
the top-supported model only for each demographic as extrapolating density estimates across the landscape
based on model-averaged estimates is not supported (Royle and Nichols 2003, Petroelje et al. 2014). We
Table 2. LANDFIRE land cover reclassification used for developing covariates on abundance.
 EVT Group Name (Reclassified)     EVT Group Name                         EVT Subclass
 Lowland Forest                    Atlantic Swamp Forests                 Mixed evergreen-deciduous shrubland
 Lowland Forest                    Peatland Forests                       Mixed evergreen-deciduous shrubland
 Upland Deciduous Forest           Aspen-Birch Forest                     Deciduous closed tree canopy
 Upland Deciduous Forest           Yellow Birch-Sugar Maple Forest        Deciduous closed tree canopy

                         White-tailed deer density and habitat use on the Beaver Island Archipelago. MNFI 2021-05 | 8
examined the significance of each covariate in the top model by determining if the 95% confidence interval (CI) of the beta coefficients overlapped zero (significance = non-overlapping CI). Total abundance and density were derived by summing estimated site abundances for each demographic. We also used the top-supported model for each demographic to extrapolate and map habitat-specific deer density across the entire Beaver and Garden Island landscape (Petroelje et al. 2014, Duquette et al. 2020, Wilton 2020). Results Field Sampling We deployed 71 camera traps for 88 days, resulting in a total survey effort of 5,495 trap nights. Including camera operation failures, average camera deployment period was 77 days (SD = 7.3, range = 49–86 days). Three cameras were not fully operational during deployment; one camera was not operational from 14–17 August due to the memory card filling up from false trigger events, one camera was not operational from 14 July–18 August due to battery failure, and one camera was not operational from 03–18 August due to vandalism (Figure 3). Camera density was 1/2.5 km2 on Beaver Island and 1/1.7 km2 on Garden Island and cameras averaged 1.8 km (SD = 0.3) between nearest neighbor camera sites. Figure 3. Camera trap site operation matrix displaying days when cameras were deployed and operative (gray squares), deployed but inoperative (red squares), and days when cameras were not deployed (white squares) during 13 July – 08 October 2020. To better meet the model assumption that camera sites are independent during the survey duration (see Methods: Abundance Modeling for details), we restricted further analyses to images collected during the month of August (31-day survey period) as this period may coincide with lower overall deer movement rates (Kautz et al. 2019). This subset resulted in a survey effort of 2,095 trap nights. Average camera deployment period during August was 30 days (SD = 2.7, range = 13–31 days). 9 | White-tailed deer density and habitat use on the Beaver Island Archipelago. MNFI 2021-05
Figure 4. Object detection results from image processing using the MegaDetector machine-learning model and
example output showing object class ‘Multple’ that identified a doe and two fawns.

Image Processing
Camera traps collected 227,289 images during the total 88-day survey period, with 220,069 images collected
on Beaver Island and 7,220 on Garden Island. Image processing using the MegaDetector model classified
132,376 images (58%) as “Animal” or “Multiple”. Images classified as “Multiple” typically contained groups of
animals (e.g., doe with fawn(s)) or groups of people). The model classified 89,224 images (39%) as “Empty”.
False triggers were mostly caused by moving vegetation or the interaction of solar radiation and shadow
movement (Iannarilli et al. 2021, Welbourne et al. 2016). Images of people, including project personnel,
comprised 2% of all photos and images of vehicles comprised 0.6% of all photos (Figure 4).
Images collected on Beaver Island during August included 13,138 images of does, 6,004 images of fawns, and
2,653 images of bucks. We detected does at 97% of sites, fawns at 82% of sites, and bucks at 62% of sites. On
Garden Island, we classified 804 images of does, 58 images of fawns, and 216 images of bucks. We detected
does at 64% of sites, fawns at 18% of sites, and bucks at 27% of sites (Figure 5).
Across all sites having doe, fawn, or buck detections, the frequency of daily detections averaged 5.9 (SD = 3.6)
for does, 3.3 (SD = 3.4) for fawns, and 2.0 (SD = 2.6) for bucks (Figure 5). Average number of daily detections
at camera trap sites for does, fawns, and bucks on Beaver Island were 5.9, 18.5, and 5.5 times greater than
on Garden Island, respectively. The total number of sites with deer detections during each day of the August
survey period remained mostly constant, though the number of sites with fawn detections showed a moderate
increasing trend during the last week of August (Figure 6). Doe, fawn, and buck detections were most frequent
just after sunrise (0600 hours) and just before sunset (1900 hours), with the most detections occurring
between 1900 and 2000 hours (Figure 7).
We classified 401 images of coyote at 41 sites (58%) during August, with 37 sites (52%) detecting coyote on
Beaver Island and 4 sites (36%) on Garden Island. Most detections were of single or paired animals, though
we observed 4 individuals at one camera on Garden Island. We detected 16 non-target species grouped into
the “Other” category, including 9 mammals (gray squirrel [Sciurus carolinensis], eastern chipmunk [Tamias
striatus], snowshoe hare [Lepus americanus], deermouse [Peromyscus spp], common raccoon [Procyon lotor],

                        White-tailed deer density and habitat use on the Beaver Island Archipelago. MNFI 2021-05 | 10
Figure 5. The number of daily detections during 01–31 August 2020 for each demographic (doe, fawn, buck) on Beaver Island and Garden Island. 11 | White-tailed deer density and habitat use on the Beaver Island Archipelago. MNFI 2021-05
Figure 6. The number of camera trap sites having at least one detection on a given day (01–31 August 2020)
for each demographic (doe, fawn, buck).

                       White-tailed deer density and habitat use on the Beaver Island Archipelago. MNFI 2021-05 | 12
Figure 7. Diel activity pattern of each demographic (doe, fawn, buck) during 01–31 August 2020 for Beaver and Garden Island. Dashed vertical lines indicate approximate sunrise and sunset times. weasel [Mustela spp], domestic dog [Canis familiaris], domestic cat [Felis catus], domestic goat [Capra hircus] and various birds (wild turkey [Meleagris gallopavo], sandhill crane [Antigone canadensis], ruffed grouse [Bonasa umbellus], merlin [Falco columbarius], great-horned owl [Bubo virginianus], red-tailed hawk [Buteo jamaicensis], common raven [Corvus corax], and other songbirds). Abundance Modeling The top abundance model for does included both the proportion of lowland forest and upland deciduous forest occurring within a camera site’s 1-km2 detection radius and was 1.5 times more supported than the next most supported model that included the same land cover covariates as well as the covariate ‘week’ on detection probability (Table 3). This model suggested greater doe abundance at sites having proportionally greater lowland forest (β = 0.13, SE = 0.07, p-value = 0.06; Figure 8a) or upland deciduous forest (β = 0.23, SE = 0.07, p-value = 0.001; Figure 8b), with significantly (α = 0.05) lower abundance on Garden Island relative to Beaver Island (β = -1.82, SE = 0.39, p-value < 0.001). The top abundance model for fawns included the covariate ‘week’ on detection probability and no land cover covariates on abundance (Table 3). This model suggested significantly lower abundance on Garden Island relative to Beaver Island (β = -2.30, SE = 0.72, p-value = 0.002). The top model was 1.1 times more supported than the next most supported model that included no covariates other than the fixed term for island (i.e., null model). The top abundance model for bucks included the proportion of upland deciduous forest occurring within a camera site’s 1-km2 detection radius and was 1.1 times more supported than the next most supported model that included the same land cover covariates as well as the covariate ‘week’ on detection probability (Table 3). 13 | White-tailed deer density and habitat use on the Beaver Island Archipelago. MNFI 2021-05
Table 3. Model selection results for each demographic (doe, fawn, buck) ranked in order of decreasing AICc
support (delta; green = top supported, yellow = competing [AICc < 2.00], red = not competing [AICc ≥ 2.00]).
Scaled (x̅ = 0, SD = 1) beta coefficients for covariates included in each model, where “p()” indicates covariates on
detection probability and “lam()” indicates covariates on abundance (NA = covariate not included). The co-
variate ‘week’ was used to test if detection probability changed over time. Covariates on abundance included
‘Island’ (Garden Island as reference variable), lowland forest (LF), and upland deciduous forest (UDF). The num-
ber of parameters (df), log likelihood (logLik), Akaike’s Information Criterion (AICc), and model weight (weight)
presented for each tested model.

                        White-tailed deer density and habitat use on the Beaver Island Archipelago. MNFI 2021-05 | 14
a b
Figure 8. Change in predicted doe site abundance as a function of top-supported site covariates, including the
percent of lowland forest (a) and percent of upland deciduous forest (b) within each camera site’s 1-km2 detec-
tion radius. Gray bands represent 95% confidence intervals.
This model suggested greater buck abundance at sites having proportionally greater upland deciduous forest
(β = 0.26, SE = 0.13, p-value = 0.05; Figure 9), with lower abundance on Garden Island relative to Beaver Island
(β = -1.12, SE = 0.61, p-value = 0.07).
Estimated site-level abundances varied greatly within and among sex-age class and island (Figure 10). Mean
doe relative site abundance was 7.6 times greater on Beaver Island (x̅ = 9.1, 95% CI = 5.1–13.9) than on Garden
Island (x̅ = 1.2, 95% CI = 0.6–3.0). This contrast between islands was also evident for fawns, with fawn mean
site abundance being 10.0 times greater on Beaver Island (x̅ = 2.0, 95% CI = 1.1–3.9) than on Garden Island (x̅
= 0.2, 95% CI = 0.2–1.2). Buck mean site abundance was 4.0 times greater on Beaver Island (x̅ = 1.2, 95% CI =
0.7–2.5) than on Garden Island (x̅ = 0.3, 95% CI = 0.3–1.3) (Figure 11).
Overall estimated density on Beaver Island was 32 deer/
mi2 (95% CI = 18–53), with an estimated 742 deer (95%
CI = 415–1,223) within the 23 mi2 total detection radius
area (41% of island area). Similarly, total doe, fawn, and
buck abundances were 546 (95% CI = 306–837), 122
(95% CI = 65–234), and 74 (95% CI = 44–152) (Table 4).
Corresponding doe, fawn, and buck densities were 24/mi2
(95% CI = 13–36), 3/mi2 (95% CI = 2–7), and 5/mi2 (95% CI
= 3–10), respectively. Buck to doe ratios were 33:100 and
fawn to doe ratios were 57:100 on Beaver Island.
Overall estimated density on Garden Island was 5 deer/
mi2 (95% CI = 3–14), with an estimated 20 deer (95%
CI = 12–60) within the 4 mi2 total detection radius area
(57% of island area). Similarly, total doe, fawn, and buck
abundances were 14 (95% CI = 7–33), 2 (95% CI = 2–13),
Figure 9. Change in predicted buck site abun- and 4 (95% CI = 3–14) (Table 4). Corresponding doe,
dance as a function of top-supported site covari- fawn, and buck densities were 3/mi2 (95% CI = 2–8), 0.5/
ates, including the percent of upland deciduous mi2 (95% CI = 0.5–3.1), and 0.9/mi2 (95% CI = 0.7–3.3),
forest within each camera site’s 1-km2 detection respectively. Buck to doe ratios were 33:100 and fawn to
radius. Gray bands represent 95% confidence doe ratios were 20:100 on Garden Island.
intervals.
15 | White-tailed deer density and habitat use on the Beaver Island Archipelago. MNFI 2021-05Figure 10. Estimated mean site-level abundances for each demographic (doe, fawn, buck) in relation to land
cover classifications for Beaver Island and Garden Island during 01–31 August 2020.
White-tailed deer density and habitat use on the Beaver Island Archipelago. MNFI 2021-05 | 16Predicted habitat-specific density of does estimated greatest abundance in the western half of Beaver Island where the largest contiguous area of upland deciduous forest occurs, and more moderate densities distributed throughout the lowland forests dominant in the southeastern region of the island. Garden Island showed a similar pattern with a lower overall distribution of predicted density associated with the predominance of lowland forest (Figure 12a). Predicted habitat-specific density of bucks estimated greatest abundance was primarily concentrated in the upland deciduous forest on the west side of Beaver Island and lower overall abundance distributed throughout the rest of Beaver and Garden Island (Figure 12b). We did not extrapolate predicted fawn density because no land cover covariates were included in the top-supported model (i.e., predicted fawn density was constant across land cover types). Figure 11. Estimated relative site abundance for each demographic (doe, fawn, buck) on Beaver Island (left panel) and Garden Island (right panel) during 01–31 August 2020. Table 4. Total abundance with 95% confidence interval for each demographic (doe, fawn buck) on Beaver Island and Garden Island during 01–31 August 2020. Note that abundance refers to the number of deer es- timated within the total detection radius area for each island (i.e., Beaver = 23 mi2, Garden = 4 mi2), not of abundance for the entire island. 17 | White-tailed deer density and habitat use on the Beaver Island Archipelago. MNFI 2021-05
Figure 12a. Predicted habitat-specific density of does across the study area as a function of abundance covari-
ates included in the top-supported model (i.e., lowland forest, upland deciduous forest).

                       White-tailed deer density and habitat use on the Beaver Island Archipelago. MNFI 2021-05 | 18
Figure 12b. Predicted habitat-specific density of bucks across the study area as a function of abundance covari- ates included in the top-supported model (i.e., upland deciduous forest). 19 | White-tailed deer density and habitat use on the Beaver Island Archipelago. MNFI 2021-05
Discussion
Our estimates of 32 deer/mi2 and 5 deer/mi2 for
Beaver Island and Garden Island, respectively,
appear similar to past survey efforts and anecdotal
observations (Duvendeck 1958, MDNR 2017). Indices
of buck to doe ratios were equivalent between Beaver
Island and Garden Island and were within the range
of available estimates using the same methodology
in the Upper Peninsula (Petroelje et al. 2020). Fawn
to doe ratios on Beaver Island were 2.6 times greater
than on Garden Island, although both estimates were
similar to those estimated for deer populations in the
west (Petroelje et al. 2020) and south-central Upper
Peninsula (Duquette et al. 2014).
Estimated deer density on Beaver Island falls near the middle of reported deer densities in Michigan, which
range from approximately 9.4 deer/mi2 in the western Upper Peninsula (Petroelje et al. 2020) to approximately
70 deer/mi2 in south central Lower Michigan (MDNR 2005). However, our estimated densities on Beaver Island
fall within the moderate to high range of reported deer densities estimated for populations in similar forested
landscapes and low snowfall zone of the Upper Peninsula (Doepker et al. 1996, Mayhew 2003, Duquette et al.
2014, Petroelje et al. 2020).
In contrast, estimated deer density on Garden Island was significantly lower than Beaver Island and lower
than other reported estimates in this region. Anecdotal observations from Beaver Island residents suggests
decreasing hunting effort due to low deer abundance, which corroborates our low overall estimates for Garden
Island (MDNR 2017). King (1968) used deer pellet surveys to estimate Garden Island deer density at 5–13 deer/
mi2 during 1966–1968, suggesting density has persisted at low levels. Due to low number of buck detections,
we visually compared antler characteristics to determine the minimum number of bucks (post hoc assessment)
within our surveyed area during August. We were able to confidently distinguish 3 unique bucks, with a
possible 4 total individuals, which supports model estimated abundance (95% CI = 3–14). Our low estimated
fawn to doe ratio compared to Beaver Island also suggests fawn survival may be lower than on Beaver Island.
Low deer densities across sex-age classes on Garden Island may be a result of several interacting ecological and
biogeographic factors. Deer population growth is most influenced by fawn survival (Duquette et al. 2014) and
coyotes are among the leading sources of fawn mortality during the first 6 months following parturition (Kautz
et al. 2019). Although we did not attempt to estimate coyote occupancy or abundance on Garden Island, they
were detected at 36% of sites during August and a single coyote home range may cover the entire island area
(Petroelje et al. 2013). The relationship between spatial scale and the influence of coyote predation on deer
                                                           population-growth has been debated (Bragina et
                                                           al. 2019a, Bragina et al. 2019b, Kilgo et al. 2019)
                                                           but may have a greater effect on small or isolated
                                                           prey populations (Gompper 2002). However, other
                                                           competing or additive hypotheses may also explain
                                                           low estimated deer density and fawn to doe ratios.
                                                           Island biogeography theory predicts a negative
                                                           relationship between island size and extinction risk
                                                           and between distance to source population and
                                                           immigration rate (MacArthur and Wilson 1967).
                                                           Kirchoff (1994) found that the distance separating
                                                           smaller islands from larger land areas was the most
                                                           significant driver of Sitka black-tailed deer densities

                        White-tailed deer density and habitat use on the Beaver Island Archipelago. MNFI 2021-05 | 20
in Southeast Alaska. Deer density on Garden Island may similarly be limited by its relatively small size (18 km2) and presumably low immigration rates from Beaver Island (2.1 km distant). Garden Island is also dominated by mature lowland and upland forest types, conditions negatively correlated with a landscape’s carrying capacity for deer (Doepker et al. 1996). The interaction between predation, forage availability, and geographic context may preclude deer density from reaching similar levels as estimated on Beaver Island. Our predicted habitat-specific density estimates suggest both sexes were more abundant in the upland deciduous forests (sugar maple-American beech) dominating the western half of Beaver Island. This distribution of density broadly supports expected summer doe and buck resource selection in northern Michigan where forested cover types dominate the landscape (Petroelje et al. 2021). Although mature northern hardwood cover types may not generally provide abundant preferred deer forage (Case and McCullough 1987), they may contain the greatest percentage contribution to available summer forage relative to other land covers while also meeting additional life history requirements (Stormer and Bauer 1980). American beech mortality caused by Beech Bark Disease may increase frequency and size of canopy gaps that stimulate sufficient herbaceous vegetation and regenerating hardwood stems during summer (Wieferich 2013, Doepker et al. 2017). However, beech seedling thickets following high beech mortality events may also reduce availability of preferred deer forage (Wieferich 2013). Our results also predicted relatively moderate doe densities (i.e., about 10–20/mi2) and relatively low buck densities (i.e., < 5/mi2) in the lowland conifer and mixed forests dominating the southeastern half of the island. This region is primarily under state ownership and comprises a mix of lowland conifers (northern white-cedar dominant) interspersed with lowland aspen (Populus spp) and non-forested wetlands. The combination of these land cover types may provide deer with moderate herbaceous forage and regenerating aspen stems, while also providing dams with complex horizontal structure for predator avoidance (Doepker et al. 2017, Dion 2018). We stress that this distribution relates only to seasonal density during August and would likely exhibit the reverse pattern of spatial variation in density during winter months as deer migrate to their wintering complex in the lowland conifer forests in the southeastern region of the island (Ozoga 1963). This seasonal variation in deer space use emphasizes the need to survey across seasons prior to making management recommendations. Although density estimates derived from the Royle- Nichols model appeared to accurately reflect relative abundances within and among islands, estimates also displayed wide confidence intervals. This variation is partially inherent to using detection/non- detection data to estimate abundance (Royle and Nichols 2003). However, annual population trends in deer density estimated using the Royle-Nichols model generally reflected population growth rates estimated from independent radiotelemetry data in the Upper Peninsula, but were less precise (Duquette et al. 2014). Though population growth estimates from radiotelemetry studies may be more precise, application of camera traps substantially reduce effort and financial investment compared to telemetry-based monitoring (Miller et al. 1997, Kochanny et al. 2009), while simultaneously being able to collect standardized information on demographic composition across small and large spatial extents. The ability to monitor populations at small spatial scales has great value in small Deer Management Units where regional surveys lack power or confidence to accurately monitor population trends (MDNR 2010, Frawley 2020). Analysis of abundance using the Royle-Nichols occupancy model also allows estimation of confidence intervals, corrections for variation in animal detectability, and assessment of covariates on abundance (Royle and Nichols 2003, Fiske and Chandler 2011). Given uncertainty around single point estimates, conducting annual camera trap surveys to monitor general trends and spatial patterns in deer population growth and demographics 21 | White-tailed deer density and habitat use on the Beaver Island Archipelago. MNFI 2021-05
may be more informative to management or conservation objectives, in addition to reducing labor and costs
associated with camera traps and occupancy models (Gálvez et al. 2016). Camera trap images also provide
a wealth of additional data about the deer herd, including antler development, body condition, diel activity
patterns, and behavioral state (Found and Patterson 2020). They also simultaneously collect information on
numerous non-target species, permitting estimation of overall species richness, predator occupancy rates, and
community dynamics that can be explicitly incorporated within the occupancy modeling framework to test
ecological hypotheses surrounding deer density (MacKenzie et al. 2018).
A potential source of bias within our survey design is the use of home range estimates from a distinct deer
population in the Upper Peninsula, Michigan (Kautz et al. 2019) to define our effective detection radius for
density estimation. Given similar land cover composition and environmental conditions, these data were the
best home range estimates available to inform our study design. However, it is plausible that deer home ranges
on Beaver Island may differ enough to violate the assumption of site independence (Royle and Nichols 2003).
Obtaining independent estimates of deer movement rates and home range dynamics on Beaver Island and
Garden Island may help refine survey design and modeling requirements to provide minimally biased estimates
of density and abundance for conservation and management decision making.

A stand of mature boreal forest dominated by northern white-cedar (left) and ground-hemlock (Taxus canaden-
sis) persisting on Garden Island. Ground-hemlock (aka Canada yew) is highly sensitive to deer browse pressure.

Conclusions & Recommendations
Our camera trap survey to estimate deer density on Beaver Island and Garden Island provides a first step
toward developing a scientifically informed and spatially-explicit foundation for understanding the population
ecology of white-tailed deer and their relationship to various conservation and management objectives in
a Great Lakes island ecosystem. More broadly, application of this approach in an island archipelago (i.e.,
closed system) may also serve as an important baseline to test the efficacy of this survey design and modeling
approach throughout Michigan. Combining camera traps and the Royle-Nichols occupancy model to estimate
habitat-specific deer density in an efficient and logistically feasible survey design offers opportunities to
address numerous ecological hypotheses and conservation needs. In small and geographically isolated island
systems where broad-scale monitoring methods are not applicable (e.g., Frawley 2020), our methodology
may serve as an effective platform for fine-scale monitoring of deer population dynamics. Obtaining science-
based and cost-effective population trends specific to this Deer Management Unit may be especially important
for natural resource management decision making for an archipelago comprised of diverse and sometimes
conflicting stakeholder interests (Horsley et al. 2003, MDNR 2016, MDNR 2017, LTBB Natural Resources
Department 2015).

                       White-tailed deer density and habitat use on the Beaver Island Archipelago. MNFI 2021-05 | 22
If this method is utilized for monitoring deer density trends in relation to management and conservation objectives on the archipelago, we recommend annual surveys before, during, and after implementation of treatments to accurately capture associated changes in deer density. Additionally, a yearlong camera trap survey to estimate monthly changes in average density, spatial distribution of density, and changes in sex-age ratios would provide an exceptional foundation for understanding deer population dynamics to inform management recommendations and future studies within the archipelago. Once validation of model performance has been achieved, more periodic monitoring may be sufficient to assess changes in deer density. Defining the spatial distribution of deer density among key habitat types is critical for beginning to understand their relationship to associated ecological impacts (Shi et al. 2006). By explicitly modeling habitat-specific density, management or conservation actions can be more effectively targeted to regions of greater or lesser deer abundance. Although we made no attempt to relate estimated or predicted deer density to vegetation dynamics during this survey, our methodology may lend itself well to the study of this relationship and the influence of changes in fine-scale deer density on plant community responses. Long-term studies of plant community changes on islands with and without deer in the Apostle Islands archipelago in northern Wisconsin offer insight into the potential dynamics occurring throughout the Beaver Island Archipelago (Beals et al. 1960, Mudrak et al. 2009). Natural community and rare species surveys conducted throughout the archipelago elucidate suspected relationships between deer browse pressure, ecological integrity, and biodiversity. For example, deer browse pressure was noted as a key threat to the persistence of several high-quality natural communities occurring on Beaver Island (greatest deer density), whereas relatively intact natural communities harboring high species richness were inventoried on Garden Island (low deer density), and High Island (deer presumed absent) (King 1968, Higman et al. 2012a, Higman et al. 2012b, Cohen 2017). Conducting such a study within the Beaver Island Archipelago that is exposed to a range of deer densities offers a unique opportunity to objectively evaluate this complex ecological relationship (King 1968, Case and McCullough 1987, Soule 1993, Higman et al. 2016). 23 | White-tailed deer density and habitat use on the Beaver Island Archipelago. MNFI 2021-05
You can also read