The Dilemma of Road Safety in the Eastern Province of Saudi Arabia: Consequences and Prevention Strategies - MDPI
←
→
Page content transcription
If your browser does not render page correctly, please read the page content below
International Journal of
           Environmental Research
           and Public Health

Article
The Dilemma of Road Safety in the Eastern Province
of Saudi Arabia: Consequences and Prevention
Strategies
Arshad Jamal 1 , Muhammad Tauhidur Rahman 2, * , Hassan M. Al-Ahmadi 1                    and
Umer Mansoor 1
 1    Department of Civil Engineering, King Fahd University of Petroleum & Minerals, KFUPM Box 655,
      Dhahran 31261, Saudi Arabia; arshad.jamal@kfupm.edu.sa (A.J.); ahmadi@kfupm.edu.sa (H.M.A.-A.);
      umerkhan190@gmail.com (U.M.)
 2    Department of City and Regional Planning, King Fahd University of Petroleum & Minerals, KFUPM Box
      5053, Dhahran 31261, Saudi Arabia
 *    Correspondence: mtr@kfupm.edu.sa; Tel.: +966-13-860-7364

 Received: 20 November 2019; Accepted: 20 December 2019; Published: 24 December 2019

 Abstract: Road traffic crashes (RTCs) are one of the most critical public health problems
 worldwide. The WHO Global Status Report on Road Safety suggests that the annual fatality
 rate (per 100,000 people) due to RTCs in the Kingdom of Saudi Arabia (KSA) has increased from
 17.4 to 27.4 over the last decade, which is an alarming situation. This paper presents an overview
 of RTCs in the Eastern Province, KSA, from 2009 to 2016. Key descriptive statistics for spatial and
 temporal distribution of crashes are presented. Statistics from the present study suggest that the
 year 2012 witnessed the highest number of crashes, and that the region Al-Ahsa had a significantly
 higher proportion of total crashes. It was concluded that the fatality rate for the province was 25.6,
 and the mean accident to injury ratio was 8:4. These numbers are substantially higher compared to
 developed countries and the neighboring Gulf states. Spatial distribution of crashes indicated that a
 large proportion of severe crashes occurred outside the city centers along urban highways. Logistic
 regression models were developed to predict crash severity. Model estimation analysis revealed that
 crash severity can be attributed to several significant factors including driver attributes (such as sleep,
 distraction, overspeeding), crash characteristics (such as sudden deviation from the lane, or collisions
 with other moving vehicles, road fences, pedestrians, or motorcyclists), and rainy weather conditions.
 After critical analysis of existing safety and infrastructure situations, various suitable crash prevention
 and mitigation strategies, for example, traffic enforcement, traffic calming measures, safety education
 programs, and coordination of key stakeholders, have been proposed.

 Keywords: road safety; traffic crashes; logistic regression; GIS; prevention and mitigation strategies;
 Saudi Arabia

1. Introduction
    Road traffic crashes (RTCs) have become a critical public health concern worldwide. The World
Health Organization (WHO) and International Transport Forum (ITF) annual reports suggest that
approximately 1.35 million people are killed and up to 50 million are injured in RTCs, costing over
USD 520 billion globally [1,2]. The current trends reveal that if proper preventive measures are not
adopted, then by the year 2030, road traffic injuries are predicted to be the seventh leading cause of
death across all age groups, which at present is the leading cause of death for the 15–29 year old age
group [3]. The same report also states that 9 out of 10 lives lost to traffic are in low- to middle-income
countries, even though these countries share only 48% of the world’s registered vehicles. Economic

Int. J. Environ. Res. Public Health 2020, 17, 157; doi:10.3390/ijerph17010157    www.mdpi.com/journal/ijerph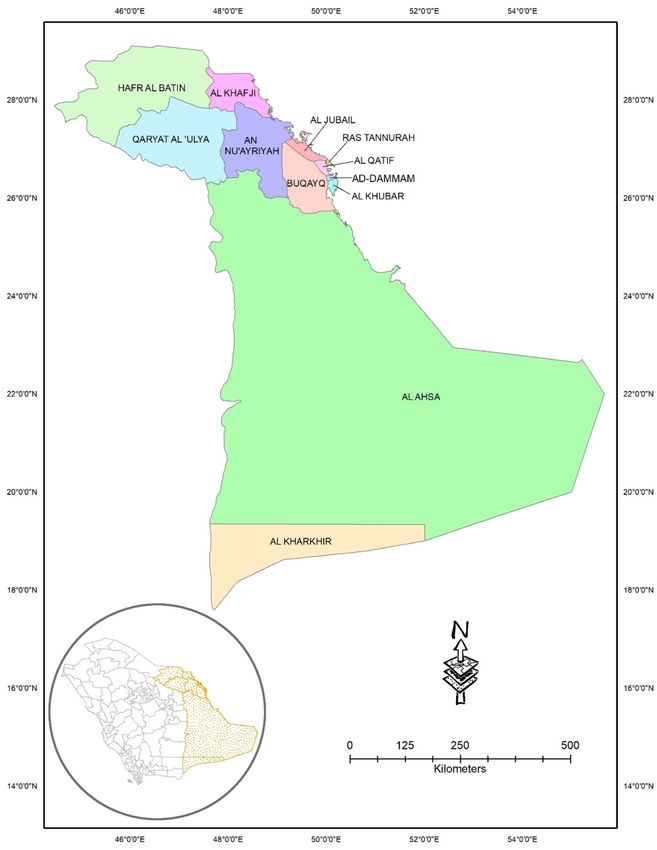
Int. J. Environ. Res. Public Health 2020, 17, 157                                                        2 of 23

development has increased the rate of motorization throughout the world, and in particular in low-
and middle-income countries [4]. The increased usage and ownership of motor vehicles demands
better roads with effective road safety and protection measures. Despite this massive human and
economic loss, efforts to combat this global challenge are limited [5–7].
      Previous studies found that frequencies and severities of RTC occurrence can be contributed
to several factors, including drivers’ attributes (age, gender, eyesight, seat belt usage, etc.), vehicle
characteristics (vehicle type, vehicle height, vehicle age, tire condition, etc.), roadway characteristics
(number of lanes, lane width, shoulder width, pavement surface condition, roadside condition, etc.),
crash characteristics (speed at impact, crash type), and environmental conditions (visibility, weather
condition, etc.) [8–16]. Previous studies have identified numerous factors in order to suggest effective
countermeasures. Globally, various preventive measures have been effectively adapted to reduce the
burden of RTCs [17–19]. Over-speeding, non-compliance to seat belt usage, and use of mobile phones
while driving are three primary factors associated with high incidence and severity of RTCs [20].
For example, by devising and enforcing suitable preventive measures, Germany has succeeded in
reducing its traffic mortality rate by 69% and severity by more than 50% [21]. Similarly, authorities in
New York and several other U.S. cities have been able to reduce the number of fatalities by improving
the driving environment, lowering speed limits, and strict enforcement of traffic violations [22,23].
      Kingdom of Saudi Arabia (KSA) is the largest country in the Arab states with an area of
approximately 2,149,690 km2 . The country is a member of the “Group of Twenty” (G-20) major world
economies. The motorization rate in the KSA has increased rapidly since the oil boom in the early 1970s.
Within the last decade, it has increased by almost 67% due to the migration of expatriates from various
parts of the world, resulting in rapid urban expansions of major cities [24,25]. These expatriates have
diverse backgrounds and attitudes, testing, and training systems for obtaining licenses and driving
behaviors. The enormous growth in road infrastructure has resulted in increased road networks with
an exponential increase in RTCs. These road crashes are one the major causes of fatalities in the KSA.
The WHO Global Status Report on Road Safety reports that the annual fatality rate per 100,000 people
due to RTCs in the KSA has increased from 17.4 to 27.4 since the last decade, which is the worst among
the countries in the region and is significantly above fatality rate for other G-20 nations such as the
USA, the United Kingdom, Japan, and Australia [3]. The economic losses due to RTCs are estimated
to be approximately 4.3% of the KSA’s GDP [26]. A study conducted by Turki et al. suggests that
more than 19 individuals have lost their lives daily, and approximately 4 people were injured every
hour due to RTCs on KSA roads [27]. The majority of victims are young and in the economically more
productive age group. According to morbidity and mortality records from the Ministry of Health
(MOH), roughly 81% of total fatalities in hospitals are due to RTCs, and nearly 20% of the beds are
occupied by RTC victims [28]. Statistics from previous studies for KSA also revealed that the majority
of these crashes occurred due to over-speeding and non-compliance with traffic regulations, which can
be prevented by strict enforcement [29–33].
      Few studies are available in the existing literature that have examined the patterns, trends,
and relationships between driving behavior and crash severity in various cities of the KSA. One such
study was conducted for 287 young (aged 18–24) drivers [34]. A structural equation modeling approach
was adopted to quantify the relationships between driving behaviors and accident involvement.
The findings indicated that young drivers can be classified into three distinct categories, these being
speedy driving, aggressive driving, and error making. In another similar study, the relationship
between different features of crashes, drivers, and vehicles in three different cities of the KSA was
investigated [35]. It was concluded that both frequencies and severities of RTCs are significantly higher
among young drivers (26–33 years of age) and those driving between 11:00–17:00. The study also
revealed that a lower proportion of chauffeurs at fault understood the traffic signs compared to those
not at fault. Further, the logit models developed during the research suggested that driver’s behavior,
traffic sign recognition, type of vehicle had a statistically significant role in the fault behavior of drivers.
In the KSA, road traffic injuries (RTIs) are the third leading cause of death and account for 80% of all
Int. J. Environ. Res. Public Health 2020, 17, 157 3 of 23
trauma admissions in hospitals [36,37]. Recently, the effect of distracted driving on crash severity has
been investigated, finding that drivers using a mobile phone while driving have 44% higher chances of
being involved in a severe crash [38].
The above studies examined data prior to 2000 and no follow-up studies have been performed to
analyze the trends and patterns of vehicle crashes in Saudi cities in general, but particularly in the case
of the Eastern Province. This study fulfills that gap by examining the vehicle crash pattern between the
years 2009–2016 for the cities in the Eastern Province of the KSA. It also utilized binary logistic regression
modeling techniques to predict crash severity within the study area on the basis of the available data.
Finally, the study carried out a critical review of the safety and road infrastructure conditions in the
study area, proposing suitable counter-measures and mitigation strategies to overcome the burden
of RTCs across the region. In the following sections, Section 2 provides a brief description of the
study area. Section 3 discusses the data collected and the methods used in the study. The results are
presented in Section 4 and are discussed in Section 5. Section 6 is dedicated to the detailed analysis of
existing road safety and infrastructure conditions, proposing suitable counter-measures and mitigation
strategies. Finally, the concluding remarks and limitations of the study are provided in Section 7.
2. Study Area
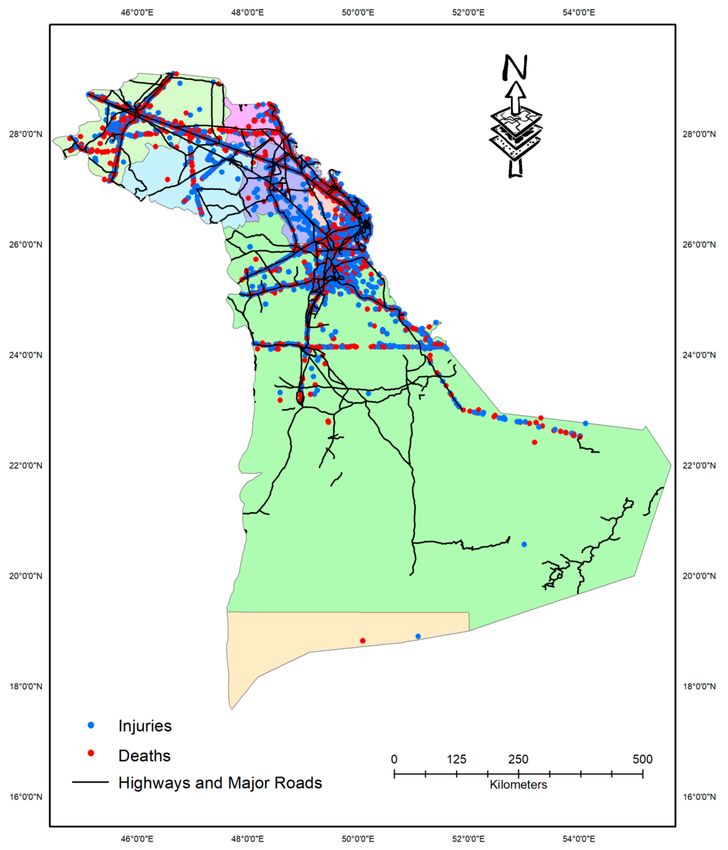
The entire Eastern Province of the KSA was considered as the area of study (Figure 1). The province
contains an area of 672,522 km2 with a total population of almost 5.1 million [39]. It is reported that the
number of registered vehicles in the Eastern Province has increased from 2,971,356 in 2011 to 5,274,251
in 2017 [40]. This rapid increase in motorization across the province has resulted in serious safety
concerns. The province is the hub of oil industries in the KSA, which is continuously expanding.
The province hosts the Arabian American Oil Company (Saudi ARAMCO), which is the world’s largest
oil company. A significant proportion of the population constitutes expatriates coming from diverse
backgrounds and cultures, hence generating a heterogeneous road user population.Int. J. Environ. Res. Public Health 2020, 17, 157 4 of 23
Figure 1. Study area encompassing the Eastern Province along with its 12 cities.
3. Data Collection and Analysis
RTC data for the entire province was acquired from the traffic police department Dammam for the
years 2009–2016. A total of 38,780 crashes were reported during this period; however, after cleaning
and mining the data, only 30,520 were found valid and used for subsequent analysis. Property damage
crashes were excluded from the analysis because of several important missing pieces of information.
Descriptive analysis and logistic regression were conducted using the SPSS statistical package (version
25, IBM, Arnmonk, NY, USA), whereas spatial analysis was carried out using the ArcGIS software
(ArcGIS 10.6, ESRI, Redlands, CA, USA). A random sample of traffic crashes was selected for crash
severity predictive analysis using logistic regression. A similar percentage of fatal and non-fatal crashes
was used for analysis in order to avoid bias towards any specific severity class. A fatal crash is definedInt. J. Environ. Res. Public Health 2020, 17, 157 5 of 23
as any crash resulting in at least one fatality. Driver characteristics, crash type, crash reason, time of
the day, and weather conditions were used as input variables. The output class was crash divided into
two classes in terms of severity, with these being either fatal or non-fatal.
4. Results
4.1. Temporal Variations of RTCs
The monthly distribution of the crashes between 2009 and 2016 is shown in Table 1. A total of
30,520 of severe crashes (crashes with fatality or injury) were reported. It can be observed (Table 1)
that the highest mean monthly crashes occurred during January (357), followed by December (348),
July (333), and August (324). On the contrary, the months of September (297), October (297), May (301),
and June (1090) witnessed the lowest number of crashes. The standard deviation for mean monthly
crashes observed in October was the largest (88) and was the smallest (44) during May. In terms of
year-wise comparison, the total number of crashes was at 3242 at the beginning of 2009 and steadily
declined, hitting a low point of 2886 during the year 2010. The total number of crashes then sharply
increased in 2011 (3494) and 2012 (4914), and then continued to gradually decrease afterward with 4204
in 2013, 4173 in 2014, 4087 in 2015, and finally 3520 crashes during 2016. Mean annual crashes were
slightly less than 4000, with a corresponding standard deviation of 648 crashes per annum. Table 2
summarizes the total number of fatalities and injuries resulting from the RTCs occurring between the
periods considered in this study.Int. J. Environ. Res. Public Health 2020, 17, 157 6 of 23
Table 1. Temporal distribution of crashes during the study period (2009–2016).
Total
Year January February March April May June July August September October November December
Crashes
2009 402 (12.4) 238 (7.34) 262 (8.08) 277 (8.54) 266 (8.2) 260 (8.02) 389 (12) 235 (7.25) 228 (7.03) 204 (6.29) 213 (6.58) 268 (8.27) 3242 (100)
2010 297 (10.29) 256 (8.87) 222 (7.69) 225 (7.8) 246 (8.52) 225 (7.8) 249 (8.63) 251 (8.7) 187 (6.48) 183 (6.34) 217 (7.52) 328 (11.36) 2886 (100)
2011 288 (8.24) 292 (8.36) 277 (7.93) 276 (7.9) 265 (7.58) 260 (7.44) 251 (7.18) 385 (11.02) 326 (9.34) 313 (8.96) 294 (8.41) 267 (7.64) 3494 (100)
2012 349 (7.1) 410 (8.34) 432 (8.79) 367 (7.47) 332 (6.76) 383 (7.79) 480 (9.77) 471 (9.58) 460 (9.36) 474 (9.65) 356 (7.25) 400 (8.14) 4914 (100)
2013 350 (8.33) 295 (7.02) 331 (7.87) 313 (7.45) 358 (8.52) 354 (8.42) 375 (8.92) 341 (8.1) 333 (7.92) 314 (7.47) 381 (9.06) 459 (10.92) 4204 (100)
2014 414 (9.92) 363 (8.7) 371 (8.89) 365 (8.75) 349 (8.36) 332 (7.96) 341 (8.17) 326 (7.81) 297 (7.12) 294 (7.05) 354 (8.48) 367 (8.79) 4173 (100)
2015 363 (8.88) 298 (7.29) 403 (9.86) 318 (7.78) 324 (7.93) 309 (7.56) 331 (8.1) 329 (8.05) 303 (7.41) 308 (7.54) 376 (9.2) 425 (10.4) 4087 (100)
2016 391 (11.11) 316 (8.97) 330 (9.38) 342 (9.72) 268 (7.61) 309 (8.78) 248 (7.05) 253 (7.18) 243 (6.9) 283 (8.04) 265 (7.53) 272(7.73) 3520 (100)
Total 2854 2468 2628 2483 2408 2432 2664 2591 2377 2373 2456 2786 30,520
Mean 357 309 329 310 301 304 333 324 297 297 307 348 3815
SD 46 56 72 49 44 53 82 79 83 88 69 76 648
Note: values in parenthesis indicate percentages.Int. J. Environ. Res. Public Health 2020, 17, 157 7 of 23
Table 2. Frequency of year-wise fatalities and injuries during the study period (2009–2016).
Year Fatalities Injuries
2009 1145 5029
2010 995 4512
2011 1058 5267
2012 1222 6674
2013 998 5665
2014 1252 6082
2015 1229 5822
2016 1214 5247
Total 9113 44,298
Mean 1139 5537
SD 107 671
It can be observed from Table 2 that a total of 9113 fatalities and 44,298 injuries (both major and
minor) occurred during this period. The year 2014 witnessed the highest number of fatalities with a
total number of 1252. This was followed by the years 2015 and 2012, where the total fatalities were at
1229 and 1222, respectively. Despite the lower number of crashes reported during 2016 compared to
preceding years, the number of fatalities (1214) during the same year were comparable to previous
years. Likewise, the highest number of injuries (6674) were observed during 2012, and the lowest
(4512) in 2010.
4.2. RTC Variations among the Cities of the Eastern Province
Table 3 presents the yearly distribution of crashes by different cities in the Eastern Province,
whereas Figure 2 shows the spatial distribution of all the injured and fatal crashes in each of the cities.
Spatial distributed of crashes indicated that a large proportion of fatal crashes occurred on the outskirts
of cities along the highways. It can be observed from Table 3 that Al-Ahsa contributed to the greatest
proportion of crashes occurring at different years, whereas the Khafji region had the lowest. Al-Ahsa
had the highest mean number of annual crashes (1217) as well, with a correspondingly high standard
deviation of 437. Mean annual crashes were 612 in Dammam, 432 in Hafr Al-Batin, 319 in Jubail,
and 257 in Dhahran city. The cities of Ras Tanura (80), Khafji (85), Al-Naimiyah (121), and Al-Kobar
(237) had the lowest number of annual mean crashes.Int. J. Environ. Res. Public Health 2020, 17, 157 8 of 23
Figure 2. Spatial distribution of crashes among different cities in the Eastern Province.
The annual crash fatality rates by different cities are shown in Table 4. The fatality rates given are
average annual fatalities per 100,000 population for each region in the respective years. It can be seen
that Abqaiq had the highest fatalities rates, exceeding an index value of 100 during most of the years.
This value is significantly higher than average fatality rates in different states in the United States,
where they are around 10. The mean fatality rates in Al-Naimiyah, Dhahran City, and Khafji were
97.1, 77, and 66.5, respectively. On the other hand, fatality rates for Al-Khobar were the lowest (8.2),
followed by Dammam (10.2), Qatif (12.5), and Ras Tanura (14). Fatality rate distribution for different
cities across different years did not follow any specific trend.Int. J. Environ. Res. Public Health 2020, 17, 157 9 of 23
Table 3. Distribution of crashes by cities between 2009–2016.
Hafr Ras Total
Year Abqaiq Al-Ahsa Al-Khobar Al-NaimiyahDammam Dhahran Jubail Khafji Qatif
Al-Batin Tanura Crashes
2009 115 (3.55) 712 (21.96) 139 (4.29) 117 (3.61) 505 (15.58) 194 (5.98) 522 (16.1) 298 (9.19) 102 (3.15) 443 (13.66) 95 (2.93) 3242 (100)
2010 97 (3.36) 714 (24.74) 234 (8.11) 81 (2.81) 411 (14.24) 57 (1.98) 504 (17.46) 284 (9.84) 93 (3.22) 335 (11.61) 76 (2.63) 2886 (100)
2011 259 (7.41) 922 (26.39) 193 (5.52) 91 (2.6) 649 (18.57) 114 (3.26) 522 (14.94) 358 (10.25) 90 (2.58) 204 (5.85) 92 (2.63) 3494 (100)
2012 188 (3.83) 1550 (31.54) 368 (7.49) 137 (2.79) 807 (16.42) 429 (8.73) 437 (8.89) 529 (10.77) 95 (1.93) 236 (4.8) 138 (2.81) 4914 (100)
2013 149 (3.54) 1031 (24.52) 327 (7.78) 158 (3.76) 836 (19.89) 368 (8.75) 433 (10.3) 364 (8.66) 94 (2.24) 400 (9.51) 44 (1.05) 4204 (100)
2014 144 (3.45) 1806 (43.28) 231 (5.54) 116 (2.78) 534 (12.8) 345 (8.27) 342 (8.2) 295 (7.07) 62(1.49) 266 (6.36) 32 (0.76) 4173 (100)
2015 202 (4.94) 1708 (41.79) 209 (5.11) 134 (3.28) 564 (13.8) 262 (6.41) 352 (8.61) 230 (5.63) 91 (2.23) 251 (6.14) 84(2.06) 4087 (100)
2016 123 (3.49) 1293 (36.73) 191 (5.43) 131 (3.72) 586 (16.65) 288 (8.18) 343 (9.74) 196 (5.57) 53 (1.51) 234 (6.65) 82 (2.33) 3520 (100)
Total 1277 9736 1892 965 4892 2057 3455 2554 680 2369 643 30,520
Mean 160 1217 237 121 612 257 432 319 85 296 80 3815
SD 54 437 75 25 147 128 79 102 18 87 32 648
Note: values in parenthesis indicate percentages.
Table 4. Crash fatality rates by cities (fatalities/100,000 people).
Year Abqaiq Al-Ahsa Al-Khobar Al-Naimiyah Dammam Dhahran Hafr Al-Batin Jubail Khafji Qatif Ras Tanura
2009 146.2 30 8.1 147.1 12.3 87.1 43.8 35.8 81.3 18.4 21.1
2010 135.2 26.2 10.4 84.9 7.7 29.7 49.9 31.4 64.9 15.1 9.8
2011 125.5 28.9 9.6 78.2 11.5 33.8 41.6 42.5 64.6 12.7 9.5
2012 87.7 31.5 9.3 112.3 12.8 146.3 40.6 38 74.1 7.9 20
2013 119 24.3 7.3 75.9 7.4 91.2 34.2 30.2 86.9 12.2 20.9
2014 108.3 37.7 5.9 88.3 11.4 72.9 43.2 33.3 54.7 11.9 10.1
2015 155.7 27.7 7.8 90.2 10.1 81.9 49.2 29.9 59.1 10.5 12.7
2016 117.5 27.5 7 100 8.6 73 43.9 24.6 46.7 11.5 8.2
Mean 124.4 29.2 8.2 97.1 10.2 77 43.3 33.2 66.5 12.5 14Int. J. Environ. Res. Public Health 2020, 17, 157 10 of 23
4.3. RTC Distribution by Prevailing Crash Causes and Types
Figure 3 shows the predominant causes of reported crashes, including over-speeding, sudden lane
change, driver distraction, sleeping, keeping a short safe distance, not giving way, and non-compliance
to traffic signals, among others. Sudden lane changes, over-speeding, and driver distraction accounted
for a significant proportion of these crashes with percentages of 25.2%, 20.60%, and 19.40%, respectively.
Sleeping while driving contributed to 6.2% of total crashes, whereas crashes occurring due to inadequate
safe distance were slightly less than 6%. Similarly, not giving way and violating signals each contributed
to around 5% of total crashes. The category “others” consisted of other reasons such as slippery surfaces,
violating pedestrian signals, faulty tires, faulty steering wheel, brake failure, engine failure, unprotected
work-zone, highway without a fence, and warning signs and signals, among others. Because the
proportion of each of these crashes was less than 1.5%, they were not presented individually.
Figure 3. Distribution by prevailing crash causes.
Figure 4 presents the distribution of crashes by different types such as hitting a road fence;
vehicle overturning; hitting a pedestrian and animal collisions (both rear-end and head-on); vehicle
overturning; hitting fixed object, parked vehicles, or a motorcyclist, among others. Head-on (32%) and
rear-end (68%) crashes were grouped into the single category “collisions” to avoid any congestion
in Figures 4 and 5. It is evident (from Figure 4) that collision was the most predominant crash type
reported, contributing to almost one-third of the total crashes. The second and third major crash
categories were crashes due to vehicle overturning (21.1%) and hitting pedestrians (15.6%). Hitting
fixed objects and road fences each constituted approximately 7% of the total crash types, with colliding
with parked vehicles and hitting an animal being slightly lower at around 3%. Hitting a tree, traffic
sign, waste container, or bicycle/motorcycle, as well as falling from a bridge, were each less than 1%.Int. J. Environ. Res. Public Health 2020, 17, 157 11 of 23
Figure 4. Distribution by prevailing crash types.
Figure 5 provides information on the percentage of fatalities/injuries resulting from different
crash types. It can be observed from the plot that collisions (hitting another vehicle) were responsible
for a significant proportion of fatalities and injuries reported. Vehicle head-on collisions resulted in
approximately one-third (33%) of the total fatalities and around two-fifths (40%) of the total number
of injuries. Vehicle overturning is another primary crash type resulting in over 20% of fatalities and
approximately 33% of the total injuries. This is followed by crash types due to vehicle overturning,
where the proportion of fatalities was estimated at around 17%, whereas that of injuries was at about
14%. Fatalities and injuries from hitting fixed objects and road fences ranged between 3% and 8%.
A relatively lower number of fatalities (2.06%) and injuries (4.95%) resulted from hitting pedestrians.
Similarly, fatalities and injuries around 3% each emerged from crash types listed in another category
column described previously.
Figure 5. Distribution of fatalities/injuries with crash types.Int. J. Environ. Res. Public Health 2020, 17, 157 12 of 23
4.4. Crash Severity Modeling Using Logistic Regression
Logistic regression approach was adopted for crash severity modeling. Logistic regression
methods were preferred because conventional regression analysis is generally used when the output
is continuous. Logistic regression is appropriate if the output is categorical, having binary classes.
Logistic regression is very efficient and easy to interpret. This technique is more informative compared
to other classification techniques as it provides a relationship between output and all its input features.
This technique not only gives the measure of relevance of a feature but also gives its direction of the
association, whether positive or negative. Logistic regression methods have been successfully used for
reasonably accurate crash severity modeling in previous studies [41–43]. Crash severity was defined in
two classes, these being whether a crash was fatal or non-fatal, given a list of explanatory variables at a
selected confidence level. The main aim of logistic regression, just like any other statistical technique, is
to find the best fit. However, it differs from linear regression in terms of the response variable, which is
binary in nature for logistic regression. Crash severity, which is the dependent variable in this study,
has a binary nature. The two classes for the dependent variable are a fatal crash and a non-fatal crash.
The simple mathematical expressions adopted for logistic regression modeling can found in previous
studies [44,45], and shown below:
e g(x)
p( f atal crash) = π(x) = (1)
1 + e g(x)
where g(x) represents the functional form of input variables, and is given by
g(x) = β0 + β1 x1 + β2 x2 + · · · + βn xn . (2)
Subsequently, the probability of non-fatal crash can be estimated using the equation:
p(non − f atal carsh) = 1 − p( f atal carsh) = 1 − π(x), (3)
1
p(non − f atal crash) = . (4)
1 + e g(x)
Logistic regression uses the maximum likelihood algorithm in order to determine the coefficients,
which make the observed outcome most probable [46]. A random sample of 2500 traffic crash data
points was selected for crash severity predictive analysis using logistic regression. A similar percentage
of fatal and non-fatal crashes was used for analysis in order to avoid bias towards any specific severity
class. In our study, backward stepwise regression approach using SPSS software was followed to
model the independent variables from our dataset. Although stepwise may have some limitations,
it nonetheless has obvious advantages over conventional methods of analysis. For example, stepwise
logistic regression has the capacity to manage a lot of potential predictor variables, adjusting the model
to pick the best predictor variables from the accessible choices. It is computationally faster compared
to automatic model selection techniques. It gives better insight into the predictor variables just by
looking at the way they are removed or added. All the categorical independent variables were changed
to dummy variables, as shown in Table 5. In backward regression process, insignificant variables were
successively eliminated. Significant variables with p-values less than 0.05 in last step are shown in
Table 6.Int. J. Environ. Res. Public Health 2020, 17, 157 13 of 23
Table 5. Explanatory variables used in the model.
Variable Name Variable Type Variable Description
Driver Related Factors
Sleep Categorical 1 = Sleep; otherwise = 0
Distractions Categorical 1 = Distractions; otherwise = 0
Speeding Categorical 1 = Speeding; otherwise = 0
Exhaustion Categorical 1 = Exhaustion; otherwise = 0
Alcohol use Categorical 1 = Alcohol use; otherwise = 0
Accident Type
Hit a moving vehicle Categorical 1 = Hit a moving vehicle; otherwise = 0
Hit an animal Categorical 1 = Hit an animal; Otherwise = 0
Hit a road fence Categorical 1 = Hit a road fence; otherwise = 0
Hit an electric pole Categorical 1 = Hit an electric pole; otherwise = 0
Hit a side barrier Categorical 1 = Hit a side barrier; otherwise = 0
Hit a parked vehicle Categorical 1 = Hit a parked vehicle; otherwise = 0
Hit a motorcycle Categorical 1 = Hit a motorcycle; otherwise = 0
Hit a pedestrian Categorical 1 = Runover; otherwise = 0
Hit a tree Categorical 1 = Hit a tree; otherwise = 0
Accident Reason
Violate red signal Categorical 1 = Override the red signal; otherwise = 0
Sudden lane deviation Categorical 1 = Sudden lane deviation; otherwise = 0
Violate stop sign Categorical 1 = Violate stop sign; otherwise = 0
Not giving way Categorical 1 = Do not give priority; otherwise = 0
Vehicle drift Categorical 1 = Drift; otherwise = 0
Not enough space Categorical 1 = Not enough space; otherwise = 0
Violation of pedestrian signal Categorical 1 = Violation of pedestrian signal; otherwise = 0
Slipping Categorical 1 = slipping; otherwise = 0
Absence of warning signs Categorical 1 = Lack of warning signs; otherwise = 0
No signal Categorical 1 = No signal; otherwise = 0
Faulty tires Categorical 1 = Faulty tires; otherwise = 0
Faulty steering wheel Categorical 1 = Faulty tires; otherwise = 0
Engine combustion Categorical 1 = Faulty tires; otherwise = 0
Overloading Categorical 1 = Overloading; otherwise = 0
Lighting Condition
Day Categorical 1 = Day; otherwise = 0
Night Categorical 1 = Night; otherwise = 0
Weather
Clear Categorical 1 = Clear; otherwise = 0
Cloudy Categorical 1 = Cloudy; otherwise = 0
Rainy Categorical 1 = Rainy; otherwise = 0
Dusty Categorical 1 = Dust; otherwise = 0
The estimated results of the logistic model using a backward regression approach are shown in
Table 6. The magnitude and sign of coefficients explain the effect of a factor on the risk of fatality.
A positive sign of the coefficient (β) shows a higher probability of fatality related to the corresponding
factor, whereas the negative sign indicates a lesser likelihood of fatality.Int. J. Environ. Res. Public Health 2020, 17, 157 14 of 23
Table 6. Model’s parameter estimates for significant variables.
Standard Wald Significance *
Explanatory Variable Coefficient β Odds Ratio
Error. Statistic p-Value
Driver Characteristics
Sleep 1.023 0.42 5.982 0.01 2.781
Distractions 0.327 0.105 9.683 0.002 1.387
Speeding 0.676 0.09 62.724 0.001 1.966
Crash Type
Hit a moving vehicle 0.564 0.06 93.724 0.02 1.757
Hit a road fence 0.723 0.16 21.548 0.03 2.06
Hit an electric pole 0.784 0.23 11.227 0.01 2.19
Hit a pedestrian 1.865 0.26 50.675 0.02 6.457
Hit a motorcycle 1.289 0.67 3.694 0.004 3.628
Crash Reason
Violate red signal −1.572 0.381 16.985 0.02 0.208
Sudden lane deviation 0.242 0.085 8.084 0.004 1.273
Weather
Rainy −2.532 1.112 5.182 0.003 0.079
Constant −5.938 0.48 155.86 0 0.003
Note: * parameters significant at α = 0.05; -2log-likelihood ratio= 4481.32; chi-square = 165.07; p-value < 0.001.
Model estimation results from logistic regression analysis are shown in Table 6. The variables
shown and included in Table 6 were highly significant at a 95% confidence level. Logistic regression
analysis revealed that crash severity can be attributed to different explanatory variables, including key
driver attributes, crash characteristics, and weather conditions. Regarding driver attributes, it was
found that the probability of a fatal crash increased for drivers who fell asleep while driving. This is
obvious, as the vehicle would be out of control if the driver was sleeping. This was evident from the
positive sign of the estimated coefficient for sleep (β = 1.023; p = 0.01). The higher value of the odds
ratio (Exp β = 2.781) also shows that the chances of a fatality were high. Likewise, the coefficient for
speeding was β = 0.676 with a p-value of 0.001, and magnitude of the odds ratio of Exp β = 1.966 was
also high. It is evident from the current knowledge and intuition that speeding is the primary cause
of fatal crashes. Although many other factors have a confounding effect on speeding, some of these
factors include geometric design features of the roadway, traveling terrain, and visibility conditions,
among other factors. By controlling these factors, the effect of speeding can be mitigated. Our analysis
reveals that speeding increases the likelihood of fatality.
Similarly, there were a number of crash characteristics that had a strong bearing on whether
a crash would be a fatal or a non-fatal one. Significant factors in this category included sudden
lane deviation or hitting another moving vehicle, a road fence, an electric pole, a pedestrian, or a
motorcyclist. Lower p-values and higher odd ratios for parameters listed in this category indicated
their significance, as shown in Table 6. The signs for all coefficients were positive and well intuitive
because there was a high probability of being involved in a fatal crash for each of the crash scenarios
mentioned. Also, the odds ratio for all of the variables was more than 1.0, revealing that the chances of
a fatality were high. The highest chances of fatality among these variables were for hitting a pedestrian
barrier, which had a coefficient value β of 1.865, followed by hit pedestrian crashes, having a β value
of 1.289. It is interesting to note from Table 6 that although the variable of violating red signal was
significant, it had a negative coefficient (β = −1.572), indicating that the chance of fatality was low for
such instances, which seems counter-intuitive compared to previous studies [47–50]. This anomaly
could be attributed to the fact that red-light cameras accompany the majority of signalized intersections
in Saudi Arabia. As evident from previous studies, the presence of red-light cameras results in fewerInt. J. Environ. Res. Public Health 2020, 17, 157 15 of 23
head-on crashes because the cameras prevent red-light running [51,52]. Drivers tend to brake abruptly
in the dilemma zone due to the presence of red-light cameras. Drivers’ conflicting decisions in the
dilemma zone result in rear-end crashes [53,54]. The rear end crashes result in slight injury or property
damage, obvious from many studies [55–58]. A previous study conducted for the nearby city of Riyadh
also indicated that on average non-intersection crashes were more fatal compared to intersection
crashes [59]. Similarly, the probability of low crash fatality on a rainy day having a large negative
value for coefficient (β = −2.532) also appears conflicting to previous studies [60–62]. However, it can
be argued from several previous studies that inclement weather may cause a significant reduction in
vehicle speed [63–65]. During rainy weather, drivers tend to drive slowly, so even if a crash occurs,
the chances of a fatality are lower. Weather in Saudi Arabia is usually clear throughout the year, and it
rains very rarely. Hence, a large proportion of drivers are not familiar/accustomed to rainy driving
conditions, meaning that they become more cautious by reducing their speeds during rainy weather,
and thus the probability of high crash severity is low. The coefficient for constant was β = −5.938 with
a p-value of 0, and the magnitude of the odds ratio was Exp β = 0.003. The coefficient for constant
incorporated the effect of all other factors on the likelihood of fatality.
5. Discussion
This paper presents an overview of road traffic crashes in the Eastern Province, KSA, between
2009 and 2016. A total of 30,520 crashes were witnessed during this period, resulting in 9113 total
fatalities. The mean monthly distribution of crashes indicated that months from May to November
carried the lowest number of crashes, with a slight increase during the months of July and August.
This trend can be attributed partially due to prevailing warm temperatures during most parts of
the year, and partly because of the majority of expatriates leave the province for vacations during
summer. Moreover, locals also prefer to travel abroad or to move to nearby states in order to avoid the
scorching heat during the hot summer. This mean monthly distribution of crash trends is somewhat
similar to the neighboring Gulf states of Oman [66] and Bahrain [67], having similar demographics
and driving environments. There are four peak traffic periods that are prone to a greater number of
crashes occurring during the daytime. These peak periods for the Eastern Province are similar to a
study conducted for the kingdom of Bahrain [67], a state having a similar driving culture and is merely
30 km away from Dammam, the capital of the Eastern Province. Comparing the annual crash trends
during 2012 and 2013, the highest number of crashes were recorded, which was followed by a steady
declining trend. This reduction in annual crashes was mostly due to the implementation of traffic
enforcement and the imposition of heavy traffic fines in the following year. Al-Ahsa and Dammam
cities contribute to almost 52% of total crashes. This is because of the fact that the mentioned cities
have a major proportion of the population and thus the corresponding number of registered vehicles
in the Eastern Province.
Over-speeding, sudden lane changes and the driver distraction were the primary causes that
accounted for about 65% of total crashes in the region. The proportion of different causes reported
herein is comparable to a study previously conducted for the Dammam metropolitan [68]. However,
these statistics for proportions of different causes leading to road traffic crashes are different from
previous research studies conducted for other cities in the KSA [26,69]. The most predominant crash
types were vehicle collisions (36.3%), vehicle overturning (21.1%), and hitting pedestrians (15.6%),
which formed almost three-quarters of total crashes reported. These numbers are somehow different
from a study carried out in neighboring Oman, where collisions, vehicle overturning, and hitting
pedestrians were reported to be 58%, 4.8%, and 3.0%, respectively [66].
The mean annual accident-to-injury ratio for the whole Eastern Province was 8:4, which is slightly
different from 8:6, a ratio reported for one such previous study, as well as the international ratio of
8:1 [26]. Similarly, the mean annual fatality rate (per 100,000 people) for the study area was 25.6,
which is near to the overall fatality ratio of 27.4 for the entire KSA, and higher than 17.4, a value
presently prevailing for the globe [3]. Mean fatality rate for the Eastern Province, and the entire KSAInt. J. Environ. Res. Public Health 2020, 17, 157 16 of 23
is ranked third among twenty Eastern Mediterranean countries, marginally above Libya and Iran
in the region [70]. Likewise, the fatality rate for the Eastern Province is substantially higher than
neighboring Gulf states [66,71,72], India [73], China [74], the United States, the United Kingdom,
Canada, Australia [75], and other Asian countries [76]. This is an alarming situation for a G-20
high-income country. Model estimates of logistic regression models indicate that several significant
factors would determine the level of severity of a crash. Some of these key factors include driver
attributes (such as sleep, distractions, speeding), crash characteristics (collisions with moving vehicles,
road fences, pedestrians, and motorcyclists), and rainy weather conditions. These findings are in close
agreement with a couple of recent studies conducted for other Saudi cities [59,77].
6. Mitigation and Prevention Strategies
Fatalities and injuries due to RTCs can be minimized and prevented by adopting proper road
safety strategies. A wide range of road safety enhancement strategies have been proposed by previous
studies to tackle this global challenge [7,78–82]. Addressing the worsening traffic safety situations in the
KSA, efforts were initiated in 2003 with the aim of improving safety on national roads by identification
of proper remedial measures and proposition of strategies for future implementation. Steps taken to
reduce the burden of RTCs in KSA include enforcement of seatbelt and traffic regulations, installation of
speed cameras throughout the KSA, and emergency medical treatment units, among others. Recently,
a traffic control program called SAHER was implemented to reduce traffic crashes and optimize the
efficiency of the traffic system. SAHER is an automated system adopted for controlling traffic using a
digital network of cameras connected to the central information center. However, the implementation
of these actions seems inadequate, as the traffic safety situations have only been marginally improved.
There is a major gap between law enforcement and policy, and actions toward effective implementation
of these strategies are under serious question; thus, the situation needs to be re-examined. Detailed
analysis of the study results (from Figure 4 and Table 6) indicated that a large proportion of total
crashes and crash severity occurring in the study area were associated with distracted driving (20%),
speeding (about 20%), and fatigue driving (approximately 6%). The following passages provide key
strategies for mitigating and preventing RTCs that need to be proactively implemented throughout the
Eastern Province to improve the deteriorating road safety situations. Listed counter-measures and
strategies have been suggested after comprehensive data analysis in the study area, careful review of
the local crash database, and multiple site visits to selected crash-prone locations to improve the road
safety situation in the KSA in general and in the Eastern Province in particular.
6.1. Advanced Crash Data Recording System
Accurate and organized crash data reports are fundamental to conduct a thorough analysis,
suggest improvements and establish priorities, and to develop strategies for mitigating and preventing
RTCs [83]. Several studies in the past have indicated the significance of the crash database for
providing suitable counter-measures [84–86]. The current methods for data collection, compiling,
and recording needs comprehensive improvements. Although crash reports are prepared at crash
locations, they are non-analytical and rudimentary for any purpose beyond general reporting and
aggregation, which makes the data less useful for suggesting tangible safety improvements. Therefore,
it is recommended that a comprehensive crash data recording system be adopted containing information
on driver characteristics (age, gender, physical condition), characteristics of vehicles involved (type,
age, tire conditions), roadway characteristics, precise location and time of the crash, weather conditions,
and collisions diagrams. The current dataset does not allow for detailed statistical analysis to establish
correlations between different risk factors such as young drivers, driving under the influence of alcohol,
driving during the night, driver fatigue, driver distraction (mostly due to using of mobile phones),
and several other road- and vehicle-related risk factors. The present crash record also lacks precise
coordinates data, which is vital in identifying high-risk locations/road segments. Standard road safety
data collection and analysis mechanisms are also poor, showing a lack of seriousness toward savingInt. J. Environ. Res. Public Health 2020, 17, 157 17 of 23
human lives, valuable property, and infrastructure, as well as improving overall safety situations on
national roads.
6.2. Legislation and Enforcement
Legislation and strict enforcement can significantly help in improving road safety situations [76,
87–89]. Presently, legislation regarding different driving laws, including seatbelt law, helmet use for
motorcyclists, and speed limit law, exists across all major cities. However, legislation on child restraint
law, on-street parking, and compliance with some traffic control regulations needs to be enforced
immediately. A low level of enforcement abrogates the efforts made through legislation to enhance
road safety. The government has increased fines for violating red signals and the use of mobile phones
while driving, which is encouraging in terms of restoring and maintaining road safety. The most
critical challenge is to enforce the speed limit among young drivers aged 21 and younger, who are
found to be the most frequent violators [37].
6.3. Safety Education Programs and Awareness Campaigns
Safety education programs and awareness campaigns are less frequent and below standards,
despite the prevailing critical road safety in the KSA. These programs and campaigns have been found
to be extremely vital in enhancing road safety situations worldwide [90–92]. Thus, the regional traffic
departments in the KSA should provide low-cost safety education programs focusing on traffic safety
issues such as compliance with national driving laws, drunk driving, speeding, mobile phone use,
and any other type of distraction. Similarly, awareness campaigns for road safety in public should
be initiated through seminars, TV, radio, traffic police, and pamphlet distribution. Safety awareness
campaigns can be designed to target a specific group, for example, the young drivers in the KSA
context that are mostly involved in road crashes. Safety education programs and awareness campaigns,
together with strict enforcement of laws, are believed to increase road safety considerably.
6.4. Induction of Traffic and Speed Calming Measures
Traffic calming measures are designed to improve safety for motorists, cyclists, and pedestrians.
Traffic calming measures including speed bumps, speed humps, raised crosswalks, and safety islands,
among other forms, helping to control speed and regulate traffic. Erecting these various measures has
been found to be quite useful in promoting road safety [93–96]. During the analysis for the current
study, it was observed that the majority of crashes in the Eastern Province occurred near intersections
with improper speed calming measures. It is also recommended that channelization at intersections is
provided that can reduce the number of conflict points without significantly reducing the approach
speeds. Similarly, lack of appropriate access control on freeways and other major highways can
negatively affect the traffic operations, as randomly located entry and exit points lead to an abrupt
reduction in speed, impedance to traffic flow, and inefficient use of traffic capacity. Providing suitable
traffic calming measures on the entrance and exit ramps can be beneficial in raising the safety levels.
6.5. Emergency Medical Care Units for Victims
The first hour after a crash has occurred is commonly referred to as “golden hour” [97,98],
during which if the victim receives proper first aid, the chances of survival and reduction in severities
of other injuries are high. Unfortunately, current system for emergency medical care of crash victims in
KSA is lagging international standards. An emergency medical care unit solely dedicated to crash
victims should be built, as it was mentioned previously that more than four injuries happen every hour
on national roads [27]. Small scale medical care units should be located on busy roads for preliminary
treatment. It is recommended that response time for ambulances should be minimized, and trained
health personnel should accompany the crash victims in shifting and transporting to nearby healthcare
units. It has been observed that the most common cause of fatalities post-crash is oxygen breakdown.
Thus, the first aid crew arriving first at the scene should be provided with oxygen. One recent studyInt. J. Environ. Res. Public Health 2020, 17, 157 18 of 23
conducted in Tabuk, KSA, indicated that pre-hospital care for crash victims could be enhanced using
mobile phone smart technologies by proper coordination with nearby available facilities/services [99].
6.6. Rigorous Identification and Treatment of Crash Hotspots
Crash hotspots may be defined as road segments and locations that have an unusually high
concentration of crashes than expected [100]. Current crash data lack precise coordinates for the crash
location, which makes it difficult to identify crash hotspots. Several previous studies have suggested
that accurate identification of crash hotspots is the first and key step towards effective highway safety
management process through the adoption of appropriate counter-measures [101–105]. Error in the
process may lead to inefficient use of resources and thus hindering the national goals of achieving
the desired road safety targets. For the KSA scenario, it is recommended that traffic police personnel
and crew who first arrive at the crash scene should be equipped with high-quality global positioning
system (GPS) devices to record the exact coordinates of such spots. This location data can be used
later on for the analysis of crash hotspots. The common feature of these crash hotspots is either
that these locations are geometrically deficient or that drivers make mistakes at these sites due to
information overload. After the crash hotspots are identified, priorities are established and are treated
with suitable counter-measures.
6.7. Engagement and Coordination of Key Stakeholders
Effective engagement and coordination of concerned stakeholders are vital factors for mitigating
crash severity. At present, there is low-level coordination between the traffic police department and
emergency treatment units. It is recommended that this coordination between different parties, that is,
police, ambulance services, emergency healthcare units, and hospitals, be made efficient. This will
ensure minimal possible time for shifting and transporting crash victims, and thus several precious
lives may be saved, whereas for others, injury severity may be mitigated.
7. Conclusions
This study presents an overview of road traffic crashes in the Eastern Province, KSA, from 2009 to
2016. A total of 30,520 crashes were reported that resulted in a total of 9113 fatalities and 44,298 injuries
(both major and minor) during this period. Descriptive statistics and spatial distribution pertaining to
the crashes were presented. The results suggest that between 2012 and 2014, the number of crashes
was the highest. When analyzing monthly crash patterns, January, July, and December generally had
the highest number of crashes, whereas September, October, and June witnessed a low frequency of
crashes. Distribution by cities showed that Al-Ahsa had the highest proportion of crashes, whereas
Khafji had the lowest in the study period. It was also found that the fatality index for the entire Eastern
Province was 25.4, whereas the mean annual crash to injury ratio was 8:4. The present study revealed
that some of the predominant causes of crashes include over-speeding, sudden lane change, driver
distraction, sleeping, and keeping an inadequate safe distance. The logistic regression analysis results
showed that sleeping; distractions; speeding; collisions with moving vehicles, road fences, pedestrians,
and motorcyclists; and rainy weather conditions were some of the significant factors contributing to
crash severity. To mitigate the huge socio-economic burden of traffic crashes suffered annually, different
potential crash prevention strategies, for instance, traffic enforcement, traffic calming measures, safety
education programs, and coordination of key stakeholders, have been proposed.
This study had several limitations that should be acknowledged. First, data utilized in the study
had minimal demographic and socio-economic characteristics of the drivers, which is an important
aspect. The geographic coordinates were also not available for all the crash locations, and, therefore,
they were not useable for any geospatial analysis in the study. Second, detailed information pertaining
to property damage was not available in the dataset. Finally, the number of deaths recorded in the
database was only for victims who passed away at the crash scenes. It is possible that victims were
taken to hospital and died later. However, their deaths were not recorded in the accident database withInt. J. Environ. Res. Public Health 2020, 17, 157 19 of 23
the Dammam Traffic Department. Future studies should focus on resolving some of these limitations
by utilizing further detailed data to detect other possible patterns of vehicle crashes in the province.
Studies should also focus on using advanced geospatial (i.e., hotspot analysis) and artificial intelligence
techniques, including deep machine learning, game theory, and artificial neural network (ANN),
among other techniques, for modeling the severity of crashes. Finally, they should also examine crash
patterns for other provincial cities.
Author Contributions: Conceptualization, A.J. and M.T.R.; methodology, A.J., M.T.R., and U.M.; formal analysis,
A.J. and U.M., data curation, H.M.A.-A., A.J., and M.T.R.; writing—original draft preparation, A.J.; writing—review
and editing, A.J. and M.T.R.; supervision, H.M.A.-A. and M.T.R. All authors have read and agreed to the published
version of the manuscript.
Funding: This research received no external funding.
Acknowledgments: The authors acknowledge and appreciate the support provided by King Fahd University of
Petroleum and Minerals (KFUPM) for providing all the necessary support and assistance during the execution
period of this study. The authors would also like to thank the City of Dammam’s Traffic Police Department for
providing the data utilized in the study.
Conflicts of Interest: The authors declare no conflict of interest.
References
1. International Transport Forum (ITF). Road Safety Annual Report; International Transport Forum (ITF):
Organization for Economic Cooperation and Development (OECD): Paris, France, 2018.
2. World Health Organization. Global Status Report on Road Safety; World Health Organization: Paris, France,
2018.
3. World Health Organization. Global Status Report on Road Safety; World Health Organization: Geneva,
Switzerland, 2015.
4. Elizabeth Kopits, M.C. Traffic fatalities and economic growth. Accid. Anal. Prev. 2005, 37, 10.
5. Murray, C.J.; Lopez, A.D. Mortality by cause for eight regions of the world: Global Burden of Disease Study.
Lancet 1997, 349, 8. [CrossRef]
6. Irfanullah, I.; Jamal, A.; Subhan, F. Public perception of autonomous car: A case study for Pakistan.
Adv. Transp. Stud. 2019, 49, 145–154.
7. Rolison, J.J.; Regev, S.; Moutari, S.; Feeney, A. What are the factors that contribute to road accidents? An
assessment of law enforcement views, ordinary drivers’ opinions, and road accident records. Accid. Anal.
Prev. 2018, 115, 11–24. [CrossRef] [PubMed]
8. Abdel-aty, M.A.; Radwan, A.E. Modeling traffic accident occurrence and involvement. Accid. Anal. Prev.
2000, 32, 633–642. [CrossRef]
9. Ayinla, T.; Sarah, A.; Olusegun, S.; Olugbenga, J. Factors Influencing High Rate of Commercial Motorcycle
Accidents in Nigeria. Am. Int. J. Contemp. Res. 2012, 2, 130–140.
10. Cafiso, S.; di Graziano, A.; di Silvestro, G.; la Cava, G.; Persaud, B. Development of comprehensive accident
models for two-lane rural highwaysusing exposure, geometry, consistency and context variables. Accid.
Anal. Prev. 2010, 42, 8. [CrossRef]
11. Chen, C.; Zhang, G.; Liu, X.C.; Ci, Y.; Huang, H.; Ma, J.; Chen, Y.; Guan, H. Driver injury severity outcome
analysis in rural interstate highway crashes: A two-level Bayesian logistic regression interpretation. Accid.
Anal. Prev. 2016, 97, 10. [CrossRef]
12. Haddon, W. Advances in the Epidemiology of Injuries as a Basis for Public Policy. Landmarks Am. Epidemiol.
P 1980, 95, 411–421.
13. Haghighi, N.; Liu, X.C.; Zhang, G.; Porter, R.J. Impact of roadway geometric features on crash severity on
rural two-lane highways. Accid. Anal. Prev. 2018, 111, 34–42. [CrossRef]
14. López, G.; Mujalli, R.; Calvo, F.J.; de Oña, J. Analysis of traffic accidents on rural highways using Latent
Class Clustering and Bayesian Networks. Accid. Anal. Prev. 2013, 51, 1–10.
15. Lord, D.; Manar, A.; Vizioli, A. Modeling crash-flow-density and crash-flow-V/C ratio relationships for rural
and urban freeway segments. Accid. Anal. Prev. 2005, 37, 185–199. [CrossRef] [PubMed]Int. J. Environ. Res. Public Health 2020, 17, 157 20 of 23
16. Ojo, A.L. Assessement of Human Factors as Determinants of Road Traffic Accidents among Commercial
Vehicle Drivers in GbonyinLocal Government Area of Ekiti State, Nigeria. IOSR J. Res. Method Educ. 2015, 5,
69–74.
17. Abdel-aty, M.A. Analysis of driver injury severity levels at multiple locations usingordered probit models.
J. Saf. Res. 2003, 34, 7. [CrossRef]
18. Jonathan Aguero-Valverde, P.P.J. Spatial analysis of fatal and injury crashes in Pennsylvania. Accid. Anal.
Prev. 2006, 38, 8. [CrossRef]
19. WHO. World Report on Road Traffic Injury Prevention; WHO: Geneva, Switzerland, 2004.
20. Jafarpour, S.; Rahimi-movaghar, V. Determinants of risky driving behavior: A narrative review. Med. J. Islam.
Repub. Iran 2014, 28, 1–8.
21. Ernstberger, A.; Joeris, A.; Daigl, M.; Kiss, M.; Angerpointner, K.; Nerlich, M.; Schmucker, U. Decrease of
morbidity in road traffic accidents in a high income country—An analysis of 24,405 accidents in a 21 year
period. Injury 2015, 46, S135–S143. [CrossRef]
22. Longthorne, A.; Rajesh Subramanian, C.-L.C. An Analysis of the Significant Decline in Motor Vehicle Traffic
Fatalities in 2008; National Highway Traffic Safety Administration, (NHTSA): Washington, DC, USA, 2010.
23. Cuomo, A.M.; Egan, T.L.; Commissioner, E.D. Highway Safety Strategic Plan; Newyork State Department of
Transportation (NYDOT): New York, NY, USA, 2019.
24. Rahman, M.T.; Planning, R. Land Use and Land Cover Changes and Urban Sprawl in Riyadh, Saudi Arabia:
An Analysis Using Multi-Temporal Landsat Data and Shannon’s Entropy Index. Int. Arch. Photogramm.
Remote Sens. Spat. Inf. Sci. 2016, XLI-B8, 1017–1021.
25. Traffic, G.D. Annual Traffic Report; Ministry of Interior (MOI): Riyadh, Saudi Arabia, 2013.
26. Mohamed, H.A. Estimation of Socio-Economic Cost of Road Accidents in Saudi Arabia: Willingness-To-Pay
Approach (WTP). Adv. Manag. Appl. Econ. 2015, 5, 19.
27. Al Turki, Y.A. How can Saudi Arabia use the Decade of Action for Road Safety to catalyse road traffic injury
prevention policy and interventions? Int. J. Inj. Contr. Saf. Promot. 2014, 21, 397–402. [CrossRef]
28. Ansari, S.; Akhdar, F.; Mandoorah, M.; Moutaery, K. Causes and effects of road traffic accidents in Saudi
Arabia. Public Health 2000, 114, 37–39. [CrossRef]
29. Ageli, M.M.; Zaidan, A.M. Road Traffic Accidents in Saudi Arabia: An ADRL Approach and Multivariate
Granger Causality. Int. J. Econ. Financ. 2013, 5, 26–31. [CrossRef]
30. Alghnam, S.; Alrowaily, M.; Alkelya, M.; Alsaif, A.; Almoaiqel, F.; Aldegheishem, A. The prevalence of
seatbelt and mobile phone use among drivers in Riyadh, Saudi Arabia: An observational study. J. Saf. Res.
2018, 66, 33–37. [CrossRef] [PubMed]
31. Bendak, S. Seat belt utilization in Saudi Arabia and its impact on road accident injuries. Accid. Anal. Prev.
2005, 37, 367–371. [CrossRef] [PubMed]
32. Ghaffar, U.B.; Ahmed, S. A Review of Road traffic accident in Saudi Arabia: The neglected epidemic. Indian
J. Forensic Community Med. 2015, 2, 242. [CrossRef]
33. Bener, A.; Jadaan, K.S. A perspective on road fatalities in Jeddah, Saudi Arabia. Accid. Anal. Prev. 1992, 24,
143–148. [CrossRef]
34. Mohamed, M.; Bromfield, N.F. Attitudes, driving behavior, and accident involvement among young male
drivers in Saudi Arabia. Transp. Res. Part F Traffic Psychol. Behav. 2017, 47, 59–71. [CrossRef]
35. Ratrout, N.T.; Chowdhury, S.; Gazder, U.; Rahman, S.M. Characterization of crash-prone drivers in Saudi
Arabia—A multivariate analysis. Case Stud. Transp. Policy 2017, 5, 134–142. [CrossRef]
36. Memish, Z.A.; Jaber, S.; Mokdad, A.H.; AlMazroa, M.A.; Murray, C.J.; Al Rabeeah, A.A. Burden of Disease,
Injuries, and Risk Factors in the Kingdom of Saudi Arabia, 1990–2010. Prev. Chronic. Dis. 2014, 11, E169.
[CrossRef]
37. Mansuri, F.A.; Al-Zalabani, A.H.; Zalat, M.M.; Qabshawi, R.I. Road safety and road traffic accidents in Saudi
Arabia: A systematic review of existing evidence. Saudi Med. J. 2015, 36, 418–424. [CrossRef]
38. Alghnam, S.; Towhari, J.; Alkelya, M.; Alsaif, A. The Association between Mobile Phone Use and Severe
Traffic Injuries: A Case-Control Study from Saudi Arabia. Int. J. Environ. Res. Public Health 2019, 16, 11.
[CrossRef] [PubMed]
39. Ministery of Interior (MOI). Statistical Yearbook; Ministery of Interior (MOI): Riyadh, Saudi Arabia, 2019.
40. Traffic, G.D. Number of of registered vehicles In The Kingdom By Region. General Authority for Statistics:
Riyadh, Saudi Arabia, 2018.You can also read