A multi hazard map based flooding, gully erosion, forest fires, and earthquakes in Iran
←
→
Page content transcription
If your browser does not render page correctly, please read the page content below
www.nature.com/scientificreports
OPEN A multi‑hazard map‑based
flooding, gully erosion, forest fires,
and earthquakes in Iran
Soheila Pouyan1, Hamid Reza Pourghasemi1*, Mojgan Bordbar2, Soroor Rahmanian3 &
John J. Clague4
We used three state-of-the-art machine learning techniques (boosted regression tree, random forest,
and support vector machine) to produce a multi-hazard (MHR) map illustrating areas susceptible
to flooding, gully erosion, forest fires, and earthquakes in Kohgiluyeh and Boyer-Ahmad Province,
Iran. The earthquake hazard map was derived from a probabilistic seismic hazard analysis. The mean
decrease Gini (MDG) method was implemented to determine the relative importance of effective
factors on the spatial occurrence of each of the four hazards. Area under the curve (AUC) plots, based
on a validation dataset, were created for the maps generated using the three algorithms to compare
the results. The random forest model had the highest predictive accuracy, with AUC values of 0.994,
0.982, and 0.885 for gully erosion, flooding, and forest fires, respectively. Approximately 41%, 40%,
28%, and 3% of the study area are at risk of forest fires, earthquakes, floods, and gully erosion,
respectively.
Hazard can be defined as a source of potential harm, a threat to natural environments, and human health. The
causes of natural hazards may be geological (e.g., earthquakes, tsunamis, landslides, volcanic eruptions, etc.)
and climatic (e.g., floods, windstorms, droughts, and wildfires)1. Many parts of the world are at risk from one or
more natural hazards, and although many studies have focused on single hazards, there is a need for integrated
assessments of multi-hazards for more efficient land m anagement2. The concept of multi-hazards was introduced
by the United Nations Environment Programme through its policies on sustainable development and its call for
"comprehensive investigation of multi-hazards" to plan and manage residential areas prone to natural disasters3.
Damage from natural disasters is increasing worldwide, providing an impetus to hazard researchers to develop
new tools to reduce economic losses and injuries from future disasters. These tools include multi-hazard maps
created using machine learning tools that show the spatial distribution of the full spectrum of hazards in a
region2. Examples of areas where such multi-hazard evaluations have been performed include Greece (flooding
depth, lateral erosion, earthquakes, and landslides)4, the United States (weather and climate hazards)5, Sikkim
State, India (landslide and earthquake)6, the Adriatic Sea (smothering and sealing, abrasion and extraction,
underwater noise, sea surface temperature variation, and sea surface salinity variation)7, and Chile (weather-
related hazards, including coastal flooding, fluvial flooding, water scarcity, heat stress, and wildfire)8. The inter-
action of these multi-hazards could be useful for further research in this field. Previous studies have shown that
landslides and flash floods are natural hazards that are frequently triggered simultaneously due to heavy or pro-
longed rainfall on steep mountains9. In other words, heavy rainfall causes flash floods that can lead to soil erosion
and landslide e vents10. For instance, in April 2019, heavy rainfall had a significant effect on the whole of Iran,
which caused far-reaching flooding and landslides11. Furthermore, landslides lead to seismic derangement. In
addition, seismic derangement may cause landslides, leading to many victims around the world. Slides can cause
catastrophic flooding, especially when landslide dams are broken, and flooding can cause slides12. Temporary
soil flooding at different scales can significantly affect soil degradation. Floods on slopes in ground flow, sheet
flow, return flow, groundwater ridge, etc., are connected to soil erosion and landslide occurrence. Floodwater
combined with saturated status may destroy soil structure and soil organisms (https://www.recare-hub.eu/soil-
threats/floods-and-landslides). Moreover, forest fires can significantly alter vegetation, increase soil erosion, and
1
Department of Natural Resources and Environmental Engineering, College of Agriculture, Shiraz University,
Shiraz 71441‑65186, Iran. 2Department of GIS/RS, Faculty of Natural Resources and Environment, Science and
Research Branch, Islamic Azad University, Tehran, Iran. 3Quantitative Plant Ecology and Biodiversity Research
Lab, Department of Biology, Faculty of Science, Ferdowsi University of Mashhad, Mashhad 9177948974,
Iran. 4Department of Earth Sciences, Simon Fraser University, 8888 University Drive, Burnaby, BC V5A 1S6,
Canada. *email: hr.pourghasemi@shirazu.ac.ir
Scientific Reports | (2021) 11:14889 | https://doi.org/10.1038/s41598-021-94266-6 1
Vol.:(0123456789)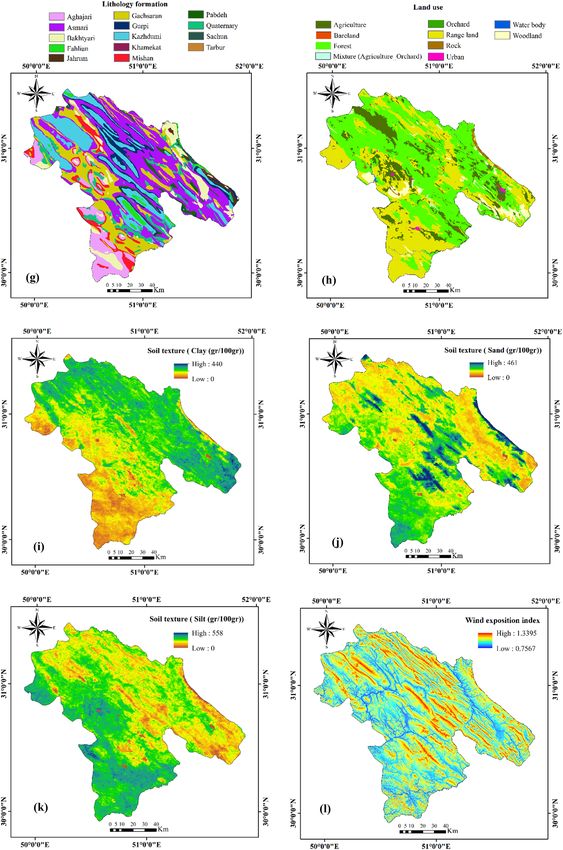
www.nature.com/scientificreports/
even lead to d esertification13. Admittedly, forest fires significantly impact physical, chemical, mineralogical, and
biological soil features, which trigger soil erosion. Severe bushfires (i.e., wildfires) harm soil p roperties14. On the
15
other hand, gully erosion influences soil structure, quality, and soil p roperties .
Much of Iran is at high risk of earthquakes, floods, forest fires, and gully e rosion16–18. Forest fires, for example,
are a major cause of ecosystem damage and large economic losses19, 20. The forests of Kohgiluyeh and Boyer-
Ahmad Province in southwestern Iran are particularly vulnerable to forest fires, providing a motivation for the
choice of this area for our study. Maps that show areas at high risk from wildfires help managers and planners
to deal with this p roblem21, 22.
Flooding is another serious hazard in Kohgiluyeh and Boyer-Ahmad Province and has been exacerbated in
recent decades by deforestation, land use changes, poor watershed management, and climate c hange23. Floods
have adversely affected more people than any other natural disaster type in the twenty-first century, including
127 events of differentiated natural disasters in 2 01824. One such flood caused widespread damage in Iran in
March and April 2019. Recurrent floods in Kohgiluyeh and Boyer-Ahmad Province inundated riverside areas,
leading to soil erosion, damaged or destroyed earth and concrete dams, other watershed structures, and bridges.
Identifying areas at risk25 and preparing flood hazard maps are important activities in any proactive response
to this hazard26–29.
Gully erosion is an important cause of soil loss and land degradation in arid and semi-arid regions in Iran and
elsewhere world30, 31. Maps showing where this problem exists or might develop in the future are effective tools
for decision makers concerned with sustainable development. In many instances, gully erosion maps have been
prepared individually based on datasets in GIS s oftware5, 32, 33. In the present study, gully erosion is considered
an element of the multi-hazard spectrum hazards in the Kohgiluyeh and Boyer-Ahmad Province.
The high Zagros Mountains throughout the north, east, and southeast of Kohgiluyeh and Boyer-Ahmad Prov-
ince is located, experience frequent earthquakes. Although it is not possible to accurately predict future earth-
quakes in the province, it is possible to determine the likely locations that will suffer damaging ground motions.
Our multi-hazard study in Kohgiluyeh and Boyer-Ahmad Province involved (1) identifying and prioritizing
the factors affecting the occurrence of each natural hazard in the region; (2) preparing maps of flood, gully ero-
sion, forest fires, and earthquake hazards separately using three machine learning algorithms (boosted regres-
sion tree, support vector machine, and random forest); (3) comparing the results of the three algorithms with
the ROC curve to select the best regional hazard model; and (4) preparing a multi-hazard map of the province.
Our research contributes to the development and assessment of machine learning methods for mapping natural
hazard zones. To the authors’ knowledge, no work in the literature related to the multi-hazard spatial modeling
of floods, gully erosion, forest fires, and earthquakes exists to date. Moreover, for the first time, this work was
carried out mentioned hazards mapping in the Kohgiluyeh and Boyer-Ahmed province. In addition, based on
the available data and sources, the SVM, BRT, and RF algorithms were used to investigate the hazards in the
study area.
Results
Priority of effective factors using random forest and MDG. Figure 1 shows the results of the prior-
itization of factors for the three hazards using the RF technique. The most important factor is elevation, followed
by decreasing order of importance of flooding by mean annual rainfall, distance from roads, slope, land use,
TWI, NDVI, drainage density, plan curvature, distance from rivers, lithology, and aspect (Fig. 1a).
Based on the MDG analysis, temperature is the most important factor for forest fire hazards, followed by
mean annual rainfall, elevation, distance from roads, distance from villages, NDVI, slope, WEI, distance from
rivers, TWI, and aspect (Fig. 1b). Mean annual rainfall is the most important factor for gully erosion, followed by
elevation, clay, silt, lithology, drainage density, distance from roads, NDVI, TWI, sand, land use, slope, distance
from rivers, plan curvature, profile curvature, and aspect (Fig. 1c).
Natural hazard susceptibility maps. In natural hazard studies, susceptibility is associated with the spa-
tial features of hazards. It is defined as the tendency of a region to experience the effects of a given hazardous
process (i.e., earthquakes, floods, forest fires, erosion, etc.) without considering the moment of event, fatality,
and economic l osses34. The RF, BRT, and SVM algorithms were applied to train the data, and susceptibility maps
were prepared for flood, forest fire, and gully erosion hazards. Flood hazard (FH) maps were created by applying
the RF (FHRF), SVM (FHSVM), and BRT (FHBRT) algorithms to the training dataset. Similarly, gully erosion
hazard (GEH) maps were generated from the training dataset using the same three algorithms (maps GEHRF,
GEHSVM, and GEHBRT), as were forest fire hazard (FFH) maps (FFHRF, FFHSVM, and FFHBRT).
Natural hazard maps prepared using the RF model (the best performance of the three models) are shown in
Fig. 2. In the case of the FHRF map (Fig. 2a), approximately 50.1%, 22.1%, 15.7%, and 12.1% of the study area
had low, moderate, high, and very high susceptibility to flooding, respectively. The FFHRF map (Fig. 2b) shows
that approximately 17.4% and 24.0% of the study area are, respectively, in the high and very high forest fire sus-
ceptibility classes, and 30.3% and 28.3% of the area had moderate and low susceptibility, respectively. Finally, the
GEHRF map (Fig. 2c) shows that 1.1% and 2.1% of the area has very high and high susceptibility to gully erosion,
respectively; the moderate and low susceptibility classes cover 4.4% and 92.4% of the province, respectively.
Peak ground acceleration map. Figure 3 shows the PGA map of the study area. The PGA values were
divided into three classes: low, moderate, and high. The PGA map shows that approximately 40%, 20.0%, and
39.6% of the area were in the low, moderate, and high classes, respectively.
Scientific Reports | (2021) 11:14889 | https://doi.org/10.1038/s41598-021-94266-6 2
Vol:.(1234567890)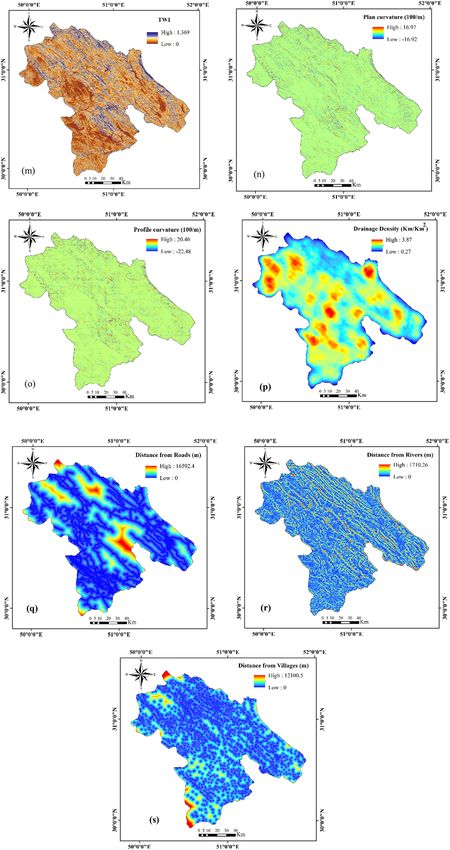
www.nature.com/scientificreports/
Figure 1. Priority of the effective factors for each hazard.
Validation and comparison of hazard maps using ROC. We validated the hazard maps using ROC
(Table 1). In the case of forest fire hazard, the random forest model performed best (AUC = 0.885), followed by
the support vector machine (AUC = 0.727) and boosted regression tree (AUC = 0.680) models. For gully erosion,
the AUC values for the random forest, support vector machine, and boosted regression tree maps are 0.994,
0.959, and 0.938, respectively. The AUC values for the flood hazard maps made using the random forest, sup-
port vector machine, and boosted regression tree algorithms are 0.982, 0.940, and 0.883, respectively (Table 1)
(Fig. 4).
Multi‑hazard map. The RF model was chosen to produce a multi-hazard map (MHR) of the study area
(Fig. 4). We combined maps of the four hazards (flood, forest fire, gully erosion, and earthquake) in the ArcGIS
10.8 environment (https://www.esri.com) using the following equation:
MHR = FFHRF + FHRF + GEHRF + PGA (1)
The multi-hazard map included 15 susceptibility classes (Fig. 5). Approximately 38% of the Kohgiluyeh and
Boyer-Ahmad Province is safe from all-natural hazards, whereas 0.7% of the region is susceptible to all four natu-
ral hazards. Percentages of the study area with individual or combinations of hazards are shown in Figs. 6 and 7.
Discussion
Many researchers have studied hazards individually35–39. Although such studies have been important and useful,
considering multiple hazards and their interactions, their interdependencies, and possible cascading effects can be
more informative and useful for reducing disaster losses, as well as for efficient land and ocean management4, 6, 40.
Scientific Reports | (2021) 11:14889 | https://doi.org/10.1038/s41598-021-94266-6 3
Vol.:(0123456789)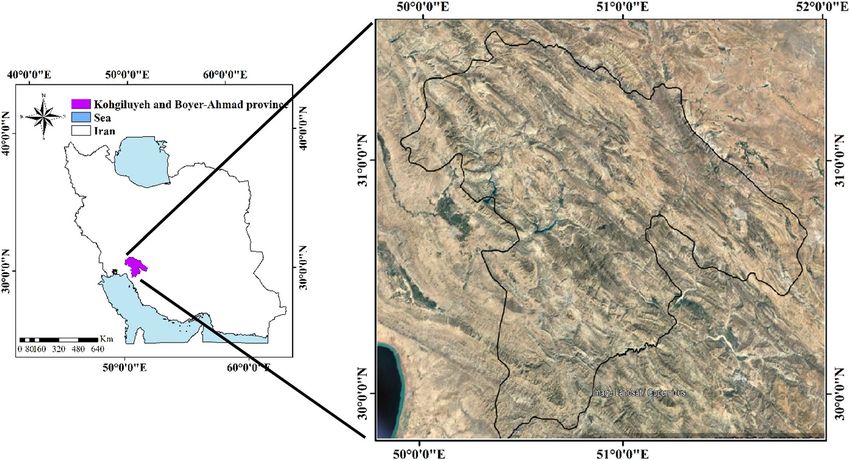
www.nature.com/scientificreports/
Figure 2. Hazard susceptibility maps of the study area produced using the RF model.
The motivation for our study was to provide (1) a comprehensive and integrated analysis of the full spectrum
of damaging natural hazards in Kohgiluyeh and Boyer-Ahmad Province, which is a risk-prone area in Iran,
and (2) a multi-hazard map useful to land-use and emergency response managers. Here, we discuss the factors
that drive each hazard and identify areas within the province that are susceptible to each phenomenon. We
also discuss the merits of the machine-learning algorithms used in this study. The benefits of machine learning
models include the use of dichotomous dependent variables as probabilities, the ability to use different types of
independent variables (i.e., binary, sequential, and continuous), and there is no need for normal distribution41.
Machine learning methods can solve uncertainty factors related to the dataset modeling process. Different learn-
ing machine algorithms can also be used to solve uncertainties related to the accuracy of the models. Another
source of uncertainty is the limitation of the training model, in which ML techniques such as RF do not face
these issues. This algorithm uses the error rate and an indicator outside the bag indicator. One of the benefits
accrued from machine learning techniques compared to traditional methods (i.e., bivariate and multivariate
statistical methods) is that ML algorithms can deal with noise related to the dataset and the uncertainty of the
dataset. Moreover, limited measurement errors are accurate42. However, the disadvantage of machine learning
methods is their vulnerability to overfitting data, which produces unstable regression c oefficients43. Therefore,
it is necessary to use different techniques to improve the accuracy of prediction results.
Each of these algorithms has advantages, but the results of the AUC-based assessment showed that the RF
algorithm has stronger predictive power than the BRT and SVM models. Other researchers have shown that (1)
the RF algorithm performs better than conventional m ethods44, (2) is a powerful supervised learning method
Scientific Reports | (2021) 11:14889 | https://doi.org/10.1038/s41598-021-94266-6 4
Vol:.(1234567890)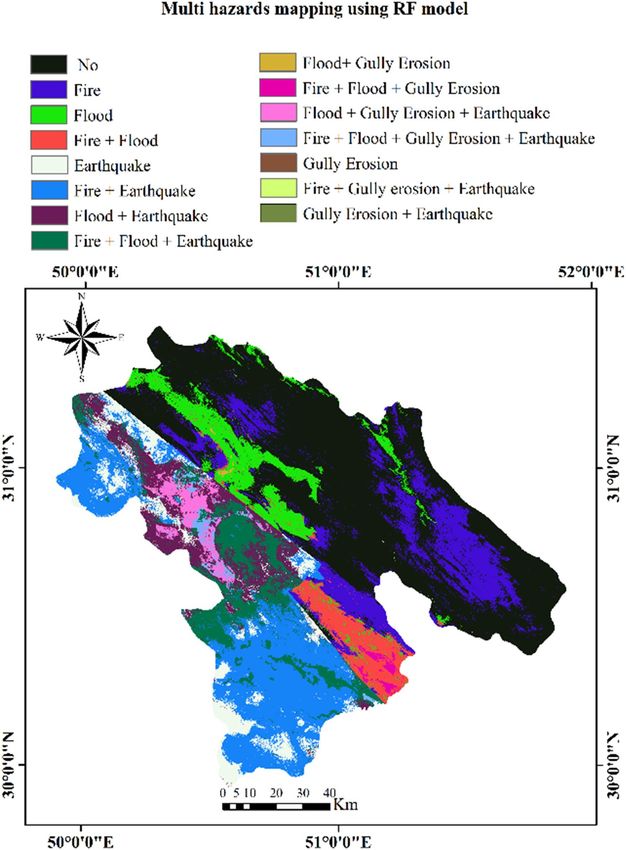
www.nature.com/scientificreports/
Figure 3. PGA map.
Models Forest fire Flood area Gully erosion
BRT 0.68 0.883 0.938
RF 0.885 0.982 0.994
SVM 0.727 0.94 0.959
Table 1. AUC values of hazard risk maps.
for investigating problems in the real w orld45, (3) is simple and fast, (4) does not require statistical hypotheses,
redictor46, 47. It has been widely used in a range of environmental s tudies44, 48–52.
and (5) is a reliable p
The FFHRF map shows that the southern, western, and eastern parts of the Kohgiluyeh and Boyer-Ahmad
Province are most susceptible to forest fires, and the northern and central areas have low to moderate wildfire
susceptibility. The FHRF map shows flood susceptibility to be high to very high in the western and southeastern
parts of the province and low to moderate s in the north and east. According to the GEHRF map, high to very
high gully erosion susceptibility is restricted to a small area in the western part of the province. Finally, the PGA
map shows that the southern and western parts of the province are highly susceptible to damaging earthquakes,
whereas this hazard is low elsewhere.
In this study, we evaluated the relative importance of factors affecting flood, forest fire, and gully erosion
using the random forest method. This method reliably determines the relative importance of controlling factors
in hazard susceptibility applications53. Using the MDG method, we found that the annual temperature is the
most important factor in predicting forest fire susceptibility, whereas elevation and mean annual precipitation
are most important in the case of flood and gully erosion hazards. Aspect proved to be the least important factor
for all three hazards. There is no specific aspect that favors forest fires; it occurs on all forested slopes in the study
area. However, forest fires are common near residential areas and roads, where most fires are initiated. Elevation
is also important because it has a strong effect on rainfall and temperature. Our map of areas susceptible to for-
est fires may be useful to forest managers and emergency responders who must plan and implement necessary
measures to protect and preserve the remaining forest in high-risk areas.
Researchers used the RF method in a forestry study in China and, like us, concluded that vegetation type,
slope, and aspect are less important than proximity to towns, temperature, and p recipitation54. Another research
group studied flood susceptibility along the Pearl River in China using the DMG method and concluded that
the most important factors for related flooding are maximum three-day precipitation, runoff depth, typhoon
frequency, elevation, and T WI55. In contrast, another group found that elevation is the most important flood risk
factor in their study a rea56, given that flooding was greatest along trunk rivers at low elevation.
Mean annual rainfall is one of the most effective factors in the formation and spread of gullies. This metric is
positively related to the volume and kinetic energy of surface runoff, which are the main factors involved in gully
erosion57. Lithology is an important factor in this process. One research group working in Ilam Province, Iran,
for example, found that the amount of clay in soil has a high positive correlation with gully erosion58.
In our analysis of earthquake hazards, we learned that magnitude and ground acceleration are the two most
important factors for estimating seismic risk. This finding is consistent with the results of other studies that have
performed similar studies40.
Scientific Reports | (2021) 11:14889 | https://doi.org/10.1038/s41598-021-94266-6 5
Vol.:(0123456789)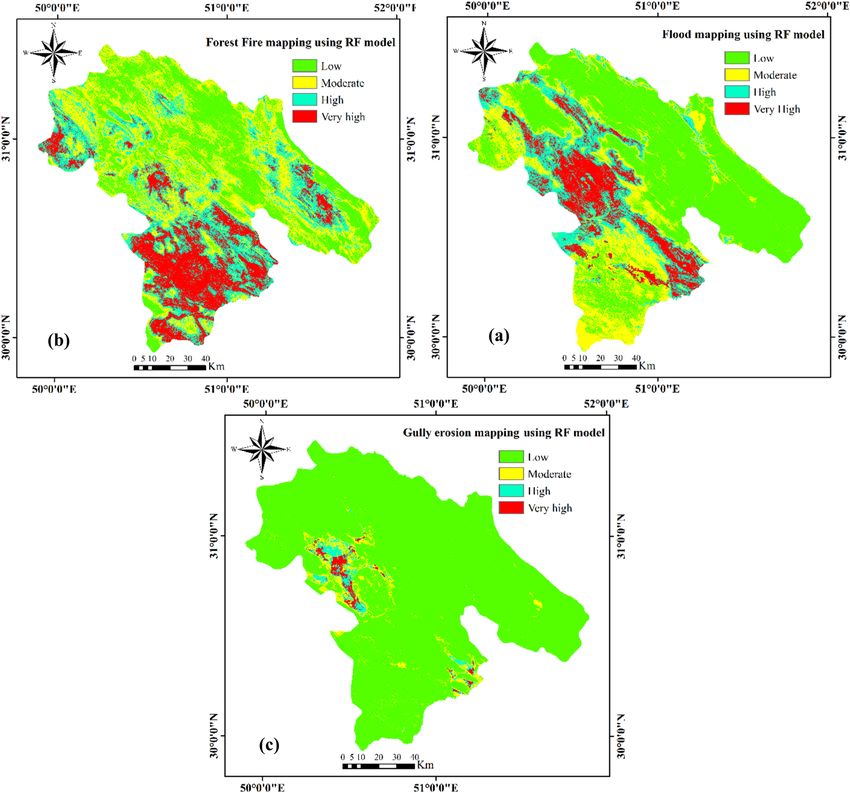
www.nature.com/scientificreports/

                                            Figure 4.  Validation of hazard maps using the ROC curve.

                                            Conclusion
                                            We used machine learning algorithms to map areas susceptible to multiple hazards in a part of Iran with a high
                                            risk of natural hazards. Identifying these areas is an important step in making sound management decisions to
                                            reduce damage and injury from natural hazards in the future. The final product of our work is a multi-hazard
                                            map created by combining four important natural hazards (i.e., flooding, forest fires, earthquakes, and gully
                                            erosion). Factors affecting each hazard were identified and prioritized, and maps of each hazard were created
                                            using the RF, BRT, and SVM algorithms. We determined the validity of the results using ROC plots and found
                                            that the RF model had the highest AUC value and thus accuracy. We then produced a multi-hazard map for
                                            the study area by combining the maps of the four hazards. This final map shows that approximately 38% of the
                                            province is safe from all four hazards. Areas where all four hazards are a concern are restricted to the southern
                                            part of the province. Of the four hazards, forest fires affected the largest percentage of the study area and gully
                                            erosion was the least. In line with the goals of sustainable development, the results of this research can be used
                                            by managers, planners, and other stakeholders as a decision-making tool to reduce future damage from natural
                                            hazards. The critical infrastructure in Kohgiluyeh and Boyer-Ahmad Province should be examined with the aim
                                            of minimizing future losses from forest fires, floods, earthquakes, and gully erosion.

          Scientific Reports |   (2021) 11:14889 |               https://doi.org/10.1038/s41598-021-94266-6                                                  6

Vol:.(1234567890)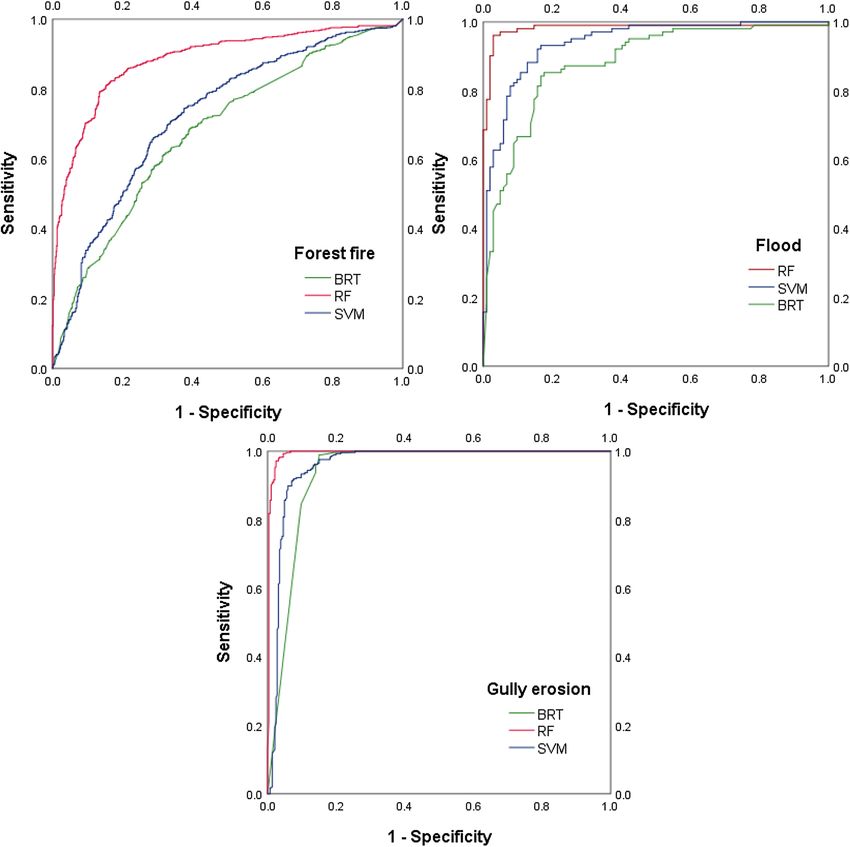
www.nature.com/scientificreports/
Figure 5. Multi-hazard map.
Methodology
Study area. Kohgiluyeh and Boyer-Ahmad Province is a 15,500 km2 area of a high mountainous region. Its
borders share with Fars, Khuzestan, Isfahan, and Bushehr provinces within the Chaharmahal-Bakhtiari prov-
ince, and the Zagros Mountains in southwest Iran (Fig. 8). It is located between 49° 53′ 00″ and 51° 53′ 00″ E lon-
gitudes and 29° 56′ 00″ and 31° 27′ 00″ N latitudes, and altitude from 109 to 4294 m, and has an average annual
rainfall of 550.7 mm and the average temperature is between 15 and 26 °C. Plains constitute approximately 20%
of province. The highest point in the province is Dena Mountain (4294 m above sea level); the lowest point is
in the southwest, in the city of Gachsaran, (109 m above sea level. The difference in elevation between the more
elevated northeastern part of the province and the southern and southwestern parts results in two different cli-
matic regimes. The former region is cooler and drier than the latter59.
Preparation of inventory maps. Based on experience and expert opinion, we consider the four main
hazards in the study area to be forest fires, flooding, earthquakes, and gully erosion. In this study, we identified
the locations of these four hazard types using Google Earth images and a field survey supported by a global posi-
Scientific Reports | (2021) 11:14889 | https://doi.org/10.1038/s41598-021-94266-6 7
Vol.:(0123456789)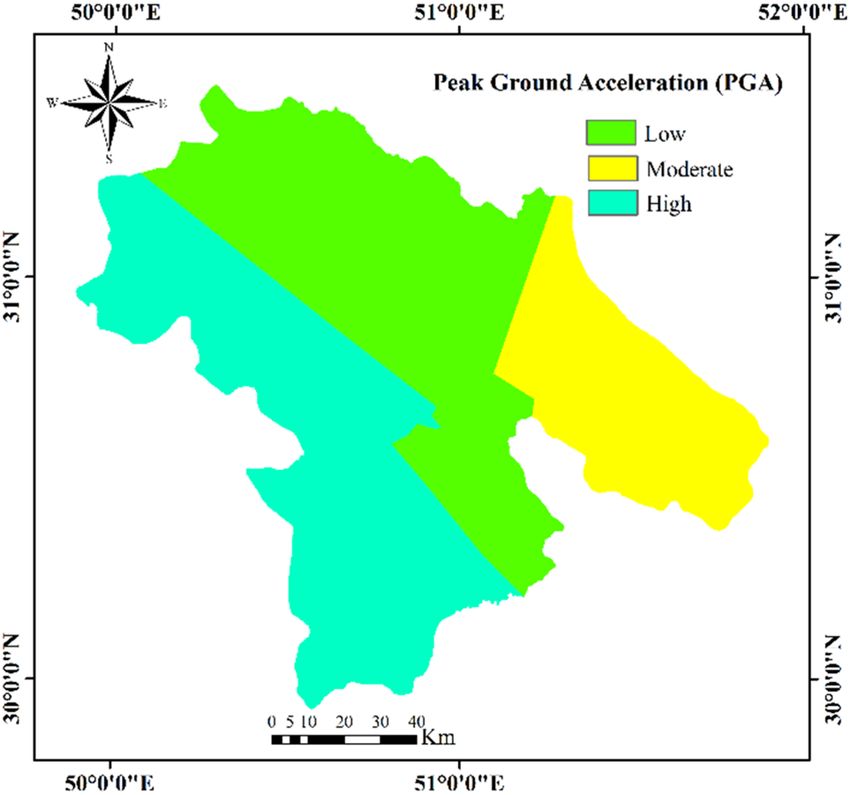
www.nature.com/scientificreports/
37.98
40.00
35.00
Multi- hazards
30.00
% Multi- hazards
25.00 16.88
20.00
11.53
15.00
7.84
10.00 6.40 6.38
5.84
4.00 1.90
5.00 0.72 0.42 0.07
0.03 0.01 0.00049
0.00
Multi- hazards types
Figure 6. Percentages of areas of hazard classes.
41.39
39.62
50.00
27.73 Hazard
40.00
% Hazard
30.00
20.00
3.15
10.00
0.00
Hazard
Figure 7. Percentage area of the four hazards.
tioning system (GPS). In this study, floods were investigated in 2000. Training and test data were prepared from
2000 to 2020. In addition, data from 2019 and 2020 were extracted using Sentinel satellite imagery. However, in
the article, we only mentioned the data for 2019 and 2020; therefore, more details were added. Areas affected by
these events were identified using the Google Earth Engine (GEE) and high-resolution Sentinel-1 and -3 images.
We identified forest fire locations for the period 2015–2020 based on the GEE images. The codes were written
in the GEE environment (https://earthengine.google.com). We randomly split the flood, gully erosion, and for-
est fire locations into two groups: a model training dataset with 70% of the locations, and a validation dataset
with 30% of the locations60. The earthquake map was created from the epicenters and magnitudes of historic
earthquakes provided by S.A.P. Consulting Engineers Co the Kohgiluyeh and Boyer-Ahmad Deputy Governor
of Planning (www.sabzandish.com).
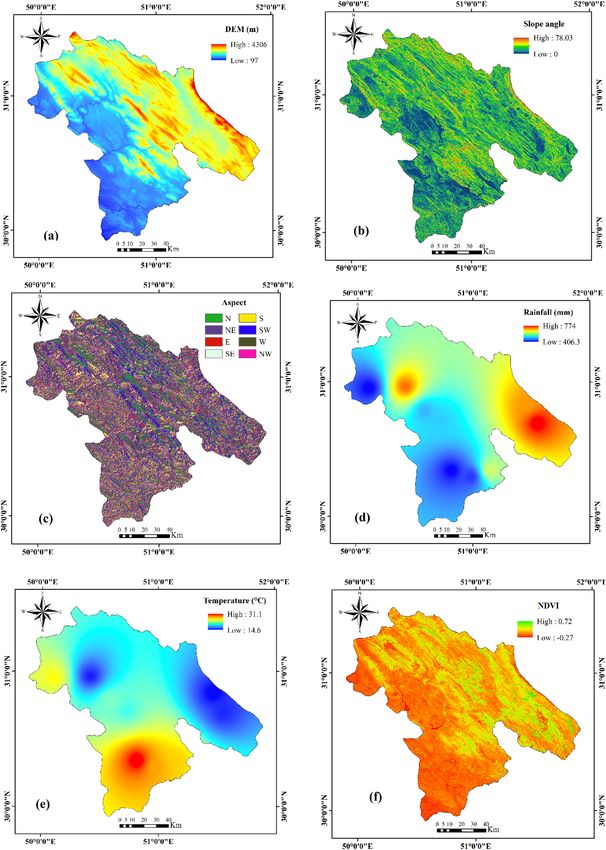
Effective factors for multi‑hazard assessment. The first step in mapping and assessing natural hazards
is to choose the appropriate control variables. Based on data availability and past e xperience61–66, we employed 19
effective factors in this study: elevation, slope, aspect, mean annual rainfall, mean annual temperature, lithology,
land use, normalized difference vegetation index (NDVI), soil texture (percent clay, silt, and sand), wind expo-
sure index, topographic wetness index (TWI), plan curvature, profile curvature, drainage density, distance from
Scientific Reports | (2021) 11:14889 | https://doi.org/10.1038/s41598-021-94266-6 8
Vol:.(1234567890)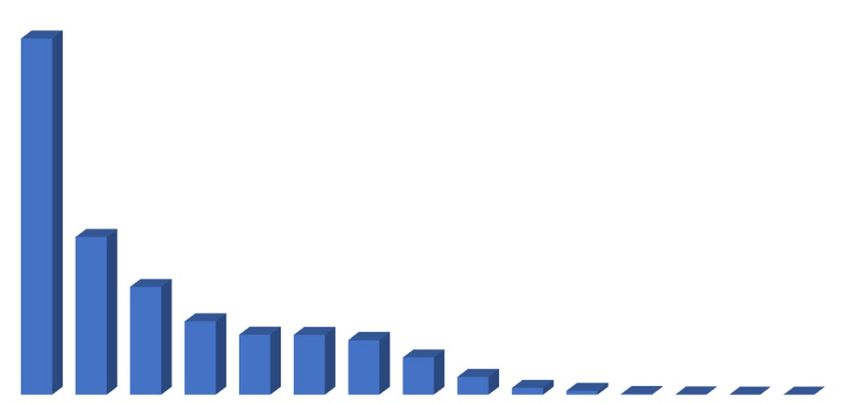
www.nature.com/scientificreports/
Figure 8. Location of the Kohgiluyeh and Boyer-Ahmad Province in Iran.
roads, distance from rivers, and distance from villages (Table 2). These factors were rasterized with a 30 × 30 m
pixel size in the ArcGIS 10.8 platform and are briefly described below.
Elevation. Elevation is widely used as a controlling factor in natural hazard assessments27, 67. In this study, we
used elevation factors in the preparation of flood, forest fire, and gully erosion maps. An elevation layer was
prepared from ASTER satellite images (https://earthexplorer.usgs.gov/) (Fig. 9a).
Slope angle. The slope angle is an important contributing factor in flooding, forest fires, and gully erosion68, 69.
In the case of forest fires, fire spreads more rapidly on steep slopes than on gentle ones70. In contrast, with all
other things being equal, the likelihood of flooding increases with a decrease in slope, and flat and gently sloping
ground in the study area is more prone to gully erosion than steep slopes58. A slope-angle layer was derived from
DEM in ArcGIS 10.8. The slopes ranged from 0° to 78° (Fig. 9b).
Slope aspect. Sunlight, humidity, and temperature are affected by slope aspect; thus, aspect can be an important
factor in the occurrence of floods, forest fires, and gully erosion. Eastern slopes in the study area receive sunlight
earlier than western aspects, and therefore are more fire-prone20. The slope aspect has also been shown to be
related to gully erosion through weathering m echanisms17, 71. We divided the aspect into nine classes: flat, north,
northeast, northwest, southwest, west, east, south, and southeast (Fig. 9c).
Rainfall. Rainfall has been widely used as a factor in multi-hazard spatial modelling17, 72. Low rainfall in for-
ested areas makes these areas susceptible to w ildfire72, 73, whereas extreme rainfall triggers flooding74 and gully
erosion58. We prepared a rainfall layer in the ArcGIS 10.8 using data for the period 2001–2020 from nine weather
stations in Kohgiluyeh and Boyer-Ahmad Province (Fig. 9d). A temperature map was obtained using the IDW
interpolation75, 76.
Temperature. All other things being equal, high temperatures, and a lack of rainfall rapidly dry soil, making
forests in environments prone to wildfire77. In the study area, temperature and humidity seem to be stronger
nes78. We produced an average annual tem-
controls for forest fires in higher parts of the province than lower o
perature layer based on climate data from nine stations during the period 2001–2020 (Fig. 9e). A rainfall map
was created through interpolation using the IDW method79.
Normalized difference vegetation index. The normalized difference vegetation index (NDVI) provides a meas-
ure of vegetation health80 and is thus an important factor in forest fire, gully erosion, and flood susceptibility
assessments. We calculated the NDVI from a Sentinel-2 satellite image in Google Earth Engine using the fol-
lowing equation:
NDVI = (NIR − RED)/(NIR + RED) (2)
Scientific Reports | (2021) 11:14889 | https://doi.org/10.1038/s41598-021-94266-6 9
Vol.:(0123456789)
www.nature.com/scientificreports/
Effective factor Flood Forest fire Gully erosion
Elevation * * *
Slope * * *
Aspect * * *
Mean annual rainfall * * *
Mean annual temperature *
Lithology * *
Land use * *
NDVI * * *
Soil texture (clay) *
Soil texture (silt) *
Soil texture (sand) *
Wind exposition index *
TWI * * *
Plane curvature * *
Profile curvature *
Drainage density * *
Distance from roads * * *
Distance from rivers * * *
Distance from villages *
Table 2. The effective factors for MHA.
where NIR and RED refer to the near-infrared and red bands, respectively (Fig. 9f).
Lithology. Rock permeability, which is related to lithology, may affect flood susceptibility28, 81–83 and gully
erosion5. We obtained a geology map from the Geological Survey of Iran and produced a layer of 14 units in the
ArcGIS 10.8 (Fig. 9g).
Land use. Land use changes, including deforestation and grazing, can initiate or exacerbate gully erosion30, 84–86,
nes71. Therefore, we considered land use
and bare lands are more susceptible to floods than naturally vegetated o
as a factor in the preparation of forest fire and flood maps. The land-use layer has 10 classes: agriculture, bare
land, forest, mixture (agriculture and orchard), orchard, range land, rocky land, urban, water body, and wood-
lands (Fig. 9h). The land use map (with an accuracy of 91% prepared by the support vector machine (SVM)
method) was obtained using the Landsat-8 (2019) satellite imagery.
Soil texture. A soil texture is considered one of the main factors in gully erosion87. We used data and guide-
lines provided by the World Soil Information Service (WoSIS, http://soilgrids.org) to prepare the soil layer in
the ArcGIS 10.8. The SoilGrids map is a global digital soil mapping system that employs new machine learn-
ing techniques to map the spatial distribution of soil properties. The SoilGrids maps are available with a spa-
tial resolution of 250 m. The SoilGrids maps are generated using more than 230,000 soil profile observations
from the WoSIS database and over 400 environmental layers of Earth observation and other environmental data
such as climate, land cover, and land morphology (https://www.isric.org/explore/soilgrids). The WoSIS database
includes typical soil features for each soil g roup88. We defined soil texture in the study area using three percent-
age classes as proxies: clay, silt, and sand (Fig. 9i,j,k).
Wind exposition index. The wind exposition index (WEI) is a non-dimensional index used to quantify wind
exposure at the land surface89. It takes into account the wind direction, angle of the surface earth to the horizon,
and wind aspect90. Values larger than 1 indicate wind-exposed cells, and values less than 1 correspond to wind-
shadowed cells91. WEI was computed from the DEM using the SAGA-GIS software (http://www.saga-gis.org/
en/index.html) (Fig. 9l).
Topographic wetness index. The topographic wetness index (TWI) is a measure of the likelihood that surface
water will move downslope92, 93 and is used in flood, forest fire, and gully erosion assessments. TWI was calcu-
lated from ASTER imagery using the SAGA GIS software (Fig. 9m).
Plan curvature. Plan curvature is the curvature of an isoline constructed from the junction of a horizontal
plane and the land surface94, 95. This factor was considered in flood and gully erosion evaluations. A plan curva-
ture layer was derived from the DEM using the spatial analysis extension (curvature tool) in ArcMap (Fig. 9n).
Scientific Reports | (2021) 11:14889 | https://doi.org/10.1038/s41598-021-94266-6 10
Vol:.(1234567890)www.nature.com/scientificreports/
Figure 9. Maps of hazard factors used in this study.
Scientific Reports | (2021) 11:14889 | https://doi.org/10.1038/s41598-021-94266-6 11
Vol.:(0123456789)www.nature.com/scientificreports/
Figure 9. (continued)
Scientific Reports | (2021) 11:14889 | https://doi.org/10.1038/s41598-021-94266-6 12
Vol:.(1234567890)www.nature.com/scientificreports/
Figure 9. (continued)
Scientific Reports | (2021) 11:14889 | https://doi.org/10.1038/s41598-021-94266-6 13
Vol.:(0123456789)www.nature.com/scientificreports/
Profile curvature. The profile curvature is a measure of the curvature of the slope surface. It controls surface
and groundwater movement, and thus is a metric for flow velocity and e rosion94, 96. The profile curvature layer
was constructed from the DEM in the ArcGIS 10.8 platform using a curvature tool (Fig. 9o). Negative and posi-
tive values indicate the concave and convex surfaces, respectively.
Drainage density. Drainage density (DD) is controlled by precipitation, geology, vegetation, slope, and soil,
and is a factor in gully erosion and flood assessments. Drainage density scales with runoff and therefore may be
an indicative factor for gully e rosion97, 98. The drainage density layer was created from the rivers and streams in
ArcGIS 10.8 using density tools (Fig. 9p).
Distance from roads. Distance from roads is important in flood, forest fire, and gully erosion assessments. In
forest areas, the risk of fire increases with proximity to r oads21, and gully erosion, especially in bare terrain, might
be related to this v ariable99. The distance from roads was quantified using vector line distances calculated using
the Euclidean distance method in ArcGIS 10.8 (Fig. 9q).
Distance from rivers. The probability of flooding is related to the distance from a river, especially for rivers with
low storage capacity100. In addition, most people in the study area live near rivers; thus, there is a higher likeli-
hood of forest fires in these areas101. Gully erosion in the study area is also the greatest near r ivers102. The distance
from the river layer was determined using the Euclidean distance tool in ArcGIS 10.8 (Fig. 9r).
Distance from villages. Distance from villages, such as distance from rivers, may be related to the probability of
forest fires, as most wildfire events are human-caused e vents103, 104. Figure 9s shows the distance from the village
layer produced in ArcGIS 10.8. This factor was not used in flood and gully erosion assessments.
Multi‑hazard spatial modelling. Boosted regression tree. The boosted regression tree (BRT) algorithm
is a machine learning method based on the use of classification and regression trees in combination with a boost-
ing algorithm105. Its purpose is to improve the performance of a single model by fitting and combining a large
number of models for p rediction106. It can be used to predict quantitative (regression tree) or categorized (clas-
sification tree) outcomes. In this study, the regression tree model is reinforced by assessing logical conditions,
rather than a linear relationship, to predict or classify landforms. When using the BRT model, there is no need to
predetermine the function forms or make statistical assumptions about the data distribution. Other advantages
include the ability to make multiple predictions and determine their possible nonlinear relationships with the
response variable107, the high speed of the model in analyzing large volumes of data, and its high capacity to
analyze and classify layers. The algorithm depends on the setting options related to the reinforced trees and tree
pruning. In the case of options related to reinforced trees, an important parameter is the reduction rate as a net
weight for individual and reinforced trees. Optimizing the best reduction rate is also important for preventing
overfitting of the predictions. Previous studies have shown that models with a reduction rate of 0.1 or less per-
form best108. The best parameters are selected based on an evaluation of their results using statistical evaluation
metrics (RMSE and bias). In this study, the regression trees were programmed using R 3.5.3 statistical software
(https://cran.r-project.org/bin/windows/base) with a BRT extension (see Elith et al.109 for details).
Support vector machine. The support vector machine (SVM) is a supervised learning method used for
classification and regression. It was proposed in 1995 based on statistical learning theory using structural risk
minimization110. It has been widely used in recent years as it performs better than older classification methods
such as perceptron neural networks111. The SVM classifier works by linearly classifying data; in segmenting the
data, it selects the most reliable boundary110. The closest samples to the decision boundary, which determine
the decision boundary equation, are termed support v ectors112. The principle of structural risk minimization is
applied to maximize the distance between two transient hyperplanes formed from support vectors113. SVM per-
forms better on non-modeled data than the experimental risk-minimization mode, which attempts to minimize
the training error. Four types of kernel functions (linear, polynomial, sigmoid, and radial basis) can be used to
prepare multi-hazard maps using the SVM algorithm. We used the radial basis function in this study because of
its better performance than other f unctions114–116. The SVM algorithm was programmed in the R3.5.3 statistical
software with the sdm package117.
Random forest. The random forest (RF) algorithm is a widely used hybrid machine learning algorithm that
includes regression and classification trees118. The data used by the RF algorithm do not need to be changed,
converted, or modified, and the algorithm controls the lost values automatically119. Random trees classify the
input vector with each tree in the forest; the output is the class tag that receives the majority of votes. Two factors
(the mean decrease in accuracy and the mean decrease in Gini) are used to determine the priority of the effect
of each effective f actor120. We implemented the RF model using the R3.5.3 statistical software with the random
forest package121.
Probabilistic seismic hazard analysis. Probabilistic seismic hazard analysis (PSHA) is a method used
to determine the probability that a location will experience severe ground movements during an earthquake
of a particular magnitude. The numerical-analytical method for PSHA was first proposed in 1968122 and has
improved since then. Relevant seismic parameters include earthquake magnitude, return period, epicentral and
source distances, and peak ground a cceleration123. Different scales are used to quantify seismic magnitude, such
Scientific Reports | (2021) 11:14889 | https://doi.org/10.1038/s41598-021-94266-6 14
Vol:.(1234567890)www.nature.com/scientificreports/
as moment, surface wave, volume wave, local, and torque magnitudes. One type of PSHA, the deterministic seis-
mic hazard analysis (DSHA), determines the maximum kinetic parameters of the ground surface in a scenario
earthquake, which is described by its magnitude and source distance124, 125. The scenario earthquake is expected
to produce the greatest ground motion, such as peak ground acceleration (PGA), at the site if it were to occur126.
We used this method to assess built structures whose destruction would have catastrophic consequences, such
as nuclear power plants and large dams. It does not provide information on the probability of a scenario earth-
quake, its exact location, or the duration of severe ground motions. Uncertainties in determining the magnitude
and source distance of an earthquake are typically combined to calculate the probability of exceedance of a
specified PGA in a certain period of time. In this study, a peak horizontal acceleration map was created for an
earthquake with a 10% probability of occurrence in 50 years (the time series 1965–2015) and an average return
period of 75 years127.
Multi‑hazard mapping. A multi-hazard map was constructed from the maps of flood hazard (FH), forest
fire hazard (FFH), gully erosion hazard (GEH), and peak ground acceleration (PGA). The BRT, SVM, and RF
algorithms were first used to create flood, gully erosion, and forest fire maps. Then, the results of the three algo-
rithms were compared to select the algorithm with the best performance. Next, a PGA map was produced using
PSHA. Each hazard was mapped using four groups—low, moderate, high, and very high—and subsequently
reclassified into two groups: 0 and 1. Class 1 indicates high to very high hazard susceptibility, whereas class 0
indicates low and moderate susceptibility. Finally, the two-class maps for three hazards (forest fire, flood, and
gully erosion) and the PGA map were integrated into a final multi-hazard map for the study area.
Model validation. Validation of multi-hazard models is required to evaluate their accuracy and v alue128. In
this study, we used the receiver operating characteristic (ROC) curve to assess the model’s predictive power. The
ROC plot has two axes: the x-axis depicts the false-positive rate and the y-the-true-positive rate. The value of the
area under the curve (AUC) ranges from 0.5 to 1.0129, 130, and the higher the AUC value, the greater the predic-
tion accuracy128, 131. A ROC curve was created for each map using both the training and validation datasets. As
mentioned previously, 70% of the hazard locations were used for model training and 30% for model validation.
Prioritizing effective factors. We employed the mean decrease accuracy (MDA) and mean decrease Gini
(MDG) to determine the priority factors for natural hazard occurrences in the study area. The variance infla-
tion factor (VIF) and tolerance coefficient (TOL) were first computed to check for multicollinearity. Variables
with values of VIF ≥ 5 and TOL < 0.1 indicate a multicollinearity p roblem132. We then determined the relative
importance of these factors. According to Nicodemus133, the Gini index is more stable than the in-mean decrease
for determining the priority of effective factors, especially in situations where there is a relationship between
environmental factors. The mean decrease Gini (MDG) is defined as the sum of the Gini impurities decreasing
from a specific variable normalized by trees120. Therefore, we also used MDG to determine the priority factors
in this study.
Data availability
The data used in this study are available upon request to the corresponding author for reasonable use in research.
All figures draw by the authors using R 3.5.3 statistical software (https://cran.r-project.org/bin/windows/base),
SAGA-GIS software (http://www.saga-gis.org/en/index.html), and ArcGIS 10.8 environment (https://www.esri.
com).
Received: 27 February 2021; Accepted: 8 July 2021
References
1. Tsakiris, G. Practical application of risk and hazard concepts in proactive planning. Eur. Water 19, 47–56 (2007).
2. Kappes, M. S., Keiler, M., von Elverfeldt, K. & Glade, T. Challenges of analyzing multi-hazard risk: A review. Nat. Hazards 64,
1925–1958 (2012).
3. UNEP. Agenda 21. Technical Report, United Nations Conference on Environment and Development. https://www.un.org/en/
conferences/environment/rio (1992).
4. Van Westen, C. J., Montoya, L., Boerboom, L. & Badilla Coto, E. Multi-hazard risk assessment using GIS in urban areas: A case
study for the city of Turrialba, Costa Rica. In Proceedings of the regional workshop on best practice in disaster mitigation, Bali
120–136 (2002).
5. Binita, K., Shepherd, J., King, A. W. & Gaither, C. J. Multi-hazard climate risk projections for the United States. Nat. Hazards
105, 1963–1976 (2021).
6. Kaur, H., Gupta, S., Parkash, S. & Thapa, R. Application of geospatial technologies for multi-hazard mapping and characteriza-
tion of associated risk at local scale. Ann. GIS 24, 33–46 (2018).
7. Furlan, E., Torresan, S., Critto, A. & Marcomini, A. Spatially explicit risk approach for multi-hazard assessment and management
in marine environment: The case study of the Adriatic Sea. Sci. Total Environ. 618, 1008–1023 (2018).
8. Araya-Muñoz, D., Metzger, M. J., Stuart, N., Wilson, A. M. W. & Carvajal, D. A spatial fuzzy logic approach to urban multi-
hazard impact assessment in Concepción, Chile. Sci. Total Environ. 576, 508–519 (2017).
9. Larsen, M. C., Conde, M. T. V. & Clark, R. A. Coping with Flash Floods 259–275 (Springer, 2001).
10. Chinnasamy, P., Honap, V. U. & Maske, A. B. Impact of 2018 Kerala floods on soil erosion: Need for post-disaster soil manage-
ment. J. Indian Soc. Remote Sens. 48, 1373–1388 (2020).
11. Motagh, M. et al. Landslides triggered by 2019 extreme rainfall and flood events in Iran: Results from satellite remote sensing
and field survey. In EGU general assembly conference abstracts EGU2020-10715, updated on 01 Jun 2021. https://meetingorg
anizer.copernicus.org/EGU2020/EGU2020-10715.html
12. Radbruch-Hall, D. & Varnes, D. Landslides—Cause and effect. Bull. Int. Assoc. Eng. Geol. 13, 205–216 (1976).
Scientific Reports | (2021) 11:14889 | https://doi.org/10.1038/s41598-021-94266-6 15
Vol.:(0123456789)www.nature.com/scientificreports/
13. Santín, C. & Doerr, S. H. Fire effects on soils: The human dimension. Philos. Trans. R. Soc. B Biol. Sci. 371, 20150171 (2016).
14. Ulery, A. & Graham, R. Forest fire effects on soil color and texture. Soil Sci. Soc. Am. J. 57, 135–140 (1993).
15. Shahab, H., Emami, H. & Haghnia, G. H. Effects of gully erosion on soil quality indices in northwestern Iran. J. Agric. Sci. Technol.
20(6), 1317–1329 (2018).
16. Darvishi, L., Daryaei, M. & Kouchi, A. Comparison of statistical modeling and AHP methods in fire risk assessment in oak
forests of Iran. J. For. Res. 9, 229 (2020).
17. Lei, X. et al. GIS-based machine learning algorithms for gully erosion susceptibility mapping in a semi-arid region of Iran.
Remote Sens. 12, 2478 (2020).
18. Kamranzad, F., Memarian, H. & Zare, M. Earthquake risk assessment for Tehran, Iran. ISPRS Int. J. Geo Inf. 9, 430 (2020).
19. Ozturk, M., Gucel, S., Kucuk, M. & Sakcali, S. Forest diversity, climate change and forest fires in the Mediterranean region of
Turkey. J. Environ. Biol. 31, 1 (2010).
20. Sari, F. Forest fire susceptibility mapping via multi-criteria decision analysis techniques for Mugla, Turkey: A comparative
analysis of VIKOR and TOPSIS. For. Ecol. Manag. 480, 118644 (2021).
21. Dong, X., Li-min, D., Guo-fan, S., Lei, T. & Hui, W. Forest fire risk zone mapping from satellite images and GIS for Baihe Forestry
Bureau, Jilin, China. J. For. Res. 16, 169–174 (2005).
22. Adab, H., Kanniah, K. D. & Solaimani, K. Modeling forest fire risk in the northeast of Iran using remote sensing and GIS tech-
niques. Nat. Hazards 65, 1723–1743 (2013).
23. Hirabayashi, Y. et al. Global flood risk under climate change. Nat. Clim. Change 3, 816–821 (2013).
24. CRED. Natural Disaster 2018 (Centre for Research on the Epidemiology of Disasters, 2020).
25. Wang, Y., Fang, Z., Hong, H. & Peng, L. Flood susceptibility mapping using convolutional neural network frameworks. J. Hydrol.
582, 124482 (2020).
26. Samanta, S., Pal, D. K. & Palsamanta, B. Flood susceptibility analysis through remote sensing, GIS and frequency ratio model.
Appl. Water Sci. 8, 1–14 (2018).
27. Hadidi, A., Holzbecher, E. & Molenaar, R. E. Flood mapping in face of rapid urbanization: A case study of Wadi Majraf-Manu-
mah, Muscat, Sultanate of Oman. Urban Water J. 17, 407–415 (2020).
28. Souissi, D. et al. GIS-based MCDM–AHP modeling for flood susceptibility mapping of arid areas, southeastern Tunisia. Geocarto
Int. 35, 991–1017 (2020).
29. Band, S. S. et al. Novel ensemble approach of deep learning neural network (DLNN) model and particle swarm optimization
(PSO) algorithm for prediction of gully erosion susceptibility. Sensors 20, 5609 (2020).
30. Dotterweich, M. et al. High-resolution gully erosion and sedimentation processes, and land use changes since the Bronze Age
and future trajectories in the Kazimierz Dolny area (Nałęczów Plateau, SE-Poland). Catena 95, 50–62 (2012).
31. Conforti, M., Aucelli, P. P., Robustelli, G. & Scarciglia, F. Geomorphology and GIS analysis for mapping gully erosion susceptibil-
ity in the Turbolo stream catchment (northern Calabria, Italy). Nat. Hazards 56, 881–898 (2011).
32. Conoscenti, C., Agnesi, V., Cama, M., Caraballo-Arias, N. A. & Rotigliano, E. Assessment of gully erosion susceptibility using
multivariate adaptive regression splines and accounting for terrain connectivity. Land Degrad. Dev. 29, 724–736 (2018).
33. Yang, Y. H. et al. Midcrustal thrusting and vertical deformation partitioning constraint by 2017 Mw 7.3 Sarpol Zahab earthquake
in Zagros Mountain Belt, Iran. Seismol. Res. Lett. 89, 2204–2213 (2018).
34. Domínguez-Cuesta, M. J. In Encyclopedia of Natural Hazards (ed. Bobrowsky, P. T.) 988–988 (Springer, 2013). https://doi.org/
10.1007/978-1-4020-4399-4_340.
35. Lehner, B., Döll, P., Alcamo, J., Henrichs, T. & Kaspar, F. Estimating the impact of global change on flood and drought risks in
Europe: A continental, integrated analysis. Clim. Change 75, 273–299 (2006).
36. Stoffel, M. & Bollschweiler, M. Tree-ring analysis in natural hazards research—An overview. Nat. Hazards 8, 187–202 (2008).
37. Tofani, V., Segoni, S., Agostini, A., Catani, F. & Casagli, N. Use of remote sensing for landslide studies in Europe. Nat. Hazards
13, 299–309 (2013).
38. Kundzewicz, Z. W. et al. Differences in flood hazard projections in Europe—Their causes and consequences for decision making.
Hydrol. Sci. J. 62, 1–14 (2017).
39. Paprotny, D., Kreibich, H., Morales-Nápoles, O., Terefenko, P. & Schröter, K. Estimating exposure of residential assets to natural
hazards in Europe using open data. Nat. Hazards 20, 323–343 (2020).
40. Bathrellos, G. D., Skilodimou, H. D., Chousianitis, K., Youssef, A. M. & Pradhan, B. Suitability estimation for urban development
using multi-hazard assessment map. Sci. Total Environ. 575, 119–134 (2017).
41. Lucà, F., Conforti, M. & Robustelli, G. Comparison of GIS-based gullying susceptibility mapping using bivariate and multivariate
statistics: Northern Calabria, South Italy. Geomorphology 134, 297–308 (2011).
42. Pourghasemi, H. R., Gayen, A., Lasaponara, R. & Tiefenbacher, J. P. Application of learning vector quantization and different
machine learning techniques to assessing forest fire influence factors and spatial modelling. Environ. Res. 184, 109321 (2020).
43. Guisan, A. & Thuiller, W. Predicting species distribution: Offering more than simple habitat models. Ecol. Lett. 8, 993–1009
(2005).
44. Oliveira, S., Oehler, F., San-Miguel-Ayanz, J., Camia, A. & Pereira, J. M. Modeling spatial patterns of fire occurrence in Mediter-
ranean Europe using multiple regression and random forest. For. Ecol. Manag. 275, 117–129 (2012).
45. Kühnlein, M., Appelhans, T., Thies, B. & Nauss, T. Improving the accuracy of rainfall rates from optical satellite sensors with
machine learning—A random forests-based approach applied to MSG SEVIRI. Remote Sens. Environ. 141, 129–143 (2014).
46. Wang, Y. et al. Random bits forest: A strong classifier/regressor for big data. Sci. Rep. 6, 1–8 (2016).
47. Han, Q., Gui, C., Xu, J. & Lacidogna, G. A generalized method to predict the compressive strength of high-performance concrete
by improved random forest algorithm. Constr. Build. Mater. 226, 734–742 (2019).
48. Gislason, P. O., Benediktsson, J. A. & Sveinsson, J. R. Random forests for land cover classification. Pattern Recogn. Lett. 27,
294–300 (2006).
49. Cutler, D. R. et al. Random forests for classification in ecology. Ecology 88, 2783–2792 (2007).
50. Zhang, K., Wu, X., Niu, R., Yang, K. & Zhao, L. The assessment of landslide susceptibility mapping using random forest and
decision tree methods in the Three Gorges Reservoir area, China. Environ. Earth Sci. 76, 1–20 (2017).
51. Zhao, G., Pang, B., Xu, Z., Yue, J. & Tu, T. Mapping flood susceptibility in mountainous areas on a national scale in China. Sci.
Total Environ. 615, 1133–1142 (2018).
52. Milanović, S. et al. Forest fire probability mapping in eastern Serbia: Logistic regression versus random forest method. Forests
12, 5 (2021).
53. Gounaridis, D., Chorianopoulos, I., Symeonakis, E. & Koukoulas, S. A random forest-cellular automata modelling approach to
explore future land use/cover change in Attica (Greece), under different socio-economic realities and scales. Sci. Total Environ.
646, 320–335 (2019).
54. Wu, Z., He, H. S., Yang, J., Liu, Z. & Liang, Y. Relative effects of climatic and local factors on fire occurrence in boreal forest
landscapes of northeastern China. Sci. Total Environ. 493, 472–480 (2014).
55. Wang, N., Shi, T., Peng, K., Zhang, W. & Jin, X. Assessment of geohazard susceptibility based on RS and GIS analysis in Jianshi
County of the Three Gorges Reservoir, China. Arab. J. Geosci. 8, 67–86 (2015).
56. Kanani-Sadat, Y., Arabsheibani, R., Karimipour, F. & Nasseri, M. A new approach to flood susceptibility assessment in data-
scarce and ungauged regions based on GIS-based hybrid multi criteria decision-making method. J. Hydrol. 572, 17–31 (2019).
Scientific Reports | (2021) 11:14889 | https://doi.org/10.1038/s41598-021-94266-6 16
Vol:.(1234567890)www.nature.com/scientificreports/
57. Morgan, R. & Mngomezulu, D. Threshold conditions for initiation of valley-side gullies in the Middle Veld of Swaziland. Catena
50, 401–414 (2003).
58. Azareh, A. et al. Modelling gully-erosion susceptibility in a semi-arid region, Iran: Investigation of applicability of certainty
factor and maximum entropy models. Sci. Total Environ. 655, 684–696 (2019).
59. Jahantab, E., Hatami, E., Sayadian, M. & Salahi Ardakani, A. Ethnobotanical study of medicinal plants of Boyer Ahmad and
Dena regions in Kohgiluyeh and Boyer Ahmad province. Iran. Adv. Herb. Med. 3, 12–22 (2018).
60. Robinson, M. C. & Glen, R. C. Validating the validation: Reanalyzing a large-scale comparison of deep learning and machine
learning models for bioactivity prediction. J. Comput. Aided Mol. Des. 34, 1–14 (2020).
61. Chuvieco, E. & Congalton, R. G. Application of remote sensing and geographic information systems to forest fire hazard map-
ping. Remote Sens. Environ. 29, 147–159 (1989).
62. Kourgialas, N. N. & Karatzas, G. P. Flood management and a GIS modelling method to assess flood-hazard areas—A case study.
Hydrol. Sci. J. 56, 212–225 (2011).
63. Kabenge, M., Elaru, J., Wang, H. & Li, F. Characterizing flood hazard risk in data-scarce areas, using a remote sensing and GIS-
based flood hazard index. Nat. Hazards 89, 1369–1387 (2017).
64. Ganteaume, A. et al. A review of the main driving factors of forest fire ignition over Europe. Environ. Manag. 51, 651–662 (2013).
65. Eini, M., Kaboli, H. S., Rashidian, M. & Hedayat, H. Hazard and vulnerability in urban flood risk mapping: Machine learning
techniques and considering the role of urban districts. Int. J. Disaster Risk Reduct. 50, 101687 (2020).
66. Hembram, T. K., Paul, G. C. & Saha, S. Modelling of gully erosion risk using new ensemble of conditional probability and index
of entropy in Jainti River basin of Chotanagpur Plateau fringe area, India. Appl. Geomat. 12, 1–24 (2020).
67. Wang, Y., Fang, Z., Wang, M., Peng, L. & Hong, H. Comparative study of landslide susceptibility mapping with different recur-
rent neural networks. Comput. Geosci. 138, 104445 (2020).
68. Weise, D. R. & Biging, G. S. A qualitative comparison of fire spread models incorporating wind and slope effects. For. Sci. 43,
170–180 (1997).
69. Fernandez, D. & Lutz, M. Urban flood hazard zoning in Tucumán Province, Argentina, using GIS and multicriteria decision
analysis. Eng. Geol. 111, 90–98 (2010).
70. Kushla, J. D. & Ripple, W. J. The role of terrain in a fire mosaic of a temperate coniferous forest. For. Ecol. Manag. 95, 97–107
(1997).
71. Pérez-García, E. A., Sevilha, A. C., Meave, J. A. & Scariot, A. Floristic differentiation in limestone outcrops of southern Mexico
and central Brazil: A beta diversity approach. Boletín de la Sociedad Botánica de México 84, 45–58 (2009).
72. Moritz, M. A. et al. Climate change and disruptions to global fire activity. Ecosphere 3, 1–22 (2012).
73. Flannigan, M. D., Stocks, B. J. & Wotton, B. M. Climate change and forest fires. Sci. Total Environ. 262, 221–229 (2000).
74. Mahmoud, S. H. & Gan, T. Y. Urbanization and climate change implications in flood risk management: Developing an efficient
decision support system for flood susceptibility mapping. Sci. Total Environ. 636, 152–167 (2018).
75. Tewolde, M. G., Beza, T. A., Costa, A. C. & Painho, M. Comparison of different interpolation techniques to map temperature
in the southern region of Eritrea. In Geospatial Thinking, 13th AGILE international conference on geographic information science
10-14 May 2010 - Guimarães, Portugal 1–5 (2010).
76. Xu, C., Wang, J. & Li, Q. A new method for temperature spatial interpolation based on sparse historical stations. J. Clim. 31,
1757–1770 (2018).
77. Amraoui, M., Pereira, M. G., DaCamara, C. C. & Calado, T. J. Atmospheric conditions associated with extreme fire activity in
the Western Mediterranean region. Sci. Total Environ. 524, 32–39 (2015).
78. Hernandez-Leal, P., Arbelo, M. & Gonzalez-Calvo, A. Fire risk assessment using satellite data. Adv. Space Res. 37, 741–746 (2006).
79. Ryu, S. et al. Spatial interpolation of gauge measured rainfall using compressed sensing. Asia Pac. J. Atmos. Sci. 57, 331–345
(2021).
80. Bajocco, S. et al. Mapping forest fuels through vegetation phenology: The role of coarse-resolution satellite time-series. PLoS
ONE 10, e0119811 (2015).
81. Zeng, L. & Liu, H. The key geological factors influencing on development of low-permeability sandstone reservoirs: A case study
of the Taizhao area in the Songliao Basin, China. Energy Explor. Exploit. 27, 425–437 (2009).
82. Shafizadeh-Moghadam, H., Valavi, R., Shahabi, H., Chapi, K. & Shirzadi, A. Novel forecasting approaches using combination
of machine learning and statistical models for flood susceptibility mapping. J. Environ. Manag. 217, 1–11 (2018).
83. Vojtek, M. & Vojteková, J. Flood susceptibility mapping on a national scale in Slovakia using the analytical hierarchy process.
Water 11, 364 (2019).
84. Dale, V. H., Efroymson, R. A. & Kline, K. L. The land use–climate change–energy nexus. Landsc. Ecol. 26, 755–773 (2011).
85. Rawat, P. K., Tiwari, P. C., Pant, C. C., Sharama, A. & Pant, P. Modelling of stream run-off and sediment output for erosion hazard
assessment in Lesser Himalaya: Need for sustainable land use plan using remote sensing and GIS: A case study. Nat. Hazards
59, 1277–1297 (2011).
86. Rimal, B., Baral, H., Stork, N. E., Paudyal, K. & Rijal, S. Growing city and rapid land use transition: Assessing multiple hazards
and risks in the Pokhara Valley, Nepal. Land 4, 957–978 (2015).
87. Auerswald, K., Fiener, P., Martin, W. & Elhaus, D. Use and misuse of the K factor equation in soil erosion modeling: An alterna-
tive equation for determining USLE nomograph soil erodibility values. Catena 118, 220–225 (2014).
88. Batjes, N. H. et al. WoSIS: Providing standardised soil profile data for the world. Earth Syst. Sci. Data 9, 1–14 (2017).
89. Conrad, O. et al. System for automated geoscientific analyses (SAGA) v. 2.1.4. Geosci. Model Dev. 8, 1991–2007 (2015).
90. Böhner, J. & Antonić, O. Land-surface parameters specific to topo-climatology. Dev. Soil Sci. 33, 195–226 (2009).
91. Storey, M. A., Price, O. F., Sharples, J. J. & Bradstock, R. A. Drivers of long-distance spotting during wildfires in south-eastern
Australia. Int. J. Wildland Fire 29, 459–472 (2020).
92. Gokceoglu, C., Sonmez, H., Nefeslioglu, H. A., Duman, T. Y. & Can, T. The 17 March 2005 Kuzulu landslide (Sivas, Turkey) and
landslide-susceptibility map of its near vicinity. Eng. Geol. 81, 65–83 (2005).
93. Yanar, T., Kocaman, S. & Gokceoglu, C. Use of Mamdani fuzzy algorithm for multi-hazard susceptibility assessment in a devel-
oping urban settlement (Mamak, Ankara, Turkey). ISPRS Int. J. Geo Inf. 9, 114 (2020).
94. Moore, I. D., Grayson, R. & Ladson, A. Digital terrain modelling: A review of hydrological, geomorphological, and biological
applications. Hydrol. Process. 5, 3–30 (1991).
95. Minar, J. & Evans, I. S. Elementary forms for land surface segmentation: The theoretical basis of terrain analysis and geomor-
phological mapping. Geomorphology 95, 236–259 (2008).
96. Valeriano, M. M. et al. Modeling small watersheds in Brazilian Amazonia with Shuttle Radar Topographic Mission 90 m data.
Comput. Geosci. 32, 1169–1181 (2006).
97. Liggit, B. & Fincham, R. Gully erosion: The neglected dimension in soil erosion research. S. Afr. J. Sci. 85, 18 (1989).
98. Roy, P. et al. Development of different machine learning ensemble classifier for gully erosion susceptibility in Gandheswari
watershed of West Bengal, India. In Machine Learning for Intelligent Decision Science, pp 1–26 (eds Rout, J. K. et al.) (Springer,
2020).
99. Nyssen, J. et al. Impact of road building on gully erosion risk: A case study from the northern Ethiopian highlands. Earth Surf.
Proc. Land. 27, 1267–1283 (2002).
Scientific Reports | (2021) 11:14889 | https://doi.org/10.1038/s41598-021-94266-6 17
Vol.:(0123456789)You can also read