2019 HMP UPDATE CHANGES - Burlington County, NJ
←
→
Page content transcription
If your browser does not render page correctly, please read the page content below
SECTION 5.4.6: RISK ASSESSMENT – SEVERE WEATHER

5.4.6        SEVERE WEATHER
The following section provides the hazard profile (hazard description, location, extent, previous occurrences and
losses, probability of future occurrences, and impact of climate change) and vulnerability assessment for the
severe weather hazard in Burlington County.

2019 HMP UPDATE CHANGES
➢ For the 2019 HMP update, the severe weather hazard groups together high winds, tornadoes, thunderstorms
  and lightning, hailstorms, hurricanes/tropical storms, and extreme temperature. The hazard profile has been
  significantly enhanced to include a detailed hazard description, location, extent, previous occurrences,
  probability of future occurrence, and potential change in climate and its impacts on the severe weather hazard
  is discussed.
➢ New and updated figures from federal and state agencies are incorporated.
➢ Previous occurrences were updated with events that occurred between 2012 and 2018.
➢ A vulnerability assessment was conducted for the severe weather hazard; it directly follows the hazard
  profile.

5.4.6.1      PROFILE
Hazard Description
For the purpose of this HMP update and as deemed appropriated by the Burlington County Planning Committee,
the severe weather hazard includes high wind, tornadoes, thunderstorms and lightning, hailstorms,
hurricane/tropical storms, and extreme temperature, which are defined below.

High Winds
High winds, other than tornadoes, are experienced in all parts of the United States. Areas that experience the
highest wind speeds are coastal regions from Texas to Maine, and the Alaskan coast; however, exposed mountain
areas experience winds at least as high as those along the coast (FEMA 1997). Wind begins with differences in
air pressures. It is rough horizontal movement of air caused by uneven heating of the earth’s surface. Wind
occurs at all scales, from local breezes lasting a few minutes to global winds resulting from solar heating of the
earth (Rosenstiel School of Marine & Atmospheric Science 2005). High winds have the potential to down trees,
tree limbs and power lines which lead to widespread power outages and damaging residential and commercial
structures throughout Burlington County. High winds are often associated by other severe weather events such
as thunderstorms, tornadoes, hurricanes and tropical storms (all discussed further in this section).

A type of windstorm that is experienced often during rapidly moving thunderstorms is a derecho. A derecho is
a long-lived windstorm that is associated with a rapidly moving squall line of thunderstorms. It produces
straight-line winds gusts of at least 58 miles per hour (mph) and often has isolated gusts exceeding 75 mph. This
means that trees generally fall and debris is blown in one direction. To be considered a derecho, these conditions
must continue along a path of at least 240 miles. Derechos are more common in the Great Lakes and Midwest
regions of the U.S., though, on occasion, can persist into the mid-Atlantic and northeast U.S. (ONJSC Rutgers
University 2013).

Tornadoes
A tornado appears as a rotating, funnel-shaped cloud that extends from a thunderstorm to the ground with
whirling winds that can reach 250 miles per hour (mph). Damage paths can be greater than 1 mile wide and 50
miles long. Tornadoes typically develop from either a severe thunderstorm or hurricane as cool air rapidly

        DMA 2000 Hazard Mitigation Plan Update – Burlington County, New Jersey                            5.4.6-1
        March 2019
SECTION 5.4.6: RISK ASSESSMENT – SEVERE WEATHER

overrides a layer of warm air. Tornadoes typically move at speeds between 30 and 125 mph and can generate
combined wind speeds (forward motion and speed of the whirling winds) exceeding 300 mph. The lifespan of
a tornado rarely is longer than 30 minutes (FEMA 1997). Tornadoes can occur at any time of the year, with peak
seasons at different times for different states (National Severe Storms Laboratory [NSSL] 2013).

Thunderstorms and Lightning
A thunderstorm is a local storm produced by a cumulonimbus cloud and accompanied by lightning and thunder
(NWS 2009). A thunderstorm forms from a combination of moisture, rapidly rising warm air, and a force capable
of lifting air such as a warm and cold front, a sea breeze, or a mountain. Thunderstorms form from the equator
to as far north as Alaska. Although thunderstorms generally affect a small area when they occur, they have the
potential to become dangerous due to their ability in generating tornadoes, hailstorms, strong winds, flash
flooding, and lightning. The NWS considers a thunderstorm severe only if it produces damaging wind gusts of
58 mph or higher or large hail one-inch (quarter size) in diameter or larger or tornadoes (NWS 2010).

Lighting is a bright flash of electrical energy produced by a thunderstorm. The resulting clap of thunder is the
result of a shock wave created by the rapid heating and cooling of the air in the lightning channel. All
thunderstorms produce lightning and are very dangerous. It ranks as one of the top weather killers in the United
States and kills approximately 50 people and injures hundreds each year. Lightning can occur anywhere there
is a thunderstorm.

Thunderstorms can lead to flooding, landslides, strong winds, and lightning. Roads may become impassable
from flooding, downed trees or power lines, or a landslide. Downed power lines can lead to utility losses, such
as water, phone and electricity. Lightning can damage homes and injure people. In the U.S., an average of 300
people are injured and 80 people are killed by lightning each year. Typical thunderstorms are 15 miles in
diameter and last an average of 30 minutes. An estimated 100,000 thunderstorms occur each year in the U.S.,
with approximately 10-percent of them classified as severe. During the warm season, thunderstorms are
responsible for most of the rainfall.

Hailstorms
Hail forms inside a thunderstorm where there are strong updrafts of warm air and downdrafts of cold water. If
a water droplet is picked up by the updrafts, it can be carried well above the freezing level. Water droplets freeze
when temperatures reach 32°F or colder. As the frozen droplet begins to fall, it may thaw as it moves into
warmer air toward the bottom of the thunderstorm. However, the droplet may be picked up again by another
updraft and carried back into the cold air and re-freeze. With each trip above and below the freezing level, the
frozen droplet adds another layer of ice. The frozen droplet, with many layers of ice, falls to the ground as hail.
Most hail is small and typically less than two inches in diameter (NWS 2010).

Hurricanes/Tropical Storms
Tropical cyclones are fueled by a different heat mechanism than other cyclonic windstorms such as Nor’easters
and polar lows. The characteristic that separates tropical storms from other cyclonic systems is that at any height
in the atmosphere, the center of a tropical storm will be warmer than its surroundings, a phenomenon called
“warm core” storm systems (National Oceanic and Atmospheric Administration [NOAA] 2013). Tropical
cyclones strengthen when water evaporated from the ocean is released as the saturated air rises, resulting in
condensation of water vapor contained in the moist air. Tropical cyclones begin as disturbed areas of weather
often referred to as tropical waves. As the storm organizes, it is designated as a tropical depression.

A tropical storm system is characterized by a low-pressure center and numerous thunderstorms that produce
strong winds of 39 to 73 mph and heavy rain. A hurricane is a tropical storm that attains hurricane status when

         DMA 2000 Hazard Mitigation Plan Update – Burlington County, New Jersey                             5.4.6-2
         March 2019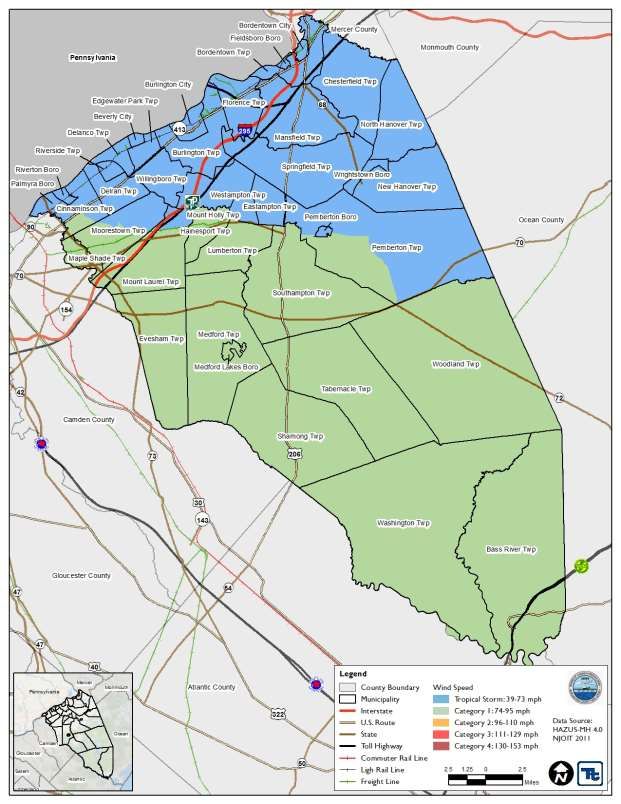
SECTION 5.4.6: RISK ASSESSMENT – SEVERE WEATHER

its wind speed reaches 74 mph or higher. Tropical systems may develop in the Atlantic between the Lesser
Antilles and the African coast, or may develop in the warm tropical waters of the Caribbean and Gulf of Mexico.
These storms may move up the Atlantic coast of the United States and impact the eastern seaboard, or move into
the United States through the states along the Gulf Coast, bringing wind and rain as far north as New England
before moving offshore and heading east.

Extreme Temperatures
Extreme temperature includes both heat and cold events, which can have significant impact to human health,
commercial/agricultural businesses, and primary and secondary effects on infrastructure (e.g., burst pipes and
power failures). What constitutes as extreme cold or extreme heat can vary across different areas of the U.S.,
based on what the population is accustomed to.

Extreme cold events are when temperatures drop well below normal in an area. In regions relatively
unaccustomed to winter weather, near freezing temperatures are considered “extreme cold.” Extreme cold
temperatures are generally characterized in temperate zones by the ambient air temperature dropping to
approximately 0ºF or below (Centers of Disease Control and Prevention [CDC] 2007). Extremely cold
temperatures often accompany a winter storm, which can cause power failures and icy roads. Although staying
indoors as much as possible can help reduce the risk of car crashes and falls on the ice, individuals may also face
indoor hazards. Many homes will be too cold—either due to a power failure or because the heating system is
not adequate for the weather. The use of space heaters and fireplaces to keep warm increases the risk of
household fires and carbon monoxide poisoning (CDC 2007).

Conditions of extreme heat are defined as summertime temperatures that are substantially hotter and/or more
humid than average for a location at that time of year (CDC 2009). An extended period of extreme heat of three
or more consecutive days is typically called a heat wave and is often accompanied by high humidity (NWS
2011). There is no universal definition of a heat wave because the term is relative to the usual weather in a
particular area. The term heat wave is applied both to routine weather variations and to extraordinary spells of
heat which may occur only once a century (Meehl and Tebaldi 2004). A basic definition of a heat wave implies
that it is an extended period of unusually high atmosphere-related heat stress, which causes temporary
modifications in lifestyle and which may have adverse health consequences for the affected population. A heat
wave is defined has three consecutive days of temperatures ≥90°F.

Extreme heat is the number one weather-related cause of death in the U.S. In a ten-year average of weather
fatalities across the nation from 2005-2014, excessive heat claimed more lives each year than floods, lightning,
tornadoes, and hurricanes. In 2017, heat claimed 107 lives, though none of them were in the State of New Jersey
(NWS 2018).

Location
All of Burlington County is exposed to severe weather events (high winds, tornadoes, thunderstorms, lightning,
hail, hurricanes/tropical storms, and extreme temperatures) and the entire County is subject to high winds from
severe weather events. According to the FEMA Winds Zones of the United States map, Burlington County is
located in Wind Zones II, where wind speeds can reach up to 160 mph. Figure 5.4.6-1 illustrates wind zones
across the United States, which indicate the impacts of the strength and frequency of wind activity per region.
The information on the figure is based on 40 years of tornado data and 100 years of hurricane data collected by
FEMA.

         DMA 2000 Hazard Mitigation Plan Update – Burlington County, New Jersey                            5.4.6-3
         March 2019
SECTION 5.4.6: RISK ASSESSMENT – SEVERE WEATHER
Figure 5.4.6-1. Wind Zones in the United States
Source: FEMA 2018
Note: The black oval indicates the approximate location of Burlington County.
Hurricanes/Tropical Storms
NOAA’s Historical Hurricane Tracks tool is a public interactive mapping application that displays Atlantic Basin
and East-Central Pacific Basin tropical cyclone data. This interactive tool catalogs tropical cyclones that have
occurred from 1842 to 2013 (latest date available from data source). Between 1842 and 2018, 16 tropical
cyclones tracked within 65 nautical miles of Burlington County. Between 2012 and 2018, no tropical cyclones
tracked within 65 miles of Burlington County although post-Tropical Storm Sandy did cross directly over
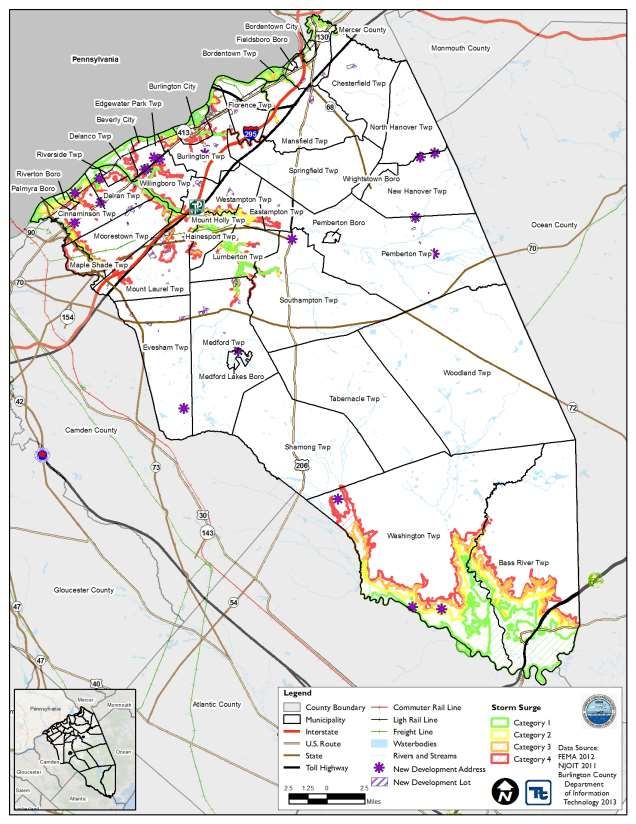
Burlington County in 2012. Table 5.4.6-1. Summary of Potential Surge Inundation Areas by CommunityTable
5.4.6-1 displays the percent area for the Category 1 through Category 4 storm surge scenarios in each
municipality. Bass River Township has the greatest percentage of area located in the Category 1 through
Category 3 storm surge scenarios, while Palmyra Borough has the greatest percentage of area located in the
Category 4 storm surge scenario.
Table 5.4.6-1. Summary of Potential Surge Inundation Areas by Community
% in CAT1 Surge % in CAT2 Surge % in CAT3 Surge % in CAT4 Surge
Municipality Total Acres Zone Zone Zone Zone
Bass River Township 50,140 12.6% 22.7% 25.6% 31.6%
DMA 2000 Hazard Mitigation Plan Update – Burlington County, New Jersey 5.4.6-4
March 2019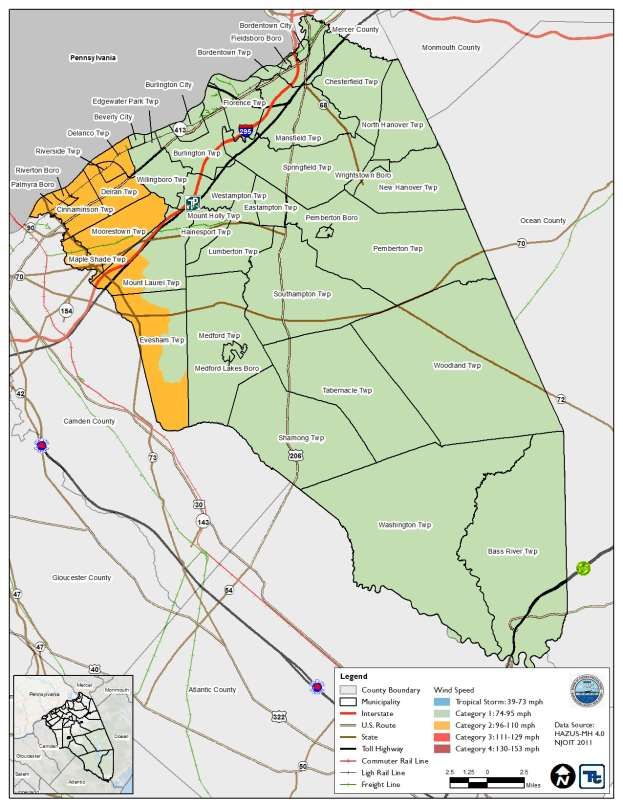
SECTION 5.4.6: RISK ASSESSMENT – SEVERE WEATHER

                                            % in CAT1 Surge % in CAT2 Surge % in CAT3 Surge % in CAT4 Surge
       Municipality           Total Acres         Zone            Zone            Zone            Zone
 Beverly City                     486             0.4%            0.5%            0.5%            0.7%
 Bordentown City                  618            5.0%             5.0%           5.0%            5.0%
 Bordentown Township             5,926           2.9%             2.9%           2.9%            2.9%
 Burlington City                 2,426           5.3%             5.4%           5.4%            7.7%
 Burlington Township             8,992           0.3%             0.4%           0.6%            3.0%
 Chesterfield Township           13,736          0.0%             0.0%           0.0%            0.0%
 Cinnaminson Township            5,099           0.6%             0.7%           0.7%            8.6%
 Delanco Township                2,190           0.8%             0.9%           0.9%            1.4%
 Delran Township                 4,654           2.1%             2.2%           2.2%            3.2%
 Eastampton Township             3,723           0.0%             0.0%           0.0%            0.0%
 Edgewater Park Township         1,976           0.1%             0.1%           0.2%            0.2%
 Evesham Township                18,943          0.0%             0.0%           0.0%            0.0%
 Fieldsboro Borough               224            1.0%             1.0%           1.0%            1.0%
 Florence Township               6,559           0.3%             0.4%           0.4%            0.4%
 Hainesport Township             4,344           0.1%            11.9%           13.8%           20.7%
 Lumberton Township              8,327           0.0%             3.2%           4.1%            8.1%
 Mansfield Township              14,010          0.4%             0.4%           0.4%            0.4%
 Maple Shade Township            2,451           0.0%             0.0%           0.0%            3.7%
 Medford Lakes Borough            812            0.0%             3.1%           4.0%            9.4%
 Medford Township                25,474          0.0%             0.0%           0.0%            0.0%
 Moorestown Township             9,585           0.2%             0.4%           0.4%            2.4%
 Mount Holly Township            1,837           0.0%             0.4%           0.8%            3.2%
 Mount Laurel Township           14,066          0.1%             0.7%           0.8%            1.5%
 New Hanover Township            14,483          0.0%             0.0%           0.0%            0.0%
 North Hanover Township          11,203          0.0%             0.0%           0.0%            0.0%
 Palmyra Borough                 1,673           1.7%             1.8%           4.4%            39.2%
 Pemberton Borough                403            0.0%             0.0%           0.0%            0.0%
 Pemberton Township              40,171          0.0%             0.0%           0.0%            0.0%
 Riverside Township              1,048           0.5%             0.5%           0.6%            0.9%
 Riverton Borough                 614            1.3%             0.0%           1.6%            36.1%
 Shamong Township                28,791          0.0%             0.0%           0.0%            0.0%
 Southampton Township            28,446          0.0%             0.0%           0.0%            0.1%
 Springfield Township            18,924          0.0%             0.0%           0.0%            0.0%
 Tabernacle Township             31,688          0.0%             0.0%           0.0%            0.0%
 Washington Township             66,539          8.3%            14.3%           18.2%           27.0%
 Westampton Township             7,104           0.0%             1.6%           1.9%            3.2%
 Willingboro Township            5,175           0.9%             1.0%           1.1%            1.7%
 Woodland Township               61,001          0.0%             0.0%           0.0%            0.0%
 Wrightstown Borough             1,146           0.0%             0.0%           0.0%            0.0%

 Burlington County              525,009          2.4%             4.3%           5.1%            7.4%

Source: FEMA, 2012; Burlington County GIS

         DMA 2000 Hazard Mitigation Plan Update – Burlington County, New Jersey                      5.4.6-5
         March 2019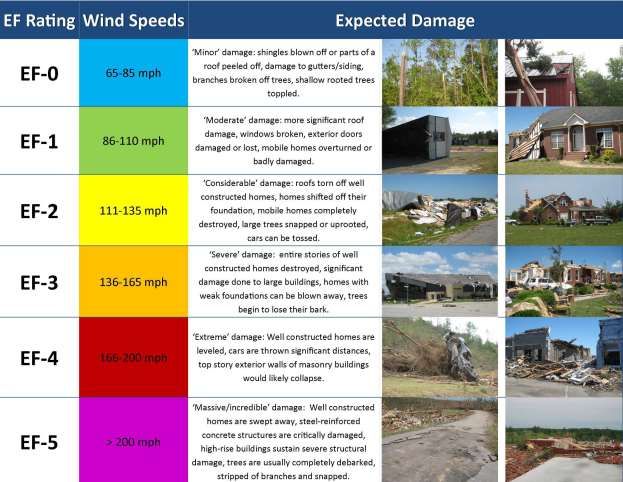
SECTION 5.4.6: RISK ASSESSMENT – SEVERE WEATHER

Extent

High Winds
The following table provides the descriptions of winds used by the NWS during wind-producing events.

Table 5.4.6-2. NWS Wind Descriptions

                                             Sustained Wind Speed
           Descriptive Term                          (mph)
 Strong, dangerous, or damaging                       ≥40
 Very Windy                                          30-40
 Windy                                               20-30
 Breezy, brisk, or blustery                          15-25
 None                                             5-15 or 10-20
 Light or light and variable wind                     0-5
Source:   NWS 2011
mph       miles per hour

The NWS issues advisories and warnings for winds. Issuance is normally site-specific. High wind advisories,
watches and warnings are products issued by the NWS when wind speeds may pose a hazard or is life
threatening. The criterion for each of these varies from state to state. Wind warnings and advisories for New
Jersey are as follows:

     • High Wind Warnings are issued when sustained wind speeds of 40 mph or greater lasting for one hour
       or longer or for winds of 58 mph or greater for any duration or widespread damage are possible.
   • Wind Advisories are issues when sustained winds of 30 to 39 mph are forecast for one hour or longer,
       or wind gusts of 46 to 57 mph for any duration (NWS 2018).
Tornadoes
The magnitude or severity of a tornado is categorized using the Enhanced Fujita Tornado Intensity Scale (EF
Scale). This is the scale now used exclusively for determining tornado ratings by comparing wind speed and
actual damage. Figure 5.4.6-2 illustrates the relationship between EF ratings, wind speed, and expected tornado
damage.

Tornado watches and warning are issued by the local NWS office. A tornado watch is released when tornadoes
are possible in an area. A tornado warning means a tornado has been sighted or indicated by weather radar. The
current average lead time for tornado warnings is 13 minutes; however, warning times for New Jersey may be
shorter due to the fact that the State experiences smaller tornadoes that are difficult to warn. Occasionally,
tornadoes develop so rapidly, that little, if any, advance warning is possible (NOAA 2013).

          DMA 2000 Hazard Mitigation Plan Update – Burlington County, New Jersey                       5.4.6-6
          March 2019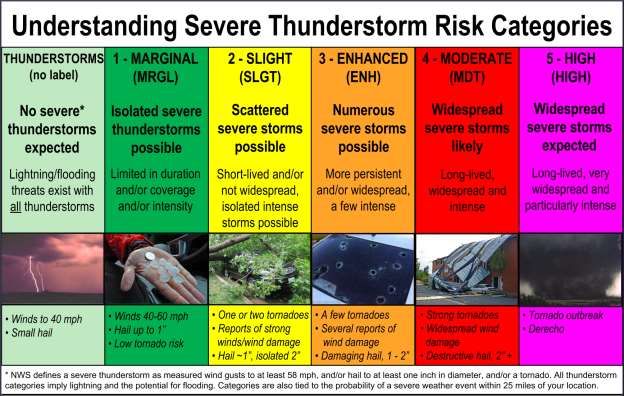
SECTION 5.4.6: RISK ASSESSMENT – SEVERE WEATHER

Figure 5.4.6-2. Explanation of EF-Scale Ratings

Thunderstorms and Lightning
Severe thunderstorm watches and warnings are issued by the local NWS office and SPC. The NWS and SPC
will update the watches and warnings and will notify the public when they are no longer in effect. Watches and
warnings for tornadoes in New Jersey are as follows:

    •   Severe Thunderstorm Warnings are issued when there is evidence based on radar or a reliable spotter
        report that a thunderstorm is producing, or forecast to produce, wind gusts of 58 mph or greater,
        structural wind damage, and/or hail one-inch in diameter or greater. A warning will include where the
        storm was located, what municipalities will be impacted, and the primary threat associated with the
        severe thunderstorm warning. After it has been issued, the NWS office will follow up periodically with
        Severe Weather Statements which contain updated information on the severe thunderstorm and will let
        the public know when the warning is no longer in effect.
    •   Severe Thunderstorm Watches are issued by the SPC when conditions are favorable for the development
        of severe thunderstorms over a larger-scale region for a duration of at least three hours. Tornadoes are
        not expected in such situations, but isolated tornado development may also occur. Watches are normally
        issued well in advance of the actual occurrence of severe weather. During the watch, the NWS will
        keep the public informed on what is happening in the watch area and also let the public know when the
        watch has expired or been cancelled (NWS 2009; NWS 2010).

        DMA 2000 Hazard Mitigation Plan Update – Burlington County, New Jersey                          5.4.6-7
        March 2019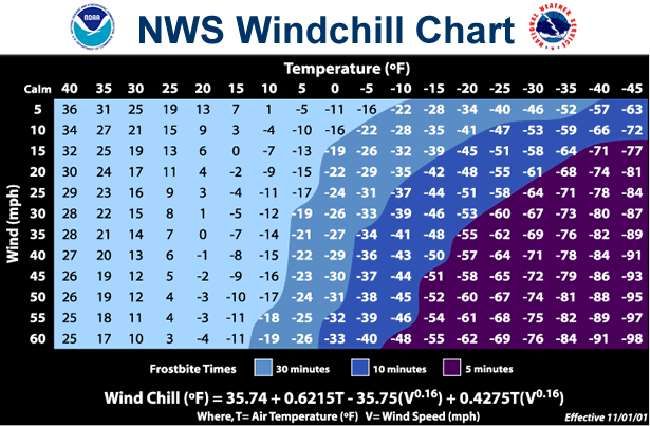
SECTION 5.4.6: RISK ASSESSMENT – SEVERE WEATHER

    •   Special Weather State for Near Severe Thunderstorms are issued for strong thunderstorms that are below
        severe levels, but still may have some adverse impacts. Usually, they are issued for the threat of wind
        gusts of 40 to 58 mph or small hail less than one-inch in diameter (NWS 2010).

Figure 5.4.6-3 below provides the various risk categories for thunderstorms, as presented by the Storm Prediction
Center (SPC).

Figure 5.4.6-3. Severe Thunderstorm Risk Categories

Source: NOAA SPC 2017

Hailstorms
The severity of hail is measured by duration, hail size, and geographic extent. All of these factors are directly
related to thunderstorms, which creates hail. There is wide potential variation in these severity components.
The most significant impact of hail is damage to crops. Hail also has the potential to damage structures and
vehicles during hailstorms.

Hail can be produced from many different types of storms. Typically, hail occurs with thunderstorm events.
The size of hail is estimated by comparing it to a known object. Most hailstorms are made up of a variety of
sizes, and only the very largest hail stones pose serious risk to people, when exposed. Table 5.4.6-3 shows the
different sizes of hail and the comparison to real-world objects.

        DMA 2000 Hazard Mitigation Plan Update – Burlington County, New Jersey                           5.4.6-8
        March 2019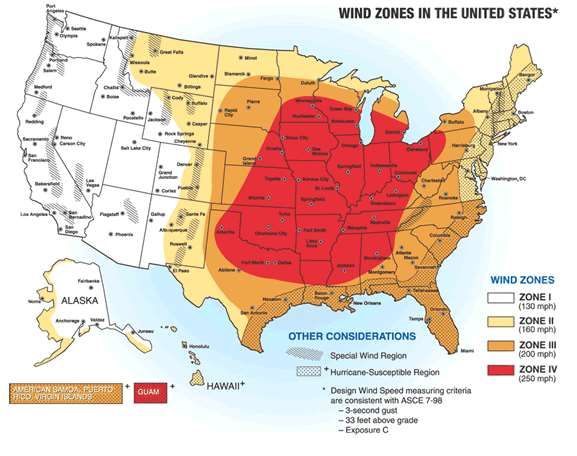
SECTION 5.4.6: RISK ASSESSMENT – SEVERE WEATHER

Table 5.4.6-3. Hail Size

          Size          Inches in Diameter
         Pea                  0.25 inch
    Marble/mothball           0.50 inch
     Dime/Penny               0.75 inch
        Nickel               0.875 inch
       Quarter                 1.0 inch
    Ping-Pong Ball            1.5 inches
       Golf Ball             1.75 inches
      Tennis Ball             2.5 inches
       Baseball              2.75 inches
       Tea Cup                3.0 inches
      Grapefruit              4.0 inches
       Softball               4.5 inches
Source:   NWS 2010

Hurricanes/Tropical Storms
The extent of a hurricane is categorized in accordance with the Saffir-Simpson Hurricane Scale. The Saffir-
Simpson Hurricane Wind Scale is a 1-to-5 rating based on a hurricane’s sustained wind speed. This scale
estimates potential property damage. Hurricanes reaching Category 3 and higher are considered major
hurricanes because of their potential for significant loss of life and damage. Category 1 and 2 storms are still
dangerous and require preventative measures (NOAA 2013). Figure 5.4.6-4 presents this scale, which is used to
estimate the potential property damage and flooding expected when a hurricane makes landfall.

Figure 5.4.6-4. The Saffir-Simpson Scale

Source: Disaster Readiness Portal 2017

Mean Return Period
In evaluating the potential for hazard events of a given magnitude, a MRP is often used. The MRP provides an
estimate of the magnitude of an event that may occur within any given year based on past recorded events. MRP

          DMA 2000 Hazard Mitigation Plan Update – Burlington County, New Jersey                        5.4.6-9
          March 2019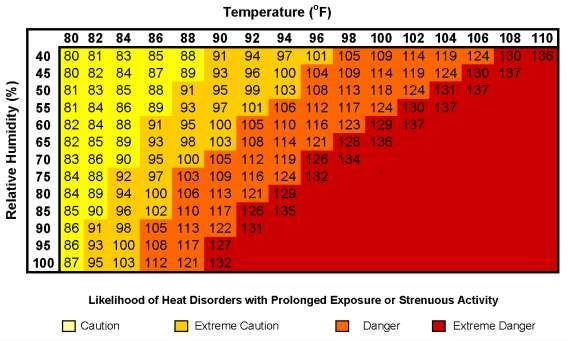
SECTION 5.4.6: RISK ASSESSMENT – SEVERE WEATHER

is the average period of time, in years, between occurrences of a particular hazard event, equal to the inverse of
the annual frequency of exceedance (Dinicola 2009).

Figure 5.4.6-5 and Figure 5.4.6-6 display the estimated maximum 3-second gust wind speeds that can be
anticipated in the study area associated with the 100- and 500-year MRP events. These peak wind speed
projections were generated using HAZUS-MH model runs. The maximum 3-second gust wind speeds for
Burlington County are 64 to 84 mph (Tropical Storm to Category 1 hurricane), for the 100-year MRP event. The
maximum 3-second gust wind speeds for Burlington County are 82 to 98 mph (Category 1 hurricane), for the
500-year MRP event. The storm tracks for the 100- and 500-year event were not available in HAZUS-MH 4.0;
a HAZUS-acknowledged error in this version that will be addressed in the future. The associated impacts and
losses from these 100-year and 500-year MRP hurricane events are discussed later in the Vulnerability
Assessment subsection.

        DMA 2000 Hazard Mitigation Plan Update – Burlington County, New Jersey                           5.4.6-10
        March 2019
SECTION 5.4.6: RISK ASSESSMENT – SEVERE WEATHER
Figure 5.4.6-5. Wind Speeds for the 100-Year Mean Return Period Event
Source: HAZUS-MH 4.0
DMA 2000 Hazard Mitigation Plan Update – Burlington County, New Jersey 5.4.6-11
March 2019SECTION 5.4.6: RISK ASSESSMENT – SEVERE WEATHER
Figure 5.4.6-6. Wind Speeds for the 500-Year Mean Return Period Event
Source: HAZUS-MH 4.0
DMA 2000 Hazard Mitigation Plan Update – Burlington County, New Jersey 5.4.6-12
March 2019SECTION 5.4.6: RISK ASSESSMENT – SEVERE WEATHER
Extreme Temperature
Extreme Heat
NOAA’s heat alert procedures are based mainly on Heat Index values. The Heat Index is given in degrees
Fahrenheit. The Heat Index is a measure of how hot it really feels when relative humidity is factored in with the
actual air temperature. To find the Heat Index temperature, the temperature and relative humidity need to be
known. Once both values are known, the Heat Index will be the corresponding number with both values (Figure
5.4.6-7). The Heat Index indicated the temperature the body feels. It is important to know that the Heat Index
values are devised for shady, light wind conditions. Exposure to full sunshine can increase heat index values by
up to 15°F. Strong winds, particularly with very hot dry air, can also be extremely hazardous (NWS 2013).
Figure 5.4.6-7. NWS Heat Index Chart
Source: NWS 2016
°F degrees Fahrenheit
% percent
Figure 5.4.6-8. Adverse Effects of Prolonged Exposures to Heat on Individuals
Category Heat Index Health Hazards
Extreme Danger 130 F – Higher Heat Stroke / Sunstroke is likely with continued exposure.
Sunstroke, muscle cramps, and/or heat exhaustion possible with
Danger 105 F – 129 F
prolonged exposure and/or physical activity.
Sunstroke, muscle cramps, and/or heat exhaustions possible with
Extreme Caution 90 F – 105 F
prolonged exposure and/or physical activity.
Caution 80 F – 90 F Fatigue possible with prolonged exposure and/or physical activity.
Source: NWS 2009
°F degrees Fahrenheit
DMA 2000 Hazard Mitigation Plan Update – Burlington County, New Jersey 5.4.6-13
March 2019SECTION 5.4.6: RISK ASSESSMENT – SEVERE WEATHER
Extreme Cold
The extent (severity or magnitude) of extreme cold temperatures are generally measured through the Wind Chill
Temperature (WCT) Index. Wind Chill Temperature is the temperature that people and animals feel when
outside and it is based on the rate of heat loss from exposed skin by the effects of wind and cold. As the wind
increases, the body is cooled at a faster rate causing the skin’s temperature to drop (NWS 2001).
On November 1, 2001, the NWS implemented a new WCT Index. It was designed to more accurately calculate
how cold air feels on human skin. The table below shows the new WCT Index. The WCT Index includes a
frostbite indicator, showing points where temperature, wind speed, and exposure time will produce frostbite to
humans. Figure 5.4.6-9 shows three shaded areas of frostbite danger. Each shaded area shows how long a person
can be exposed before frostbite develops (NWS 2001).
Figure 5.4.6-9. NWS Wind Chill Index
Source: NWS 2001
°F degrees Fahrenheit
mph miles per hour
Warning Time
Meteorologists can accurately forecast extreme temperature event development and the severity of the associated
conditions with several days lead time. These forecasts provide an opportunity for public health and other
officials to notify vulnerable populations. For heat events, the NWS issues excessive heat outlooks when the
potential exists for an excessive heat event in the next three to seven days. Watches are issued when conditions
are favorable for an excessive heat event in the next 24 to 72 hours. Excessive heat warning/advisories are issued
when an excessive heat event is expected in the next 36 hours (NWS 2013). Winter temperatures may fall to
extreme cold readings with no wind occurring. Currently, the only way to headline very cold temperatures is
with the use of the NWS-designated Wind Chill Advisory or Warning products. When actual temperatures reach
Wind Chill Warning criteria with little to no wind, extreme cold warnings may be issued (NWS Date Unknown
a).
DMA 2000 Hazard Mitigation Plan Update – Burlington County, New Jersey 5.4.6-14
March 2019SECTION 5.4.6: RISK ASSESSMENT – SEVERE WEATHER
Previous Occurrences and Losses
Many sources provided historical information regarding previous occurrences and losses associated with severe
weather events throughout Burlington County. With so many sources reviewed for the purpose of this HMP,
loss and impact information for many events could vary depending on the source. Therefore, the accuracy of
monetary figures discussed is based only on the available information identified during research for this HMP.
Based on the Midwestern Regional Climate Center (MRCC) data for Burlington County, Table 5.4.8-6 presents
the extreme cold (minimum) and hot (maximum) temperature records for the weather stations located in
Burlington County between 1836 and 2018.
Table 5.4.6-4. MRCC Temperature Extremes
Highest Max Lowest Minimum
Station Name (°F) Date (°F) Date
Burlington 106 July 10, 1936 -14 February 9, 1934
Chatsworth 104 July 19, 1977 -15 January 18, 1965
Indian Mills 2 W 107 July 2, 1901 -25 February 9, 1934
McGuire AFB 101 July 3, 1966 -4 February 2, 1961
Moorestown 106 July 10, 1936 -13 February 9, 1934
Mount Holly South Jersey Regional AP 104 July 6, 2010 -3 January 4, 2014
Pemberton 107 July 10, 1936 -17 February 9, 1934
Philadelphia/Mt. Holly WFO 103 July 7, 2010 -6 January 19, 1994
Source: MRCC 2018
Note: There may be some potential problems with the data collected at the stations. The values of the all-time records for stations with
brief histories are limited in accuracy and could vary from nearby stations with longer records. Although the data sets have been
through quality control, there is still a need for more resources to quality control extremes. The record sets are for single stations
in the cooperative observer network and are limited to the time of operation of each station under one coop number. The records
for a place may need to be constructed from several individual station histories. Some of the data may vary from NWS records due
to NWS using multiple stations and additional sources like record books (MRCC, Date Unknown).
Between 1954 and 2018, the State of New Jersey was included in 32 FEMA declared severe weather-related
disasters (DR) or emergencies (EM) classified as one or a combination of the following hazards: coastal storm,
high tides, heavy rain, flooding, hurricane, tropical storm, Nor’Easter, straight-line winds, and mudslide.
Generally, these disasters cover a wide region of the State; therefore, they may have impacted many counties.
Of those declarations, Burlington County has been included in 11 declarations (FEMA 2018). Since the original
2013 HMP, Burlington County has been included in the FEMA disaster declarations for two additional
declarations. Table 5.4.6-7 lists FEMA DR and EM declarations from January 1, 2012 to March 2019 for this
HMP update.
Table 5.4.6-5. FEMA DR and EM Declarations Since 2012 for Severe Storm Events in Burlington
County
FEMA
Declaration
Number Date(s) of Event Event Type Location
Atlantic, Bergen, Burlington, Camden, Cape May,
DR-4086, EM October 26 – Cumberland, Essex, Gloucester, Hudson, Hunterdon, Mercer,
Hurricane Sandy
3354 November 8, 2012 Middlesex, Monmouth, Morris, Ocean, Passaic, Salem,
Somerset, Sussex, Union, and Warren
DR-4231 June 23, 2015 Severe Storm Atlantic, Burlington, Camden, and Gloucester
Source: FEMA 2018
DMA 2000 Hazard Mitigation Plan Update – Burlington County, New Jersey 5.4.6-15
March 2019SECTION 5.4.6: RISK ASSESSMENT – SEVERE WEATHER
Agriculture-related severe weather disasters are quite common. One-half to two-thirds of the counties in the U.S.
have been designated as disaster areas in each of the past several years. The USDA Secretary of Agriculture is
authorized to designate counties as disaster areas to make emergency loans to producers suffering losses in those
counties and in counties that are contiguous to a designated county. Between 2012 and 2018, New Jersey has
been included in 10 USDA severe weather-related declarations. Burlington County was included in six of these
declarations, to date.
• S3487 – June-November 2012 – disaster declared as a result of the combined effects of drought, high
winds (derecho), hail, excessive heat, excessive rain, flash flooding, Hurricane Sandy, a snowstorm, and
a Nor’Easter; over $62,000 in claims filed in Burlington County
• S3603 – May-September 2013 – disaster declared as a result of the combined effects of excessive rain,
related flooding, high winds, and hail
• S3930 – April-September 2015 – disaster declared as a result of excessive heat and drought; over
$328,000 in claims filed in Burlington County
• S3931 – May-July 2015 – disaster declared as a result of excessive rain, flash flooding, high winds, and
lightning; over $328,000 in claims filed in Burlington County
• S3932 – July-September 2015 – disaster declared as a result of excessive heat and drought; over
$328,000 in claims filed in Burlington County
• S4071 – April-September 2016 – disaster declared as a result of the combined effects of freeze,
excessive heat, and drought; over $203,000 in claims filed in Burlington County
For this 2019 HMP update, severe weather events were summarized from January 1, 2012 to March 2019.
Known severe weather events, including FEMA disaster declarations, which have impacted Burlington County
between 2012 and 2018 are identified in Table 5.4.6-6. For events prior to 2012, please refer to the 2013 HMP.
Please note that not all events that have occurred in Burlington County are included due to the extent of
documentation and the fact that not all sources may have been identified or researched. Loss and impact
information could vary depending on the source. Therefore, the accuracy of monetary figures discussed is based
only on the available information identified during research for this HMP update. Please see Section 9 for
detailed information regarding impacts and losses to each municipality.
DMA 2000 Hazard Mitigation Plan Update – Burlington County, New Jersey 5.4.6-16
March 2019SECTION 5.4.6: RISK ASSESSMENT – SEVERE WEATHER
Table 5.4.6-6. Severe Weather Events in Burlington County, 2012 to 2018
FEMA
Declaration
Number County
Dates of Event Event Type (if applicable) Designated? Losses / Impacts
A strong thunderstorm knocked down one tree onto a house on Montrose Lane in
the Millbrook Park section of Willingboro Township. Doppler Radar suggested the
June 1, 2012 Thunderstorm Wind N/A N/A
wind gusts were around 45 mph. No injuries were reported. Willingboro reported
$10,000 in property damages.
Post Tropical Storm Sandy was the costliest natural disaster by far in the state of New
Jersey. Record breaking high tides and wave action combined with sustained winds as
high as 60 to 70 mph with wind gusts as high as around 90 mph to batter the state.
Statewide, Sandy caused an estimated $29.4 billion in damage, destroyed or significantly
damaged 30,000 homes and businesses, affected 42,000 additional structures and was
responsible directly or indirectly for 38 deaths. A new temporary inlet formed in
Mantaloking (Ocean County) where some homes were swept away. About 2.4 million
households in the state lost power. It would take two weeks for power to be fully
restored to homes and businesses that were inhabitable. In the Mount Holly warning and
forecast area of New Jersey, Sandy was responsible for 24 deaths, 8 that are considered
directly caused by the system: two drownings, five people killed by fallen trees and one
person was blown over by the wind. Hardest hit were the coastal areas of Ocean and
Monmouth Counties. Approximately 230,000 residents of the state have applied for
assistance from FEMA.
October 29-30,
Hurricane Sandy DR-4086, EM 3354 Yes In Burlington County, heavy rain caused urban and poor drainage flooding and
2012
exacerbated the tidal flooding along the Delaware River and near the Atlantic Coast.
Along the Delaware River, tidal flooding occurred in the Columbus Park development
along Assiscunk Creek in the City of Burlington. In Mount Laurel Township, Union
Mill Road was closed because Parkers Creek flooded.
Rainfall totals in Burlington County included 4.10 inches in Medford Township, 3.51
inches in Chatsworth, 3.15 inches in Medford Lakes, 2.92 inches in Mount Laurel
Township, 2.82 inches in Morrestown Township and 2.42 inches in Westampton
Township. Peak wind gusts in the County ranged from 56 mph in Woodland Township
to 70 mph in Florence Township.
The most widespread damage in Burlington County was reported in Bass River
Township, mainly due to tidal and flood-related damages. In Mount Holly Township, a
resident was trapped inside their home after a tree landed on the house. Seven roadways
in Medford Township were closed due to downed trees. Overall, the County reported
approximately $5 million in property damage from Hurricane Sandy.
December 26, A 54 mph gust was reported in Florence Township; $10,000 in property damages
Strong Wind N/A N/A
2012 were reported.
A 49 mph gust was recorded at Coyle Field (Woodland Township); $5,000 in
March 6, 2013 Strong Wind N/A N/A
property damages were reported.
DMA 2000 Hazard Mitigation Plan Update – Burlington County, New Jersey 5.4.6-17
March 2019SECTION 5.4.6: RISK ASSESSMENT – SEVERE WEATHER
FEMA
Declaration
Number County
Dates of Event Event Type (if applicable) Designated? Losses / Impacts
Strong to severe thunderstorms moved across central and southern New Jersey,
bringing damaging winds, hail and lightning strikes. In Burlington County, a
June 24, 2013 Lightning N/A N/A
lightning strike caused minor damage to a home in Shamong Township. The
Township reported $5,000 in property damage from this event.
Strong thunderstorms in Burlington County brought strong winds and lightning. A
July 21, 2013 Lightning N/A N/A lightning strike took down a couple of wires in Bordentown Township. Bordentown
Township reported $1,000 in property damages.
A severe thunderstorm knocked down numerous trees and wires in Shamong
Township with the wind damage centered around Indian Mills Road. A few homes
were damaged by downed trees and a roof was blown off a barn. One downed tree
August 13, 2013 Thunderstorm Wind N/A N/A
crashed through the bedroom roof of one home. Indian Mills Road remained closed
for most of the day. No serious injuries were reported. Indian Mills reported
$50,000 in property damages.
Strong northwest winds moved across New Jersey, bringing peak wind gusts of
around 50 mph to 60 mph in central and southern New Jersey. In Burlington
March 12, 2014 Strong Wind N/A N/A
County, gusts of 49 mph were recorded at McGuire Air Force Base and 45 mph was
recorded in Lumberton Township. The winds caused $10,000 in property damage.
A thunderstorm dropped penny size hail in Burlington Township and Florence
Township. A 56 mph wind gust was also measured with this thunderstorm in
May 10, 2014 Hail N/A N/A
Burlington Township. Burlington Township reported $500 in property damages;
Florence Township reported $500 in property damages.
A lightning strike and ensuing fire left several people displaced from their homes in
a condominium complex on Friday night on Tarnbrook Drive in Mount Laurel
Township. Eight units were declared uninhabitable after the blaze, which was
May 23, 2014 Lightning N/A N/A controlled in less than an hour. Four nearby townships assisted in battling the blaze.
Lightning struck the upper part of the building and started a roof fire. Other
condominium units suffered fire, smoke and water damage. Springville reported
$250,000 in property damages.
A severe thunderstorm damaged sail boats in the Delaware River off of
July 2, 2014 Thunderstorm Wind N/A N/A Cinnaminson Township. No injuries were reported. Palmyra Borough reported
$10,000 in property damages.
A lightning strike and ensuing fire damaged a home in Beverly City. No injuries
July 3, 2014 Lightning N/A N/A
were reported. Beverly City reported $25,000 in property damages.
A severe thunderstorm caused wind damage in Southampton Township. Trees and
power lines were knocked down and an irrigation pipe was blown across Buddtown
July 14, 2014 Thunderstorm Wind N/A N/A
Road. Nearly 4,300 homes and businesses lost power in Burlington County.
Vincentown reported $10,000 in property damages.
A severe thunderstorm knocked down large tree limbs and wires around New Jersey
Lightning,
July 15, 2014 N/A N/A State Route 70 in from Friendship Road east to Big Hill Road in Southampton
Thunderstorm Wind
Township. North Friendship reported $5,000 in property damages. The storm
DMA 2000 Hazard Mitigation Plan Update – Burlington County, New Jersey 5.4.6-18
March 2019SECTION 5.4.6: RISK ASSESSMENT – SEVERE WEATHER
FEMA
Declaration
Number County
Dates of Event Event Type (if applicable) Designated? Losses / Impacts
knocked down large tree limbs and wires in Tabernacle Township resulting in
$5,000 in property damages. Lightning struck the Shawnee Baptist Church on
Oakshade Road in Shamong Township. Tabernacle Township reported $5,000 in
property damages.
A severe thunderstorm tore down several trees and caused wind damage in the Hoot
Owl subdivision of Medford Township. Two homes suffered major damage and
were uninhabitable. A tree fell onto a home on Christopher Mills Road. About four
Lightning, or five other homes suffered shingle or siding damage. Three vehicles were also
July 28, 2014 N/A N/A
Thunderstorm Wind damaged by fallen trees. Lake Pine reported $1,000,000 in property damages.
A lightning strike and ensuing fire destroyed a shed and its contents on Ridge Road
in Southampton Township. Buddtown (Southampton Township) reported $3,000 in
property damages.
A severe thunderstorm knocked down a tree that damaged the roof of a home in
Wrightstown Borough resulting in $20,000 in property damages. Trees were
April 22, 2015 Thunderstorm Wind N/A N/A
knocked down trees along New Jersey State Route 70 in Pemberton Township
resulting in $20,000 in property damages at Country Lake Estates.
A severe thunderstorm knocked down a couple of trees in Washington Township,
May 28, 2015 Thunderstorm Wind N/A N/A one of which fell onto and damaged a home. Jenkins reported $10,000 in property
damages.
A severe thunderstorm knocked down several trees in Palmyra Borough. Riverton
Borough reported $50,000 in property damages. A severe thunderstorm knocked
down several trees in Maple Shade Township. One downed tree damaged a home
resulting in $50,000 in property damages. Dozens of trees were knocked down in
Evesboro resulting in $50,000 in property damages. $1,000,000 in property
damages were reported in Mount Laurel Township as trees were snapped, siding
was ripped from some homes, and sheds and fences destroyed.
In Medford Township, hundreds upon hundreds of trees were either uprooted or
snapped. Three people were injured after a tree fell onto their vehicle. Another
June 23, 2015 Thunderstorm Wind DR-4231 Yes person was injured after a tree fell on their home on Mississippi Trail. Several other
people were trapped in their homes. Some gas lines were ruptured. A firefighter
suffered cardiac arrest the next day after assisting people through the night. There
were approximately 350 calls for assistance because of wind damage from the
thunderstorms within the township. Medford Township reported $8,000,000 in
property damages. Medford Lakes Borough had multiple downed trees resulting in
$1,000,000 in property damages.
In Tabernacle Township the storm knocked down several trees. One downed tree
fell onto and damaged a truck. The thunderstorm winds also damaged the roof of
Seneca High School. Tabernacle Township reported $100,000 in property damages.
DMA 2000 Hazard Mitigation Plan Update – Burlington County, New Jersey 5.4.6-19
March 2019SECTION 5.4.6: RISK ASSESSMENT – SEVERE WEATHER
FEMA
Declaration
Number County
Dates of Event Event Type (if applicable) Designated? Losses / Impacts
Vincentown and Jenkins each reported $50,000 in property damages from downed
trees.
A utility pole and downed wires due to wind on route 73 in Maple Shade Township
March 28, 2016 Strong Wind N/A N/A
due to wind. $10,000 in property damages were reported.
Severe thunderstorms caused wind damage across portions of southwestern New
jersey. Rainfall amounts of one to three inches fell along the I-95/New Jersey
July 3, 2018 Hail N/A N/A
Turnpike corridor. In Burlington County, nickel to quarter size hail was reported in
Riverside Township.
Source: NOAA-NCEI 2018, FEMA 2018
DR Major Disaster Declaration (FEMA)
EM Emergency Disaster Declaration (FEMA)
FEMA Federal Emergency Management Agency
Mph miles per hour
NOAA National Oceanic and Atmospheric Administration
NCEI National Center for Environmental Information
DMA 2000 Hazard Mitigation Plan Update – Burlington County, New Jersey 5.4.6-20
March 2019SECTION 5.4.6: RISK ASSESSMENT – SEVERE WEATHER
Table 5.4.6-7 documents the number of severe weather events that have occurred in Burlington County from
1950 to 2018, including the number of fatalities, injuries, property damages, and crop damages that have been
associated with severe weather according to the NOAA National Climatic Data Center (NCEI) Storm Events
Database. Between 1950 and 2018, Burlington County has experienced 1,210 severe weather events resulting
in three fatalities, 59 injuries, over $135 million in property damage, and over $1 million in crop damages. Please
note that the information provided in the NOAA-NCEI database includes information as reported by the NWS.
The NWS receives their information from a variety of sources, including but not limited to: county, state and
federal emergency management officials, local law enforcement officials, skywarn spotters, NWS damage
surveys, newspaper clipping services, the insurance industry and the general public, among others. It may not
include all losses associated with the events.
Table 5.4.6-7. Severe Weather Events 1950-2018
Number of
Occurrences Total
Between 1950 Property Total Crop
Hazard Type and 2018 Total Fatalities Total Injuries Damage ($) Damage ($)
Excessive Heat 39 1 1 0 0
Extreme Cold/Wind 4 0 0 0 0
Chill
Funnel Cloud 14 0 0 0 0
Hail 100 0 0 $1,000 0
Heat 84 3 3 0 0
Heavy Rain 287 0 0 $1,000,000 0
High Wind 47 0 3 $101,426,000 0
Hurricane 0 0 0 0 0
Lightning 45 1 21 $3,071,000 0
Strong Wind 207 0 0 $657,890 $20
Thunderstorm Wind 364 1 16 $25,715,000 $1,000,000
Tornado 15 1 8 $2,430,000 0
Tropical Storm 4 0 1 $1,000,000 0
TOTAL 1,210 7 53 $135,300,890 $1,000,020
Source: NOAA-NCEI 2018
Probability of Future Occurrences
Predicting future severe weather events in a constantly changing climate has proven to be a difficult task.
Predicting extremes in New Jersey and Burlington County is particularly difficult because of their geographic
location. Both are positioned roughly halfway between the equator and the North Pole and are exposed to both
cold and dry airstreams from the south. The interaction between these opposing air masses often leads to
turbulent weather across the region (Keim 1997).
It is estimated that Burlington County will continue to experience direct and indirect impacts of severe weather
events annually that may induce secondary hazards such as flooding, infrastructure deterioration or failure, utility
failures, power outages, water quality and supply concerns, and transportation delays, accidents and
inconveniences.
Extreme temperatures are expected to occur more frequently as part of regular seasons. Specifically, extreme
heat will continue to impact New Jersey and its counties and, based upon data presented, will increase in the
DMA 2000 Hazard Mitigation Plan Update – Burlington County, New Jersey 5.4.6-1
March 2019SECTION 5.4.6: RISK ASSESSMENT – SEVERE WEATHER
next several decades. As previously stated, several extreme temperature events occur each year in Burlington
County. It is estimated that the county will continue to experience these events annually.
In order to determine the recurrence interval and the average annual number of events, data from 1950 to 2018
was examined using the NOAA National Climatic Data Center (NCEI) Storm Events Database to calculate these
statistics for Burlington County. According to the database, Burlington County experienced 1,210 severe weather
events. The table below shows these statistics, as well as the annual average number of events and the percent
chance of these individual severe weather events occurring in Burlington County in future years.
Table 5.4.6-8. Probability of Future Occurrences of Severe Weather Events
Recurrence
Number of Rate of Occurrence Interval (in Percent chance
Occurrences or years) Probability of of occurrence
Between 1950 Annual Number of (# Years/Number Event in any in any given
Hazard Type and 2018 Events (average) of Events) given year year
Excessive Heat 39 0.57 1.77 0.57 56.52%
Extreme Cold/Wind
4 0.06 17.25 0.06 5.80%
Chill
Funnel Cloud 14 0.21 4.93 0.20 20.29%
Hail 100 1.47 0.69 1.45 100%
Heat 84 1.24 0.82 1.22 100%
Heavy Rain 287 4.22 0.24 4.16 100%
High Wind 47 0.69 1.47 0.68 68.12%
Hurricane 0 0 0 0 0%
Lightning 45 0.66 1.53 0.65 65.22%
Strong Wind 207 3.04 0.33 3.00 100%
Thunderstorm Wind 364 5.35 0.19 5.28 100%
Tornado 15 0.22 4.60 0.22 21.74%
Tropical Storm 4 0.06 17.25 0.06 5.80%
``Source: NOAA-NCEI 2018; SPC 2018
In Section 5.3, the identified hazards of concern for Burlington County were ranked. The probability of
occurrence, or likelihood of the event, is one parameter used for hazard rankings. Based on historical records
and input from the Planning Committee, the probability of occurrence for severe weather events in the county is
considered ‘frequent’ (likely to occur within 25 years, as presented in Table 5.3-3).
Climate Change Impacts
Providing projections of future climate change for a specific region is challenging. Shorter term projections are
more closely tied to existing trends making longer term projections even more challenging. The further out a
prediction reaches the more subject to changing dynamics it becomes.
Both northern and southern New Jersey have become wetter over the past century. Northern New Jersey’s 1971-
2000 precipitation average was over five inches (12-percent) greater than the average from 1895-1970
(Sustainable Jersey Climate Change Adaptation Task Force [CATF] 2011). Average annual precipitation is
projected to increase in the region by four to 11-percent by the 2050s and five to 13-percent by the 2080s. (New
York City Panel on Climate Change [NPCC] 2015).
DMA 2000 Hazard Mitigation Plan Update – Burlington County, New Jersey 5.4.6-2
March 2019SECTION 5.4.6: RISK ASSESSMENT – SEVERE WEATHER
As the climate changes, temperatures and the amount of moisture in the air will both increase, thus leading to an
increase in the severity of thunderstorms which can lead to derechos and tornadoes. Studies have shown that an
increase in greenhouse gases in the atmosphere would significantly increase the number of days that severe
thunderstorms occur in the southern and eastern United States (National Aeronautics and Space Administration
[NASA] 2005).
As prepared by the NASA, Figure 5.4.6-10 identifies those areas, particularly within the eastern United States,
that are predicted to be more prone to thunderstorms, including New Jersey and Burlington County. NASA
scientists suggest that the United States will face more severe thunderstorms in the future, with deadly lightning,
damaging hail, and the potential for tornadoes in the event of climate change. A recent study conducted by
NASA predicts that smaller storm events like thunderstorms will also be more dangerous due to climate change.
Figure 5.4.6-10. Predicted Change in Severe Thunderstorm Environment Days from the 1962-1989
Period to the 2072-2099 Period
Source: NASA 2013
Temperatures in the Northeast United States have increased 1.5 degrees Fahrenheit (°F) on average since 1900,
with the regional warming trend greater in the Northeast than in the United States as a whole. Most of this
warming has occurred since 1970. The State of New Jersey, for example, has observed an increase in average
annual temperatures of 1.2°F between the period of 1971-2000 and the most recent decade of 2001-2010 (CATF
2011). Winter temperatures across the Northeast have seen an increase in average temperature of 4°F since 1970
(Northeast Climate Impacts Assessment [NECIA] 2007). By the 2020s, the average annual temperature in New
Jersey is projected to increase by 1.5°F to 3°F above the statewide baseline (1971 to 2000), which was 52.7°F.
By 2050, the temperature is projected to increase 3°F to 5°F (Sustainable Jersey Climate Change Adaptation
Task Force 2013).
DMA 2000 Hazard Mitigation Plan Update – Burlington County, New Jersey 5.4.6-3
March 2019SECTION 5.4.6: RISK ASSESSMENT – SEVERE WEATHER
5.4.6.2 VULNERABILITY ASSESSMENT
Wind-related vulnerability data was generated using a HAZUS analysis for the severe storm hazard. A
probabilistic assessment was conducted for the 100- and 500-year MRPs through a Level 2 analysis in HAZUS-
MH 4.0 to analyze the severe storm hazard and provide a range of loss estimates. Storm surge impacts were
assessed using SLOSH data from FEMA’s Coastal Flood Loss Atlas. The other severe weather hazards profiled
above were assess qualitatively. Refer to Section 5.1 for additional details on the methodology used to assess
severe weather risk.
Impact on Life, Health and Safety
For the purposes of this HMP, the entire population of Burlington County (448,734 people) is exposed to severe
weather events (U.S. Census, 2010). Residents may be displaced or require temporary to long-term sheltering due
to severe weather events. In addition, downed trees, damaged buildings, and debris carried by high winds can
lead to injury or loss of life. Socially vulnerable populations are most susceptible, based on a number of factors
including their physical and financial ability to react or respond during a hazard and the location and construction
quality of their housing.
People located outdoors (i.e., recreational activities and farming) are considered most vulnerable to hailstorms,
thunderstorms and tornadoes. This is because there is little to no warning and shelter may not be available.
Moving to a lower risk location will decrease a person’s vulnerability.
Extreme temperatures generally occur for a short period of time but can cause a range of impacts, particularly to
vulnerable populations that may not have access to adequate cooling or heating. Extreme temperature events
have potential health impacts including injury and death. According to the Centers for Disease Control and
Prevention, populations most at risk to extreme cold and heat events include the following: 1) the elderly, who are
less able to withstand temperatures extremes due to their age, health conditions and limited mobility to access
shelters; 2) infants and children up to four years of age; 3) individuals who are physically ill (e.g., heart disease or
high blood pressure), 4) low-income persons that cannot afford proper heating and cooling; and 5) the general
public who may overexert during work or exercise during extreme heat events or experience hypothermia during
extreme cold events (CDC, 2007; CDC 2009).
Meteorologists can accurately forecast extreme heat event development and the severity of the associated
conditions with several days of lead time. These forecasts provide an opportunity for public health and other
officials to notify vulnerable populations, implement short-term emergency response actions and focus on
surveillance and relief efforts on those at greatest risk. Adhering to extreme temperature warnings can
significantly reduce the risk of temperature-related deaths.
Due to the large geographic area the County covers with both coastal and inland locations, the loss associated
with hurricanes can vary across the County; secondary flooding associated with the torrential downpours during
hurricanes/tropical storms is also a primary concern in the County (see flooding discussion in Section 5.4.4
Flood). The estimated population in the Category 1 through 4 inundation zones is summarized in Table 5.4.6-9
by municipality. For the Category 1 inundation zone, Burlington City has the greatest total exposure with 272
people located in the inundation zone. For the Category 2 and Category 3 inundation zones, Bass River Township
has the greatest total exposure with 962 and 977 people located in the Category 2 and Category 3 inundation zones,
respectively. For the Category 4 inundation zone, Palmyra Borough has the greatest total exposure with 4,067
people located in the hazard area.
DMA 2000 Hazard Mitigation Plan Update – Burlington County, New Jersey 5.4.6-4
March 2019SECTION 5.4.6: RISK ASSESSMENT – SEVERE WEATHER
Table 5.4.6-9. Estimated Population Exposed to Storm Surge in Burlington County
Total Population in Hazard Area
Population
(U.S.
Census Cat 1 % of Cat 2 % of
Municipality 2010) Exposure Total Exposure Total Cat 3 Exposure % of Total Cat 4 Exposure % of Total
Bass River Township 1,443 55 3.8% 962 66.7% 977 67.7% 1,337 92.7%
Beverly City 2,577 0 0.0% 0 0.0% 0 0.0% 0 0.0%
Bordentown City 3,924 0 0.0% 0 0.0% 0 0.0% 0 0.0%
Bordentown Township 11,367 0 0.0% 0 0.0% 0 0.0% 0 0.0%
Burlington City 9,920 272 2.7% 272 2.7% 272 2.7% 272 2.7%
Burlington Township 22,594 0 0.0% 0 0.0% 8 0.0% 446 2.0%
Chesterfield Township 7,699 0 0.0% 0 0.0% 0 0.0% 0 0.0%
Cinnaminson Township 15,569 0 0.0% 0 0.0% 0 0.0% 814 5.2%
Delanco Township 4,283 0 0.0% 0 0.0% 0 0.0% 0 0.0%
Delran Township 16,896 36 0.2% 36 0.2% 36 0.2% 218 1.3%
Eastampton Township 6,069 0 0.0% 0 0.0% 0 0.0% 0 0.0%
Edgewater Park Township 8,881 0 0.0% 0 0.0% 0 0.0% 0 0.0%
Evesham Township 45,538 0 0.0% 0 0.0% 0 0.0% 0 0.0%
Fieldsboro Borough 540 0 0.0% 0 0.0% 0 0.0% 0 0.0%
Florence Township 12,109 0 0.0% 0 0.0% 0 0.0% 0 0.0%
Hainesport Township 6,110 0 0.0% 11 0.2% 70 1.1% 90 1.5%
Lumberton Township 12,559 0 0.0% 161 1.3% 313 2.5% 410 3.3%
Mansfield Township 8,544 0 0.0% 0 0.0% 0 0.0% 0 0.0%
Maple Shade Township 19,131 0 0.0% 0 0.0% 0 0.0% 112 0.6%
Medford Lakes Borough 4,146 0 0.0% 0 0.0% 0 0.0% 0 0.0%
Medford Township 23,033 0 0.0% 0 0.0% 0 0.0% 0 0.0%
Moorestown Township 20,726 0 0.0% 0 0.0% 0 0.0% 0 0.0%
Mount Holly Township 9,536 0 0.0% 0 0.0% 0 0.0% 114 1.2%
Mount Laurel Township 41,864 0 0.0% 0 0.0% 3 0.0% 264 0.6%
New Hanover Township 7,385 0 0.0% 0 0.0% 0 0.0% 0 0.0%
North Hanover Township 7,678 0 0.0% 0 0.0% 0 0.0% 0 0.0%
Palmyra Borough 7,398 0 0.0% 0 0.0% 453 6.1% 4,067 55.0%
Pemberton Borough 1,409 0 0.0% 0 0.0% 0 0.0% 0 0.0%
Pemberton Township 27,912 0 0.0% 0 0.0% 0 0.0% 0 0.0%
Riverside Township 8,079 0 0.0% 0 0.0% 0 0.0% 0 0.0%
Riverton Borough 2,779 0 0.0% 0 0.0% 0 0.0% 1,261 45.4%
Shamong Township 6,490 0 0.0% 0 0.0% 0 0.0% 0 0.0%
Southampton Township 10,464 0 0.0% 0 0.0% 0 0.0% 0 0.0%
Springfield Township 3,414 0 0.0% 0 0.0% 0 0.0% 0 0.0%
Tabernacle Township 6,949 0 0.0% 0 0.0% 0 0.0% 0 0.0%
Washington Township 687 127 18.5% 396 57.6% 477 69.4% 505 73.5%
Westampton Township 8,813 0 0.0% 0 0.0% 0 0.0% 19 0.2%
DMA 2000 Hazard Mitigation Plan Update – Burlington County, New Jersey 5.4.6-5
March 2019You can also read