CLIMATE CHANGE, RESILIENCE, AND POPULATION DYNAMICS IN PAKISTAN - A CASE STUDY OF THE 2010 FLOODS IN MIANWALI DISTRICT - Population Council
←
→
Page content transcription
If your browser does not render page correctly, please read the page content below
RESEARCH TO
                                                       FILL CRITICAL
                                                       EVIDENCE GAPS

CLIMATE CHANGE, RESILIENCE, AND
POPULATION DYNAMICS IN PAKISTAN
A CASE STUDY OF THE 2010 FLOODS IN MIANWALI DISTRICT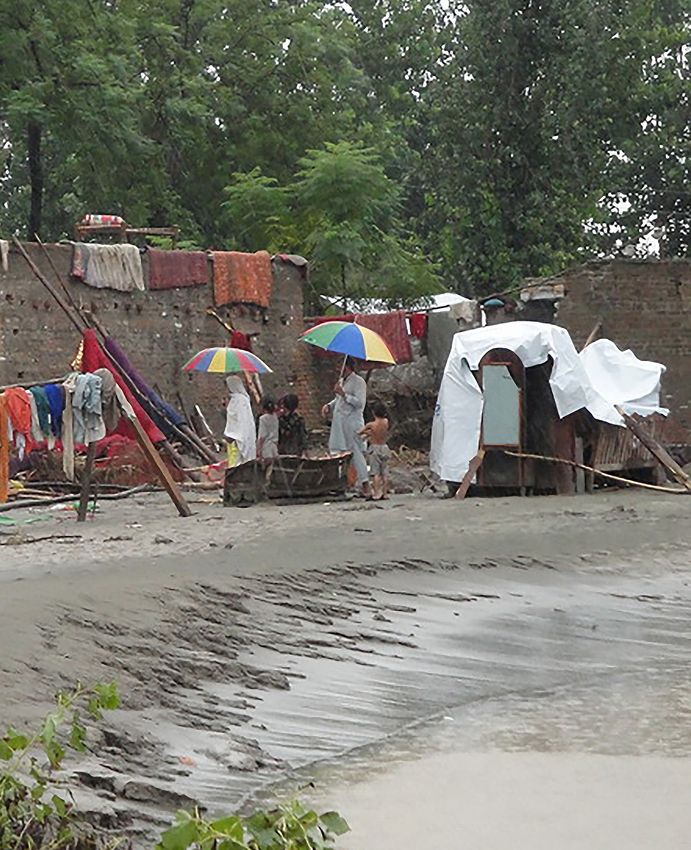
The Population Council is prioritizing research to
strengthen the evidence on resilience among those
who are vulnerable to environmental stressors. This
research is designed to fill evidence gaps and generate
the evidence decision-makers need to develop and
implement effective programs and policies.
popcouncil.org/research/climate-change-vulnerability-
and-resilience
For information on partnership and funding
opportunities, contact:
Jessie Pinchoff, jpinchoff@popcouncil.org
Suggested citation: Sathar, Zeba, A., Muhammad Khalil,
Sabahat Hussain, Maqsood Sadiq, and Kiren Khan. 2018.
“Climate Change, Resilience, and Population Dynamics
in Pakistan: A Case Study of the 2010 Floods in Mianwali
District.” Pakistan: Population Council.
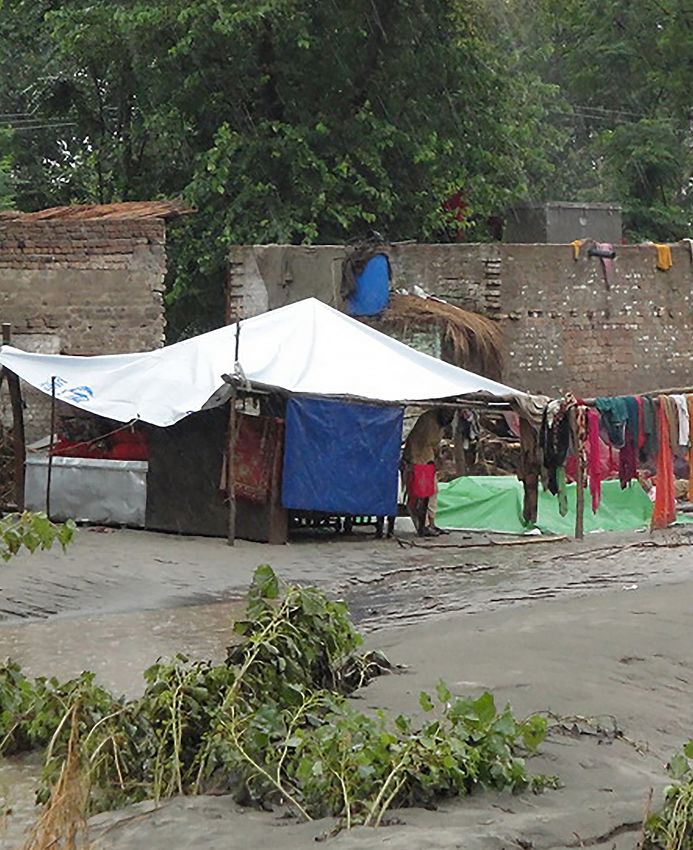
Photos: Population Council Staff Islamabad
© 2018 The Population Council, Inc
ii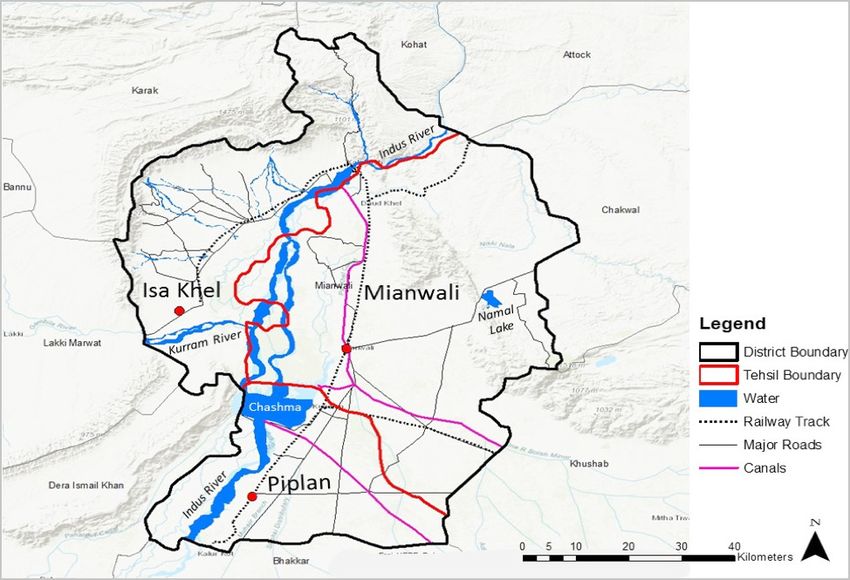
In 2010, Pakistan experienced massive flooding that went on
uninterrupted for more than eight weeks, and seriously affected
more than 20 million people. This study explores the effects of the
floods on one of the most adversely affected districts, Mianwali, in Punjab
province.

A multidisciplinary approach is taken to analyze available demographic
and geospatial data for a deeper understanding of the community-
level vulnerability to the 2010 floods, to identify demographic changes
potentially associated with the floods, and to describe the implications for
building resilience in regions at high risk of large-scale flood events. We
focus on four areas pertaining to resilience:

1. Movements and migration processes

2. Shifts in poverty levels and living conditions

3. Changes in livelihood activities

4. Health-seeking behavior, particularly fertility-related processes

This study highlights the need to include demographic and health
information in the analysis of natural disasters. We see this as the
beginning of a research agenda that can capitalize on data from the
Population Census, the Agriculture Census, and other sources to build a
national overview of how climate change is affecting people, livelihoods,
and health, and vice versa, in Pakistan.
ACKNOWLEDGMENTS
The authors gratefully acknowledge the support provided by colleagues at the
Population Council offices in Washington, DC, New York, and Islamabad. We
particularly thank Dr. Karen Hardee for providing the funding for this study and
the encouragement to pursue the RP4 agenda in Pakistan. Consultations with Dr.
Hardee, Dr. Sajeda Amin, and Dr. Jessie Pinchoff helped us refine our approach.
We thank Dr. Mark Montgomery for suggesting sources of data for the study after
our initial presentation in July 2017. Colleagues in Islamabad, especially Dr. Ali Mir,
Dr. Gul Rashida, Seemin Ashfaq, Iram Kamran, Rehan Niazi, and Tahira Parveen,
provided invaluable advice and guidance.
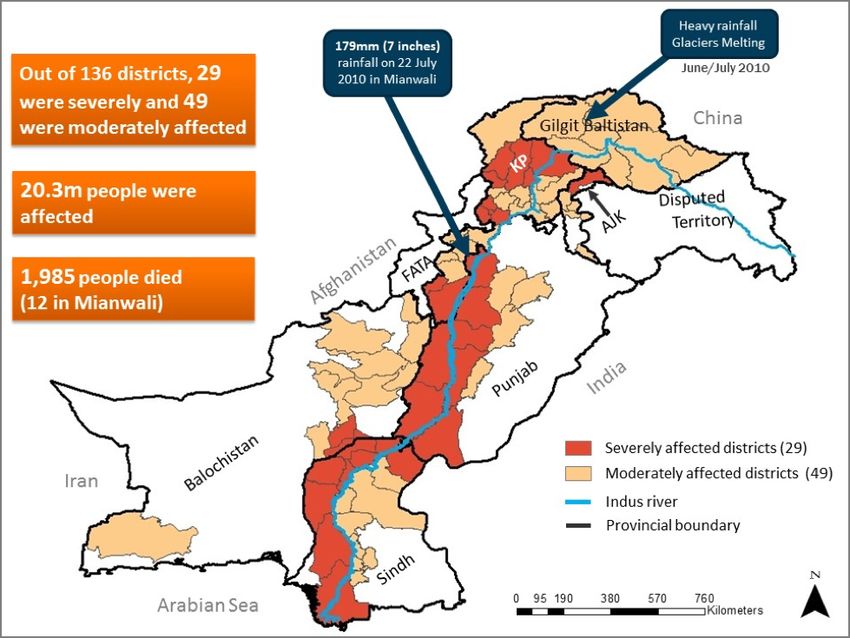
TABLE OF CONTENTS
Background............................................................................................................................................ 4

     The 2010 Floods............................................................................................................................... 4

     Climate Change and Flooding in Pakistan...................................................................................... 5

     Effects of Climate Change on Individuals, Families, and Communities....................................... 6

Rationale for the Study......................................................................................................................... 7

Findings.................................................................................................................................................. 8

     Mianwali’s Experience of the 2010 Floods..................................................................................... 8

     Evidence of Migration As an Adaptive Response of Mianwali’s Population After the 2010
     Floods............................................................................................................................................... 10

     Changes in the Economic Behavior of Mianwali’s Population That May Be Associated with
     the 2010 Floods, and Implications for Future Resilience ............................................................. 16

     Poverty Levels and Living Conditions in Mianwali After the 2010 Floods.................................... 19

     Changes in Behavior with Respect to Health (Especially Reproductive Health) and
     Education After the 2010 Floods.................................................................................................... 24

Conclusions............................................................................................................................................ 28

References.............................................................................................................................................. 30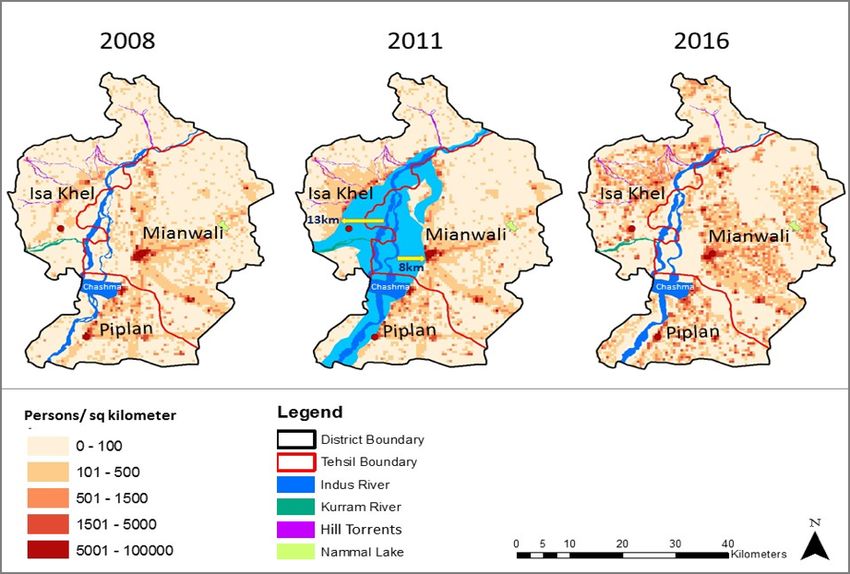
BACKGROUND
    THE 2010 FLOODS

    In 2010, Pakistan experienced massive flooding that left one-fifth of the country
    under water. Although Pakistan is prone to flooding, the scale of the 2010 floods
    was unprecedented. The flooding was induced by temperature rise in the north
    that led to glacier melting, accompanied by nine of the heaviest rains recorded in
    the country within a 24-hour period. These extreme events drastically increased
    the flow of the Indus River, swelling it to 40 times its normal volume, which caused
    serious flooding in the Indus Plain across the major provinces. The floods went on
    uninterrupted for more than eight weeks, inundating an area of 132,000 square
    kilometers (51,000 square miles). Approximately 2,000 people were killed, over
    1.9 million houses were destroyed, and more than 20 million people were seriously
    affected. Called a “tsunami in slow motion” by the UN Secretary General at the time
    (Guardian 2010), it was the largest disaster ever recorded in terms of the affected
    population, area covered, and number of households damaged (Najam-u-Din 2010;
    Solberg 2010). Figure 1 shows the extent of the damage and adverse impact of the
    2010 floods.

    FIGURE 1. Districts Affected by the 2010 Floods in Pakistan

                                                                                                        Heavy rainfall,
                                                    179mm (7 inches)                                    glaciers melting
                                                    rainfall on 22 July
         Out of 136 districts, 29                                                                       June/July 2010
                                                    2010 in Mianwali
         were severely and 49
         were moderately affected

          20.3m people were
          affected

         1985 people died
         (12 in Mianwali)

                                                                                          Severely affected districts (29)
                                                                                          Moderately affected districts (49)

                                                                                          Indus river
                                                                                          Provincial boundary

    SOURCE: UN Office for the Coordination of Humanitarian Affairs (UNOCHA), NDMA, and SUPARCO.

4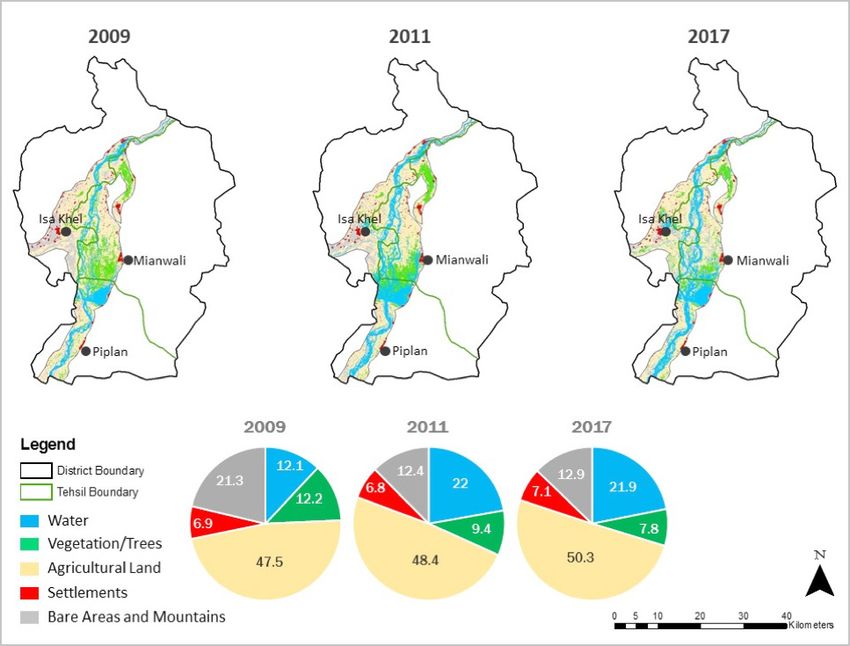
Statistics from the immediate aftermath of the 2010 floods are clear, yet less is
known about the longer-term effects on population dynamics, living patterns,
economic status, and health outcomes. The incidence and impact of floods in
Pakistan in terms of natural assets, infrastructure, and topography and terrain, are
well documented. However, studies in Pakistan largely do not address issues of
human vulnerabilities, resilience, and adaptation, which should inform strategies for
keeping the population safer when contending with future floods.

CLIMATE CHANGE AND FLOODING IN PAKISTAN

According to Global Climate Risk Index 2017, Pakistan is the seventh most seriously
affected country in terms of climate change (Kreft et al. 2016). This ranking is
based on a death toll of 523.1 lives per year over the last 20 years and economic
losses amounting to US$3.8 billion from 141 extreme weather events like floods,
glacial lake outburst floods, heat waves, and storms. The country is also now ranked
as the fifth most populous nation in the world, according to the 2017 Population and
Housing Census (PBS 2017).

Projections up to 2100 by the World Bank-Climate Change Knowledge Portal
(CCKP) indicate that the expected temperature increase in Pakistan is higher than
the expected global average increase (World Bank 2018). The general trend is an
increasing number of heavy rainfall events1 and increasing average temperatures
over the last 70 years. The data show that temperature increase in the northern
part of the country is higher than in the south: in the northern areas, the melting
of the Hindu Kush, Karakoram, and Himalayan glaciers due to rising temperatures
has created over 3,000 glacial lakes, of which 33 are considered prone to glacial
lake outburst floods. Millions of cubic meters of water can pour into the Indus River
and its tributaries in just a few hours, putting more than 7.1 million people at risk.
Pakistani National Climate Change Policy 2012 predicts that the largest national
climate change threats are the considerable increase in the frequency and intensity
of extreme weather events, coupled with erratic monsoon rains causing frequent
and intense floods and droughts. The Hindu Kush-Karakoram-Himalayan glaciers
are projected to recede, threatening huge water inflows into the Indus Basin
(Ministry of Climate Change 2012).

Despite the increasing risks, there are generally only limited early-warning systems
or disaster management and preparedness plans to protect communities. Erosion
by deforestation exacerbates the risks, and safety infrastructure, such as protective
walls and spillways, are largely lacking (UNDP 2016).

The melting of the glaciers in the north, combined with peaks in rainfall, have
contributed to a higher frequency and greater intensity of floods in the country
in recent years. The 2010 floods are notable for their severity (Federal Flood
Commission 2015).

1
    Defined as a daily rainfall total that exceeds the threshold that is exceeded on 5 percent of rainy days in the current
    climate of that region or season.
                                                                                                                              5
EFFECTS OF CLIMATE CHANGE ON INDIVIDUALS, FAMILIES, AND
COMMUNITIES
Although climate change and its adverse impacts are widely acknowledged in
the developing world (Nelson et al. 2009), its intersections with and effects on
individuals, families, communities, and countries over time are relatively less
studied. Brooks (2003) argues the importance of viewing vulnerability and
resilience to climate change more holistically, by paying attention to the social and
demographic aspects that mediate the outcome of this change, such as poverty,
housing quality, sources of livelihood, and demographic behaviors. Studies of
demographic and economic responses to climate-induced adverse events are
scant, including for Pakistan.
Both demography and economics can elucidate vulnerability to climate change and
capture changes related to adaptive capacity and resilience. Dodman et al. (2009)
suggest that resilience is a process that enables the ability to cope with added
shocks and stresses, and also addresses the myriad challenges that constrain
lives and livelihoods and facilitates more general improvements to the quality of
human lives. Resilience is shaped by individual, household, and community access
to a range of rights, resources, and assets; better-off households can frequently
buy their way out of risk with better infrastructure or by moving to safer locations,
whereas most low-income groups are tied to the location and dangerous sites
for their livelihoods, homes, assets, social networks, and culture. While studies of
climate impacts do include economic effects, these studies tend to overlook crucial
demographic characteristics, such as household size, living arrangements, fertility,
and age structures, among others (Bartlett 2008; Patt et al. 2009), that may be
crucial for gauging trends in adaptive responses, and for projecting the future
vulnerability and resilience of populations exposed to risks.
6RATIONALE FOR THE STUDY
This study explores the effects of an adverse weather event in Pakistan, and the
demographic processes contributing both to the vulnerability of the populations at
risk, and their adaptive responses and resilience. The 2010 floods provide a natural
experiment in which to study the impact and aftermath of the floods in one of the
most adversely affected districts, Mianwali District in Punjab Province. Figure 2
shows the trend of increasing rainfall in the district between 1945 and 2015.
FIGURE 2. Trends in Average Monthly Temperature (Centigrade) and Monthly Rainfall
(Millimeters) for Mianwali, 1945–2015
80
70
60
50
40
30
20
10
0
2003
2005
2009
1959
1963
1965
1967
1969
1983
1985
1989
1993
1995
1999
1945
1949
1951
2001
2013
1961
1981
1987
2015
1991
2007
2011
1973
1975
1979
1997
1953
1955
1947
1977
1957
1971
Annual Average Temperature Annual Average Rainfall Linear (Annual Average Rainfall)
SOURCE: World Bank Climate Change Knowledge Portal (CCKP).
In this study, we take a multidisciplinary approach to analyze available demographic
and geospatial data for a deeper understanding of the community-level vulnerability
to the 2010 floods, to identify demographic changes potentially associated with the
floods, and to describe the implications for building resilience in regions at high risk
of large-scale flood events. This study focuses on four areas pertaining to resilience:
movements and migration processes; shifts in poverty levels and living conditions;
changes in livelihood activities; and health-seeking behavior, particularly fertility-
related processes. These are some of the dimensions that we expect to both reflect
and shape the responses of communities in terms of “bouncing back” and “building
back stronger” in the “medium term.”
Analysis is organized around answering four questions:
1. Is there evidence that migration may be part of the adaptive response of
Mianwali’s population after the 2010 floods?
2. Are there any changes in the economic behavior of Mianwali’s population that
may be associated with the 2010 floods, and what do they imply for future
resilience?
3. Have poverty levels and living conditions improved or deteriorated in Mianwali
since the 2010 floods?
4. Has behavior changed with respect to health (especially reproductive health)
and education since the 2010 floods?
7In addition to the outcomes identified, another value of this study is that it
demonstrates how available population statistics and geospatial data can be
overlaid to visualize flood events and map the population at risk to produce a
fuller picture of the medium- and long-term impact of climate change, as well
as the vulnerability and adaptive responses of affected populations. In addition,
this approach highlights that climatic and demographic processes are dynamic
and linked, and the understanding of these interactions is critical to inform
strategies aimed at managing future climate risks. This study is intended to
expand the discussion on climate-change adaptation in Pakistan and elsewhere,
and to highlight the need for including a demographic lens through which a more
comprehensive understanding of the potential impacts of devastating flood events
can be achieved.
FINDINGS
MIANWALI’S EXPERIENCE OF THE 2010 FLOODS
Mianwali is one of the poorest districts in Punjab province, ranking 29th out of 36
districts on the Multi-Dimensional Poverty Index. Mianwali straddles the Indus
River at the northern end of the Indus Plain, which is in an intense heat zone that
is affected by any rise in temperature. Surrounded by mountains in the west and
north, and large areas of the plains along the banks of the Indus, Mianwali District
is historically prone to floods and inundation during the monsoon season. Mianwali
is comprised of three tehsils (subdistricts), including Isa Khel, which makes up the
northern and western part of the district, Mianwali in the east, and Piplan in the
south, as shown in Figure 3.
FIGURE 3: Key Topographic Features of Mianwali District, Punjab Province
8 SOURCE: Google Earth and UNOCHA.TABLE 1: Proportion of Population, Housing Structures, and Area in Punjab Province, and in
Mianwali District and its Tehsils, Impacted by the 2010 Floods
Population Houses Area
Total Total
% Population % Houses Total % Land
Region (Thousand (Thousand
Impacted Damaged (Sq. km) Flooded
Persons) Structures)
Punjab Province 93,682 6.4 14,870 3.3 205,344 29
Mianwali District 1,309 50.2 219 8.6 5,840 21.9
Isa Khel Tehsil 330 98.9 55 21.6 1,863 23.9
Mianwali Tehsil 645 34.4 110 5.3 2,689 21.0
Piplan Tehsil 334 35.5 54 0.7 1,288 20.8
SOURCE: Government of Punjab, Punjab Development Statistics 2010 and NDMA 2011.
NOTE: 1 sq. km. = .39 sq. mi.
Mianwali District registered record rains in 2010: the maximum rainfall of 179
millimeters (7 inches) was noted on July 22 (SUPARCO 2010). In July and August
2010, the district received 482 millimeters (19 inches) of rain—the highest rainfall in
50 years. Mianwali had an estimated population of 1.3 million at the time, of which
672, 322—more than half—were affected by the floods, with 12 flood-related deaths
reported (Government of Punjab 2010; OCHA 2011). The district was one of the
most severely affected in the entire country, incurring substantial infrastructural
and health-related losses. The damage incurred in Mianwali comprised 6 percent
of the total estimated affected population in the province and 29 percent of the
affected geographic area in Punjab (Government of Punjab 2010; NDMA 2011).
Table 1 shows that of the three tehsils in the district, Isa Khel was most devastated
by the floods, particularly in terms of total population affected. Although all three
tehsils had similar proportions of area covered by floodwaters, almost the entire
population of Isa Khel was affected, compared to about a third of the population in
the other two tehsils. This could be in part because Isa Khel was physically more
exposed to the flood hazard, not only as the northern entry point of the district in
the path of the Indus, but also because of its low elevation bordered by hills in the
west, which increased its exposure to flash floods. The population of Isa Khel was
living in the areas that got flooded, whereas the population of the other two tehsils
either lived in areas that were not flood affected or were able to move to safer areas.
The maps in Figure 4 show the courses of the Kurram and Indus rivers across
Mianwali in 2008 and 2011, i.e., before and after the floods. The 2011 map depicts
the extent of the spread of flood waters in the months following the peak of the
crisis and confirms that a large population around the river would have had to shift
away from their homes and farms at least temporarily to avoid high water levels.
The intense flooding spread for 2–13 kilometers (1–8 miles) on the western bank
(Isa Khel) and 2–8 kilometers (1–5 miles) on the eastern bank (Mianwali) of the
Indus. The map for 2016 shows that the floods did not just pose immediate risks
to the population but also introduced new waterways and topographic changes,
characterized by the slight shifting of the Indus riverbed from west to east and
a broadening of the banks of the river. This had direct implications, particularly
for usage of land and cropping patterns. The 2016 map points to longer-term
movement of population settlements away from the river toward the eastern bank. 9FIGURE 4: River Courses and Settlements in Mianwali Before and After the 2010 Floods
2008 2011 2016
Persons/sq kilometer Legend
District Boundary
0 - 100
Tehsil Boundary
101 - 500
Indus River
501 - 1500
Kurram River
1501 - 5000 Hill Torrents
5001 - 100000 Nammal Lake
SOURCE: LandScan Population Dataset 2008, 2011, 2016 and Landsat.
We address the four questions posed above, in the discussion of the study’s
rationale, by looking at Mianwali District, with a focus on Isa Khel, to assess whether
the floods were associated with or have been followed by any changes in the spread
of population, socioeconomic well-being and livelihoods, and other health and
social indicators.
EVIDENCE OF MIGRATION AS AN ADAPTIVE RESPONSE OF
MIANWALI’S POPULATION AFTER THE 2010 FLOODS
Environmental factors are among many variables driving migration. Some
forms of environmentally induced migration may be adaptive, while other forms
of forced migration and population displacement may indicate a failure of the
social–ecological system to adapt (Warner 2011). In settings similar to Mianwali
that experience climate-induced disasters, displacement is a common though
undesirable response. In Bangladesh, due to land degradation and scarcity, those
who were poor and dependent on agriculture became less able to make a living.
Frequent storms, floods, and droughts compound the problem. Largely due to
environmentally induced scarcities, 12–17 million Bangladeshis have moved to
India since the second World War, and half a million moved internally (Swain 1996;
Homer-Dixon 1999; Lee 2001). Cain (1981) found higher mobility (in terms of
households changing between landholding size categories) in Bangladesh than
in India and suggested that this was because floods caused distress sale of lands
and other assets at a loss in Bangladesh. This is supported by Orr et al. (1992) who
found that 29 percent of households sold or mortgaged land after the 1988 flood
10and reported increased downward mobility after the flood with a high proportion
(43 percent) of land loss since inheritance in the three years after the flood.
Predictions in Pakistan prior to the 2010 floods suggested that climate change
would play a role in increasing rural-to-urban migration, which constitutes 40
percent of total internal migration in the country (Arif 2005). Mueller, Gray,
and Kosec (2014) proposed that while rising temperatures increase rural–
urban migration, and thereby lower the dependence on agriculture, floods do
not significantly influence long-term migration in Pakistan. Although liquidity
constraints may be responsible for people’s reluctance or inability to migrate
permanently (Bryan et al. 2014; Cattaneo and Peri 2016), guaranteed availability of
humanitarian aid in response to climatic extremes such as floods and storms may
also be responsible for slowing down the migration response to floods (Strömberg
2007; Looney 2012) and for facilitating farmers’ return to their ancestral location.
However, a major World Health Organization (WHO) study does point out increased
deprivation in flood-affected districts, particularly in communities living close to
the riverbeds, increasing the possibility of a trend of rural-to-urban, intra-provincial,
and inter-provincial migration in search of livelihoods (Asian Development Bank and
World Bank 2010).
We know that the 2010 floods forced seven million people across the country to
leave their homes at least temporarily (Najam-u-Din 2010). According to a WHO
survey conducted in the 29 most severely affected districts, close to 90 percent of
households were forced to move for at least two weeks after the floods, with over
half having to live at a camp for internally displaced people (IDPs) at some point.
Approximately 17 percent were forced to move away for longer durations (WHO
and Ministry of Health 2011). It is believed that most of the displaced population
returned to their home areas as soon as the floodwaters receded, usually within
around a month, although the duration of displacement was generally longer in
Sindh Province.
Irrespective of the duration of displacement, many of those who returned faced
problems similar to those confronted by conflict IDPs, due to the destruction
of houses and communication, health, and education infrastructure, as well as
diminished livelihood prospects, in the short term at least, as the floods had
extensively damaged crops and livestock (Najam-u-Din 2010). Farmers generally
tend to resume agricultural activities in their regions of origin after floods. However,
as floods become more frequent, many will not have the means to continue farming
on silted land and invest in inputs like seeds and fertilizers to attain agricultural
profits (Arai 2012). With floods recurring more often, many farming households
may have shifted toward nonfarming livelihood activities or diversified their sources
of income (Food Security Cluster Pakistan 2013). Because of limited alternative
economic opportunities in rural areas, many frequent flood victims may migrate in
search of nonfarm income sources in urban areas (Salik et al. 2017).
Although no major climate-induced migration flows have been recorded or
discussed thus far in Pakistan, floods, and climate change more broadly, are likely
to have contributed significantly to the large-scale spatial changes including rural-
to-urban and cross-province migration reflected in the 2017 census. Unfortunately,
11TABLE 2: Change in Average Annual Growth Rates and Household Size in Punjab Province, and
in Mianwali District and Its Tehsils
Population Growth (%) Household Size
AAGR AAGR
Region 2017/1998 2008 2011 Change
1981–1998 1998–2017
Punjab Province 2.60 2.13 .81 6.5 6.3** –0.2
Mianwali District 2.35 2.02 .85 6.8 6.1** –0.7
Isa Khel Tehsil 2.83 2.00 .70 7.2 5.9** –1.3
Mianwali Tehsil 2.09 1.92 .91 6.5 6.1** –0.4
Piplan Tehsil 2.45 2.16 .88 7.1 6.4** –0.7
Differences in household size between 2008 and 2011 are significant at p < 0.01 and are labeled **.
Differences in household size in Punjab Province and Mianwali District in 2011 are significant at p < 0.10.
SOURCE: Population Census Reports and Punjab MICS 2008 and 2011.
neither the census data nor any other surveys can provide data about inter-district
migration or the movement from rural to urban areas. But preliminary census
results do reflect long-term growth rates beyond natural increase in certain areas
and certainly more rapid growth in urban than in rural areas.
In the absence of direct sources, we utilize the data available particularly at the
tehsil level, which are the Punjab Multiple Indicator Cluster Survey (MICS) datasets,
to measure short-term changes between 2008 and 2011, and longer-term changes
in demographic profiles between the two national censuses in 1998 and 2017.
Faster deceleration in population growth: Comparing data from the 2017 census
to the 1998 census, we find many dramatic long-term changes. While growth rates
have declined in Punjab province from 2.6 to 2.1 percent, in Mianwali District,
growth rates have declined beyond provincial averages to 2.02 percent.
Table 2 depicts population growth in the three tehsils from 1998–2017. While growth
is lowest in Mianwali and highest in Piplan, in terms of decline in growth since
1981–98, Table 2 reveals our most adversely flood-affected tehsil of Isa Khel to have
the largest decline, with Intercensal growth rates down from 2.83 for 1981–98 to 2.0
percent in the 1998–2017 period. Compared to Isa Khel, growth rates of the other
two tehsils have not changed as dramatically, hinting that the population of Isa Khel
may have reacted to the recent devastating floods and their aftermath. However,
causality cannot be established with the available data. In fact, the more urban
tehsil of Mianwali shows the least change in growth rates, most likely reflecting an
influx of migration from adjoining Isa Khel and Piplan.
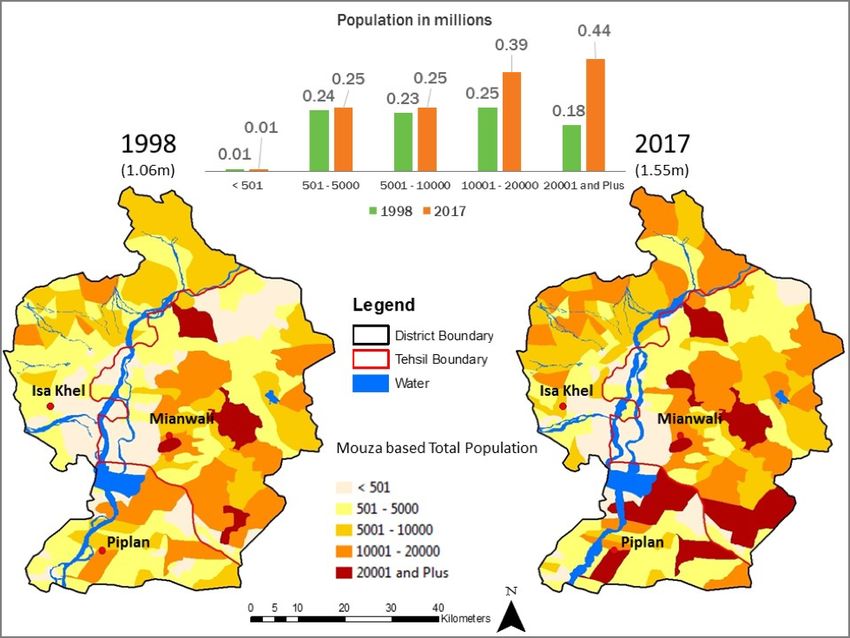
12FIGURE 5: Changes in Mouza Population Sizes in Mianwali District between 1998 and 2017
Population in millions
0.44
0.39
0.25 0.25
0.24 0.23 0.25
0.18
0.01
1998 0.01
2017
(1.06m) (1.55m)
< 501 501 - 5000 5001 - 10000 10001 - 20000 20001 - and Plus
1998 2017
Legend
District Boundary
Tehsil Boundary
Water
Mouza based Total Population
< 501
501 - 5000
5001 - 10000
10001 - 20000
20001 and Plus
SOURCE: Population Census 1998 and 2017.
Increasing urbanization: The census data allow us to present a more granular
perspective on changes in population densities and distribution across “mouza,”
the smallest administrative unit, over a 19-year period. There are hints that the
population, which until now was rural, assumed greater intensity of migration
to more urbanized agglomerations within Mianwali District. According to
recommendations by the UN prior to the 2010 census rounds, as well as
researchers within Pakistan, mouzas representing 10,000 persons and above
can be classified as urban (Arif and Ibrahim 1998; UN 2005). The proportion of
Mianwali’s population living in such mouzas has risen to 83 percent compared to 43
percent in 1998, while the share living in mouzas with less than 10,000 persons has
increased only marginally (Figure 5). In fact, most of the population growth that has
occurred since the last census has taken place in the larger settlements. Most of
these larger towns are in Mianwali and Piplan tehsils and not in Isa Khel, which was
most affected by the floods.
Decline in household size: Using data from the MICS 2008 and comparing to
2011, we find further evidence of dramatic population changes. Household size
has declined sharply in Isa Khel, with a reduction of 1.3 persons, as compared to
a smaller though still sizable decline in Mianwali tehsil of 0.4 persons (Figure 6).
We posit the likelihood that these changes are reflective of both rural to urban
migration and with a pronounced change, especially in Isa Khel, happening as
recently as in the post-flood period.
13FIGURE 6: Changes in Household Size in Punjab Province, and in Mianwali District and Its
Tehsils, 2008 and 2011
8 7.2 7.1
6.8
6.5 6.3 6.5 6.4
6.1 5.9 6.1
6
4
2
0
Punjab Province Mianwali District Isa Khel Tehsil Mianwali Tehsil Piplan Tehsil
2008 2011
SOURCE: Punjab MICS 2008 and 2011.
TABLE 3: Change in Age Structure of Households in Punjab Province, and in Mianwali District
and its Tehsils, 2008 and 2011FIGURE 7: Number of Registered International Emigrants from Mianwali District, 1981–2014
8,731
5,264
4,782
4,156
3,169
2,714
2,306
1,544 1,740
798 1,160
1981-2004 2005 2006 2007 2008 2009 2010 2011 2012 2013 2014
Years
SOURCE: Bureau of Emigration and Overseas Employment, Pakistan.
FIGURE 8: Percent of Households Receiving Any Remittances from within Pakistan, in Punjab
Province and the Three Tehsils of Mianwali District, 2008 and 2011
18 15.7 15.8
12.9
11.5
12 10.2
7.4 7.6
5.5
6
0
Punjab Isa Khel Tehsil Mianwali Tehsil Piplan Tehsil
2008 2011
SOURCE: Punjab MICS 2008 and 2011.
Increase in remittances: While there is evidence of migration out of Mianwali
District in the 1970s, mainly to Karachi, it does not subsequently appear to be a
major sending district. One indication is in the levels of international migration seen
in Figure 7, where the average number of emigrants migrating internationally is
minimal (with the exception of 2008) and only picks up after 2012.
The social networks of Mianwali residents do not seem to extend far beyond
the district or the country, as we do not see huge international migration shifts.
However, comparison of remittances being sent to households in the various tehsils
in 2008 and 2011 do show a major jump for Isa Khel (Figure 8), suggesting that the
floods may have forced significant migration in quest of livelihood opportunities
beyond the tehsil.
15Although there may have been deceleration in population growth rates and
increasing rural to urban migration within the district of Mianwali, the evidence that
demonstrates greatest demographic change in the worst-hit Isa Khel tehsil is the
decline in fertility, which is a recent phenomenon. Greater reliance on remittances is
also reflective of migration and associated with the 2010 floods.
These changes suggest that migration is a part of the adaptive response of some
households to floods. Given high levels of rural to urban migration, it is especially
interesting to note the diversification of livelihoods, and relocation of households
to settlements after the floods to locations farther away from possible flood-risk
areas. There is a possibility that movement is taking place to newly formed and
possibly better-built settlements—as would be expected in the vicinity of Mianwali
city for example. This gives rise to the question of whether we may infer that
migration demonstrates and contributes to the resilience of some households.
However, it is also likely that migration entails new risks, both for those who leave
their communities and for the family members they leave behind, which would
require further study at the individual, community, and household level for a better
understanding of implications for resilience.
CHANGES IN THE ECONOMIC BEHAVIOR OF MIANWALI’S
POPULATION THAT MAY BE ASSOCIATED WITH THE 2010
FLOODS, AND IMPLICATIONS FOR FUTURE RESILIENCE
The agriculture sector is affected by long-term reductions in rainfall, increase
in the frequency of droughts and floods, and variability in seasons, particularly
higher temperatures and delayed start of colder months. These changes adversely
affect crop sowing, maturing, and harvesting cycles. Thus, we fully expect that
climate change over a progressive period must have shifted the distribution of
opportunities within Mianwali’s economy, which is traditionally dominated by
agriculture. It is likely that farming practices were affected by the 2010 floods,
due both to environmental changes, such as shifts in the riverbed, as well as to
adaptation efforts, such as planting of more flood-resistant crops or intensification
of agricultural activities (Food Security Cluster 2013). Given the drop in incomes,
there may have been distress sales of agricultural assets in the short term.
Moreover, the indications of migration discussed above suggest that income
sources of Mianwali’s population may have diversified in the aftermath of the 2010
floods. Since it is often men who migrate to other cities for work, female workforce
participation may have risen as women were compelled to manage the remaining
agricultural work.
16TABLE 4: Ownership of Agricultural Land and Livestock Among Households in Punjab Province,
and in Mianwali District and its Tehsils, 2008 and 2011
% HH owned agricultural land % HH owned livestock
Region 2008 2011 2008 2011
Punjab Province 34.2 33.6** 50.9 48.0**
Mianwali District 39.4 31.2** 68.7 60.8**
Isa Khel Tehsil 41.0 33.0* 72.4 65.0*
Mianwali Tehsil 39.0 31.1** 71.5 59.9**
Piplan Tehsil 38.7 30.0** 60.3 59.0
Differences in ownership of agricultural land and livestock between 2008 and 2011 are significant at p < 0.05 and are labeled *, and significant
at p < 0.01 and are labeled **.
Differences in ownership of agricultural land in Punjab Province and Mianwali District in 2011 are significant at p < 0.10 and in ownership of
livestock at p2007–13, but rose sharply to 428,000 hectares (1,060,000 acres) by 2014. Wheat
crop production also rose to 446,000 metric tons (492,000 tons) in 2014, a
maximum for the period 2009–2014.2
Changes in male and female employment patterns: A distinct short-term
adaptive strategy in Mianwali District is a move away from agricultural to
nonagricultural occupations by males. There is also medium-term evidence to
show a decline in agricultural jobs, although the sector remains the main source of
employment for the district. In Figure 9, we present the percentage of the working
age population derived for males and females from Pakistan Standard of Living
Measurement Survey data, providing a breakdown of employment into some major
occupational categories. The findings show a slight dip in men’s participation in
work in the year immediately after the flood (2011), and more men report working in
elementary3 and agricultural occupations than in 2009, just before the floods. But
the pre-flood level of male work participation is restored by 2015, with a marginally
larger share working in nonagricultural jobs.
Interestingly, there is a rise in the proportion of working females in the post-flood
year, going up from 9–21 percent between 2009 and 2011. The rise in working
females is concentrated in agriculture and elementary occupational categories.
These changes in Mianwali District show that women are likely to be “pushed” into
seeking and doing new types of work as an immediate short-term reaction to the
floods. The change highlights the interdependency of male and female employment
especially in agriculture—most likely women filling in for work that men previously
did, before they were forced to look for alternatives. The trend likely reflects the
most vulnerable women—those whose husbands and fathers had to look for other
work, even temporarily—moving into agriculture and elementary occupations that
they normally would not have considered. However, the trend continues to some
extent even in 2015, as a larger proportion are still working in agriculture than in
2009, although less than 2011. Data also show that, despite very low levels of work
participation, females are beginning to move into the higher-end occupations as
well, such as technicians and craft, trade, and sales workers.
Changes in land use: The move away from agriculture may be a long-term change
that is not necessarily restricted to Mianwali District but is underway across Punjab
Province more generally. However, when we used Landsat satellite imagery to
visualize changes in land use in the flood-affected area in Mianwali over the period
2009–17, it showed that after the flood the riverbed expanded, with 12.1 percent
water coverage in 2008 increasing to 22 percent in 2011 (Figure 10). The maps in
Figure 10 show distinct changes in land use after what seems to be a notable rise
in additional land covered by water, which is consistent with the broadening of the
riverbed discussed earlier. The area used by settlements hardly changed, reflecting
2
Punjab Development Statistics: 2007, 2008, 2009, 2010, 2011, 2012, 2013, 2014. Bureau of Statistics, Punjab, Lahore.
3
As per Pakistan Standard Classification of Occupations, elementary occupations are: street vendors and related workers, shoe clean-
ing and other street services, domestic and related helpers, cleaners and launderers, building caretakers, window and related cleaners,
18 messengers, porters, doorkeepers and related workers, garbage collectors and related laborers, agricultural, fishery and related laborers,
laborers in mining, construction, manufacturing, and transport and freight handlers.FIGURE 9: Percentage of Mianwali’s Population in Agricultural and Other Occupations,
by Sex, 2009–2015
100
Category 1 Category 2 Category 3 Category 4
75
58 59
56
50
25 19
13
9
0
Male Female Male Female Male Female
2009 2011 2015
Category 1: Elementary occupations.
Category 2: Skilled agricultural and fishery workers.
Category 3: Craft and related trade workers, and plant and machine operators and assemblers.
Category 4: Technicians and associate professionals, clerks, and service and sales workers.
NOTE: The changes in all occupation categories for males are statistically significant at the p < 0.01 level with the exception of Category 2 (skilled
agricultural and fishery workers). In contrast, for females, the changes in all occupational categories are statistically significant at the p < 0.01 level.
SOURCE: Pakistan Bureau of Statistics (PBS), PSLMS 2008-09, 2010-11 and 2014-15.
that residents are not building long-term housing in these areas but are inclined to
utilize the land for agriculture, as the soil may have become relatively richer after
the floods.
The implication for future trends is a move away from building back or returning
to the flood-prone areas for the purposes of residence, which could result from
fear of loss of lives and housing. However, there is no long-term strategy of moving
away from or giving up the opportunities offered through agricultural land that may
actually be able to provide greater yields in nonflood periods.
POVERTY LEVELS AND LIVING CONDITIONS IN MIANWALI AFTER
THE 2010 FLOODS
Floods, like other natural disasters, often affect human communities broadly, and
residents are not equally at risk of loss and harm nor equally able to recover. Poor
households are known to be especially vulnerable (Enarson 2002). The 2010 flood
had a devastating impact on the affected households and caused a loss to the
country’s economy of $16 billion. To answer one of the questions posed above in
“Rationale for the Study” (“Have poverty levels and living conditions improved
or deteriorated in Mianwali since the 2010 floods?”), we look at trends in poverty
levels in Mianwali and Punjab, as well as in living conditions, and attempt to identify
how poorer households, in particular, were able to compensate for their losses and
ensure against future shocks.
19FIGURE 10: Changes in Land Use Patterns within the Flood Plain in Mianwali, 2009–17
SOURCE: LandScan Population Dataset 2008, 2011, 2016 and Landsat.
Loss of income: According to the results of a national-level survey, the greatest
impact of the 2010 floods has been on household income. Even three months after
the floods, 66 percent of households did not have enough money to buy essentials
such as food, medicine, and fuel. The poverty impact was much higher in rural
households (70 percent), compared to urban (33 percent). According to a national
study assessing the impact of the floods, regardless of location, 88 percent of
households reported reduced income since the floods (WHO and Ministry of Health
2011). The primary cause (63 percent) of lost income was loss of crops or animals.
The reported mean monthly household income prior to the floods was 10,900
rupees (US$131)4 with 23 percent of the population living on less than 5,000 rupees
(US$60). After the floods, income fell to 2,600 rupees ($31), with 75 percent of the
population living on less than 5,000 rupees (US$60) per month. This represents a
75 percent reduction in income across all households (ibid).
In the same study, when asked what their most important current need was at the
time of the survey, permanent shelter was identified by 54 percent of respondents,
economic support by 52 percent (with 29 percent seeking loans to restart farms
or businesses and 23 percent seeking employment), and then food by 31 percent.
4
US$1.00 = 83.20 Rupees as of 2010.
20FIGURE 11: Economic Status by Income Quintiles in Mianwali Tehsils in Comparison with
Punjab5 Province in 2008 and 2011, by Tehsil
2 1
100 6 5 5
13 8 12
20 15
17 15
80 20 14
20 26
22 28
26 22
60
20
30 47
40 32
31 34 34
20
20
29 23 25
20 21 18 17
0
Overall 2008 2011 2008 2011 2008 2011
Punjab Isa Khel Tehsil Mianwali Tehsil Piplan Tehsil
Lowest Second Middle Fourth Highest
SOURCE: Punjab MICS 2008 and 2011.
The spheres in which more than half the population continued to feel that they were
worse off since the floods were: economically/income (88 percent); food quality
(75 percent); food availability (71 percent); and shelter (51 percent). According to
the survey, 18 percent of the population migrated away from their homes during the
floods (WHO and Ministry of Health 2011).
We utilized available sources of household data for the tehsils of Mianwali to
assess poverty levels and aspects of quality of living that are most vulnerable to
the floods. Our analysis uses Punjab as the standard, which classifies 40 percent
of the provincial population as falling into the bottom two quintiles (Figure 11). In
comparison, Isa Khel tehsil was much poorer, with 59 percent of its population
falling in the lower quintiles. In 2010, the tehsil fell further into poverty with 70
percent of its population falling into the category of Punjab’s lowest 40 percent
income levels. In contrast, Mianwali and Piplan tehsils did not take a similar hit.
In fact, in 2011, there was a slight decline in the proportion of their respective
populations living in the equivalent of Punjab’s lowest income level.
Increased reliance on social protection and donations: As additional evidence
that the population of Isa Khel was the worst affected financially, the MICS data
show both a rise in cash donations in the tehsil in 2011 and a dramatic rise in
households benefiting from social protection schemes (Table 5). Data from
the National Disaster Management Authority (NDMA) and UN Office for the
Coordination of Humanitarian Affairs (OCHA) show that several partners did come
forward for relief work in Mianwali and child protection efforts seemed to dominate
in the area (OCHA 2011). Similar changes were not recorded for Mianwali and Piplan
5
Punjab Province is the reference category, and the percentage distribution of population in each quintile in 2008
and 2011 is the same (i.e., 20%).
21TABLE 5: Proportions of Households Benefiting from Social Protection Schemes and Cash
Donations in Punjab Province, and Mianwali District and its Tehsils, 2008 and 2011
Benefiting from cash Benefiting from government social
donations protection schemes
Region 2008 2011 2008 2011
Punjab Province 1.4 1.5 15.6 6.5
Mianwali District 3.0 1.5 28.1 22.3
Isa Khel Tehsil 1.0 2.7 23.6 33.0
Mianwali Tehsil 4.3 0.8 28.8 23.5
Piplan Tehsil 2.2 1.7 30.9 11.1
SOURCE: Punjab MICS 2008 and 2011.
TABLE 6: Household Amenities and Infrastructure in Punjab Province, and Mianwali District
and its Tehsils, 2008 and 2011
% HH population
% HH with Kutcha % HH with Kutcha % HH with Kutcha
with water piped into
floor roofing walls
dwelling
Region 2008 2011 2008 2011 2008 2011 2008 2011
Punjab
16.5 12.4** 40.6 41.8** 15.8 21.7** 22.0 7.1**
Province
Mianwali
17.8 18.1 57.4 61.2* 27.7 21.9** 23.4 10.4**
District
Isa Khel
23.4 34.3** 61.2 68.7* 37.3 29.8* 26.5 13.5**
Tehsil
Mianwali
21.1 18.5** 56.5 56.5 25.4 20.8 22.8 8.8**
Tehsil
Piplan
7.2 4.6** 55.7 63.9* 23.5 17.3* 21.8 10.7**
Tehsil
Differences in percentages of households with kutcha floor, kutcha roofing for 2008 and 2011 are significant at p < 0.05 and are labeled*.
Differences that are significant between 2008 and 2011 at p < 0.01. are labeled**.
Differences in populations with pipe water in dwellings, households with kutcha floor and with kutcha walls between Punjab Province and
Mianwali District in 2011 are significant at < 0.01.
SOURCE: Punjab MICS 2008 and 2011.
tehsils. These figures are indicative of the strong response during and after the
floods to prevent further disastrous outcomes from accruing and are reflective of
the proactive state, civil society, and donor response to calamities, which was also
seen to dominate after the calamitous 2005 earthquake that hit Pakistan.
Changes in housing conditions: Our data permit us to look at the status of
housing conditions before and after the floods (Table 6). In gauging housing quality,
we focus particularly on kutcha (mud or thatch) roofing, which was higher quality
in Mianwali District compared with the rest of Punjab. It is obvious that Isa Khel
had greater vulnerability, with 37 percent living under kutcha roofs that would have
been more susceptible to being washed away by floods. However, it is reassuring
also to see that figure decline to 30 percent in 2011, once again reflecting efforts to
22FIGURE 12: Access to Technology Relevant to Flood Early-Warning Dissemination in Urban and
Rural Areas of Mianwali District, 2008 and 2011
100 95
87 87
80 80
80
68
60
60
49
40
27
15 16
20
9
0
Urban Rural Urban Rural Urban Rural
HHs owning televisions HHs owning radios HHs owning mobile phones
2010-11 2014-15
SOURCE: Pakistan Bureau of Statistics (PBS), PSLMS 2010-11 and 2014-15.
build back stronger with additional assistance to the district and to this tehsil. The
proportion of households with kutcha walls also declined across all three tehsils in
line with trends across Punjab.
In terms of access to water, while the proportion of the population receiving piped
water in Mianwali District was comparable in 2008 to the rest of Punjab, Piplan
lagged. However, this indicator also improved in 2011 reflecting an improvement
in housing quality in Isa Khel tehsil, and in Mianwali more generally. In terms of the
quality of flooring, however, Mianwali District depicts a much poorer situation than
Punjab.
Changes in ownership of household items: When we look at other household
items that are owned by the population of Mianwali District (Figure 12), we see a
major rise in the ownership of mobile phones, with very similar levels of ownership
in rural and urban areas. There is also a rise in television ownership, but this
remains at much lower levels in rural areas of Mianwali. Thus, early-warning signals
and sources of information ideal for spreading word about the onset of flooding
and rains must be made through mobile technology. Radios, often used for this
purpose, penetrate only 16 percent of rural households.
The ranking in Multidimensional Poverty Index for Mianwali District has risen while
the rest of Punjab province is experiencing declines in poverty. This implies that
districts prone to repeated flooding face a risk of socioeconomic losses that they
must overcome each time there is an extreme flood event. We argue that overall
Mianwali could have prospered much more had it not experienced the floods
23of 2010. However, we expect this setback to be temporary, due to the increases
in external contributions, particularly the stimulation of social safety nets and
donations after the flood.
It could be argued that people in Mianwali were living in better housing conditions
in 2011 than they were at the time of the 2010 floods. Inter-tehsil differences may
persist—because Isa Khel started off with much poorer infrastructure and was
more devastated by the floods. Overall, however, there is relatively greater physical
protection and more preparedness for future flooding, although anything as drastic
as the 2010 rains and floods would most likely have similar outcomes. Change is
also seen in terms of greater connectedness to outside ideas through technology,
especially mobile phones, in addition to the move toward settlements with better
services. The increasing coverage in communication technology can be utilized for
better early-warning systems in the future.
CHANGES IN BEHAVIOR WITH RESPECT TO HEALTH
(ESPECIALLY REPRODUCTIVE HEALTH) AND EDUCATION AFTER
THE 2010 FLOODS
Previous studies have highlighted changes in reproductive health-seeking behavior
as a result of climate-related disasters (Thompson and Sultana 1996; Mutunga
and Hardee 2010; McMichael et al. 2012; Pullanikkatil et al. 2013; Rovin et al. 2013;
Grace 2017).
Overall the pace of progress against health and reproductive health indicators in
Pakistan and in Punjab has been slow, with the potential for shocks (environmental
or otherwise) to bring about totally unexpected changes in health and related
behaviors. We explored this possibility for Mianwali District from the MICS data.
Although a breakdown in health services may have taken place as a result of
flooding, making a major part of the health system dysfunctional, relief in the form
of health camps and other related services may have led to positive opportunities
for improving health. When the women of Mianwali, whose movements outside the
home had been restricted up to this time, were compelled to evacuate or find new
means for meeting basic household needs, they found new emerging options for
interactions, seeking information, and accessing services.
As another important indicator of resilience, we also look at the ability of the
affected population to continue their children’s schooling. According to Rovin et
al. (2013), during times of weather-related difficulties families may withdraw their
children from school, either because of financial constraints or to migrate in search
of better living conditions or employment. Mansuri (2006) finds that in poor rural
Pakistan, where economic migration is usually undertaken by men (leaving female-
headed households), children in migrant households are more likely to attend
school and remain in school compared to those in nonmigrant households, but girls
are still significantly more likely to drop out. We use MICS data to assess whether
the 2010 floods affected literacy levels and school attendance.
24TABLE 7: Reproductive Health Behavior of Currently Married Women Aged 15-49 across Punjab
Province, and Mianwali District and its Tehsils, 2008 and 2011
Use of Antenatal care Postnatal care
Baby delivered in Currently
contraception (any skilled (any skilled
health facility, pregnant,
(any method), personnel), personnel),
% of women % of women
% of women % of women % of women
Region 2008 2011 2008 2011 2008 2011 2008 2011 2008 2011
Punjab
32.2 35.2** 52.7 74.2** 38.3 53.5** 40.9 37.9** 11.2 11.9**
Province
Mianwali
19.6 32.3** 43.6 76.5** 28.7 59.4** 29.0 39.8** 11.0 9.6
District
Isa Khel
26.2 40.5** 39.9 78.3** 21.9 70.5** 19.3 37.6* 9.4 9.2
Tehsil
Mianwali
19.2 31.9** 46.4 78.0** 29.1 61.0** 32.0 47.6** 11.9 7.3*
Tehsil
Piplan
14.7 26.7** 42.6 74.1** 34.7 50.8* 33.4 28.2 10.9 13.7
Tehsil
Differences in percentages of women who delivered in health facilities, percentage of women who seek postnatal care, and percentage of
women currently pregnant between 2008 and 2011 are significant at p < 0.05 and are labeled*. Differences that are significant between 2008
and 2011 at p < 0.01 are labeled**.
Differences in percentages of women using contraception, percentage of women currently pregnant in Punjab Province and Mianwali District
in 2011 are significant at p < 0.05, and the differences in percentages of women who delivered in health facilities in Punjab versus Mianwali is
significant at p < 0.1.
SOURCE: Punjab MICS 2008 and 2011.
More women are seeking antenatal and delivery care: The most striking of
our findings relates to more positive health-seeking behaviors across Mianwali
District. In general women were more likely to seek antenatal and delivery care
after the 2010 floods than before (see Table 7). While a notable increase in skilled-
birth attended delivery is also seen across Punjab Province, the rise in all tehsils of
Mianwali up to the province levels is dramatic.
Increased contraceptive use: Contraceptive use appears to have risen sharply
from 20 to 32 percent in Mianwali District and even more dramatically in its
subarea of Isa Khel which was the worst affected of the tehsils, in a brief period
of three years (2008–11). In comparison, contraceptive use hardly rose from 32
to 35 percent in Punjab overall. Although there are no readily available figures for
relief camps and increased access to services in Mianwali, the relief operations
did include mobile clinics and other health services in the area. Undoubtedly, this
must be one of the outcomes of the forced exposure of flood-affected families to
new sources of reproductive health services, either in their own areas or by moving
temporarily to other better-served areas. Notably, there is some evidence of the
rebuilding of health facilities and addition of camps and other health service options
in the district after the 2010 floods (OCHA 2011).
Fertility is falling: The final supporting evidence of a fertility decline emerges
from lower numbers of children under age 5; while this decline has occurred
across Mianwali District, it is especially pronounced in Isa Khel tehsil. This is truly
unexpected given that Isa Khel is the least developed area of the district.
25TABLE 8: Literacy (10 years and older) and Primary Enrollment Rates in Punjab Province, and
Mianwali District and its Tehsils, 2008 and 2011
Literacy rate–10 years and Primary school NAR Gender parity index at
older (5–9 years) primary school NAR
Region 2008 2011 2008 2011 2008 2011
Punjab
59.3 59.5 52.9 59.4** 0.96 0.95
Province
Mianwali
56.8 57.2 52.9 61.2** 0.84 0.89
District
Isa Khel
48.0 48.5 43.4 54.6* 0.80 0.78
Tehsil
Mianwali
59.9 58.2 55.9 62.3* 0.86 0.85
Tehsil
Piplan
59.0 62.5 56.3 64.1* 0.85 1.04
Tehsil
NAR=Net attendance ratio.
Differences in primary net attendance ratio for 2008 and 2011 are significant at p < 0.05 and are labeled*. Differences that are significant
between 2008 and 2011 at p < 0.01 are labeled**.
SOURCE: Punjab MICS 2008 and 2011.
MICS 2014 reports the total fertility rate (TFR) in Mianwali District as 3.3, but
unfortunately, fertility data is not available at the tehsil level.
The observed rapid reproductive change is consistent with similar findings from
Ethiopia and from Bangladesh, where studies (Thompson and Sultana 1996; Rovin
et al. 2013) show people affected by natural disasters consider smaller families to
be an advantage in terms of resilience and adaptation. If we assume that women
in Isa Khel had unmet need both for family planning and for institutional deliveries,
they readily took up their use once such services were available as part of the relief
operations, in this case through the United Nations Population Fund (UNFPA) and
WHO.
Primary school attendance continues to rise: Primary school enrollment has
generally been rising across Pakistan and continued to do so despite the 2010
floods (see Tables 8 and 9). The gender parity index is almost 1.0. At the tehsil level,
we see the greatest improvement between 2008 and 2011 in Isa Khel, although the
tehsil still had the lowest enrollment ratio in the district and the widest gender gap.
For primary school attendance, gender gaps persist in two tehsils: Gender-
disaggregated data indicate that girls’ primary school enrollment is rising in
all three tehsils of Mianwali (Tables 8 and 9). However, the pace and status of
girls relative to boys in their tehsil, and relative to girls in other tehsils, varies
considerably. Between 2008 and 2011, girls’ enrollment increased considerably in
Isa Khel, but not as rapidly as among boys. In contrast, the gender gap in primary
enrollment seems to have closed in Piplan, with girls marginally in the lead.
26You can also read