Deep decarbonization of Indonesia's energy system - A pathway to zero emissions by 2050 - Agora ...
←
→
Page content transcription
If your browser does not render page correctly, please read the page content below
in cooperation with

Deep decarbonization
of Indonesia’s energy
system
A pathway to zero emissions
by 2050
1

Imprint

Deep decarbonization of
Indonesia’s energy system:
A pathway to zero emissions
by 2050

Study by:                                                            Study team:
Lappeenranta University of Technology (LUT)                          Prof. Christian Breyer, Ashish Gulagi,
School of Energy Systems                                             Ayobami Solomon Oyewo, Dmitrii
53851 Lappeenranta | Finland                                         Bogdanov (LUT University)
T: +358 294 462 111
www.lut.fi                                                           Fabby Tumiwa, Pamela Simamora,
                                                                     Agus Tampubolon (Institute for
Institute for Essential Services Reform (IESR)                       Essential Services Reform)
Jalan Tebet Barat Dalam VIII No. 20 B Jakarta
Selatan 12810 | Indonesia                                            Philipp Godron, Mentari Pujantoro
T: +6221 2232 3069                                                   (Agora Energiewende)
F: +62 21 8317 073
www.iesr.or.id                                                       Proofread by:
iesr@iesr.or.id                                                      Craig Morris (Agora Energiewende)

Agora Energiewende                                                   Acknowledgements:
Anna-Louisa-Karsch-Straße 2                                          Our gratitude goes to all the experts
10178 Berlin | Germany                                               that provided valuable inputs.
T: +49 30 7001435-000
F: +49 30 7001 35-129
www.agora-energiewende.org
info@agora-energiewende.de

This report should be cited:
IESR, Agora Energiewende, LUT University. (2021).
Deep decarbonization of Indonesia’s energy system: A pathway to zero
emissions by 2050. Institute for Essential Services Reform (IESR).

Publication:
May 2021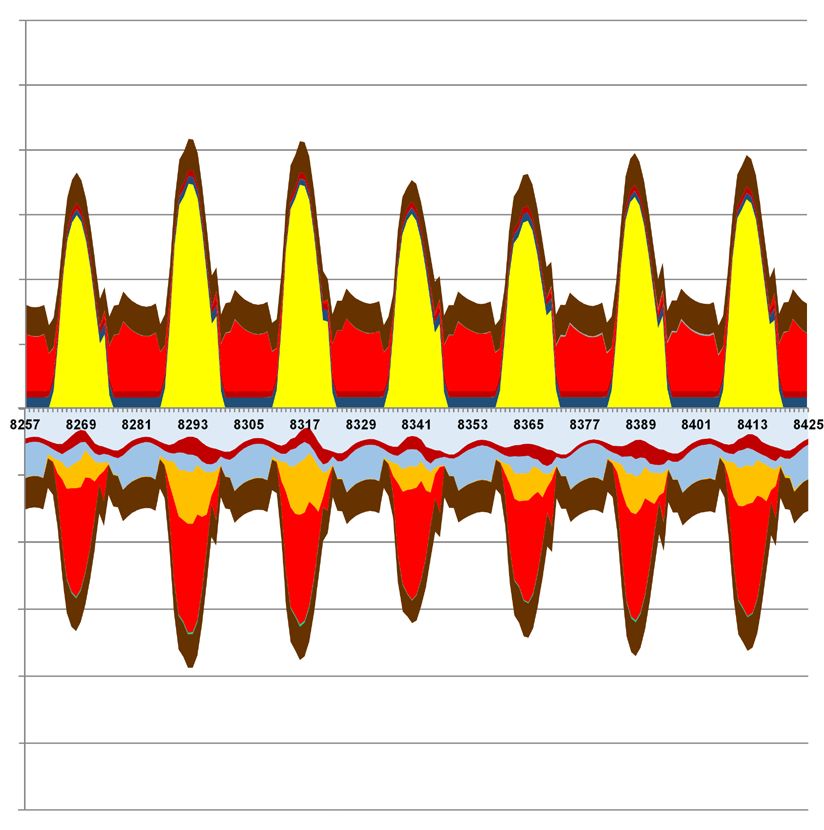
2

Table of Contents

Imprint                                                                 1
Table of contents                                                       2

Forewords                                                               3

Key Messages                                                           4

01.
  Introduction: Status quo, scenarios and methodologies                 7
  for assessing Indonesia's energy future
		    The global wave of climate pledges                                7
		    Current status of Indonesia’s energy system                       7
		    Scenarios, assumptions, and methodologies                        10

02. A pathway to zero emissions by 2050                                13
    Step 1(up to 2030) : Bending the curve : Peaking GHG emissions.    14
    Step 2(up to 2045) : Decreasing carbon emission by                 15
				                   around 92% between 2030 and 2045.
    Step 3(up to 2050) : Decarbonizing the last miles                  16

03. Four pillars of the transition to a zero- emission energy system   18
    1. Renewables                                                      18
    2. Electrification                                                 21
    3. Decline in fossil fuel use                                      22
    4. Clean fuels                                                     23

04. Required investments to achieve zero emissions by mid-century      25

05. Co-benefits of deep decarbonization                                28

06. Recommendations for policymakers                                   29
    1. Take a bold decision now: Make deep decarbonization             29
		     of Indonesia’s energy system a top priority
    2. Ensure that the energy system planning 		                       30
		     reflects a clear decarbonization pathway
    3. Stimulate multi-stakeholder participation                       32
		     in decarbonization efforts
    4. Put in place the right policies to realize                      32
		     the deep decarbonization target

References                                                             35

ANNEX A                                                                37
ANNEX B                                                                38
ANNEX C                                                                38
ANNEX D                                                                38
ANNEX E                                                                39
3 Foreword The year of 2020 was a special year for climate and environment. Global carbon emissions fell 7% due to the pandemic. Countries around the world have pledged for carbon and climate neutrality by mid-century. Major economic powers such as the United States, the European Union, China, Japan, South Korea as well as developing countries such as Chile, Brazil, and South Africa have indicated the goal in their NDC updates. The race for carbon neutrality has started to both achieve the Paris Agreement and reap the benefits of greening the economies. The average temperature has already risen 1.1 degrees above pre-industrial levels. To keep the average temperature “well below 1.5 degrees,” as required by the Paris Agreement, global greenhouse gas emissions must decrease significantly and immediately. Will Indonesia – the largest nation in Southeast Asia – be the first country in the region to declare carbon neutrality by mid-century? If so, how can Indonesia build a society that does not rely on coal and oil? Due to its size and growing energy demand, Indonesia is of key relevance for Southeast Asia, one of the fastest growing regions in the world. At the same time, Indonesia is already today – and will be even more so in the future – highly affected by the negative impacts of climate change. IESR, Agora Energiewende, and Lappeenranta-Lahti University of Technology (LUT) analyzed several pathways for Indonesia to reduce its GHG emissions. This study is the first of its kind for Indonesia, which makes it quite revolutionary. Can Indonesia entirely rely on renewables to supply its energy? What if the whole country – from Sabang to Merauke – were interconnected? Looking 30 years ahead, the study describes a vision of zero emissions in the Indonesian energy sector by 2050. Though based on existing technology and the best available assumptions, this vision is not meant as the only feasible scenario or roadmap. Rather, it shows the magnitude of the transformation needed in Indonesia to reach the targets. We hope that the proposals outlined provide orientation in the ongoing debate and serve as an impetus for creative and energetic change. May 2021 Fabby Tumiwa Executive Director IESR
4

Key Messages

1
    Achieving zero carbon emissions in the Indonesian energy system by 2050 is
    technically and economically feasible. Local renewable resources, particularly
    solar PV, are sufficient to meet energy demand in the country.

    Our Best Policy Scenario (BPS) shows that deep decarbonization of Indonesian
    energy system by 2050 is technically and economically feasible, by using 100%
    renewable energy. In the primary energy mix, renewables’ share grows rapidly
    to around 80% by 2040, until it finally reaches 100% by 2050. In electricity
    generation, around 50% electricity is produced from renewable sources by 2030
    before reaching 100% by 2045.

    Among the three scenarios, the BPS has the least annual cumulative system costs
    by 2050, despite its high share of renewables, while the Current Policy Scenario
    (CPS) has higher annual system costs from 2035 onwards. This low cost is driven
    by technological developments and the decreasing cost of capital.

    The combination of increasingly competitive solar PV, batteries, low-cost
    electrolyzers, and huge solar potential throughout the archipelago will make
    solar PV the primary source of electricity generation in Indonesia by 2050 with
    generation share at around 88%, followed by hydropower at 6%, geothermal at
    5%, and other renewables at 1%. This 88% solar PV share is equal to 1,492 GW
    of solar PV installed capacity with a total land requirement of 2.5% (excluding
    forest and water) of the country, a relatively small land requirement compared
    to biofuel plantations at 6.4%.

2   The major GHG emission reduction will be based on heavy utilization of
    electricity in different sectors, massive renewables deployment and declining
    fossil fuels infrastructures.

    To reduce GHG emissions, not only the power sector needs to transform, but also
    the transport sector and the industrial heating sector. Replacing internal combustion
    engine (ICE) vehicles and fossil-fueled industrial heating with new technologies,
    such as electric vehicles and heat pumps, that run on electricity will help shift the
    emission source from fuels to electricity. As long as carbon is reduced on the power
    system (replacing fossil fueled power plants with renewables), every single electrical
    device will get cleaner throughout its lifetime.
5
3 A secure and reliable future energy system based on renewables is possible by
using large amounts of storage and electrolyzers to balance supply and demand,
along with energy carriers for transportation and industry.
Our model shows that the future energy system will be dominated by high shares of
variable renewable energy, first and foremost solar photovoltaic (solar PV). Integrating
strongly increasing shares of variable renewable energy in the system will require very
substantial investments in the transmission and distribution grid and in energy storage
technologies to account for daily and seasonal variations of solar PV supply. These
include modern batteries and pumped hydro energy storage, the use of electricity
for electrolysis to produce synthetic fuels and hydrogen, which will both serve as
additional energy storage, energy suppliers, and feedstock for other sectors, such as
transportation and industry.
4 Electrification will be key for individual mobility, and biofuels will continue to
play an important role in the transport sector.
In the transportation sector, electric vehicles will make up 90% of vehicles in the
road passenger transport sector by 2050. Biofuels will still play a role in sub-sectors
that are much harder to electrify, in particular maritime shipping and aviation.
Direct electrification of the transport sector will result in higher efficiency. With large
adoption of electric vehicles, the carbon emissions from the transport sector will
largely depend on the decarbonization of the power sector that supplies electricity
for these vehicles. Where higher energy density is needed, e.g. in freight transport,
aviation or high temperature industrial heating, biofuels or new energy carriers such
as hydrogen will be utilized.
5
Energy system transformation is an opportunity to modernize energy systems
while driving economic growth. To make it happen, a good investment climate
is needed.
The energy system transformation will require an estimation of USD 20-25 billion
investment per year from now through 2030, much higher than the average investment
in the Indonesian renewable energy sector at less than USD 2 billion per year. Through
2030-2040, the country will need an annual investment of USD 60 billion to ramp up
the decarbonization efforts. Investments are well spread and channeled for different
clean energy technologies. Investment in solar PV (including rooftop solar PV) will
become the highest at around USD 2-7 billion per year for the next ten years. The
solar PV investment will need to increase to USD 20-25 billion per year between
2030 and 2040, around a third of total investment needed in that period. With solar
PV becoming the backbone of the energy system from 2030 onwards, investment
in batteries will be crucial and reach as high as USD 13-16 billion per annum from
2030 to 2040.
The Indonesian government must improve the investment climate in the country
rapidly and comprehensively considering that renewables investments only reached
USD 1.17 billion in 2019. A supportive policy and regulatory framework can attract
more private investors to invest in renewable energy, energy efficiency, and low-
carbon transportation projects in the country. Alignment and consistency between
medium and long-term targets are also essential. Policies and regulation will need
to dissuade existing preferences for carbon-intensive energy production, instead
setting incentives for investments in renewables.6
6 Call for moratorium on new coal-fired power plants as soon as possible.
Around 38 GW of coal-fired power plants had been installed by the first semester of
2020. The state-owned power utility plans to increase coal capacity to 57 GW by 2028,
putting coal at 55% of total power generation that year. According to our analysis,
however, coal’s share in total power generation will have to steeply decrease to 12% in
2035 before reaching virtually zero by 2045/2050. Even existing coal fired power plants
will lose their competitiveness within 15 years from now due to the competitiveness
of renewables. Therefore, any additions to coal capacity will run into the risk of being
a stranded investment. A coal moratorium as soon as possible is therefore necessary
to protect investments and free up capital to invest in renewables instead.
7 The archipelago country needs to be more integrated, particularly from 2030
onwards.
Located at the equator, Indonesia is rich in solar energy. While solar potential is
evenly spread across the archipelago, energy demand is not. The island of Java
currently accounts for around 80% of energy demand in the country. Assuming
the island will remain the main energy consumer in the country, it will need to
import 4.6% of its demand by 2030, 45.5% by 2040 and 82.1% by 2050 under our
Best Policy scenario. The integration is also needed to allow the power, transport,
and industry sector coupling.
The imports will come from neighboring islands such as Sumatra, Kalimantan, and
Nusa Tenggara. To make this plan happen, grid integration is needed. Submarine
connections between Java and Sumatra could be the first interconnection developed
before connecting Java with other islands. Building power grids will take time, so
the government should start planning and subsequently constructing a modern
and capable grid infrastructure between and within all major islands straight away.
8 Deep decarbonization will bring massive opportunities to Indonesia’s economy
Rich in renewable energy, Indonesia is well-endowed to transition to a 100% renewable
energy system. Deep decarbonization is not only key in reducing carbon emissions
but also in rejuvenating Indonesian economy post pandemic. Projects of renewable
energy, energy efficiency, and clean transport are shovel ready projects that will
not only create jobs immediately but also bring long-term positive impacts on the
environment and communities. At minimum, Indonesia will see more than 800,000
new jobs by 2030 and more than 3.2 million new jobs by 2050 if the country follows
through the deep decarbonization pathway.
Other important co-benefits of decarbonization are the avoided costs of climate
damages, increased energy efficiency, better air quality, avoided deaths and healthcare
costs, more resilient energy systems, increased water availability and food security,
healthy ecosystems and rich biodiversity, avoided costs of stranded assets, lower
energy expenditure and subsidies, universal access to energy through the use of
local, renewable energy resources, and new economic opportunities in rural areas.7
Introduction:
Status quo, scenarios and
methodologies for assessing
Indonesia's energy future
The global wave global greenhouse gas emissions must decrease
significantly. Renewables play a major role in
of climate pledges that process.
The year of 2020 has become a special year,
not only due to the COVID-19 pandemic, but Indonesia is currently amongst the top 10
also for the climate and environment. Global greenhouse gas (GHG) emitters and still projected
carbon emissions contracted by 7% due to the to increase its emissions. Will Indonesia be the
pandemic, mainly driven by the fall in global first country in Southeast Asia to declare carbon
energy demand. While oil and coal consumption neutrality? If so, how can Indonesia build a society
dropped, renewables were less affected by the that does not rely on coal and oil?
pandemic. Installed renewable energy reached
almost 200 gigawatts (GW) globally, with or
without government support (IEA, 2020; IEEFA,
2021). Energy transitions are underway and Current status of
inevitable, even amid the pandemic.
Indonesia’s energy system
Political transformations are also happening at a
high level with more political actors committed Indonesia aims to reduce its greenhouse gas
to climate actions. The increased political (GHG) emissions by 29% (or 41% with international
will translates into more commitments from support) compared to the Business as Usual
countries around the world to reach carbon (BAU) scenario by 2030. As one of the sectors
and climate neutrality by mid-century. Major contributing to GHG emissions, the energy sector
economic powers like the US, European Union, is also the second largest emitter in Indonesia,
China, Japan and Korea, as well as emerging contributing around 40% of total emissions
countries like Chile, Brazil and South Africa have between 2010 to 2018. Emissions from the
pledged to make its economy carbon neutral energy sector are predicted to increase to 58%
mostly by 2050 (excluding China that targets to by 2030, as indicated under the BAU scenario in
become carbon neutral by 2060). Indonesia’s Nationally Determined Contribution
(NDC), mainly driven by the increase in the final
We are now locked in a race to achieve climate energy consumption. The projection is in line
neutrality. The average temperature has already with the trend in emission intensity where GHG
risen 1.1 degrees above pre-industrial levels. emissions per final energy consumption has
To keep the average temperature “well below 2 not seen a significant improvement in the last
degrees,” as required by the Paris Agreement, decade.8
Indonesian GHG Emission, 2010-2018 and BAU 2030 based on NDC,
& GHG Emission per Final Energy Consumption, 2010-2018
3,500 0.73 0.73 0.75
0.71
0.70
0.68
3,000 0.68 0.67 2,868 0.70
0.66 0.66 25%
GHG Emission, in Mton C02e
GHG/Final energy consumption,
2,500 2,374 0.65
in MtC02e/million BOE
66%
4%
2,000 0.60
10%
1,637
1,509 58%
44%
1,500 1,331 47% 1,336 1,354 0.55
1,245
44% 38% 36%
1,054 37%
1,000 810 30% 0.50
8%
9% 9%
15% 9% 7% 5%
10% 8% 8%
13% 4% 8% 9%
9% 8% 8% 7% 36%
500 11% 43% 24% 40% 42% 0.45
48% 35%
56%
0 0.40
2010 2011 2012 2013 2014 2015* 2016 2017 2018 .... 2030
Energy Waste IPPU Agriculture FOLU & Peat Total GHG/final energy consumption
Figure 1: Indonesian GHG emissions, historic and 2030 target in NDC. *The significant emissions
increase in 2015 was mainly due
Source: (Kementerian Lingkungan Hidup dan Kehutanan (KLHK), 2020) for GHG and
to massive forest fires that year
Handbook of Energy and Economic Statistics of Indonesia 2019 for Final Energy Consumption
To lower emissions from energy, Indonesia needs In terms of power generation, renewable energy
to transition from fossil fuels to renewable energy. only accounted for around 15% in the first
Despite being rich in renewable energy, Indonesia semester of 2020 (on-grid only). On average,
had only installed 10,491 GW of renewable renewable energy only made up about 12.2%
capacity by December 2020, a mere 188 MW of total electricity generation in the last five
increase over 2019. Hydropower and geothermal years (2015 to 2019). In terms of primary energy,
energy contributed the most to Indonesia’s total renewable energy was even less significant at
renewable installed capacity(on-grid and off- around 9% in 2019, making achieving the target
grid), leaving other types of renewable energy of 23% renewable primary energy by 2025 more
underdeveloped. challenging.
Installed renewables capacity, 2015-2020 Renewables share in electricity generation, 2015-2020
Installed capacity, MW Share (%)
12,500 20
10,303 10,491
9,823
10,000 9,417
9,025 15 14.9
8,534
12.9 13.1
12.4 12.0
7,500
10.7
10
5,000
5
2,500
0 0
2015 2016 2017 2018 2019 2020 2015 2016 2017 2018 2019 H1 2020
Wind Solar Bioenergy Geothermal Hydopower Other renewables Biofuel Geothermal Large hydo
Figure 2: Renewable energy capacity and generation 2015-20209
In contrast, coal has played and will continue to play a significant role in Indonesia’s energy system
if no meaningful changes are made to foster decarbonization of the system. Between 2005 and
2019, Indonesia added 25 GW of coal-fired power plants, a 260% increase in 14 years. The massive
expansion of coal infrastructure aimed at meeting increased energy demand driven by economic
growth. Coal additions, however, do not necessarily translate into universal access to electricity;
the additions are concentrated on Java. The island has been oversupplied, while other parts of the
country still experience an electricity crisis.
60.000
50.000
40.000
MW
30.000
20.000
10.000
2020
2020
2008
2006
2009
2007
2005
2020
2024
2028
2026
2023
2027
2025
2022
2010
2014
2018
2019
2016
2017
2015
2021
2013
2012
2011
0
Current Installed Capacity Projection RUPTL 2019 - 2028 *Realization until the first half of 2020
Figure 3: Installed capacity of coal fired power plants
Nevertheless, the government carries on with its fact, the National Energy Plan (RUEN) aims to
plan to increase coal capacity to 57 GW by 2028 keep coal significant at 30% in 2025 and 25%
despite estimates (Gray et al., 2018) showing in 2050. Coal interests are so strong that the
that new solar PV will become cheaper than new government also intends to develop the coal
coal plants by 2021 and cheaper than existing downstream industry in the country in its effort
coal plants by 2028. While the risk of stranded to drive up the Indonesian coal demand amidst
assets is apparent, the Indonesian government the risk of declining coal exports due to global
currently has no plan for a coal moratorium. In energy transitions (Arinaldo, 2020).
35%
30% 30% 30%
30%
28% 28% 28%
26% 26% 26%
25% 25%
25%
23% 23%
20%
15%
10%
5%
2008
2009
2007
2050
2025
2010
2014
2016
2017
2015
2013
2012
2011
0%
Figure 4: Coal shares in the primary energy mix. *2025 and 2050 shares are RUEN targets10
Scenarios, assumptions, and methodologies
Our study analyzed energy transition from its present state, which is heavily based on fossil fuels
(mainly coal for power and oil for transport) towards deep decarbonization for the energy system
across the power, heat and transport sectors 1 of Indonesia by 2050. This research presents a
unique technology-rich, multi-regional and cost-optimal analysis with a high spatial (8 regions)
and temporal (hourly) resolution energy transition pathway in 5-year time intervals from 2020 to
2050 (see Box 1).
Primary Energy Demand Primary Energy Demand Primary Energy Demand
- Current Policy - Delayed Policy - Best Policy
100% 100% 100%
90% 90% 90%
80% 80% 80%
70% 70% 70%
60% 60% 60%
50% 50% 50%
40% 40% 40%
30% 30% 30%
20% 20% 20%
10% 10% 10%
0 0 0
2020 2025 2030 2035 2040 2045 2050 2020 2025 2030 2035 2040 2045 2050 2020 2025 2030 2035 2040 2045 2050
RE Electricity RE Solar Thermal RE Geothermal RE Bioenergy Fossil gas Fossil oil Fossil coal
Figure 5: Primary energy demand of the CPS, DPS and BPS
The study also considered growth in the energy, Further information on model boundaries can
industry, and economy and maintained a similar be seen in the Radical transformation pathway
level for all scenarios. Electricity consumption is towards sustainable electricity via evolutionary
expected to increase from over 1 MWh/capita steps (Bogdanov et al., 2019).
in 2020 to 8.5 MWh/capita by 2050. In addition
to reflecting global technological development, The Indonesia energy system transition is
the study also explored CO2 pricing options. modelled for 3 distinctive scenarios:
Current Delayed Best
Policy Policy Policy
Fossil-based Renewable-based Renewable-based
system system system
50% generation New coal capacity is No new coal capacity
capacity from coal allowed, reaching total of
57 GW coal capacity 54% Biofuel and 46%
60% Biofuel and 40% fossil Fischer-Tropsch fuel for
fuel for transport in 2050 63% Biofuel, 8% fossil fuel, and transport in 2050
29% of Fiscer-Tropsch in 2050
Up to 8% solar PV Up to 20% solar PV
prosumer adoption Up to 15% solar PV prosumer adoption
prosumer adopton
Delayed introduction of Early introduction of
GHG emission cost Delayed introduction of GHG emission cost
GHG emission cost
1
To see the difference between power, heat, and transport sectors in our model, please refer to Appendix E11
The Best Policy Scenario assumes a green growth CO2eq. Not only is the pathway not in line with
narrative, where the economy will continue the Paris Agreement, but there are also risks
to grow and based on sustainable sources of of stranded assets for the newly built coal
energy. All scenarios take into account general power plants. When looking at the profitability
assumptions on population growth of 1% per of the newly installed coal power plants, the
annum and electricity demand growth of 4.5% utilization of coal power plants falls to below
per annum. Amongst the three scenarios, only 6000 full load hours from 2030 onwards due
the Best Policy Scenario (BPS) reaches zero to competitiveness of solar PV systems.
emissions in 2050. The Delayed Policy Scenario
(DPS) projected a slower decline in emissions, In the Delayed Policy Scenario, the utilization of
with 125 Mton CO2eq emissions remaining in coal is gradually declining and replaced by solar
2050. On the other hand, emission in the Current PV that accounts for 80% of power generation in
Policy Scenario (CPS) grew and doubled in the 2050. The emissions decline to 125 Mton CO2eq ,
next 30 years, completely not in line with the failing to meet the 1.5 o C pathway. Utilization
Paris Agreement commitment. of coal-fired power plants will significantly fall
from an economically attractive level of well
Reaching near zero emissions in 2050 requires above 6,000 full-load hours to only around
a shift from fossil-based energy system to 2,000 in 2050.
renewable based energy system. Renewable
energy growth is observable in all scenarios due Meanwhile, in the Best Policy Scenario,
to its cost competitiveness and environmental Indonesia is using 100% renewable energy in
benefits. The shift to renewable energy sources 2050 and successfully decarbonizing its energy
became more prominent in 2030 and became the system in line with the 1.5 o C Paris Agreement
major source of energy from 2040 onwards. target. No fossil-based generation is observed
in the system, securing zero emissions from
In the Current Policy Scenario where 50% the energy sector. Coal generation, particularly,
of power generation comes from coal (and is kicked out of the energy system due to low
reaching 185 GW) in 2050, the emissions from competitiveness in comparison to electricity
the energy system double to around 950 Mton produced from solar PV and batteries.
1000
GHG emissions [MtC02eq]
900
800
700
600
500
400
300
200
100
0
2020 2025 2030 2035 2040 2045 2050
BPS DPS CPS
Figure 6: Emissions of the CPS, DPS, and BPS12 Box 1 The LUT Energy System Transition Model is structured to provide an optimal set of technologies and capacities matched with the availability of resources in 8 regions in Indonesia (Sumatra, Java West, Java Central, Java East, Nusa Tenggara, Kalimantan, Sulawesi, Maluku and Papua). All sectors (power, heat, and transport) are integrated and optimized together in full hourly resolution. Generation, storage, transmission technologies operation is optimized for each hour to get least cost energy supply. Model structure can be seen in ANNEX E. The LUT Energy System Transition Model is a linear optimisation tool that models a transition of the integrated power, heat and transport sectors on an hourly time scale for every 5-year time step from 2020 to 2050. Under specific constraints, the model defines an optimal cost structure and operation modes for each of the energy system’s elements to provide a least-cost solution. The unique feature of the model is that it enables a global-local energy system transition towards 100% renewable energy for the power, heat and transport sectors. The LUT model has been applied on a global scale (Bogdanov et al., 2019), for Europe (Ram et al., 2018), Japan (Renewable Energy Institute, et al., 2021) but also for country studies comparable to Indonesia, such as for Bolivia (Lopez et al., 2021), Finland (Child et al., 2020), Turkmenistan (Satymov et al., 2021), and Kazakhstan (Bogdanov et al., 2021). A recent review study has rated the LUT model highest among all investigated long-term energy system transition models (Prina et al., 2020). Input data in the LUT Energy System model: • historical weather data for: solar irradiation, wind speed and hydro precipitation • available sustainable resources for biomass and geothermal energy • synthesised power load data • efficiency/yield characteristics of RE plants • efficiency of energy conversion processes • capex, opex, lifetime for all energy resources • min and max capacity limits for all RE resources • nodes and interconnections configuration
13

  A pathway to zero emissions
  by 2050
  Indonesia today, as many countries around the                                 mitigation commitment.
  globe, is at a watershed moment. The country is                               This section lays out a pathway to zero emissions
  on a path of increasing its carbon footprint, which                           in the energy system, as depicted in the Best
  is expected to grow dramatically in the coming                                Policy Scenario, in three stages:
  decade. Yet, technological innovation, the impact
  of climate change becoming more and more                                      •     By 2030: bending the greenhouse gas
  visible and global political commitments towards                                    emission curve and peaking emissions.
  a zero carbon future provide what seemed
  unimaginable a decade ago: a real and unique                                  •     By 2045: removing a major share of emissions
  opportunity to transform the energy system.                                         through energy system transformation.
  As seen in Figure 9, there is still a mismatch
  between existing planning, the reality of the                                 •     By 2050: achieving zero emissions through
  energy system, and where we need to be – in                                         increase in green synthetic fuel production
  order to be in line with global climate change                                      and elimination of residual emissions in the
                                                                                      industry sector.

              1800
Mton C02eq

              1600
                                                                                                Current
                                                                                                 NDC
              1400

              1200

              1000

                                                                                          Where we
              800                                                                        need to be-
                                                                                        intermediate

              600

              400
                                                                           Where
                                                                           we are
              200
                                                                                                                                Where we
                                                                                                                                need to be
                                                                                                                                long-term
              0

                          1990     1995   2000     2005     2010    2015     2020     2025   2030   2035   2040   2045   2050

             Historical      BPS      DPS        CPS      BAU Reference     NDC CM1      NDC CM2

  Figure 7: Historical emissions in the energy sector and emission reduction pathways in Indonesian NDC and this study
14
1000
Mton C02eq
900
800
700
600
500
400
300
200
100 Power
0 Industrial heat
2020 2025 2030 2035 2040 2045 2050 Transport
Stage 1 Stage2 Stage3 Reference (CPS)
Figure 8: Emission reduction for each sector in the Best Policy Scenario
Step 1 (up to 2030): Bending the curve peaking GHG emissions
Similar to other emerging nations, Indonesia's not only due to its resource potential but also
energy consumption is expected to increase 2 cost competitiveness, reaching a LCOE level at
in the next decade. This has implications for around USD 18/MWh by 2030, much lower than
emissions from the energy sector. The first PV LCOE in 2020 at USD 53/MWh.
important step to carbon neutrality is to bend
the emissions curve as soon as possible by Power sector emissions will still increase to
decoupling emissions growth from economic around 200 Mton CO2eq due to the amount of
growth. Low economic activity due to the fossil fuel in the current system. Around 11 GW of
pandemic has curbed GHG emissions, but coal power plants are under construction, giving
structured changes will need to follow. Peaking a total of 44 GW of coal power plants by 2030.
emissions from the energy sector before 2030 is However, due to decrease in CFPP utilization, the
crucial to achieve. One of the primary means is to share of coal generation will fall from current
fill in the growing energy needs with low-carbon levels of 60% to 45% in 2030, yet coal electricity
energy sources quickly. The power sector is the production will still increase from 185 TWh to
low-hanging fruit, but the transport and industry 355 TWh.
sectors must already follow suit.
In addition, it is also important to take into
Power sector: the first important step is to account domestic energy trading and the needed
install renewables at scale and increase their infrastructure. The Java, Kalimantan, and Nusa
share to 45% in the power sector. Along with Tenggara power systems will be interconnected
other renewable energy sources, Indonesia by 2030 to ensure security of supply with a total
would need to install 100 GW of solar PV in the transmission capacity of more than 3 GW (HVDC),
next 10 years. Rooftop solar PV and prosumer mostly for exporting power to Java.
systems are assumed at 2% of total demand in
2025, continuing the effort of one million solar Transport sector: there is a change in trends
rooftop initiatives. All of these efforts still only as more people shift to public transport. Cycling
use 6% of the technical potential 3 . Solar PV will is also becoming more mainstream. Similarly, 2
be one of the main contributors to energy supply wheelers still play a central part in public mobility.
2
The population across Indonesia is expected to grow steadily from 270 to 325 million, while the average energy
demand per capita grows from around 6.9 MWh/person in 2020 up to over 9.0 MWh/person by 2050.
3
Solar PV module efficiency is assumed to increase from what is today at
18% to 22% at 2030, with a specific capacity of 92 MW/km2.15
In 2030, there will be more than 100 million new As an important part of Indonesian energy
battery-powered electric motorcycles on the policy, biofuel blending mandate is assumed to
road. Electric cars will also start to emerge, with continue. Biofuel production is projected to grow
around 1.7 million vehicles; the government-led almost 3-fold from 8.4 million kL today to 24.2
program is expected to amount to around 188 million kL in 2030, fulfilling 30% of the transport
thousand electric busses by 2030. In total, electric sector demand. With high penetration of solar
vehicles account for 15% of energy demand from PV, increased use of biofuels, and electrification
the transport sector. Meanwhile, fossil fuel share of the transport and heat sectors, the national
in liquid hydrocarbon demand declines to around energy target of 23% of renewables by 2025 in
70% from almost 90% today. primary energy will be well-achieved.
Step 2 (up to 2045): Decreasing carbon emission by around
92% between 2030 and 2045
By 2030, emissions have peaked. Decarbonization Energy storage starts to become more relevant
efforts continue in the next 15 years. In 2045, as the renewable energy share rises. As
Indonesia will enter the golden generation batteries become cost-effective, they emerge
(Indonesia Emas 4 ). Low-carbon energy systems as the most significant energy storage by 2045
and infrastructure will be key strategies towards with their share at around 52% of total storage
reaching the vision of the golden Indonesia. In systems, followed by hydrogen at 37% and
this phase, emissions fall by up to 92%. other storage systems at around 11%. Higher
share of batteries will complement the higher
Power sector: All (100%) electricity generation penetration of renewable energy (particularly
comes from renewable energy resources solar energy and diurnal role of batteries). The
by 2045. Electricity generation will grow share of electricity demand covered by energy
enormously as electrification of all sectors storage increases significantly from around 2%
continues with electrification accounting for by 2030 to 29% by 2045. Major share of battery
around 2/3 of total power demand. Solar PV storage will come from utility-scale systems, and
emerges as the bulk electricity provider by smaller share from commercial and industrial
contributing to 88% of electricity generation parks, and residential systems.
in 2045, complemented by hydropower and
geothermal energy. Hydropower supplies Transport sector: Battery electric vehicles will
6-12% and geothermal continues to increase dominate road transport as battery-powered
and contributes around 6-10% of the total two-wheelers, cars, busses, and trucks amount
generation. As low-cost renewables, especially to over 230 million vehicles on the roads by
solar PV, gain traction in the energy system, 2045. In total, battery electric vehicles account
coal utilization drops considerably and starts to for 44% of energy demand from the transport
lose attractiveness. At this stage, a large share sector. Meanwhile, fossil fuel share in demand
of existing Indonesian coal power plants will for liquid hydrocarbon falls to 27%, mainly
reach more than 30 years 5 of operation. used in hard-to-abate maritime and aviation
sectors. The use of fossil fuels in these sectors
The share of coal generation will rapidly decline contributes to 80% of emissions in the energy
from around 46% in 2030 to around 12% in 2035 sector in 2045.
and 4% in 2040 before reaching zero in 2045,
indicating that coal retirement programs should While biofuel still maintains its share, synthetic
be carried out from 2030 onwards. fuels and hydrogen will start to gain its
importance in marine and aviation. Electrolyzer
4
Indonesia Emas is a goal that Indonesia, with its large share of productive generation in 2045, will become a well-developed
country, free from corruption and poverty issues. The year is also 100 years of celebration of the country's independence.
5
In 2020, the Ministry of Energy and Mineral Resources (MEMR) stated that coal power plants more than 20
years old operation, which is currently around 5.6 GW, should be replaced with renewables.16
and Fischer-Tropsch installed capacities increase Industry sector: Industry will use more electric
significantly from 2035 onwards and reach more heating. Over the next 15 years, between 2030-
than 180 GW by 2045, with a major share of water 2045, electric heating should provide nearly 70%
electrolysis along with CO2 DAC as the basis of the heat generated and be complemented by
for Fischer-Tropsch and hydrogen production. bioenergy (2%). Fossil-based heating decreases
Building these dedicated renewables sites and gradually to 3% while renewable fuels-based
electrolyzers may not only provide domestic heating will contribute to a quarter of heat
needs but also present export opportunities to generation in 2045.
demand centres in China, South Korea, Japan,
and Singapore.
Step 3 (up to 2050): Decarbonizing the last miles
Thanks to renewables and a high degree of (hydrogen and synthetic fuels) produced by
electrification, 90% of emissions will have renewable electricity contribute to 27% of the
been mitigated by 2045. While most emissions final energy demand in the transport sector in
in the power sector are mitigated through 2050.
solar PV, geothermal and hydropower, more
decarbonization efforts will be needed in the Industry sector: Electric heating plays a
transport and industrial sectors. significant role in the heat sector, with nearly
67% of heat coming from electric heating by 2050.
Power sector: Continue using 100% renewable The remaining heat comes from renewable-
energy. Solar PV remains the largest contributor based hydrogen and synthetic methane as well as
to power generation, accounting for 88% of bioenergy to generate high-temperature process
total generation. Meanwhile, electricity storage heat. Emissions from industrial heating reach
systems contribute to around 30% of electricity zero by 2050. Heat demand increases steadily
demand. from around 700 TWh,th in 2020 to 811 TWh,th
in 2050, mainly driven by higher demand for
Transport sector: Most emissions that still industrial process heat (91%) that is projected
occur in the aviation and maritime sectors will to grow moderately. Other demand comes from
vanish near 2050. To fully decarbonize this sector, domestic water heating. Heat for fuel conversion
hydrogen consumption in the transport sector is managed with excess heat and recovered heat
will need to double in five years. Liquid fuels in various processes.17
Stage 1 Stage 2 Stage 3
Power: Power: Power:
• No new coal except • 100% Renewables, • Continue 100%
11 GW in the pipeline Utility-scale Battery of Renewables
• 100 GW of solar PV storage
• 2 GW of solar PV • Coal retirement Industry:
prosumers program • Increase use of
• Start installing 200 synthetic fuel
Industry: GW of electrolysers • Heat recovery
• Biomass and • CO2 storage and management
electric heating DAC to produce
synthetic fuel Transport:
Transport: • Doubling electricity-
• Increase biofuel Industry: based mathane
blending • Biomass and and hydrogen
• 70-100 million electric heating production
new electric motor • Start use of
synthetic fuel
Transport:
• 190 million new
electric motorcycles
• 59 million cars,
eletcric train
700
Power Industry
Transport
600
562 Power
-46
-27
494
500
+ 141
400
300
Transport
-313
200
Industry
-113
100
43 Industry
Transport
-92
0
-35 -8
2018 2030 2045
Figure 9: A pathway to zero emissions. (Note: increased emissions in the power sector from 2018
to 2030 due to growing demand and emissions from both existing and newly entering operation-
fossil power plants. The model assumed that PV+battery is not yet cost-competitive with coal power
in 2020 so a cost-optimal solution is reached with peak coal generation as observed in 2025.18
Four pillars of the transition to a
zero-emission energy system
To achieve a zero-emission energy system by 2050, the Indonesian government, utilities and
stakeholders should focus on at least four areas.
1. Renewables
Our model shows that PV will emerge as the these non-PV renewables are quite miniscule
dominating source of energy, in particular in comparison, they still play an important role
from 2040 onwards. In the Best Policy Scenario when it comes to balancing PV variability.
(BPS), PV will contribute to around 88% of total
electricity generation in 2050, followed by The remaining coal capacity in the country will
hydropower at 6% and geothermal at 5%. With inevitably become stranded as coal loses its
all electricity coming from renewable sources, competitiveness against renewable energy.
renewables capacity will significantly increase. Stranded coal assets without any utilization
PV installed capacity reaches 1,492 GW by 2050 will peak in 2045 at around 53 GW and cost
with electricity generation as high as 2,602 Indonesia USD 26 billion. This is as a result of
TWhe, followed by hydropower capacity at 40 new coal-fired power plants built between 2020
GW and geothermal capacity at 19 GW. While and 2025.
1800 3000
1600
2500
1400
Installed electrical capacity (GW)
Electricity generation (TWh)
1200 2000
1000
1500
800
600 1000
400
500
200
0 0
2020 2025 2030 2035 2020 2025 2030 2035
Nuclear Fosil coal Fosil oil Fosil/Renewable gas Geothermal PV prosumers PV single-axis
PV fixed tilted Wind offshore Wind onshore Hydro
Figure 10: Installed capacity and generation19
Indonesia has high PV potential evenly distributed import and export of electricity is observed to
throughout the nation. The total PV potential be highest during this period (seasonal balance).
for Indonesia increases from about 1,400 GW
in 2020 to 3,380 GW in 2050, assuming that The higher PV share during the day is balanced
efficiencies of PV modules will increase from only out by battery charge, power-to-fuels, power-
18% in 2020 to around 30% in 2050. With 1,492 to-mobility (EV charging), power-to-heat, and
GW installed capacity in 2050, only 44% of the regional export. Hydropower plants are operated
total potential is utilized which requires a total flexibly during this period while geothermal
area (excluding forest and water) of 2.5% of the operates as baseload. At night, when solar PV
available land. Around 80% of solar PV is utility- is not available, battery discharge, hydropower,
scale, the remaining comes from rooftop solar geothermal, biomass, and regional import will
PV in the residential, commercial and industrial be dispatched to meet demand.
sectors.
For energy potential and current load
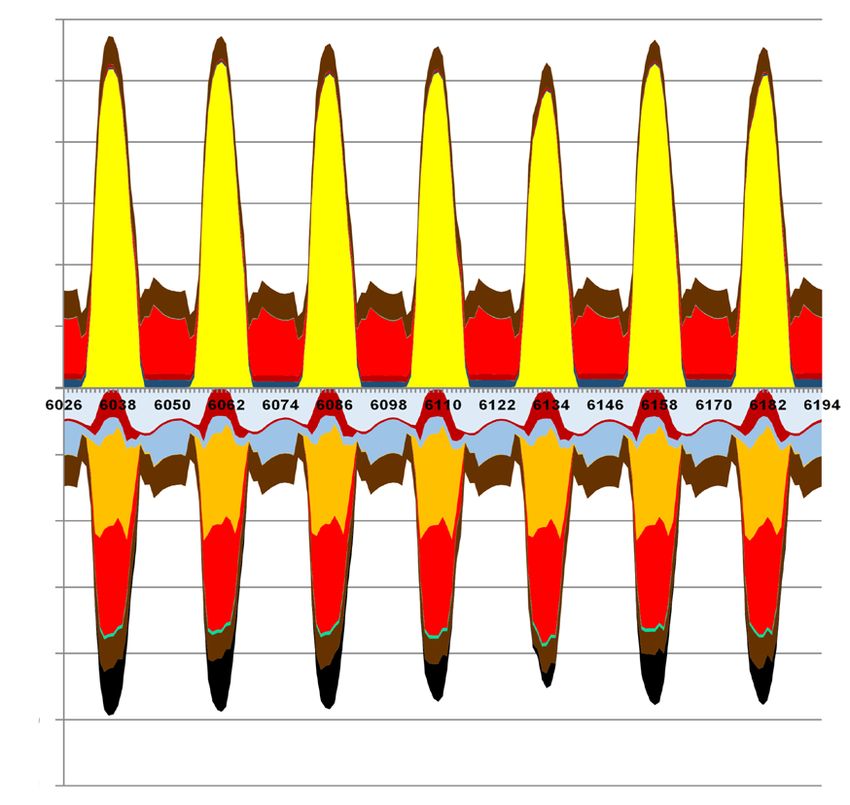
While concerns about the variability of PV are distribution, intraland electricity import-export
real, the model shows the security of supply is mandatory. In the BPS, nearly 760 TWh of
is guaranteed despite high shares of solar electricity is exchanged across the country,
generation. Compared to many other world with Sumatra and Nusa Tenggara as the major
regions, Indonesia has rather small seasonal or exporters, while Java is the major importer. The
even daily variations in solar output as seen in island of Java is assumed to remain the main
the figures below. During the best solar week, energy consumer in Indonesia by consuming
peak of solar PV generation is around 1,000 GW 80% of total energy in the country. With this
during most of the hours in 2050, the system has condition, Java will need to import 4.6% of its
excess generation during this week. During the demand by 2030, 45.5% by 2040 and 82.1% by
worst solar week, the peak of solar generation 2050 under the Best Policy Scenario.
is around 700 GW during most of the hours,
Best solar week 2050 Worst solar week 2050
1200
1000
800
GW
600
400
200
0
-200
-400
GW
-600
-800
-1000
-1600
Hours of a year Hours of a year
(+) Top Side Legend (-) Bottom Side Legend
Import Storage discharge others Biomass/Waste Excess Power-to-Fuels
Gas turbines Battery discharge Hydropower Export Power-to-Mobility
Coal Geothermal Wind Storage charge other Power-to-Heat
Solar PV Battery charge Power demand
Figure 11: Hourly generation in best and worst solar weeks20
14
43
8
101
8
42 2 34
181
Demand Generation
Figure 12: Illustration of annual imported and exported electricity in 2050 (in TWh)
To support this trading, Indonesia's grid However, since transmission grid projects usually
capacity will need to expand. In all scenarios, take a long time to develop, it is very important
interconnections between East Java and Bali to start planning decades before.
will need to be expanded to Nusa Tenggara.
The planned Java-Sumatra interconnection is Realizing this intraland electricity transfer will
very important to supply electricity to Java. demand action from the government, policy
The importance will increase after 2030 as makers, regulators, and from Perusahaan
capacity will need to increase from virtually Listrik Negara (PLN) as the utility that owns all
zero in 2030 to around 50 GW by 2050, with transmission and distribution lines. Our model
utilization exceeding 97%. Interconnections indicates that by 2050 an overall transmission
between Java, Kalimantan, and other islands capacity of 158 GW needs to be built to
will be more important beyond 2030 as the interconnect Indonesia from west to east.
energy system becomes more electricity-based.
Connection 2020 2025 2030 2035 2040 2045 2050
'Sumatra' 'Java - West' 0 0 0 6,104 10,685 36,170 51,802
'Java - West' 'Java - Central' 4,200 4,200 4,200 12,619 26,091 26,092 26,092
'Java - West' 'Kalimantan' 0 0 0 0 0 0 0
'Java - Central' 'Java - East' 4,200 4,200 4,200 13,199 23,087 26,089 30,486
'Java - East' 'Nusa Tenggara' 0 1 766 18,817 27,259 27,793 32,029
'Java - East' 'Sulawesi' 0 787 2,609 2,609 2,610 5,048 12,931
'Nusa Tenggara' 'Sulawesi' 0 0 612 1,505 1,505 1,505 1,505
'Kalimantan' 'Maluku and 0 0 3 509 509 509 509
'Sulawesi' Papua'' 0 0 831 2,536 2536 2,536 2,536
Total 8,400 9,188 13,221 57,898 94,282 125,742 157,890
Table 1: Grid capacity development in Indonesia (Note: inter-island connection is HVDC)21
2. Electrification
This study reveals that comprehensive In the transport sector, efforts to reduce the need
electrification will lead to increased energy to travel through better urban planning and to
efficiency due to lower conversion losses, increase the use of public transport and non-
lowering both the primary energy supply and motorized transport will help decarbonize the
greenhouse gas emissions (GHG) significantly. sector. However, motorized vehicles will remain
Since most emissions in the power sector one of the main transport modes in the future
come from coal, electrification of all sectors with around 288 million new EVs will be seen on
can bring about massive emission reductions the road in 2050. Electrification of vehicles will
only if all electricity generation comes from also become increasingly important to help the
renewable sources. It is also worth noting that country’s transport sector become carbon-free
direct electrification is carried out whenever by 2050.
possible as it requires much less energy (higher
efficiency). Indirect electrification is therefore Our model shows that battery electric vehicles
needed for technology reasons (energy density, (BEV) should comprise 73% and 95% of newly
heat temperature, etc.) sold passenger cars and light trucks (light duty
vehicles) and newly sold motorcycles, respectively
By 2050, Indonesia needs to see a high level of by 2050. Meanwhile, in other segments of road
direct and indirect electrification of more than transport vehicles, BEVs will make up 90% (bus),
80% in all sectors (transport, heat, and power) 80% (medium duty vehicles), and 50% (heavy
to be able to achieve zero GHG emissions in duty vehicles) of newly sold vehicles in the same
the energy system by 2050. Specifically, direct period. The remaining share will use hydrogen,
electrification will cover 46% and 70% of energy renewable-based synthetic fuels, and sustainably
demand in the transport and heat sectors, produced biofuels to drive fuel cell electric
respectively. Meanwhile, indirect electrification vehicles, plug-in hybrid electric vehicles, and
through the production of synthetic fuels and internal combustion engines. The road transport
hydrogen will make up 33%, and 27% of final modes such as motorcycles, cars, and buses
energy demand in the transport and heat are relatively easy to electrify, and thus should
sectors, respectively. become the first priority of the Indonesian
government.
4000
Primary energy demand - TWh
23%
3500
Efficiency
3000
gains from RE
Electrification
2500
2000
1500 Fossil
1000
Renewables
500
0
2020 2025 2030 2035 2040 2045 2050
Figure 13: Development of primary energy demand and efficiency gains22
100%
90%
Technology mix of light duty vehicles (LDV)
80%
70%
60%
50%
40%
30%
20%
10%
0%
2020 2025 2030 2035 2040 2045 2050
BEV FCEV PHEV ICE
Figure 14: Technology mix of light duty vehicles (LDV)
Meanwhile, indirect electrification through the Overall, direct electrification creates demand
use of synthetic fuels will be key in decarbonizing of 429 TWh while indirect electrification to
the harder-to-abate sectors such as maritime, produce synthetic fuels creates an additional
aviation, and some industrial processes (very high electricity demand of around 252 TWh by 2050
temperature process heat). Additionally, synthetic in the transport sector. Massive demand for
fuel conversion provides vital flexibility to the renewables-based liquid fuels will kick-in from
energy system via the power-to-fuels integration. 2040 onwards up to 2050 with liquid fuels
By 2050, the fuel conversion capacities reach produced by renewable electricity covering
around 242 GW with electrolyzers making up around 27% of final energy demand in 2050.
for 95% of the capacities and the rest comes Hydrogen, specifically, will make up around 21%
from Fischer-Tropsch. Greater capacities provide of final energy demand in 2050.
higher flexibility enabled by electrolyzers, but
also add to the overall energy demand.
3. Decline in fossil fuel use
Fossil fuels have long dominated the Indonesian Therefore, consideration on the economic viability
energy system by contributing to more than 90% of new coal-fired power plants is needed to avoid
of annual primary energy supply over the past stranded assets in the near future.
decade (Handbook Of Energy & Economic Statistics
Of Indonesia, 2020). However, fossil fuel utilization Later on, a coal moratorium will be much more
will drastically decline through the transition as feasible; coal power generation loses its relevance
fossil fuels are completely replaced by electricity with increasing competitiveness of renewables,
and synthetic fuels along with some sustainable in particular PV. In addition, carbon taxes will
biofuels in all three scenarios by 2050. further accelerate the decline in coal-based
power generation in the country, making coal
To achieve the ultimate goal of a carbon-neutral power unaffordable. In our Best Policy Scenario
energy system by 2050 in line with the target of (BPS), coal starts losing attractiveness from 2025
limiting temperature rise to about 1.5°C, Indonesia onwards as low-cost renewables (particularly PV
needs to start limiting coal development. In the and batteries) gain traction in the energy system.
optimized model, any coal plants built after To avoid coal stranded assets, early decisions
2025 would not be utilized for more than 15- to stop building new coal plants are needed.
20 years. This foreshortening would seriously If delayed, Indonesia would likely see higher
undermine the economics of such investments. stranded coal investments in the future.23
100%
90%
80%
70% Renewables
60%
50%
40%
Fossil
30%
20%
10%
0%
2020 2025 2030 2035 2040 2045 2050
Figure 15: Indonesia’s primary energy mix
The decline in fossil use will later reduce the overall by a steady decline and almost zero emissions in
GHG emissions from the energy system from 2045. In addition to achieving climate targets, zero
around 502 MtCO2eq in 2020 to virtually zero in use of fossil fuels by mid-century will also help
2050. In contrast, under the business-as-usual lower the number of people with air pollution-
scenario (CPS), Indonesia will see an increase related Non-Communicable Diseases (NCDs) in
in GHG emissions by 89% in 2050. The BPS will the country.
enable an early stabilization of emissions, followed
4. Clean fuels
Clean fuels are one of the key parts of a contribute most to fuel use in the sector at
decarbonized energy system. In this study, clean around 54%, with the remaining sourced from
fuels used are sustainable biofuels, synthetic liquid hydrocarbons (Fischer-Tropsch), methane,
fuels, and hydrogen. These fuels along with and hydrogen. It is important to note that the
electrification will completely replace fossil fuel model is conditioned to use all sustainable
use in both the transport and industry sectors. biofuel potential available to reflect government
Biofuels are used in the transport sector and continuous support for biofuel programs.
Final energy demand for transport [TWh]
1000
800
600
Liquid fuels (Fossil)
400
Liquid fuels (FT)
Liquid fuels (Bio)
200 Methane electricity-based
Hydrogen electricity-based
Electricity direct
0
2020 2030 2040 2050
Figure 16: Final energy demand of the transport sector24
While biofuels have become an important Meanwhile, synthetic fuels produced through
part of the Indonesian energy policy, concerns the Fischer–Tropsch 6 process are used in the
over production sustainability remain. Biofuel transport sector to replace fossil-based diesel
production itself requires far more land than and jet fuels. On the other hand, other renewable-
PV for producing Fischer-Tropsch (FT) fuels due based fuels such as synthetic methane and
to considerably lower yield of energy crops hydrogen are used as fuels for both vehicles and
compared to PV yield/km2 for converting the industrial heat generation. All of these synthetic
solar electricity. In the BPS scenario, biofuel fuels and hydrogen are produced domestically
potential grows from 88 TWh in 2020 to 229 using renewable electricity. The electricity is
TWh in 2030 and is assumed to stay constant used in water electrolysis as the basis for Fischer-
until 2050 to ensure the sustainability of biofuel Tropsch process and hydrogen production. With
production. The land requirement increases from more countries around the world embracing
2.5% (20,000 km2) to 6.4% (50,000 km2) of the hydrogen as part of their decarbonization
total area (excluding area occupied by forest and strategies, Indonesia should also follow suit with
water) from 2020 to 2030. this development.
Final energy demand for heat [TWhth]
800
700
600
500
400
300 Fossil fuels
Bioenergy
200 Methane electricity-based
Hydrogen electricity-based
0 Electricity direct incl. HP
2020 2030 2040 2050
Figure 17: Final energy demand of the industry sector (heat)
6
Fischer–Tropsch process is a process that converts a mixture of carbon monoxide and hydrogen into liquid hydrocarbons/fuels25
Required investments to achieve
zero emissions by mid-century
Continuing business as usual until solar PV technology costs have gone down significantly is
understandable at first sight, but not without consequences. A stepwise decarbonization would
require reduction of coal power plants in the pipeline. An immediate halt of new coal power plants
is necessary to reduce the risk of stranded assets.
Annual system cost [b$]
250
200
150
100
50
0
2020 2025 2030 2035 2040 2045 2050
BPS DPS CPS
Figure 18: Annual system costs
Under most assumptions for future fuels 7 and costs occur in the next decade between 2020 and
CO2 prices 8 , cumulative annual system costs from 2030. Meanwhile, from 2030 onwards, the trend
2020 to 2050 of the renewables-based energy changes with annual system costs becoming more
system are 20% lower than costs of the energy attractive in comparison to both the DPS and CPS
system where fossil fuels dominate. Pathways step by step.
towards carbon neutrality in the energy system
will thus not require higher system costs than When looking at the levelized cost of electricity
fossil-based pathways, making the vision more (LCOE), two main findings are relevant: while
feasible to achieve than ever before. What does power is more expensive for the decarbonization
become evident when looking at annual system pathway up to 2030, it does become cheaper than
cost in five-year time steps is that, in order to both alternative scenarios from 2030 onwards.
initiate a transition in the 2020s, higher system This is even true under the assumption of a lack of
7
Coal price is at around USD 11-17/MWhth (USD 89-134/ton) and gas price is at USD 24-44/MWhth (USD 7-13/MMBTU)`
8
The CO2 emission price for BPS starts at around USD 10/ton CO2eq in 2020, reaches about USD 50/ton by 2030, and gradually increases to USD 100/ton
by 2050. For the CPS, the CO2 emission cost starts only in 2030 at USD 10/CO2eq, reaches USD 55/ton in 2040, and gradually increases to a similar USD
100/ton in 2050. The 2050 CO2 price is similar under all scenarios due to the assumption that in 2050, a carbon price of USD 100 would likely be imposed.You can also read