Baby Bonus, Fertility, and Missing Women - PWP-CCPR-2020-008 October 30, 2020 California Center for Population Research On-Line Working Paper ...
←
→
Page content transcription
If your browser does not render page correctly, please read the page content below
Baby Bonus, Fertility, and Missing Women

  Wookun Kim
  Assistant Professor
  SMU Department of Economics

         PWP-CCPR-2020-008

         October 30, 2020

                                California Center for Population Research
                                           On-Line Working Paper Series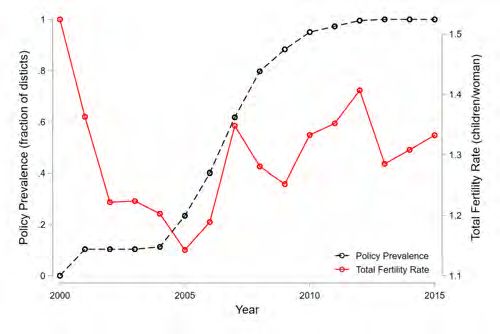
Baby Bonus, Fertility, and Missing Women∗
                                                Wookun Kim†

                                               October 21, 2020
                                   Click Here for the Most Recent Version

                                                     Abstract

            This paper presents novel causal evidence on the effects of pro-natalist financial incentives on
        babies. I exploit rich spatial and temporal variation in the generosity of cash transfers provided
        to families with newborn babies and the universe of birth, death, and migrant registry records
        in South Korea. I find that the total fertility rate in 2015 would have been 3% lower without
        the cash transfers. These cash transfers were particularly effective among working mothers
        and encouraged them to have second and third children. This selection of working mothers into
        childbearing led to a decrease in gestational age, which in turn led to an overall reduction in birth
        weight, but no change in early mortality. The cash transfers had an unintended consequence of
        correcting the unnaturally male-skewed sex ratio closer to its natural level.

      Keywords: cash transfer, fertility, neonatal health, missing women, son preference.
      JEL codes: H40, H75, I50, J13, J16, J18.

  ∗
     I am grateful to Adriana Lleras-Muney, Kathleen McGarry, Youssef Benzarti, and Manisha Shah for their en-
couragement and guidance. I thank Diederik Boertien, Brett McCully, Klaus Desmet, Daniel Millimet, Ömer Özak,
James Lake, Michael Sposi, Gunnar Andersson, Paola Giuliano, Till von Wachter, and many participants at UCLA
applied-micro seminars, Southern Methodist University Brown Bag Seminar, and the annual PAA meeting in Denver
2018 for helpful comments. This project was supported in part by the California Center for Population Research at
UCLA with the grant (T32HD007545; P2CHD041055) from the Eunice Kennedy Shriver National Institute of Child
Health and Human Development. The content is solely my responsibility and does not represent the official views of
the NICHD and the National Institutes of Health. All errors are mine.
   †
     Department of Economics, Southern Methodist University. Address: 3300 Dyer Street, Suite 301, Dallas, TX
75206. Email: wookunkim@smu.edu.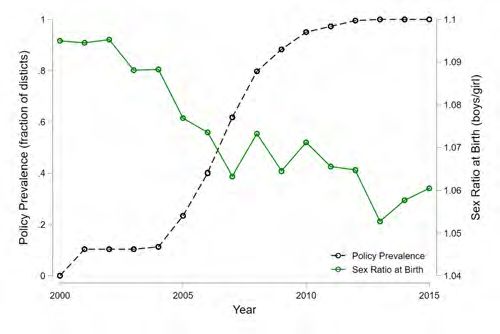
1     Introduction
    Total fertility rates have dramatically declined in much of the developed world, and women
are having fewer than 2 children on average (Strulik and Vollmer, 2015). Policy makers have
expressed growing concerns about the consequences of the resulting demographic imbalance (e.g.,
declining size of labor force relative to dependent population), which is further exacerbated by
an aging population (Morgan, 2003; Frejka et al., 2010; Harper, 2014).1 In this paper, I ask how
financial inventives influence fertility and whether they create unintended consequences that will
shape children’s life course in the long run.
    This paper provides new causal evidence on the effects of pro-natalist cash transfers on neona-
tal health and sex composition at birth as well as the number of births, based on temporal and
spatial variation in the cash transfers and the universe of birth, death, and migrant registry records
from South Korea. I investigate whether the introduction of pro-natalist cash-transfer policy had
an impact on birth rates, how elastic they are with respect to cash transfers, and how the effect varies
by birth order and mother’s age. Next, I study unintended consequences of the cash transfers on birth
quality (birth weight, gestational age, and early-life mortality) and sex compo-sition. Lastly, I
explore potential mechanisms behind these causal effects on fertility and sex: e.g., temporal
adjustment of fertility, spatial sorting of families, and selection of working mothers into
childbearing.2
    South Korea—the empirical setting of this paper—provides an ideal environment to study pro-
natalist cash transfers, which provide cash subsidies to parents when they have a baby. There is
rich variation in both pro-natalist policy implementation timing and the amount of cash transfers
by birth order (first, second, and third), over time (year), and across granular spatial units (hereon
referred to as districts).3 I leverage this rich time-series and cross-sectional variation to identify the
causal effects of pro-natalist cash transfers on various outcomes associated with births. I construct
a yearly panel data set of districts from 2000 to 2015 with pro-natalist cash transfer amounts and
the number of births (decomposed by birth order and mother’s age) to estimate the cash-transfer
effects on birth rates and merge this data set with the universe of confidential birth registry records
to study the effects on neonatal health (birth weight and gestational age) and the sex of newborn
babies. Furthermore, I use confidential birth-death matched registry data for children born between

     1
       Jones (2020) emphasizes the importance of policies related to increasing fertility and shows that, without such
measures, we may converge to an empty planet in which “knowledge and living standards stagnate for a population
that gradually vanishes”.
     2
       An increase in the number of births may be driven by son preference (Basu and de Jong, 2010), or may simply
reflect the temporal adjustments of childbearing (Andersen et al., 2018) and the spatial sorting of families (Tiebout,
1956). The cash transfers may affect neonatal health outcomes as well as the number of births. Access to better
prenatal care from the prospect of receiving the cash transfer may improve health outcomes at birth (Almond, 2006;
Aizer, 2011; Hoynes et al., 2015). An increase in the number of births may bring about poor “child quality” from
the quantity-quality tradeoff as in Becker’s human fertility model (Becker, 1960; Becker and Lewis, 1973; Becker and
Tomes, 1976). Changes in birth quality would affect children’s long run outcomes (Almond and Currie, 2011; Almond
et al., 2018).
     3
       Districts in South Korea are the smallest administrative units with self-governing authorities, and they form 17
metropolitan cities and provinces such as Seoul and Gyeonggi (hereon referred to as cities).

                                                          1
2010 and 2013 and investigate the cash-transfer effect on early-life mortality.
For causal identification, I include both district fixed effects and the city-by-time fixed effects
to the estimating equations throughout this paper. The district fixed effects purge out any time-
invariant district-level characteristics such as baseline demographic composition. The city-by-time
fixed effects absorb any trends and changes common across districts within each city in a given time
(e.g., a year or a month) as well as any aggregate shocks and changes taking place at the national
level. Because districts are relatively granular with respect to their geographic size, these fixed
effects capture region-specific shocks for each time period; for instance, local labor, housing, and
marriage market conditions. I further introduce time-varying district-level characteristics as control
variables that are likely correlated with both cash transfers and birth outcomes. Then, the key
identification assumption is that all other determinants of birth outcomes, net of observed control
variables as well as the rich set of fixed effects, are orthogonal to cash transfer implementation
timings and generosity.
Exploiting plausibly exogenous variation in the pro-natalist cash transfers across space and over
time, I find that the cash transfers increased birth rates. Based on an event study framework, I
estimate a statistically significant increase in the birth rates across birth orders. The effect of cash
transfers for a first child was largest among younger mothers (ages 25-29). For mothers between the
ages of 30 and 34, having a second child was the most pronounced effect. Finally, for those between
the ages of 35 and 39, I observed that cash transfers influenced having a third child. Leveraging
the variation in the cash transfer generosity, I estimate the elasticity of birth rates with respect to
cash incentives. I find that a 10% increase in the cash transfers raised birth rates by 0.6%, 0.4%,
and 0.4% for first, second, and third children, respectively. A back-of-the-envelope calculation
implies that, in the absence of the cash transfers ceteris paribus, the total fertility rate would have
been 3.0% lower than the observed total fertility rate in 2015, which corresponds to approximately
428,274 less children ever born by the 2015 female population.
I provide further evidence that the increase in birth rates were driven by changes in the child-
bearing decisions of parent(s) at the margin of having an additional child. I uncover two new,
important effects of these transfer programs. First, the cash transfers for a birth order affected
only the birth rate at the corresponding birth order, but not the others. For example, the elasticity
of second child birth rates with respect to the cash transfers for a second child is positive and
statistically significantly different from zero, but the elasticities with respect to the cash transfers
for a first or a third child are small in their magnitudes and statistically indistinguishable from zero.
Second, the elasticities of cash transfers were positive only among mothers between the ages of 20
and 39, active in making childbearing decisions. The pro-natalist cash transfers had no impact on
the birth rates of adolescents and females older than 40.
The cash transfers resulted in unintended consequences on neonatal health. Based on the
universe of confidential birth registry records from 2000 to 2015, I estimate statistically significant
negative effects of cash transfer on gestational age. Conditional on gestational age, the direct effect
of cash transfers on birth weight is positive and large. Birth weight increases by 9.01 grams among
2second children and 3.06 grams among third children. By matching confidential death records with
the birth registry records for the children born between 2010 and 2013, I study the longer-term
effect of the cash transfer programs on early life mortality and find no evidence that the children
born in districts where a parent(s) received different amounts of the cash transfers were more or
less likely to die before reaching the age of 1 and 5.
The cash transfers had another unintended consequence on sex at birth. These cash transfers
modulated the sex-ratio imbalance favoring boys from son preference and decreased it toward the
natural sex ratio at birth. I document an unnaturally high male-to-female ratio at birth particularly
among the third child (i.e., 121 boys for 100 girls according to the birth records from 2000 to 2015)—
apparent evidence of “missing baby girls”—from sex selective abortion and infanticide.4 The sex
ratio among third children over time, however, showed dramatic decline from a high sex-ratio
favoring boys in 2000 and reached a level consistent with the natural sex-ratio at birth (i.e., 105
boys for 100 girls). I find that the pro-natalist cash transfers decreased the probability of a third
child being a boy. The estimated elasticity implies that, in the absence of the cash transfers while
holding everything else constant at the 2015 level, the sex ratio among third children born in 2015
would have been 114.3 boys per 100 girls.
I study potential mechanisms explaining the results of this paper. I provide evidence that
the increase in birth rates was a result of more children being born by each woman, not a mere
reflection of the temporal adjustment of childbearing timing and the spatial redistribution of families
who were planning to have babies into places with more generous cash transfers. I find that the
probability that a baby has a mother who is working (employed) increases with cash-transfer
generosity. Working mothers are more likely to have time constraints and have a shorter pregnancy
duration on average relative to those who are not working. This selection explains why the cash-
transfer effect on gestational age is negative, which ultimately lowers birth weight. Furthermore,
I show that this selection does not explain why cash transfers reduced sex-ratio at birth favoring
boys: the effects of cash transfers on the sex of newborn babies are the same for working and
stay-home mothers.
This paper builds upon the existing literature in economics analyzing the effects of pro-natalist
policies on fertility.5 Lalive and Zweimüller (2009) find that the extension of parental leave in
1990 in Austria increased the probability of women having an additional child, while Andersson
and Duvander (2006) find no such effects in Sweden. There is a large literature finding small or
no effects of U.S. tax policies and welfare programs benefiting families with children on fertility
4
A plethora of papers repeatedly find that the natural sex-ratio is 105 males to 100 females: E.g., Jacobsen
et al. (1999). Furthermore, I use the 2015 Population Census where I observe family composition and compute the
probability of having a boy after 2 daughters. The implied sex ratio in this case is 180 boys to 100 girls. The sex
ratio among the third child is 105 boys to 100 girls for families with one son and one daughter and 101 boys to 100
girls for families with two sons.
5
Many policies to boost childbirth, such as cash transfers, parental leave, and tax benefits, have been proposed
and implemented around the world. The U.N. Population Division (2011) documents that 40 out of 47 countries with
low fertility had pro-natalist polices as of 2010; the majority of these countries provided cash incentives. Fleckenstein
and Lee (2012) detail pro-natalist policy changes in Britain, Germany, South Korea, and Sweden; Frejka et al. (2010)
summarize pro-natalist policies implemented in East Asia. See Gautheir (2007) for a literature review.
3decisions (Whittington et al., 1990; Whittington, 1992; Crump et al., 2011; Rosenzweig, 1999;
Kearney, 2004).6 The previous literature on cash transfer for childbearing has mainly focused on
difference-in-difference strategies and compared the fertility outcomes before and after cash transfer
implementation and a one-time change in the policy, while using unaffected regions or ineligible
families as a control group (Milligan, 2005; Boccuzzo et al., 2008; Cohen et al., 2013; Malkova,
2018).7 Hong et al. (2016) examine the same local government transfers in South Korea as in this
paper, but for a shorter period of time from 2005 to 2011, and provide suggestive evidence that the
local policies in South Korea may have increased the fertility rate.8
This paper is closely related to the large aforementioned literature studying the effects of pro-
natalist policies on the number of children. In this paper, I bring several innovations to the liter-
ature. First, my research offers a set of novel insights about pro-natalist cash transfers, thanks to
the rich variation in cash-transfer generosity as well as implementation timings over time across
space by birth order. By estimating the elasticities of birth rates to cash transfers by female age
groups and birth orders, I find that a parent(s) at the margin of having an additional child are
incentivized by the cash bonus: no inframarginal effect. Similarly, only the mothers who are in
their prime age for childbearing respond to the cash transfers.
Second, this paper contributes to the literature on son preference. Several papers document son
preference and male-skewed sex ratio at birth, especially in Asia.9 Focusing on South Korea, Choi
and Hwang (2020) show that son preference has been diminishing in recent years.10 The findings
in Yoo et al. (2016) also suggest declines in son preference, but report that a decision to have a
third child depends largely on the sex composition of first and second children. Based on a survey,
Jayachandran (2017) estimate a causal relationship between desired family size and son preference
in India. Ebenstein (2010) finds that regions with higher fines for violating the one-child policy
in China are associated with higher male-to-female ratios. Anukriti (2018) studies "Devirupak
Scheme", which provided cash transfers based on the number of children and sex composition in
India. She found that fertility fell, but son preference intensified. With fewer kids, families placed
higher value on having a son over the financial incentives associated with having girls. I document
that much of the decline in the naturally skewed male-to-female ratio since 2000 is driven by the
decline of the sex ratio among third children. I show that the pro-natalist cash transfers reduced
this ratio. To the best of my knowledge, this paper is the first to show that a pro-natalist policy
interacts with son preference and unintentionally alleviates sex ratio imbalance in a cultural context
where having sons is favored over having daughters.
Third, this paper fills the gap in the literature by exploring the broader implications of financial
6
Laroque and Salanié (2004) examine the effect of the French tax system on fertility. See Hotz et al. (1997) and
Hoynes (1997) for a broad review of earlier works on related topics.
7
Malkova (2018) uses an event study framework to estimate the effects of Russia’s 1981 expansion in maternity
benefits, which provided both maternity leave and small cash transfers, and finds that fertility rates increased.
8
There is an impressive literature on abortion, which looks at the impact of ban and legalization of abortion on
long-term outcomes of children. See Donohue and Levitt (2001) and Pop-Eleches (2006).
9
See Bongaarts (2013) for a review on son preference and fertility decisions.
10
Chung and Gupta (2007) argue the trend observed in Korea is due to the country-wide change in social norms.
4incentives for having babies. There are a few papers that study the effects of pro-natalist policies on
a wide range of outcomes, other than the number of births. For example, González (2013) employs
a regression discontinuity design and estimates the effects of the introduction of a universal child
benefit on a range of fertility, household consumption, and maternal labor supply.11 Yakovlev and
Sorvachev (2020) find that child subsidies aimed at increasing fertility in Russia indeed increased
the total fertility rates, and produced substantial general equilibrium effects on the housing market
and family stability. In contrast to these papers, I study whether the pro-natalist cash transfers
had any effects on the early life outcomes of the babies born under this policy (i.e., birth weight,
gestational age, and mortality) that are strong predictors for long-run outcomes (e.g., education
attainment, labor market performance, and crime).12 Furthermore, this paper studies the effect of
cash transfer on sex ratio at birth, which will eventually shape the market conditions in the long
run, such as the marriage market (Guilmoto, 2011).
The remainder of the paper is organized as follows. In Section 2, I provide institutional back-
ground on the pro-natalist policies in South Korea and the data sources. Section 3 describes the
empirical strategies to identify the causal effects of the pro-natalist cash transfers on birth outcomes.
Section 4 presents the results based on the district-level analysis of the number of births and the
individual-level analysis of neonatal health outcomes and sex. In Section 5, I explore potential
mechanisms explaining the main results. Section 6 concludes.
2 Background and Data
I construct a yearly panel data set of 222 districts in South Korea from 2000 to 2015 with local
information on cash transfer policies and demographic and other relevant local characteristics, and
the number of births.13 To investigate the effects of cash transfers on neonatal health outcomes,
early-life mortality and sex at birth, I merge this dataset with confidential administrative birth
registry data that span the universe of births from 2000 to 2015 and death records for the cohorts
born between 2010 and 2013. In this section, I provide background information about the local
pro-natalist cash transfer policies in South Korea, explain the data sources and measurements, and
investigate the determinants of the policy implementation timing and cash-transfer generosity.
11
Lalive and Zweimüller (2009) find that extended parental leave increases the probability of having an additional
child and reduce return to work.
12
There exists a large literature establishing the causal links between neonatal/childhood health factors and later
outcomes (Behrman and Rosenzweig, 2004; Almond et al., 2005; Black et al., 2007; Oreopoulos et al., 2008; McCrary
and Royer, 2011; Case et al., 2002). Many works have estimated the effects of family characteristics (e.g., parental
education, incarceration, income, and family structure) on a range of child’s outcomes (Black et al., 2005; McCrary
and Royer, 2011; Oreopoulos et al., 2008; Milligan and Stabile, 2011; Aizer and Doyle, 2015).
13
During the sample period, some districts were merged or split. Because the policy information for these districts
no longer exists, I restrict the sample to 222 districts that did not undergo redistricting and construct a balanced
panel of districts. These districts belong to 15 cities (i.e., metropolitan cities and provinces). The final sample
represents over 95% of the South Korean population.
52.1 Background
Before the 1960s, South Korea had a high fertility rate of above six children per woman. How-
ever, after pursuing one of the most fervent and successful family planning policies for over 20
years, the fertility rates have stayed below the 2.1 replacement level since 1983 (Lee and Choi,
2015). Fertility continued to decline until 2005 when the total fertility rates reached a historic
low of 1.05 children per woman. In response to growing concerns about low fertility rates and
the rapidly aging population, the national government in South Korea established the First Basic
Plans for Low Fertility and Aged Society in 2006, followed by a series of revised plans after 5 years
thereafter. It is important to note that the Plans only outlined normative goals and operate at the
national level. In line with the administrative arrangements of the national and local governments
(Local Autonomy Act, 1990), national government policies on welfare, generally speaking, operate
at the macro-level and may not vary across districts and cities.14 Therefore, it is reasonable to
assume national welfare policies indiscriminately influence districts uniformly.
As early as 2001, local governments adopted a pro-natalist cash transfer policy independently
from the national government, which provided cash transfers to families with newborn babies.
Since 2012, this policy has been adopted by all the districts and become ubiquitous. While the
structure of this policy (e.g., eligibility and transfer method) are virtually identical across districts,
the amount of cash transfers varies widely by districts and birth order. Because these transfers
are local policies, local governments finance them using their budget, which is the sum of local
income tax revenue and intergovernmental transfers from the national government.15 To receive
cash transfers from the local government, the parent(s) of a newborn baby simply register their
baby’s birth at a civic center in their respective district of residence. During the process of birth
registry, local government officials verify the parent(s)’ residence using their resident registration
numbers (e.g., analogous to social security number in the U.S.).16
[Figure 1]
Figure 1 summarizes the local pro-natalist cash transfer policy, the total fertility rates, and male-
to-female sex ratio at birth. The top panel plots the number of newborn babies over time (dashed
line) and the average amount of cash transfers conditional on having adopted the policy (solid
line) for districts providing cash transfers to families. In the center and bottom panel, average
total fertility rates, the male-to-female ratios at birth (solid lines) and cash-transfer prevalence
(dash line; as in the top panel) are plotted over time. As districts increasingly enacted this policy,
national fertility trends appeared to steadily reversed. During the same period, the sex ratio at
14
The Plans of the national government “set abstract goals and directions, [and] did not specify guidelines for
local policy formulations (Kim, 2013).
15
The income tax rates in South Korea are nationally determined and do not vary by district. Intergovernmental
transfers are determined following a set of complex formula in accordance with the national law. See Kim (2020).
16
Government officials often check the length of residency to prevent people from “gaming” the policy. Similarly,
local governments can rescind the cash transfers if they identify fraudulent cases. However, these measures are
precautionary and local governments attest that they rarely witness such instances, especially given establishing
residency in a new district is not trivial.
6birth declined to the natural sex ratio at birth of 1.05.17 Figure 1 suggests that the local cash
transfers may be responsible for reversing the declining fertility rate and lowering the male-favored
sex ratio at birth. In order to identify the causal effects of these cash transfers on a range of birth
outcomes, I construct a panel dataset of districts with local policy, demographic, and governmental
characteristics whereby I merge restricted-access confidential birth and death registry records with
the district level information.
2.2 Data
District-Level Variables: Cash Transfers and Birth Rates
The district-level data set comprises of three key components. The first component pertains
to variables pertaining to the local cash transfer policies. I filed an Official Information Disclosure
Act request to each district to disclose information on the amount awarded to parents for their
first, second, and third child, as stipulated by the cash transfer policy in each district.18 Based
on responses by officials and cross-validation using alternative sources (e.g., administrative policy
reports, online repository of local ordinances, and regulations and telephone survey), I build a
yearly panel data set of districts from 2000 to 2015 with the amounts of pro-natalist cash transfers
at each respective birth order.
[Table 1]
Panel A of Table 1 provides the summary statistics of cash transfers by birth order for selected
years. The proportion of districts providing the pro-natalist cash transfers increased over time,
reaching 41%, 89%, and 100% for a first, second, and third child, respectively. Panel A also reports
the means and standard deviations of cash transfer amounts in 1,000,000 KRW or approx. 1,000
USD for districts with strictly positive cash transfers amounts (i.e., excluding zero). They show rich
variation in cash transfer generosity over time (columns), across space (standard deviations), and
by birth order (rows). In particular, changes in cash transfer generosity over time can be explained
both by more districts adopting the policy with higher transfer amounts and that those already
already executing the policy increased generosity.
The second set of variables relate to the number of births in each district. The Korean Statistical
Information Service (KOSIS)–an official government online portal–publishes annual district-level
total fertility rates and the number of births for each birth order (first, second, third). To understand
17
As mentioned earlier, the total fertility rates before 2000 had been monotonically decreasing. Prior to 2000, the
sex ratios had been relatively stable at around 1.1 boys for each girl since 1996.
18
There are several other papers that have collected the same set of information independently of this paper (Kim,
2013; Hong et al., 2016) from an online repository of local ordinances and regulations operated by the Ministry of
the Interior of South Korea (www.glis.go.kr) and telephone surveys. The Ministry of Health and Welfare of South
Korea has published the Annual Case Study of Local Government Population Policies since 2008. I further verify
the accuracy of the official information I received from each district government by comparing it to these alternative
sources and confirmed any discrepancies with individual government officials in charge of the local pro-natalist cash
transfers through a telephone survey. This paper focuses on birth parities from first to third as they together constitute
over 98.9% of the total births in South Korea during the sample period. Similarly, in most cases, the amount of the
cash transfer awarded to families remains the same after a third child.
7how the effects of cash transfers differ across female age groups, I need to know how many children
were born by birth order in each female age group. Such detailed information is not publicly
available. Therefore, I use a restricted access confidential birth registry record data housed at the
Bureau of Statistics of South Korea. Since the data spans the universe of births registered in Korea
from 2000 to 2015, I count and export the number of births by birth order and mother’s age group
(5-year intervals from 15 to 49) in each district and year. Together with the female population
data from the resident registration database maintained by the Ministry of Interior and Safety, I
construct birth rates specific to the birth order both for the entire female population and for each
age group.
Following the convention in demography, birth rates for order p in district d in year y BRp,d,y
is defined as follows:
N Bp,d,y
BRp,d,y = × 1000,
f popd,y
where N Bp,d,y equals the number of p-th order child born in district d in year y; f popd,y is the
female population of ages between 15 and 49 living in d in year y. Likewise, I define age-specific
birth rates BRa,p,d,y as
N Ba,p,d,y
BRa,p,d,y = × 1000,
f popa,d,y
where N Ba,p,d,y equals the number of p-th order child born in district d in year y by mothers whose
age falls in age group a (5-year intervals from 15 to 49); f popa,d,y is the female population in age
group a living in d in year y. Note that total fertility rate T F Rd,y can be expressed as a function
of the age- and order- specific birth rates. That is,
X 5
T F Rd,y = BRa,p,d,y × .
a,p
1000
Panel B of Table 1 reports the means and standard deviations of the total fertility rates and the
order-specific birth rates computed across districts for selected years.
Lastly, I supplement the data set with district-level characteristics from various administrative
data sources: KOSIS, Finance Integrated System, and the National Election Commission of South
Korea. These variables are used in two ways. First, I investigate the determinants of pro-natalist
cash transfer policy adoption and generosity. Second, throughout my analysis, I include these
observables to control for local demographics and government characteristics.
The demographic characteristics I include total population level, fraction of female population,
proportion of adult population (between the ages of 25 and 60), marriage rate, and net migration
rates (i.e. net inflows per 1,000 people). Government characteristics include the gender of the local
government head and the financial independence rate, which measures how fiscally autonomous a
local government is in the absence of intergovernmental transfers from the national government.
8Individual-Level Records: Birth Outcomes and Early-life Mortality
I use restricted-access confidential birth registry records, spanning the universe of births regis-
tered in South Korea from 2000 to 2015, to study the effects of pro-natalist cash transfers on neona-
tal outcomes including birth weight measured in kilograms, gestational age measured in weeks, and
sex. Each administrative record includes detailed demographic information on the newborn baby
(e.g., date and place of birth and birth order) and the parent(s) (e.g., age, marital status, educa-
tional attainment level, and occupation).19 The total sample size is 7,081,285 births. Table A.1
reports the average birth weight, gestational age, and fraction of male births by birth order for
selected years.
For the cohorts born between 2010 and 2013, their birth records are matched with death records
should they have died before reaching the age of 5. The sample size for this subset of the data
is 1,711,949 births. Based on these birth-death matched data, I define two indicator variables
measuring early life mortality: one equal to one if the baby died before reaching the age of 1 (infant
mortality); the other equal to one if the baby died before the age of 5 (under-five mortality). On
average, about 1.7 and 2.3 children per 1,000 births born between 2010 and 2013 died before their
first and fifth birthdays, respectively. These values are considered low among developed countries.
2.3 Determinants of Policy Implementation Timing and Generosity
To estimate the causal effects of these pro-natalist cash transfers, I exploit the temporal and
cross-sectional variation arising from local governments decisions to adopt the policies and change
the cash transfer generosity thereafter. These decisions are hardly random. Local governing heads
and district council members, who are locally elected, are responsible for designing and executing
district-level policies. In this section, I formally investigate the determinants of policy implemen-
tation timing and generosity.
First, I employ an accelerated failure time framework to understand the local factors that
determined how long it took for a district to adopt the pro-natalist cash transfer policy for some
baseline years. Following a standard approach in the survival analysis literature, I assume that
the duration of how long it takes a district to adopt the pro-natalist cash transfer Tτ since any
baseline year τ has a Weibull distribution with shape parameter ρ > 0 (without loss of generality,
assume scale parameter κ = 1 for simplicity). I derive the hazard function λ(Td,τ |Xd,τ ), which
captures the instantaneous probability that a district adopts the pro-natalist cash transfer policy
Tτ > 0 years since a baseline year τ as a function of baseline local characteristics Xd,τ and a log-
normally distributed stochastic error term τ . After applying some algebraic operations, I obtain
the following equation:
ln Td,τ = αXd,τ + d,τ . (1)
19
While the records span the universe of births and includes a rich set of family characteristics, they do not include
personal identifiers of parents, so which babies share the same parent(s) cannot be identified.
9This equation corresponds to an accelerated failure time model. The interpretation of the equation
itself and the coefficients is intuitive. Eq. 1 sheds light on which variables explain how long it took
for districts to implement the pro-natalist cash transfers: e.g., did districts with lower fertility rates
adopt the policy early? In addition to the observed district characteristics, city fixed effects are
introduced to purge out the effects of city-wide economic shocks and market conditions that affect
the districts within each city uniformly.
[Table 2]
Table 2 summarizes the results estimating Eq. 1. The baseline year changes from 2000 to 2006
and the number of observations decrease across columns as some districts started adopting the
cash transfer program. Most of the observed demographic characteristics (e.g., population, total
fertility rates, fraction of female population, fraction of elderly population, and net migration rate)
do not explain the timing of policy adoption. In particular, all of the estimated effects of the total
fertility rates are statistically not different from zero and the sign of the estimates flips depending
on the baseline years. While none of estimates are statistically significant, the estimated coefficients
for marriage rate are consistently negative, which implies that districts with more newly married
couples adopted policies earlier, conditional on population size and age composition. Districts
with a higher fraction of adults in the population, while holding the proportion of the elderly
constant, tended to have a longer duration of time preceding adoption of the cash transfers. These
districts may have been less concerned about the declining fertility rates because a greater number
of the population had the potentials for childbearing. Districts with conservative local governing
heads implemented the policy later. The estimated coefficients for financial independence rate are
consistently negative and statistically significantly different from zero across columns. Holding
everything else constant, as the financial independence of a local government increases, it is more
likely to adopt a pro-natalist cash transfer policy early.
Second, I investigate the extent to which local characteristics explain the generosity of cash
transfers. I estimate a straightforward specification as follows:
sinh−1 CTp,d,y = φd + ψc(d),y + πXd,y + d,y , (2)
where the dependent variable sinh−1 CTp,d,y is the inverse hyperbolic sine transformation of the
cash transfer amounts provided to families with a new baby of birth order p in district d in year
y.20 District fixed effects φd capture all time-invariant local characteristics. City-by-year fixed
effects ψc(d),y capture time-variant city-level determinants of the cash transfer generosity (e.g., labor
market conditions, which in turns affect local government budget); Xd,y includes the demographic
and local government characteristics of district d observed in year y.
[Table 3]
20
The inverse hyperbolic sine transformation approximates the natural logarithm of the cash transfer amounts
and allows retaining observations with zero values (e.g., districts prior to the policy implementation).
10Table 3 summarizes the results estimating Eq. 2 by birth order p. For each birth order,
the first column includes all years and districts. The results are driven by both the extensive
margin of policy adoption and the intensive margin of policy generosity changes over time. The
second column excludes district-year observations with zero cash transfers (mostly prior to policy
adoptions). Under this sample restriction, I can focus on the intensive margin of cash transfers and
study their determinants. When looking at both intensive and extensive margins together (Column
1, 3, and 5), the results indicate that the across birth orders, the cash transfer amounts were lower
in districts with a higher fraction of females and adults in the population. In contrast, all of the
respective estimates in the other columns, which exclude zeros, lose their statistical significance.
While each estimate individually may not explain the variation in cash transfers, joint hypothesis
testings indicate that these factors may be jointly correlated with the observed policy variation.21
These local characteristics (e.g., fraction of female population, age composition, and cultural norm
proxied by party identification of the local leaders) are likely to be correlated with birth outcomes.
Thus, I control for these factors and include the district fixed effects and the city-by-year fixed
effects throughout the rest of my analysis.
3 Empirical Strategy
In this section, I present the empirical strategies to identify the effects of pro-natalist cash
transfers on the number of births using the district-level dataset and on neonatal health and sex
using the individual-level confidential registry records. I leverage the temporal and cross-sectional
variation in cash transfers and introduce a rich set of fixed effects and control variables to purge
out key confounding forces.
3.1 District-Level Analysis: Number of Births
Based on different implementation timing for each district, I conduct an event study and semi-
parametrically estimate the pro-natalist policy effects before and after based on the specification
as follows:
7
(τ )
X
ln BRp,d,y = φd + ψc(d),y + δXd,y + γp(τ ) Dp,d,y + p,d,y , (3)
τ =−7
where dependent variable ln BRp,d,y is the log of birth rates for birth order p in district d in year
y. District fixed effects φd capture all time invariant district-level determinants of birth rates (e.g.,
local cultural norm). City-by-year fixed effects ψc(d),y flexibly capture the year-to-year changes in
the city-level shocks as well as the national-level shocks that are correlated with birth rates and
local policies (e.g., local labor and housing market conditions). Xd,y is a set of district-level time
21
For each specification, I test the joint significance of all the covariates and report the p-values. I reject the null
hypothesis that all the coefficients are zero at the 1% significance across birth orders. However, I cannot reject the
null when excluding zero cash transfer cases.
11n o7
(τ )
varying characteristics.22 Dp,d,y is a set of dummy variables indicating whether or not the
τ =−7
number of years since district d implemented the cash transfer policy for birth order p is equal to
τ in year y.23 p,d,y is an error term.
(τ ) 7
n o
Event study coefficients γp measure the percent change in birth rates for p-th birth
τ =−7
order τ years before and after the adoption of the cash transfer policy for the corresponding birth
order relative to the leave-out year. Birth rates count babies born during each calendar year. This
means that the babies born in the year when the district first adopted the cash transfers (i.e.,
τ = 0) would have been affected by the policy. Therefore, I set the leave-out year to be τ = −1
(−1)
and equivalently restrict γp = 0. Based on the estimated event study coefficients, I investigate
whether there was a trend prior to the policy implementation and how birth rates change following
implementation.
Next, I exploit the rich variation in cash transfer generosity to estimate the elasticity of birth
rates with respect to cash incentives. Instead of taking the log transformation of the cash transfer
generosity to estimate elasticities, I take the inverse hyperbolic sine transformation sinh−1 CTp,d,y .
By preventing dropping observations where the cash transfer amount equals to zero, this formulation
allows me to estimate the coefficient of interest using the full history of birth rates I observe in the
dataset. I estimate the following equation:
ln BRp,d,y = φd + ψc(d),y + δXd,y + βp sinh−1 CTp,d,y + p,d,y , (4)
where φd and ψc(d),y are the same set of district fixed effects and city-by-year fixed effects as in Eq.
3. Similarly, I introduce the same time-varying district-level characteristics as control variables.
Elasticity βp measures the percent change in the birth rate of birth order p with respect to a 1%
increase in pro-natalist cash transfer generosity for the corresponding birth order.
The identification assumption is that, absent pro-natalist cash transfers, birth rates vary across
districts within a city in a given year for reasons that are uncorrelated with the pro-natalist cash
transfers. That is,
E CTp,d,y × p,d,y |φd , ψc(d),y , Xd,y = 0. (5)
I argue that this identification assumption (Eq. 5) is likely to hold in my analysis. The district-level
fixed effects purge out any permanent local factors that determine cash transfers and birth rates.
22
These covariates include local demographics and government characteristics. They are the same set of variables
used to study the determinants of the implementation timing (excluding total fertility rates) and generosity. In
addition, I include a set of lag number of births of birth order p0 < p when estimating the cash transfer effect on
the birth rates of birth order p. For instance, the lag number of births for the first birth order is included when
the birth rates of second child are the dependent variable. These additional variables together with the fraction of
female population, proxy the number of families and parents who may potentially benefit from the pro-natalist cash
transfers. As a result, the total observation is equal to 15 years from 2001 to 2015 times 222 districts, which is equal
to 3,330.
23
Some observations for districts that adopted their policies relatively later may be more than 7 years before the
(−7) (7)
policy adoption. I group all of these cases as τ = −7. This means Dpdy is an indicator for τ ≤ −7. Similarly, Dpdy
is an indicator for τ ≥ −7.
12Furthermore, as studied in Section 2, the observed time-varying local characteristics and rich set
of fixed effects explain about 78 to 85 percent of the variation in cash transfers.
For example, districts with a relatively higher adult population, conditional on the total popula-
tion, are more likely to have newly wedded couples who are active in childbearing decisions. At the
same time, a higher fraction of adult population (net of the elderly population) implies a larger tax
base that allows for bigger budgets, which in turn are used to finance pro-natalist cash transfers.
Therefore, omitting the proportion of adults in the population would overestimate the cash transfer
effect on birth rates. The same is true for omitting marriage rates and factors related to local gov-
ernment budget. Lastly, districts are geographically granular and local labor and housing markets
are usually defined in terms of a city (or a group of cities). The city-by-year fixed effects absorbs
shocks to these local market conditions, which would affect both people’s childbearing decision and
local government’s capacity to operate pro-natalist cash transfers.
Throughout the district-level observations, each observation is weighted using the number of
women in the population between the ages of 15 and 49. There are two ways the errors are
correlated. First, the errors may be correlated within geographical groupings, which correspond to
cities in this case, for each year (Moulton, 1990). Second, there is a concern regarding the serial
correlation within a panel dimension, as explained in Bertrand et al. (2004). Therefore, standard
errors are two-way clustered by district and city-year pair.
3.2 Individual-Level Analysis: Neonatal Health and Sex
In addition to the number of births, I investigate whether the pro-natalist cash transfers had
any effects on neonatal health and sex of infants, which are important determinants of long term
individual outcomes (e.g., labor market performance and marriage market conditions). The sign
of these effects are theoretically ambiguous. For instance, the cash transfers may adversely affect
neonatal health if cash transfers resulted in less investment per child due to increased number of
births. They may improve neonatal health as cash transfers serve as an additional resources to
take better care of new babies. With respect to the sex of a child, while on a downward trajectory,
the son preference in South Korea still remains strong.24 On the one hand, the cash transfers may
provide financial means to parents as they continue to have babies until they have at least one
boy or simply more boys. On the other hand, cash transfers may compensate the utility penalty
associated with having girls.
To estimate the cash transfer effects on neonatal health and sex, I use individual records of the
universe of births in South Korea and estimate
Hi = φd + ψc(d),y,m + β sinh−1 CTp,d,y + ωWi + δXd,y + i , (6)
24
The extent to which sex ratio deviates from its natural level of 105 is especially pronounced among families when
they first had daughters as opposed to sons. According the 2015 Population Census, which covers about 20% of the
population, the sex ratio is 181 boys for 100 girls among third children when their older siblings are both girls. This
number drops to 101 boys for 100 girls if their older siblings are both boys.
13where dependent variable Hi is a measure of neonatal health and sex (e.g., birth weight, gestational
age, indicator for boy) of baby i of birth order p born in district d in year-month m. District fixed
effects φd capture all the permanent local factors. City-by-month fixed effects ψc(d),m flexibly
control for the month-to-month citywide shocks that affect birth outcomes.25 In addition to the
same set of control variables Xd,y(m) as in Eq. 4, I leverage the parental information reported on
each record and include a set of individual-level controls Wi including indicators for child’s birth
order and parental educational attainment (no schooling, elementary school, middle school, high
school and some college or above), age, marital status, and occupation. i is an error term.
The source of identifying variation remains virtually the same as in the district-level analysis:
time-series variation in cash transfer amounts within each district and the spatial variation across
districts within each city-month pair. The identification assumption is expressed as follows:
E CTp,d,y(m) × i |φd , ψc(d),m , Xd,y(m) , Wi = 0. (7)
The use of registry records in my analysis is particularly advantageous to justifying the identification
assumption described above (Eq. 7). The outcomes of interest are birth weight and gestational age,
which heavily depend on parental characteristics and inputs during pregnancy. The large number
of observations and the rich parental information allow me to flexibly account for the effects of
parental characteristics without assuming a constant marginal effect for each of these observed
factors.
While the data used in the individual-level analysis correspond to individual births (thus not
panel), there is still a clear panel structure defined in terms of geography (districts and cities) and
time (birth dates, months, and years). In terms of statistical inference, I cluster standard errors by
districts and city-month pairs in the spirit of Moulton (1990) and Bertrand et al. (2004). Statistical
inference results are robust to alternative clustering options.
4 Results
In this section, I present my estimation results in two parts. In the first part, I discuss the
district-level analysis investigating the effects of the pro-natalist cash transfers on birth rates. The
second part presents the estimation results on the effects of the cash transfers on neonatal health
outcomes and sex of children based on the confidential birth registry records spanning the universe
of births in South Korea.
25
Rich individual records provide me with enough power to introduce the month-by-city fixed effects. Furthermore,
being able to do so is important due to seasonality in birth weight and pregnancy duration (Darrow et al., 2009;
Bodnar and Simhan, 2008; Boland et al., 2015).
144.1 District-Level Analysis: Birth Rates
Event Study Results
I begin by presenting the event study results. For each birth order p = 1, 2, and 3, I estimate Eq.
(τ ) 7
n o
3 and Figure 2 plot the estimated event study coefficients γp . In the top panel, the changes
τ =−7
in birth rates of first child relative to the birth rates 1 year prior to policy implementation are plotted
along with the 95% confidence intervals. Prior to the policy implementation (τ < 0), none of the
estimated coefficients are statistically different from zero at the 5% significance level. The birth
rates of the first child stayed relatively constant until the policy implementation. However, the
birth rates started to gradually increase since the cash transfers for first child were implemented;
all of the event study coefficients post implementation are positive and, except for the year of
implementation, statistically different from zero. On average, the birth rates for the first child
increased by approximately 8.0%.26
[Figure 2]
The middle panel and bottom panel of Figure 2 plot the event study coefficients for the second
and third birth orders, respectively. The birth rates for the second child were decreasing prior
to when the cash transfers were provided. While only a few estimates are statistically different
from zero, this downward trend appears to be salient. Upon the policy implementation, the trend
reversed and biirth rates started increasing. Relative to the birth rates one year prior to the
policy implementation, the birth rates for 2nd child increase by 2.5%.27 None of the event study
coefficients for years before the policy implementation, shown in the bottom panel, are statistically
different from zero. Thus, I conclude that the third child birth rates showed no pre-trend prior to
when districts started to offer cash transfers. Thereafter, birth rates increased starting in the year
of policy implementation and continue to increase over time. The average increase in the birth
rates post-implementation is about 5.5%.28
The event study results above provide evidence that birth rates across birth orders increased
after districts started offering cash transfers conditional on child births. The increase in the birth
rate for the first child implies not only a greater number of births of that corresponding birth order,
but also an increase in the number of mothers who would benefit from cash transfers provided for
the second child. Similarly, the reversal in the downward trend in the birth rates for the second
children implies that proving the cash transfers to families having a second child increased the
number of families with two children, who in turn became potential beneficiaries of cash transfers
for the third child. It is important to note that the estimated coefficients across birth orders tend
26
This estimate corresponds to the average of the event study coefficients post-implementation (τ ≥ 0). The
dashed horizontal lines from 0 to 7 are the lower and upper bounds of the 95% confidence interval.
27
If the downward trend is taken into account, the magnitude of the increase in birth rates would be larger.
28
The estimated pre-trends show that the decline in the fertility rates observed in the beginning of the 21st century
is driven by the decline in second child births, not those of first and third. In Appendix, Figure A.1 and A.2 plot
event study coefficients estimated without any fixed effects and controls and only with fixed effects, respectively.
Overall, these figures show the importance of accounting for city-wide economic shocks and permanent local factors
to identify the event study coefficients.
15to increase likely from increases in cash transfer generosities over time within districts after their
policy adoptions. While the average increase in birth rates were largest for the first child, followed
by the third, the per dollar increase in birth rates decrease monotonically if the average cash transfer
amount of each birth order are taken into account (i.e., $577 for first child, $843 for second child,
and $2,042 for third child).
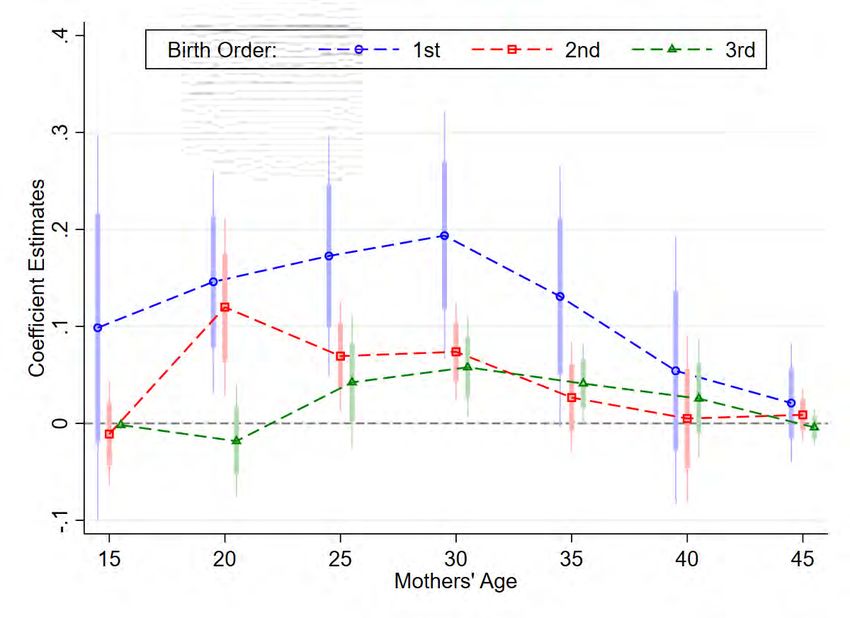
[Figure 3]
Next, further decomposing the birth rates into age-specific birth rates, I estimate the changes in
birth rates before and after the policy implementations for different age groups of mothers. Figure
3 plots the event study coefficients estimated for each birth order (separated by columns) and each
age group of mothers (5 year intervals). First, I focus on age groups of mothers that are prime for
childbearing, between the ages of 25 to 39, and more likely to be actively making fertility decisions.
First child birth rates increased among relatively younger female population between the ages of
25 and 34. Second child birth rates, among mothers between the ages of 30 and 34 increased, while
birth rates among younger (25-29) and older (35-39) mothers stayed relatively constant before and
after the policy implementation. Lastly, third child birth rates among mothers between the ages of
35 and 39 increased after the policy implementations.29
Based on the event study estimation results discussed above, I conclude that the pro-natalist
cash transfers increased the birth rates across birth orders. However, these increases do not arise
uniformly across age groups of mothers. The cash transfers for a specific birth order increased the
birth rates of that birth order among the mothers most likely at the margin of having babies of
the corresponding birth order. Furthermore, Figure A.3 shows that the birth rates among mothers
between the ages of 15 and 19 and between the ages of 45 and 49 did not change before and
after policy implementation across birth orders. The event study results above are estimated using
the variation in policy implementation timing; therefore, they do not take into account the fact
that these cash transfers varied widely across districts over time in terms of generosity (i.e., how
much cash transfers were provided). In the next section, I leverage the variation in cash transfer
generosity in addition to policy implementation timing and estimate the elasticities of birth rates
with respect to cash transfer generosity.
Elasticity of Birth Rates to Cash Transfers
I report the results estimating Eq. 4 for each birth order in Table 4.30 Because the dependent
variables are measured in log units and I take the inverse hyperbolic sine transformation, the
estimated coefficients approximate the elasticities of birth rates with respect to cash transfers. In
29
While the estimated coefficients prior to policy implementation are upward trending, none of these estimates are
significantly different from zero at the 5% significance level. Third child birth rates among younger mothers had been
decreasing prior to the policy implementation and continued to decrease after a statistically insignificant increase
immediately after policy implementation.
30
In Appendix, I report the results estimating a naive specification without any fixed effects and controls and
gradually add the fixed effects and control variables in Table A.2.
16You can also read