Long Term Passenger Rolling Stock Strategy for the Rail Industry - February 2014
←
→
Page content transcription
If your browser does not render page correctly, please read the page content below
Long Term Passenger Rolling Stock
  Strategy for the Rail Industry
           February 2014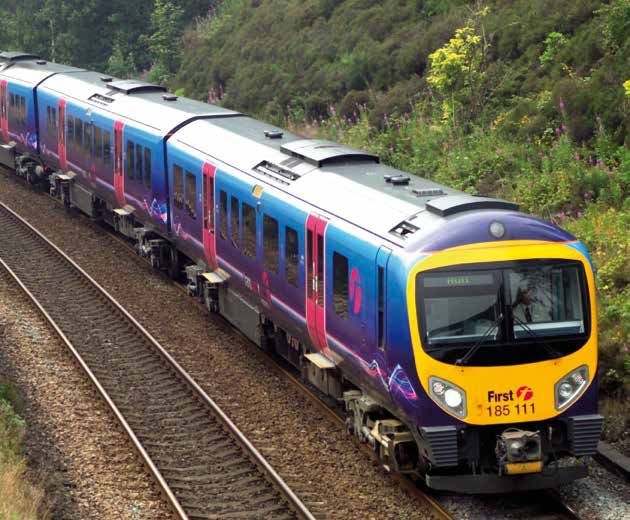
This Long Term Passenger Rolling Stock Strategy has been
produced by a Steering Group chaired by Richard Brown,
and comprising senior representatives of:
• Angel Trains
• ATOC Engineering Council
• Eversholt Rail Group
• Network Rail
• Porterbrook Leasing
• Rail Delivery Group Executive Team
• Train Operating Company Owner Groups
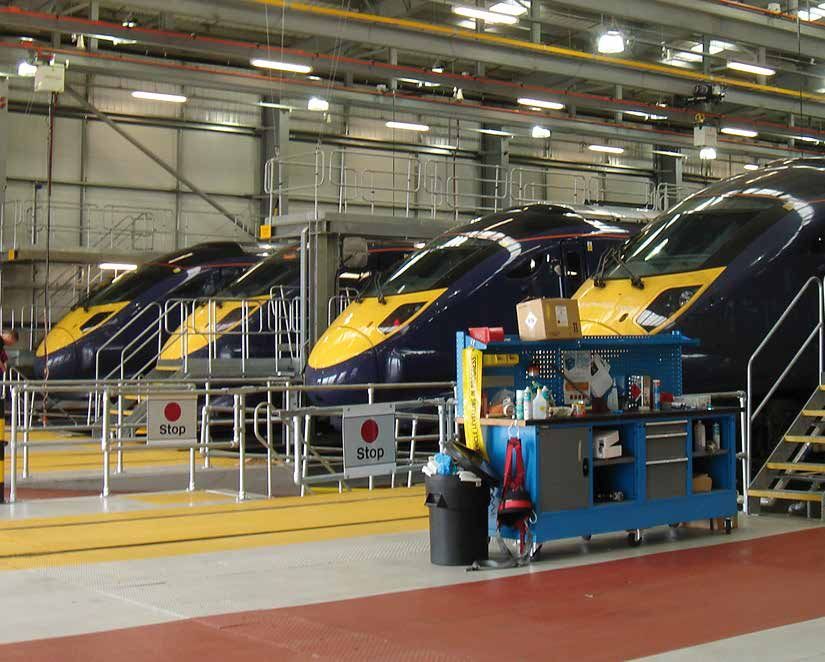
Evolution of Type D and E EMU design and development: A BR-procured Merseyrail class 508 of 1979;
an Alstom SWT class 458/5 ‘Juniper’ of 1998, recently re-configured from 4-car to 5-car length; and a
Siemens class 700 ‘Desiro City’ to be introduced on the Thameslink routes from 2015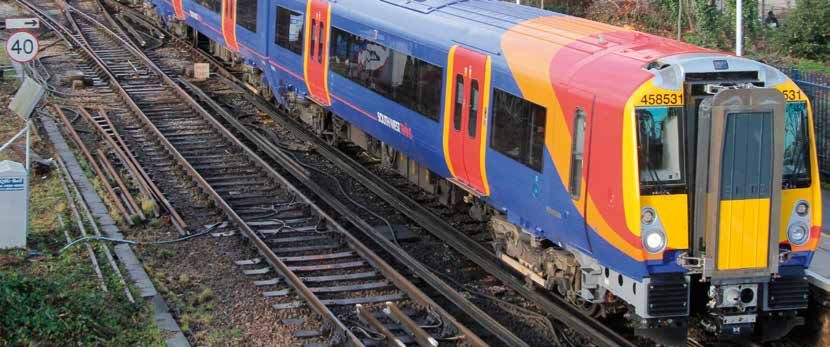
Foreword by Stephen Hammond MP, Parliamentary Under Secretary of State
for Transport

I would like to thank the rail industry for developing this second Long Term Passenger Rolling Stock
Strategy, which highlights possible future rolling stock requirements. Our railways are a success story
with increasing levels of passenger demand. To meet that demand we are investing record amounts
into transforming our railways, including £12 billion to electrify and upgrade the network and a
further £5 billion for new rolling stock on the Great Western, East Coast, Thameslink, Crossrail and
other routes.

This strategy will help industry partners understand the long term implications of these investments.
It has already been warmly welcomed by train builders and their suppliers, and will provide a
valuable resource for the recently established Rail Supply Group.

The new generation of rolling stock, when delivered, will allow the existing stock to be made
available to train operators, which will lead to more choice about how they resource their train
services than at any time in the last 20 years. In addition to this, we are overhauling our franchising
process and have published a long term franchising schedule. In assessing new franchise bids we are
giving greater credit to committed quality enhancements offered by bidders and will actively seek
market recommendations on new rolling stock and refurbishments. We recognise that a successful
franchising programme is essential for the delivery of the rolling stock strategy, and will ensure value
for money for passengers and taxpayers.

The strategy is right to note the pressures faced by the Department for Transport regarding railway
operating costs, including subsidies and grants paid to train operating companies and Network Rail.
However, I am confident that with continued strong partnership working between the Department
and industry we can meet these challenges and ensure that our massive programme of rail
improvements remains on course.

Stephen Hammond MP
Contents
   This report is structured as follows:

                        1    Executive Summary

                        2    A. Introduction - Goals and Scope

                        4    B. Impact of Changes to the Franchising Programme

                        5    C. The Approach Adopted for the Strategy

                        7    D. Planning for Growth - Sources of the Assumptions Adopted

                        9    E. Electrification – Prioritisation and Analysis

                      11     F. The Present Fleets and Future Capability Requirements

                      14     G. Fleet Sizes and Compositions Calculated for each Scenario

                      18     H. Rolling Stock Requirements in the Next Ten Years

                      20     I. Standardisation Issues

                      22     J. Depot and Infrastructure Requirements

                      25     K. Improving Value for Money from the Rolling Stock Fleets

                      28     L. Conclusions

                      32     Appendices (Timelines)

                      35     Glossary

A BR-procured Northern Rail Type A class 144 ‘Pacer’ DMU of 1986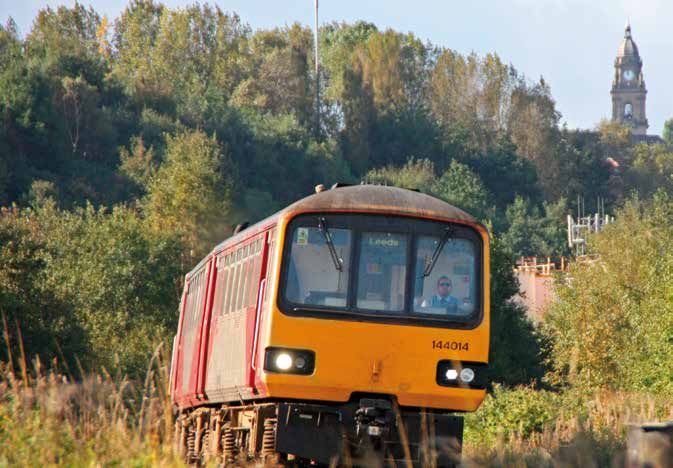
Executive Summary

This report updates the Long Term Passenger Rolling Stock Strategy (RSS), first published in February
2013. Like its predecessor it sets out a range of forecasts for the likely size and mix of the national
rolling stock fleet to accommodate future passenger numbers over a 30-year timeframe. It assumes
Government’s commitment in principle to continue to invest in expanding, enhancing and electrifying
the national railway network. Around £12 billion is being invested in such enhancements in the five
years to April 2019 (Control Period 5 (CP5)). The RSS is firmly linked into the rail industry’s Long Term
Planning Process, and has been welcomed by train builders, rolling stock owners and their suppliers.

Government policy is that rolling stock procurement should, other than in exceptional cases, be
franchise-led and the RSS fully supports this principle. The re-shaping of the franchising programme
in March 2013 has offered the opportunity to put this approach into action, but in the short term
this has been affected by the need to let short contracts to some existing franchisees, and by
limitations on DfT’s operating expenditure budget. Against this background, the analysis undertaken
for the February 2013 RSS has been reviewed and rolled forward. The long term conclusions are
largely unchanged, being demand-led. Passenger growth across all market segments continues
and it is necessary to expand the rolling stock fleet to address crowding. It is important that short
term factors do not adversely affect long term value for money. A constructive dialogue has been
established with Government on these issues.

The total passenger fleet is forecast to grow by between 53% and 99% over the next 30 years, and
the proportion that will use electric traction is forecast to rise from 69% today to over 90% in all
scenarios. These scenarios indicate that between 13,000 and 19,000 new electric vehicles will be
required over this period. Electrification will in many cases permit longer trains, and will enable
diesel trains to be transferred to non-electrified routes, where growth has been constrained by lack
of sufficient vehicles. These changes will produce significant benefits for the national economy, local
communities and the environment.

The updated analysis has given greater focus to fleet requirements in the next five to ten years. The
central forecast of the RSS indicates that around 3,050 new electric vehicles (for England, Wales and
Scotland, including TfL’s rail concessions) will be delivered in CP5, over 80% of which have already
been ordered. This includes around 2,250 for three major projects – the new intercity Super Express
trains, and the trains for the Thameslink and the Crossrail projects - which are being procured by the
public sector. The forecast of 3,050 new vehicles represents a capital cost of more than £5 billion,
and requires an average build rate of 12 vehicles per week. This compares with an average of just
four vehicles per week in the current five years to April 2014 (CP4).

The total net increase in fleet size is forecast to be lower in CP6 (2019 to 2024) than in CP5, following
completion of the major projects listed above. Britain’s rail industry and its suppliers have several
times experienced large fluctuations of demand for new vehicles, and it is important that this is
avoided so far as possible in future if the confidence of investors and the supply chain is to be
increased. This would be helped by early Government commitment to a specific programme of
electrification in CP6. Life extension of existing vehicles will be a major feature of both CP5 and CP6.

The modelling of scenarios for electrification and growth produces a reduction in rolling stock unit
costs of more than 30% in all scenarios. The Rail Delivery Group (RDG) is assessing the potential for
additional short-term savings that can be achieved in CP5. The RSS also contains new information
relating to standardisation and to depot requirements, and high level timeline charts showing
the linkages between infrastructure enhancements, rolling stock requirements, and franchising
timescales.

                                                                                                            1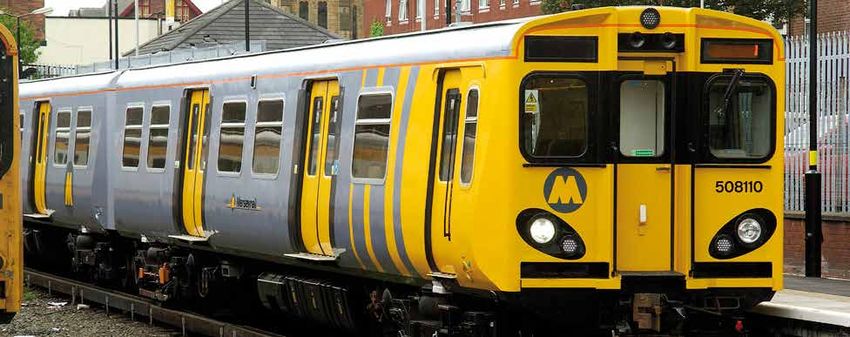
A. Introduction – Goals and Scope
1.   This report updates the Long Term Passenger Rolling Stock Strategy (RSS), first published in
     February 2013. The earlier document marked the first time since privatisation that the industry
     had committed to develop a collaborative, industry-led strategy for passenger rolling stock. It
     was also the first time that the long term rolling stock implications of growth, electrification,
     HS2 and other major projects had been modelled and considered together. The work was and
     is being led by a Steering Group (RSSSG) comprising senior representatives of Train Operating
     Company (TOC) Owner Groups, Network Rail and the three principal rolling stock owners
     (ROSCOs), all of whom jointly have funded the work, together with members of the recently-
     created RDG executive team. RSSSG is chaired by Richard Brown. The Department for Transport
     (DfT) has attended meetings of RSSSG as an observer.

2.   The need for a high-level, long term RSS as a way of helping to forecast future requirements
     for fleet size and composition was originally articulated by the Association of Train Operating
     Companies (ATOC) in its discussion paper ‘Rolling Stock and Value for Money’ published in
     December 2011. That paper set out a number of proposals for delivering better value for
     money from rolling stock and was welcomed in the March 2012 Government Command
     Paper ’Reforming our Railways’. Among the recommendations of the Command Paper were
     that putting train operators (TOCs) and ROSCOs, rather than DfT, in the lead for planning and
     delivering rolling stock through a market-based approach is the best way forward, and that
     development of a long term RSS would help shape expectations, giving more visibility to
     the supply chain, and thereby achieving long term, whole-system benefits. RSSSG has been
     encouraged by ministerial endorsement of this approach.

3.   The fundamental aim of the RSS is as follows:

      Set out the dimensions of industry-wide rolling stock requirements over a 30-year horizon
      in the context of growth, committed and likely network developments and the direction
      of government policy, without imposing constraints on the market to deliver appropriate
      solutions.

      A key objective of the Strategy must be to promote better value for money from the rail
      industry. The Strategy should therefore as a minimum indicate the manner in which it
      might reduce not only rolling stock unit costs and wider industry costs, but also increase
      train capacity, route capacity and industry revenues.

4.   The RSS is intended to add value by:
     • providing a backdrop for longer term planning, in particular by train builders and their
        suppliers, ROSCOs, and Network Rail;
     • identifying opportunities to smooth peaks and troughs of workload;
     • highlighting priorities for further Value for Money (VfM) work;
     • facilitating a whole-system approach to strategy, bringing together infrastructure, demand
        growth, train services and fleet scenarios; and
     • assisting investors to understand the longer term prospects and opportunities for the
        industry.

                                                                                                         2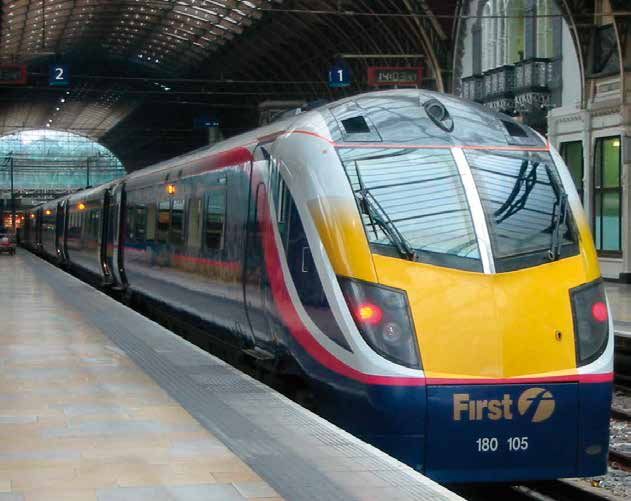
5.   The approach behind the RSS has been to work from the perspective of long term peak period
     passenger demand and its implications for each TOC and for different types of rolling stock. This
     in turn has enabled RSSSG to develop a number of scenarios for future fleet size. The emerging
     work has been discussed regularly with the train builders that are members of the Rail Industry
     Association (RIA), and this is continuing. It has also fed into the Industry Strategic Business
     Plans (ISBPs), published in January 2013, and links to the industry’s Long Term Planning Process
     (LTPP), which will review the infrastructure and service implications of the factors outlined in
     this report. The combination of this RSS and the LTPP work – together with HS2’s plans for a
     new North-South Y-shaped high speed rail network - will provide the overall picture for rail
     development over the next thirty years.

6.   Since publication of the first RSS the Steering Group has reviewed and updated the initial work
     by:
     • considering the implications of the recent changes to the franchising programme and the
         DfT’s role in negotiating franchise extensions in the form of Single Tender Actions (STAs) with
         incumbent TOCs (see Section B below);
     • updating and rolling forward the forecasts for the size and composition of the national
         passenger fleet, now covering the period 2013 to 2043, in the light of forecasts of peak
         passenger demand over 10 years and 30 years as included in the Market Studies published
         by Network Rail in October 2013 (see Sections D, G and H below);
     • considering how standardisation of rolling stock, subsystems and/or their key outputs can
         help to optimise route capacity and provide other benefits (see Section I below); and
     • producing a high level estimate of incremental depot and berthing requirements that will be
         required over 10-year and 30-year horizons, as an input to the industry’s Long Term Planning
         Process (see Section J below).

Chiltern Railways diesel trains: A BR-procured Type A class 165 ‘Network Turbo’
DMU of 1991, and an Alstom/General Motors Type B Class 67 locomotive of 1999
                                                                                                           3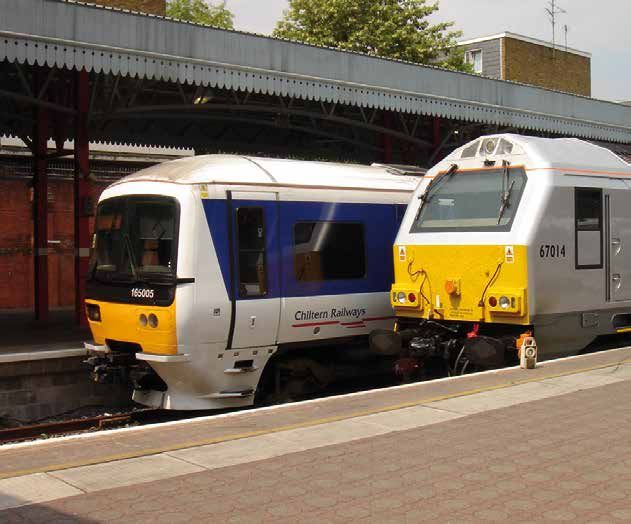
B. Impact of Changes to the Franchising Programme
7.   In the first RSS published in February 2013, RSSSG set out the key principles which should apply
     with regard to the provision of rolling stock. Alongside government’s important role in setting
     out the strategic direction and the desired outcomes, these were that:
     • the franchising model is the best mechanism to deliver value for money rail services;
     • rolling stock provision should be the result of market-driven solutions, procured in a
         competitive environment; and
     • optimisation of the whole-life, whole-system costs and benefits of rolling stock must be
         achieved.

8.   We were encouraged by ministerial endorsement of the RSS, reflecting previous support for
     the broad approach set out in the March 2012 Command Paper. Since then there has been
     limited opportunity to put the principles into practice, notwithstanding the re-shaping of the
     franchising programme in March 2013 following the cancellation of the West Coast franchise
     competition.

9.   Two of the three franchises currently being let in England and Wales are heavily shaped by the
     large centrally-procured contracts for Intercity Express Programme (IEP) and the trains for the
     Thameslink project respectively. The scope for adopting the above principles has been further
     curtailed by the DfT’s need to negotiate STAs with some existing franchisees, limitations on
     the DfT’s operating expenditure budget, and the need for the DfT to rebuild its resources, staff
     numbers and capabilities. The start dates of all planned new franchises, new concessions and
     STAs are shown in the Timelines in Appendices 1 to 3 of this RSS.

10. Against this background, the analysis undertaken for the February 2013 RSS has been reviewed
    and rolled forward. Despite the factors highlighted above, the long term conclusions about
    the size and composition of the fleet are largely unchanged, being demand-led and based on
    a range of assumptions and scenarios for growth in peak passenger demand and for future
    railway electrification.

11. While we recognise the short term pressures currently faced by the Department, we believe
    the principles of our approach still hold true and that it is important to mitigate the risks which
    those pressures pose to securing long term value for money.

12. In particular, care must be taken that:
    • guidance from DfT is not interpreted as, nor does it become (however inadvertently), the
        specification of inputs;
    • short term savings in rolling stock costs to meet budget constraints over the next 2-3 years
        are not made at the expense of whole-life, whole-system value. (For example, the business
        case for some enhancements such as re-tractioning for some older fleets will become
        progressively weaker, the longer that they are deferred); and
    • the need for short term action does not constrain competitive tension and innovation.

13. RSSSG has begun a constructive dialogue that has been initiated with the DfT on these issues.
    We look forward to seeing signals in the negotiation of STAs and future franchise Invitations to
    Tender of practical recognition by the DfT of the longer-term opportunities to secure value for
    money from rolling stock.

                                                                                                          4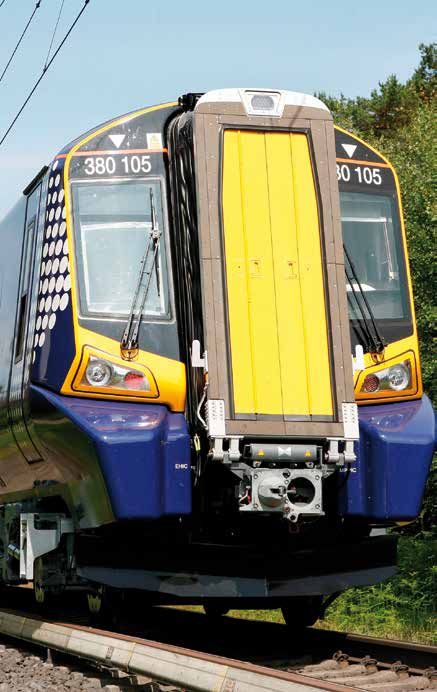
C. The Approach Adopted for the Strategy
14. Scenarios for fleet size have been modelled by five-yearly Control Period for the whole of the
    ‘main line’ passenger fleet including Scotland, LOROL, Crossrail, and HS2 but not the light rail,
    tram-train, LUL, or international fleets.

15. Each of the existing fleets has been categorised by one of seven generic types of train:
    A. Shorter Distance Self-Powered (diesel, generally with 75 mph maximum speed);
    B. Middle Distance Self-Powered (diesel, with 90/ 100 mph capability);
    C. Long Distance Self-Powered (diesel, with 100/ 110/ 125 mph capability);
    D. Shorter Distance Electric (generally with 75 mph maximum speed);
    E. Middle Distance Electric (with 90/ 100/ 110 mph capability. Some future trains may require
       115 or 125 mph capability);
    F. Long Distance Electric (with 100/ 110/ 125/ 140 mph capability); and
    G. Very High Speed (140 mph and above, for domestic services on HS1 and HS2).

16. Individual class numbers have not been used in the associated analysis. The RSS is not a
    ‘cascade plan’ for the deployment of rolling stock, nor is it in any way prescriptive. Consistent
    with RSSSG’s support for market-based approaches, it is in no sense intended to constrain
    TOCs and funders from making the best possible decisions about rolling stock procurement,
    maintenance, enhancement, life extension and replacement based on thorough business case
    analysis at the time.

17. To develop these scenarios, we have started with expectations for growth in peak period
    passenger demand, using the long term forecasts contained in the ‘Generation 2’ Route
    Utilisation Strategies (RUSs) published by Network Rail in 2011. These forecasts are consistent
    with those in the recent Industry Strategic Business Plans (ISBPs). As outlined in Section D
    below, we have subsequently tested our projections using forecasts of peak passenger demand
    over ten years and 30 years as included in the Market Studies published by Network Rail in
    October 2013. We have then incorporated the effect of electrification scenarios by examining
    the various options listed in the 2009 Electrification RUS and prioritising them. To do this,
    we have drawn on the methodology used in that RUS and concentrated principally (but not
    solely) on those route sections where electrification would permit more efficient operation of
    passenger trains.

18. Using these inputs three composite scenarios have been defined and modelled as follows.
    • ‘Low’ - Low growth combined with a good level of capacity utilisation efficiency growth
       (this is the relationship between peak passenger demand growth and fleet size growth, see
       paragraphs 24 and 28 below) and a low level of future electrification.
    • ‘Medium’ - Medium growth combined with a medium level of capacity utilisation efficiency
       growth and a medium level of future electrification.
    • ‘High’ - High growth combined with a poor level of capacity utilisation efficiency growth and
       a high level of future electrification.

19. At the heart of the RSS, and facilitating its future updating, is a spreadsheet model. The RUS-
    based peak period passenger demand forecasts for growth and the selected electrification
    scenarios are route-specific, and these have been used to provide bottom-up inputs to the
    spreadsheet model using the existing franchise map for convenience (with the addition of
    Crossrail and HS2). For each TOC, the total fleet size has been determined for each of the three
    composite scenarios in the year 2043, and the implications for each of Control Periods CP5 to
    CP8 have then been determined by working backwards from that date.

                                                                                                        5
20. These forecasts and scenarios for long term passenger growth, fleet utilisation efficiency growth
    and electrification cannot, of course, quantify unpredictable external factors (e.g. oil/energy
    shortages), or options for future government policy e.g. in relation to fares policy, investment
    in rail infrastructure, policies on crowding, road pricing etc. The RSS has taken some account
    of such uncertainties by developing the three composite scenarios and by treating the RSS
    as a living entity. The intention is that the RSS will be updated annually to reflect industry
    developments including the franchising programme and emerging government policy.

21. The electrification programmes considered and modelled are illustrative. Since publication of
    the first RSS in February 2013, Network Rail has commenced its refresh of the Electrification
    RUS that was published in 2009 - see Section E below - and has published more details of the
    CP5 programme through its draft Enhancements Delivery Plan.

22. The 2011 RUSs contain many route-specific infrastructure and timetable options for increasing
    capacity over the next 15-20 years, and the CP5 Strategic Business Plan, Thameslink, Crossrail
    and HS2 projects will provide additional capacity well beyond these timescales. On many routes
    it will be possible to lengthen trains or run more trains within the existing infrastructure. On
    others, schemes beyond those proposed for CP5 or included in the RUSs would be needed to
    provide sufficient paths, stations capacity and depots. The costs and benefits of such schemes
    have not been established. The industry’s Long Term Planning Process, through successive
    HLOSs, Route Studies and franchise bids will address these issues progressively, route by route.
    Train operators, ROSCOs and Network Rail work through these processes to help find good
    value for money outcomes and develop an overall rail development strategy, mindful of the
    need to improve industry efficiency and to reduce total levels of subsidy. Further information
    about incremental infrastructure, maintenance depots and berthing capacity is contained in
    Section J below.

An Alstom FGW Type C class 180 ‘Adelante’ DMU of 2000
                                                                                                        6
D. Planning for Growth – Sources of the Assumptions Adopted
23. Total passenger miles grew by 102% in the 18 years between 1994 and 2012, an average
compound rate per year of 4.0%. Even in the five years of lower economic growth after 2007,
the average annual growth in passenger miles was 3.8%, significantly out-performing other
transport modes in Great Britain and other railways in Europe. (See ‘Growth and Prosperity’
published by ATOC in July 2013). This indicates that the rail industry has successfully increased
volumes through actions such as capacity improvement, marketing and new trains. This
generates more revenue, which helps pay for the very substantial investment programme that
the industry is undertaking in CP4 and CP5. The same opportunity exists in future to help pay
for capacity investment.
24. To assess the implications for the number of vehicles needed in future, we have looked at
the long term relationship between demand and passenger fleet size. The 102% increase
in passenger miles to 2012 was achieved with an increase of just 11% in the total national
passenger fleet size. This major increase in fleet utilisation efficiency since privatisation has
resulted from the following factors:
• replacement of Mark 1 EMUs and DMUs and Mark 2 coaching stock with sliding-door
vehicles, which provided more capacity for peak period passengers;
• introduction of trains with metro-style interiors for some inner suburban services south of
the River Thames;
• elimination of most locomotives and non-passenger carrying vehicles for the Virgin West
Coast and CrossCountry TOCs (meaning that more of the train is available for carrying
passengers);
• achievement of higher levels of fleet availability, and of higher average train speeds on some
routes;
• introduction of automatic passenger load weighing and counting technology on many fleets
(which has led to more efficient utilisation of rolling stock); and
• achievement of higher off-peak load factors, through marketing, yield management and
internet sales.
25. The RUS-based growth forecasting methodology adopted focuses primarily on route-specific
peak period passenger volumes and peak capacity, since that is what determines strategic level
planning of railway infrastructure, rolling stock and timetables.
26. The fleet size growth forecasts in the Medium scenario of the RSS are based directly on the
route-specific forecasts of long term growth in peak period rail passenger demand that are
included in the 2011 RUS documents, extrapolated to 2043. Our resulting forecasts of fleet size
growth for individual routes in the Medium scenario range from +132% for the longer distance
routes into London Paddington and +104% for the principal cities served by Northern Rail, to
+23% for the routes served by Southeastern (excluding HS1). In the case of peak flows to and
from London, the L&SE RUS methodology has the merit of taking account of present levels of
peak crowding.
27. The Low and High growth forecasts represent a range of possible outcomes for future rolling
stock capacity requirements. For all routes, these Low and High forecasts of future fleet capacity
have been modelled as 0.7 and 1.3 respectively (i.e. ± 30%) of the Medium forecast of the
required fleet capacity in 2043, this being judged to be a reasonable range of likely outcomes
making allowance both for uncertainties in future peak growth and in future capacity utilisation
efficiencies.
728. Growth in peak demand of higher than the Medium case may occur, as each additional (presently
uncommitted) future route enhancement or service enhancement may well itself produce some
additional peak period growth leading to fleet growth. Conversely, the franchise bidding process
can unlock opportunities to improve capacity utilisation further (for example through further
improvements in fleet availability or fleet utilisation). This would be facilitated by flexibility in
franchise specifications and change mechanisms in franchise contracts, and by TOCs continuing
to adopt and improve the range of ideas listed in paragraph 24 above. The easiest of such
opportunities have already been implemented, but more can be achieved through the effective
specification and management of franchises. This can be facilitated by:
• continuing improvements in timetable patterns;
• introduction of more vehicles with ‘metro’-style interiors for short-distance services for which
the DfT has for some time permitted higher levels of standing, coupled with greater route-
specific flexibility in franchise specifications regarding standing in peak periods for middle
distance services;
• introduction of new industry-wide metrics for and benchmarking of peak capacity utilisation,
as an aid to effective management of capacity;
• changing the profile of peak demand; and
• replacement over time of many or most of the remaining trains formed of Mark 3 and Mark 4
rolling stock which have non-passenger carrying vehicles (locomotives, power cars and driving
trailer vehicles).
29. Network Rail published three new Market Studies in October 2013, for the L&SE, Long-Distance
and Regional Urban markets respectively which are being fed into the LTPP.
30. These are of interest in that:
• they provide forecasts of peak passenger demand by main route (and for the principal
regional cities) in 2023 and 2043, whereas the previous 2011 RUS documents covered a
period of around 20 years only; and
• they incorporate four alternative composite long term demand scenarios comprising a wide
range of macro-economic and micro-economic factors, demographics, ‘consumer tastes’, and
‘the supply of travel opportunities’.
31. The demand forecasting methodology used in the Market Studies is very close to that used
in the 2011 RUS documents. We have checked the 30-year forecasts contained in the Market
Studies and have identified a high degree of consistency with the national fleet size forecasts for
2043 as published in Table 3 of this RSS.
32. Useful new data is provided in the Market Studies in the form of 10-year forecasts for peak
passenger demand growth for all of the principal routes to London, for ten regional cities in
England and Wales, and for all-day flows between pairs of 13 British cities. The degree of overall
correlation with the RSS Table 3 figures for fleet sizes in 2024 is again good. This has provided a
stronger 10-year focus on future fleet sizes, as described in Sections G and H below.
33. We have also included estimates of fleet requirements for HS2 based on publicly available
information from HS2 Ltd and a discussion with them about options for growth after initial
service introduction. We have adopted a range of assumptions in the three scenarios for the
rolling stock volumes that will be required to operate high speed and intermediate services on
the existing long-distance routes after capacity has been released by HS2.
8E. Electrification – Prioritisation and Analysis
34. As outlined in this RSS, route electrification offers major new opportunities to reduce unit costs
of rolling stock operation and to provide additional capacity and environmental benefits as
the network progressively shifts from relying heavily on diesel trains on many of the nation’s
principal long-distance and commuter routes to one in which diesels are in future used only on
the more lightly used secondary routes.
35. The present total national Network Rail track mileage is 19,309 single track miles (excluding
depots and sidings, referred to in this RSS as ‘track miles’ - source Network Rail Annual Return
2013). Of this, 7,960 track miles (41%) are electrified and 11,349 track miles (59%) are non-
electrified. With completion of the 1,900 track miles to be electrified in CP4 and CP5, 51%
of total track miles will be electrified. The currently assumed completion dates for all of the
committed electrification schemes are shown in the Timelines contained in Appendices 1 to 3,
based on Network Rail’s draft CP5 Enhancements Delivery Plan published in December 2013.
36. Although the DfT cannot yet commit to a rolling programme of electrification beyond CP5, the
direction of government policy is to continue such a programme into CP6 and beyond. Views
have been sought by the DfT on this in response to the 2012 High Level Output Specification
(HLOS), who have suggested that the programme should include the Derby – Birmingham –
Bristol route as well as freight connectivity in South Yorkshire and elsewhere. A joint Network
Rail – DfT taskforce (also involving TOCs, local authorities and other parties) is to explore
opportunities for further electrification in the North of England. Transport Scotland’s CP5 HLOS
already contains a specific objective of a rolling programme of electrification amounting to
approximately 60 single track miles per annum, following the completion of the Edinburgh to
Glasgow Improvements Programme (EGIP) electrification.
37. The 2009 Electrification RUS listed 131 route sections as candidates for future electrification.
Each route was rated by Network Rail in the RUS in relation to four separate criteria.
A. Facilitating efficient operation of passenger services.
B. Facilitating efficient operation of freight services.
C. Providing diversionary routes for electric trains.
D. Facilitating new electrified passenger services.
38. For ranking in terms of ability to facilitate efficient operation of passenger services, Network Rail
calculated a metric for each route section of the total number of annual passenger vehicle-miles
which might be converted from diesel to electric operation, divided by the number of track
miles requiring electrification in that route section (with a higher number indicating a probable
better case in that the cost of electrification does not greatly increase with usage of the route).
39. Taking account of this data, and the extent to which electrification would release good mid-life
diesel units to increase capacity where needed on other non-electrified routes, and also taking
some regard of the other ranking factors in paragraph 37 above, we have produced an indicative
ranking of route sections that might be electrified in CP6 and beyond (subject to business case
development, affordability and negotiation of satisfactory commercial terms).
40. Low, Medium and High scenarios for electrification have been constructed as shown in
Table 1 below. This is a strategic view only, designed to give a potential sense of scale for the
electrification programme beyond CP5. The timing and phasing of electrification of individual
routes are clearly subject to further refinement. The scoping of electrification schemes provides
a pool of possible projects from which a long term rolling programme could be constructed.
9This RSS is intended to illustrate and quantify the implications which such a rolling programme
might have for the national passenger rolling stock fleets.
Table 1 – Illustrative Electrification Scenarios (Track Miles that might be Electrified)
Control Period Low Medium High
CP4 & CP5 1,900 1,900 1,900
CP6 2,100 2,100 2,100
CP7 0 1,800 1,800
CP8 0 0 1,100
TOTAL 4,000 5,800 6,900
% Electrified 62% 71% 77%
Source – Analysis based on data provided by Network Rail
41. The capital cost of the CP5 electrification programme is estimated to be in the region of £3.2
billion (source: ORR CP5 Final Determination), and it is likely that similar expenditure would be
required in CP6 and CP7, to achieve the Medium scenario forecast, although no detailed costing
work has yet been undertaken.
42. Conversion of DC-electrified routes to AC or to dual-voltage capability has not been included in
the above table as this does not affect the total electrified mileage. There is one such scheme
that will be evaluated by Network Rail in CP5, this being between Basingstoke and Southampton
as part of the ‘Electric Spine’ route. Such conversion here or elsewhere, if and where there is a
business case, is likely to lead to replacement of the existing BR-procured DC rolling stock and/
or retrofit of existing post-privatisation EMUs. Given that examination of the business case
for more widespread DC to AC conversion is still at an early stage, we have not made specific
allowance for any replacement or modification of these fleets. Our analysis assumes that DC to
AC conversion will not lead to an increase in total vehicle numbers beyond that which would be
required for growth.
43. Since publication of the first RSS in February 2013, Network Rail has begun its refresh of the
Electrification RUS published in 2009, with inputs from an industry-wide working group and
from RSSSG. Network Rail is undertaking appraisals of the business case for electrification
of many routes. All of the routes contained in our scenario modelling have been included
in the Network Rail appraisals. We are still some way from the Government underwriting a
specific electrification programme for England and Wales in CP6 and beyond, but the scenarios
contained in our own modelling for the RSS are consistent with the direction of government
policy. These scenarios have therefore not been changed from those used for the RSS published
in February 2013, except that it has now been confirmed that Gospel Oak to Barking, Barnt
Green to Bromsgrove and several other short route sections will be electrified in CP5.
A BR-procured East Coast Type F ‘IC225’ electric trainset of 1989
10F. The Present Fleets and Future Capability Requirements
44. Details of the composition of all of the existing fleets (in use, rather than stored), and of
committed changes to the end of CP4, are summarised in Table 2 below, using the definitions
set out in paragraphs 14 and 15 above. The totals here and elsewhere in the RSS include
both passenger-carrying and associated non-passenger carrying vehicles in passenger trains
(the latter including locomotives, power cars and driving trailer vehicles). These are not rigid
categorisations: it is possible that, for example, existing Long Distance DMUs cascaded from
routes to be electrified could in some cases be used on services currently operated by Middle
Distance DMUs if their operating characteristics are suitable and if there is a business case to
do this.
Table 2 – Present Fleet Composition (including Committed Changes to the End of CP4)
Generic Type Total Vehicles, March 2014
A. Shorter Distance Self-Powered (diesel, generally
1,055
with 75 mph maximum speed);
B. Middle Distance Self-Powered (diesel, with 90/
1,348
100 mph capability);
C. Long Distance Self-Powered (diesel, with 100/
1,493
110/ 125 mph capability);
D. Shorter Distance Electric (generally with 75 mph
2,336
maximum speed);
E. Middle Distance Electric (with 90/ 100/ 110/
5,098
115/ 125 mph capability);
F. Long Distance Electric (with 100/ 110/ 125/ 140
1,143
mph capability);
G. Very High Speed Electric (140 mph and above,
174
for domestic services on HS1 and HS2).
TOTALS 12,647
Source: Analysis from ROSCO and ATOC data as at the end of CP4 in March 2014
45. Figure 1 overleaf shows that, of the 12,647 vehicles:
• 5,988 (47%) have been built since privatisation, and the remaining 6,659 (53%) during the BR
era prior 1994; and
• 966 (8%) are owned by parties other than the three ROSCOs (e.g Voyager Leasing),
principally in categories C, D and E.
11Figure 1 Present Age and Ownership of the National Passenger Rolling Stock Fleet
Age of Existing Fleets
13% BR 1970s
BR 1980s
47% 24% BR 1990s
Post Privatisation
Ownership of Existing Fleets
16%
Angel 8%
Eversholt 33%
Porterbrook
31%
Other
28%
Source: Analysis from ROSCO and TOC data as at the end of CP4 in March 2014
46. For the future, ‘Self-Powered’ units will include any type of train which cannot collect electrical
power when in motion, from an overhead or third rail source. This may include classic diesel-
powered units and also ‘hybrid’ units incorporating an internal combustion engine or fuel cell
with some form of electrical or mechanical energy storage. ‘Electric’ units include not only
straight-electric but also ‘bi-mode’ trains (such as Hitachi’s IEP Trains) which can both collect
power when in motion from an overhead or third rail source, and also generate power from an
on-board source. Some electric units may in future include some form of electricity storage for
operation away from overhead or third rail power sources, subject to a satisfactory business
case and continuing development of power storage technology.
47. It is widely expected that present and future EU legislation regarding emissions from diesel
engines (Directive 97/68/EC and its subsequent amendments, implemented in Great Britain as
the Non-Road Mobile Machinery (Emission of Gaseous and Particulate Pollutants) Regulations
1999 and 2013, known as NRMM) will increasingly make it difficult to procure and operate
new DMUs having underfloor diesel engines, with an affordable business case. Indeed, EU
consultation on further tightening of the rules is now underway. Our present understanding of
the associated issues is as follows.
• Existing EU and UK legislation does not prevent the continued operation of any of the
present British DMU fleets, thanks to an amendment agreed in 2011.
• None of the present British DMU fleets are at any risk of being unable to operate as a result
of non-availability of diesel engines or spare parts for diesel engines.
• Legislation prevents any more engines of the present types being manufactured for these
fleets, but engine components can be manufactured and in addition a float of additional
spare engines will become available for the older DMUs when electrification starts to reduce
the size of these fleets over the next ten years.
• The NRMM 2013 Directive contains an Extended Flexibility Scheme which allows engines on
existing trains to be replaced with new Stage IIIA compliant engines (rather than with the
12later standard Stage IIIB compliant engines). The only Stage IIIA compliant engine currently
fitted to a British DMU is the MTU 1800 series engine fitted to the Class 172 DMUs built by
Bombardier in 2010-11. No TOC or ROSCO has to date needed to consider whether this or
any other Stage IIIA compliant engine might one day have to be fitted to any existing British
DMU.
• It is widely considered that it would be impossible to fit a Stage IIIB compliant engine of
adequate power to any of the existing British DMU types.
• Further stages of EC emission legislation may one day prohibit the operation of pre-Stage IIIA
or pre-Stage IIIB engines, and this might be the trigger for further electrification and/or for a
relatively small build of new self-powered rolling stock (see paragraphs 54 and 55 below).
48. Some overlap is already occurring in the distinction between Categories E and F. On the south
end of the West Coast Main Line, and on other principal electrified (and to be electrified) long
distance main lines, maximum route capacity and revenues will most probably be achieved
if high capacity, high performance electric trains (in some cases with a maximum speed of
110, 115 or 125 mph) are introduced for middle distance flows. There are trade offs to be
made between track capacity and the capacity of individual trains. Trains with a top speed of
more than 117 mph lose passenger capacity because of the EC’s Technical Specification for
Interoperability (TSI) requirements relating to passengers in the leading vehicles of higher speed
trains. (See Sections I and J below).
A Siemens FTPE Type B class 185 ‘Desiro’ DMU of 2005
13G. Fleet Sizes and Compositions Calculated for each Scenario
49. As described in paragraph 18 above, the three growth and capacity utilisation scenarios have
been combined with the three electrification scenarios to obtain three composite scenarios
within the spreadsheet model, for each TOC, for each Control Period to 2043. The aggregated
results are summarised in Table 3 on the next page.
50. The key developments over 30 years highlighted in Table 3 are:
• total national passenger fleet, overall increase of 53-99%;
• electric fleets, rising from 69% of the national fleet today to 92-95%; and
• self-powered fleets, falling from 31% of the national fleet today to 5-8%.
51. It can be deduced that in the Low scenario, a minimum of 13,000 new electric vehicles would be
required by 2043, from today’s base position. This figure comprises the sum of:
• 9,000 which is the net increase in electric vehicles over 30 years, in the Low scenario; and
• 4,000 to replace most of the BR-procured electric fleets (all of which will be a minimum of 49
years old in 2043).
52. In the Medium and High scenarios, this minimum total of 13,000 new electric vehicles to
be constructed by 2043 would rise to 16,000 and 19,000 respectively. This equates to a
construction requirement for electric trains averaging approximately 8, 10 or 12 vehicles per
week respectively in the three scenarios over 30 years. This would be a significant increase over
the average rate of construction of new electric and diesel vehicles during CP4 of just 4 vehicles
per week.
53. The projected changes in the size and composition of the national passenger fleet for the
Medium Scenario are shown in Figure 2.
Figure 2 – Change in National Passenger Fleet Size and Composition (Medium Scenario)
Composition of Fleets, 2014 Composition of Fleets, 2043
3%
1% 2% 1%
8%
9%
11% 7%
18%
15%
12%
40%
19%
54%
A. Shorter Distance Diesel E. Middle Distance Electric
B. Middle Distance Diesel F. Long Distance Electric
C. Long Distance Diesel G. Very High Speed Electric
D. Shorter Distance Electric
Source: The figures are as in Table 3. The two circles are approximately to scale,
with the reduction in the diesel fleets being shown highlighted.
14Table 3 – Aggregated Results of Fleet Size Changes for the National Passenger Fleets to 2043 (Low, Medium and High Scenarios)
Committed CP4 Forecast CP5 to 2019 Forecast CP6 to 2024 Forecast CP7 to 2029 Forecast CP8 to 2034 Forecast CP9/10 to 2043
Sub-Group Total Vehicles Total Vehicles Total Vehicles Total Vehicles Total Vehicles Total Vehicles
March 2014 Low Med. High Low Med. High Low Med. High Low Med. High Low Med. High
A. Shorter Distance 1,055 768 779 794 527 516 512 514 484 467 503 457 392 488 422 337
Diesel
B. Middle Distance 1,348 1,305 1,331 1,362 891 971 1,035 870 574 682 850 561 645 880 607 729
Diesel
C. Long Distance 1,493 888 873 951 318 378 429 73 137 188 73 137 188 73 137 188
Diesel
D. Shorter Distance 2,336 3,079 3,144 3,267 3,212 3,289 3,576 3,324 3,460 3,941 3,559 3,764 4,060 3,677 3,930 4,282
Electric
E. Middle Distance 5,098 6,070 6,325 6,516 7,464 7,945 8,395 8,173 9,185 9,898 8,952 10,323 11,492 9,893 11,774 13,432
Electric
F. Long Distance 1,143 1,802 1,935 1,981 2,354 2,500 2,601 2,492 2,907 3,322 2,229 2,947 3,684 2,483 3,327 4,201
Electric & Bi-Mode
G. Very High Speed 174 174 174 174 174 174 174 654 662 686 1,397 1,436 1,507 1,469 1,516 1,587
Electric
TOTALS 12,647 14,086 14,561 15,045 14,940 15,774 16,722 16,100 17,408 19,183 17,563 19,625 21,968 18,964 21,713 24,756
Effective Capacity
Growth on Period 6 2% 13% 17% 21% 20% 27% 35% 30% 40% 55% 41% 58% 77% 53% 75% 99%
2013/14
Diesel Totals 3,896 2,961 2,983 3,107 1,735 1,866 1,976 1,457 1,195 1,337 1,426 1,155 1,225 1,441 1,166 1,254
Electric & Bi-Mode
8,751 11,125 11,578 11,938 13,204 13,908 14,746 14,643 16,213 17,846 16,137 18,470 20,743 17,523 20,548 23,502
Totals
Electric & Bi-Mode
69% 79% 80% 79% 88% 88% 88% 91% 93% 93% 92% 94% 94% 92% 95% 95%
%
Source: Analysis using TOC-specific and route-specific peak period growth forecasts and illustrative electrification scenarios as described in this RSS.
1554. Electrification will produce a steady flow of mid-life DMUs for use on non-electrified routes,
(subject to commercial terms). Based on the electrification scenarios in this RSS and the figures
in Table 3 it can be assumed that there will be no requirement for any new diesel or other self-
powered rolling stock on a significant scale unless or until hybrid technology matures and the
business case becomes sufficiently strong, or until such time as new environmental legislation
makes the operation of the present diesel-engined vehicles non-viable (see paragraph 47
above). Small orders of growth stock as part of franchise bids remain possible.
55. All of the Type A short-distance DMUs and many of the Type B DMUs were procured by British
Rail between 1985 and 1992. It can be expected that all or most of these will have been
withdrawn by 2043, all being more than 50 years old at this time. A total of 1,350 Type B and
Type C diesel vehicles have been built since privatisation, these being built between 1997 and
2011. Most of these could still be operating in 2043, if environmental legislation and the supply
of engines permit this, and subject to adequate commercial leasing terms. Based on the figures
in Table 3, a total of between 1,150 and 1,450 self-powered vehicles will be required in 2043. It
is possible therefore that no more than 100 new self-powered vehicles may be required to be
built in the 30 years to 2043. Alternatively if environmental legislation were to be strengthened,
then up to 1,500 new self-powered vehicles may be required. This is a small figure compared
with the 13,000 to 19,000 new electric vehicles forecast to be required over this period. The
self-powered totals shown could potentially include some diesel or bi-mode locomotives to
haul electric trains beyond the limits of electrification on some routes. More generally, should
for whatever reason the electrification programme in CP6, CP7 and CP8 not advance as fast or
as extensively as assumed in paragraph 40 above, then a higher number of new diesels may be
needed to cater for growth on non-electrified routes
56. RSSSG has been actively engaged with the RIA and with the train builders and other suppliers
who are members of the RIA during the development of this strategy. The implications of
the RSS for the manufacturing and maintenance communities are clear and either directly or
indirectly should have a positive impact. The involvement of all parties in these discussions has
been extremely constructive, sharing key data and emphasising the most beneficial direction
of travel for UK rail. This approach has developed RSSSG’s thinking, further demonstrating the
value of collaborative working.
57. The train builders have emphasised that the short, medium and long term forecasts stretching
out 30 years which are provided in the RSS, far from being of merely theoretical interest, are of
great value to their future business strategies, and have in specific cases been discussed in some
detail with their parent companies. There is agreement between all parties that the regular
meetings with RSSSG members should continue. As the role of the recently established Rail
Supply Group becomes clear, RSSSG members will develop a similar relationship with this body.
58. The train builders and RIA have emphasised their firm belief that:
• the procurement of new rolling stock is normally best undertaken by TOCs with ROSCOs;
• the ROSCOs’ role is crucially importance for addressing residual value;
• procurement decisions should be based on optimisation of whole-system life-cycle value ;
• procurement evaluation criteria and weighting for rolling stock investments must be
transparent and proportionate;
• DfT’s approach to deliverability is important e.g. for ‘new’ vs ‘life extended’ rolling stock
decisions, and in franchise bid evaluation;
• batch sizes and continuity of ‘beat rates’ (i.e. the rate of production) for new rolling stock
have major impacts on build efficiency, cost and ability to innovate; and
16• full service maintenance provision by the manufacturer can in their view produce a better
train, but typically needs a maintenance contract period of around 10 years to justify the
investment required.
Type E EMUs: A Bombardier Southern class 377/6 ‘Electrostar’ of 2013, and a Siemens ScotRail class 380 ‘Desiro’ of 2009
17H. Rolling Stock Requirements in the Next Ten Years
59. For this update of the RSS, we felt it important in particular to review the impact of our
assumptions for the fleet over the next two Control Periods (CP5 and CP6), covering ten years.
RSSSG had already checked its fleet size forecasts derived for 2019 for consistency with work
done on rolling stock specifically, as an input to the Industry Strategic Business Plan (ISBP) for
CP5 which was published in January 2013.
60. Section 5.2.6 of the ISBP for England & Wales (but containing in this instance rolling stock data
for Scotland also) stated that the total of new vehicles in CP5 could be “up to 4,150”, including a
nominal 2,400 vehicles for Thameslink, Crossrail and IEP. The figure was expressed in this way to
reflect a range of potential options, depending on which routes might best be able to make the
business case for new vehicles as opposed to cascaded vehicles, and/or around the strength of
the business case for enhancement or life extension of existing and cascaded vehicles.
61. RSSSG has continued to review the emerging intelligence on such business cases. The ISBP
forecast of up to 4,150 new vehicles to be delivered in CP5 is still consistent with the High
scenario of Table 3 of this RSS, but this figure should be looked at as very much an upside case
in terms of the number of existing electric vehicles to be replaced by new electric vehicles in
CP5 given the likely relative attractiveness of continued operation and life extension of existing
vehicles.
62. It is now known that the following will occur beyond the end of CP5, rather than during CP5.
• Completion of deliveries of the Crossrail fleet will occur in the early months of CP6 because
full implementation of the Crossrail timetable will not occur until December 2019.
• The East Coast phase 2 IEP trains will be delivered in the first year of CP6.
• Full implementation of electrification of the MML is now proposed by Network Rail for
December 2020.
Our updated central forecast for fleet sizes at the end of CP5 indicates that approximately
800 new EMU vehicles will be required in CP5 (for England, Wales and Scotland, and including
TfL’s rail concessions), in addition to the orders for the Thameslink, Crossrail and IEP projects.
Orders have already been placed for 210 of this total of 800 vehicles. This represents a total
requirement of around 3,050 new vehicles in CP5, assuming that 2,250 will be delivered for
the three major projects. This is a very large requirement for new vehicles in a single five-year
period. The forecast delivery dates of committed rolling stock orders (and of some other fleet
requirements) in CP5 and early CP6 are shown in the Timelines contained in Appendices 1 to 3
of this RSS.
63. The numbers of new electric vehicles required (in addition to those for the three major projects)
could be further increased beyond those noted in paragraph 62 if the costs and capabilities of
new electric trains can justify replacement of older electric trains. Conversely the total could be
lower if the DfT’s short term affordability constraints were to dominate procurement decisions.
None of the present electric fleets has a fixed or absolute technical life. The ability of fleet
owners to offer life extension and other enhancements to their TOC customers means that the
TOCs will have a greater range of options for fleet expansion in the future than was the case in
the past. New fleets will have the greatest advantages where they offer additional functionality
and therefore greater overall value for money.
64. Our updated fleet size forecasts contained in Table 3 of this RSS show the ‘Electric and Bi-
mode’ fleet totals increasing by between 2,100 and 2,800 over the course of CP6, in the three
scenarios. This compares with an increase of between 2,400 and 3,200 over the course of CP5.
It is not possible to predict how many older electric vehicles and electrically-hauled vehicles
18will be permanently retired during these control periods, and also how many EMUs which may
temporarily be off-lease at the end of 2019 may move back into operational use during CP6.
Nevertheless, it appears highly likely on the basis of the assumptions contained in this analysis
that the total number of new vehicles required to be delivered in CP6 will be less than in CP5.
65. The over-riding reason for this is that the Thameslink and Crossrail projects, and replacement of
HSTs built in the 1970s, all represent major investments which had long gestation periods and
are due to come to fruition in CP5. No similar rolling stock procurements of 600+ new vehicles
are likely to occur in CP6. Even HS2 is forecast to require only around 500 new vehicles in CP7,
with a further 700 to 800 in CP8.
66. This analysis illustrates that a completely steady new build programme for rolling stock is
unlikely ever to occur. Further peaks in demand for new build vehicles will occur as a direct
consequence of refranchising timescales, where decisions to procure new rolling stock will, in
many cases, be triggered by franchise award. Nevertheless, the forward projections of rolling
stock fleet sizes offered by the RSS, combined with an early commitment to a continuing
programme of electrification, should provide a greater degree of predictability about orders for
new electric vehicles beyond CP5. This can help manufacturers to optimise production capacity
and associated costs.
67. Assuming that the current policy of a rolling electrification programme continues in CP6,
the analysis suggests that no new diesel vehicles (or other self-powered vehicles) would be
required to be built in either CP5 or CP6. Many older diesel vehicles would be withdrawn over
this period, firstly those HSTs which are being replaced by IEP (although some might be used
on other TOCs including open access operators), and then by 2024 around 500 (50%) of the
shorter-distance Type A 75 mph DMUs procured by British Rail in the 1980s. This might include
many of the Class 14x ’Pacer’ vehicles which will be replaced by electrification in the North of
England and in South Wales. There will be a smaller percentage reduction in the number of
90 mph and 100 mph Type B DMUs. These were built after 1989, and many of these will be
redeployed to provide additional capacity on non-electrified routes.
Hitachi Type F class 800 electric and bi-mode ‘Super Express Trains’ to
be introduced on the Great Western and East Coast routes from 2017
19I. Standardisation Issues
68. RSSSG has discussed, at a strategic level, the potential advantages and drawbacks of
increasing the degree of standardisation of trains and their subsystems in future. On the one
hand, greater standardisation could potentially make it easier to move trains around the
network at franchise re-let points, to achieve economies of scale in production, technical
support and maintenance, to increase infrastructure cost efficiency and, potentially, to
increase the number of suppliers of important train subsystems. On the other, it could inhibit
technical innovation and significantly constrain the options open to bidders for franchises,
which is an important means to promote efficiency. RSSSG’s experience is that, in this area
as well as others, the industry (working through the processes that it already has, such as
the Systems Interface Committees) can effectively address many of the issues where the DfT
might otherwise feel it needs to intervene, provided that the industry is left to operate and
explore the full range of options itself.
69. There are number of areas in which the industry – mostly with suppliers and manufacturers - is
working together, in the UK and at EU level, to address this issue as a means of improving value
for money. These are described in the following paragraphs 70 to 76.
70. The Vehicle/Vehicle Systems Interface Committee (V/V SIC), on which the whole industry
including suppliers is represented, has agreed a series of Key Technical Requirements for new
rolling stock. These are distilled from experience of procuring new trains by TOCs and ROSCOs
over the years and are a series of guidelines for those procuring new trains which the whole
industry is expected to follow. Although, formally, they are not obligatory from a contractual or a
standards perspective, they do form a valuable set of experience sharing and the industry, through
the V/V SIC, has come together to endorse them.
71. A similar process has been used by the Vehicle/Track Systems Interface Committee (V/T SIC) to
develop a better understanding of the interaction between train and track represented in the
Vehicle Track Interaction Strategic Model (VTISM), which has been used to support a number of
recent train procurements; and by the Vehicle/Structures Systems Interface Committee (V/S SIC)
which is currently looking at options around standardised gauges and train-platform clearances.
72. It is not always recognised that the operation of the normal commercial process in franchising,
train procurement and leasing that was set up at privatisation has, in practice, naturally led to
the evolution of several families of train, most particularly:
• Siemens’ Desiro EMU (10% of the present national fleet, and still under construction);
• Bombardier’s Electrostar EMU (18% of the present national fleet, and still under
construction); and
• Bombardier’s Turbostar DMU (4% of the present national fleet).
73. This has happened because, once a manufacturer has developed a train type and it has
successfully been proved in service by achieving the high levels of safety and reliability required
on the UK network, there are natural commercial advantages in ordering more of those train
types rather than incur the expense and uncertainty of developing wholly new ones.
74. As route capacity has become more constrained, the Route Planning Process is playing an
increasingly important role in setting expectations for the kind of rolling stock that should be
used on busy routes. The process effectively sets high-level output requirements (e.g. for speed,
acceleration, train length and door positions) for the rolling stock that might be deployed on
each route, reflecting the fact that capacity on a route is maximised when the various train
types that use it have similar path-occupancy characteristics. For example, the fast pair of tracks
on the Great Western, West Coast, Midland and East Coast Main Line routes are now (or will be)
used by modern electric trains operating at 125mph (or above), all with very rapid acceleration.
20You can also read