Artificial Intelligence and Machine Learning Applications in Smart Production: Progress, Trends, and Directions - MDPI
←
→
Page content transcription
If your browser does not render page correctly, please read the page content below
sustainability

Review
Artificial Intelligence and Machine Learning
Applications in Smart Production: Progress, Trends,
and Directions
Raffaele Cioffi 1 , Marta Travaglioni 1 , Giuseppina Piscitelli 1 , Antonella Petrillo 1, *       and
Fabio De Felice 2
 1    Department of Engineering, Parthenope University, Isola C4, Centro Direzionale, 80143 Napoli NA, Italy;
      raffaele.cioffi@uniparthenope.it (R.C.); marta.travaglioni@uniparthenope.it (M.T.);
      giuseppina.piscitelli@uniparthenope.it (G.P.)
 2    Department of Civil and Mechanical Engineering, University of Cassino and Southern Lazio, Via G. Di
      Biasio, 43, 03043 Cassino FR, Italy; defelice@unicas.it
 *    Correspondence: antonella.petrillo@uniparthenope.it

 Received: 1 December 2019; Accepted: 5 January 2020; Published: 8 January 2020

 Abstract: Adaptation and innovation are extremely important to the manufacturing industry.
 This development should lead to sustainable manufacturing using new technologies. To promote
 sustainability, smart production requires global perspectives of smart production application
 technology. In this regard, thanks to intensive research efforts in the field of artificial intelligence (AI),
 a number of AI-based techniques, such as machine learning, have already been established in the
 industry to achieve sustainable manufacturing. Thus, the aim of the present research was to analyze,
 systematically, the scientific literature relating to the application of artificial intelligence and machine
 learning (ML) in industry. In fact, with the introduction of the Industry 4.0, artificial intelligence and
 machine learning are considered the driving force of smart factory revolution. The purpose of this
 review was to classify the literature, including publication year, authors, scientific sector, country,
 institution, and keywords. The analysis was done using the Web of Science and SCOPUS database.
 Furthermore, UCINET and NVivo 12 software were used to complete them. A literature review on
 ML and AI empirical studies published in the last century was carried out to highlight the evolution
 of the topic before and after Industry 4.0 introduction, from 1999 to now. Eighty-two articles were
 reviewed and classified. A first interesting result is the greater number of works published by the
 USA and the increasing interest after the birth of Industry 4.0.

 Keywords: artificial intelligence; machine learning; systematic literature review; applications;
 Industry 4.0; smart production; sustainability

1. Introduction
     Smart production systems require innovative solutions to increase the quality and sustainability
of manufacturing activities while reducing costs. In this context, artificial intelligence (AI)-driven
technologies, leveraged by I4.0 Key Enabling Technologies (e.g., Internet of Thing, advanced embedded
systems, cloud computing, big data, cognitive systems, virtual and augmented reality), are ready to
generate new industrial paradigms [1].
     In this regard, it is interesting to remember that the father of artificial intelligence, John McCarthy [2],
in the 1990s, defined artificial intelligence as “artificial intelligence is the science and engineering of
making intelligent machines, especially intelligent computer programs”. Generally, the term “AI” is
used when a machine simulates functions that humans associate with other human minds, such as
learning and problem solving [3].

Sustainability 2020, 12, 492; doi:10.3390/su12020492                          www.mdpi.com/journal/sustainability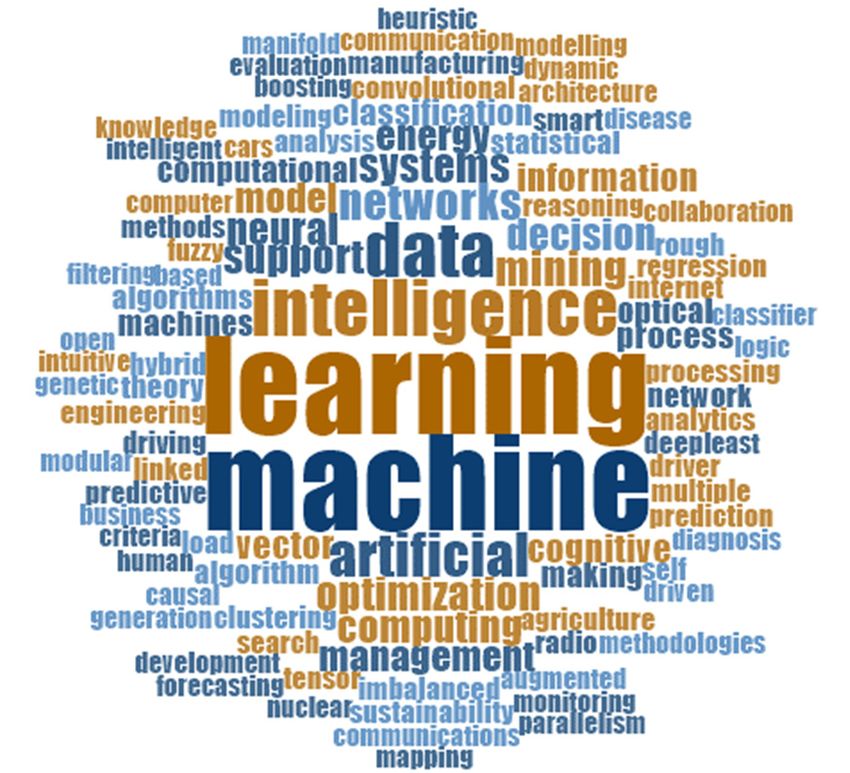
Sustainability 2020, 12, 492                                                                           2 of 26

      On a very broad account, the areas of artificial intelligence are classified into 16 categories [4–8].
These are reasoning, programming, artificial life, belief revision, data mining, distributed AI, expert
systems, genetic algorithms, systems, knowledge representation, machine learning, natural language
understanding, neural networks, theorem proving, constraint satisfaction, and theory of computation [9–
11].
      In the 21st century, AI has become an important area of research in all fields: Engineering, science,
education, medicine, business, accounting, finance, marketing, economics, stock market, and law,
among others [12–18]. The range of AI has grown enormously since the intelligence of machines with
machine learning capabilities has created profound impacts on business, governments, and society [19].
They also influence the larger trends in global sustainability. Artificial intelligence can be useful to solve
critical issue for sustainable manufacturing (e.g., optimization of energy resources, logistics, supply
chain management, waste management, etc.). In this context, in smart production, there is a trend to
incorporate AI into green manufacturing processes for stricter environmental policies [20]. In fact, as
said in March 2019 by Hendrik Fink, head of Sustainability Services at PricewaterhouseCoopers, “If we
properly incorporate artificial intelligence, we can achieve a revolution with regard to sustainability.
AI will be the driving force of the fourth industrial revolution” [21].
      Thus, subfields of AI, such as machine learning, natural language processing, image processing,
and data mining, have also become an important topic for today’s tech giants. The subject of AI
generates considerable interest in the scientific community, by virtue of the continuous evolution of
the technologies available today.
      The development of ML as a branch of AI is now very fast. Its usage has spread to various
fields, such as learning machines, which are currently used in smart manufacturing, medical science,
pharmacology, agriculture, archeology, games, business, and so forth.
      According to the above considerations, in this work, a systematic literature review of research
from 1999 to 2019 was performed on AI and the ML technique. Therefore, it is considered necessary to
create a classification system that refers to the articles that jointly treat the two topics, in order to have
greater variance and reflection. Furthermore, to gain a deeper understanding, the influence of other
variables was explored, such as the thematic areas and the sectors in which the technologies are most
influential. The main contribution of this work is that it provides an overview of the research carried
out to date.
      A number of impressive documentations of established research methods and philosophy have
been discussed for several years. Unfortunately, little comparison and integration across studies exists.
In this article, a common understanding of AI and ML research and its variations was created.
      This paper is not attempting to provide an all-encompassing framework on the literature on AI
and ML research. Rather, it attempts to provide a starting point for integrating knowledge across
research in this domain and suggests paths for future research. It explores studies in certain novel
disciplines: Environmental pollution, medicine, maintenance, manufacturing, etc.
      Further research is needed to extend the present boundary of knowledge in AI by integrating
principles and philosophies of some traditional disciplines into the existing AI frameworks [22–24].
      The target that this document would like to assume is not the trigger of a sudden proliferation of
an already consolidated sector, but it is hoped that this research could be an important intellectual tool
for both the refocusing of the work and creating new intellectual opportunities. This paper presents
valuable ideas and perspectives for undergoing research on AI and ML.
      The final aim was to anticipate the transformation of the discipline in the future age. This would
be a journey that may experience change in its course as new generations of scholars contribute to the
dialogue and to the action. As noted earlier, this work presents a review, hence it lays a foundation for
future inquiry. It not only offers a basis for future comparisons but prompts a number of new questions
for investigations as well. While topics that might be considered as results of this work are numerous,
some are of particularly broad interest or impact.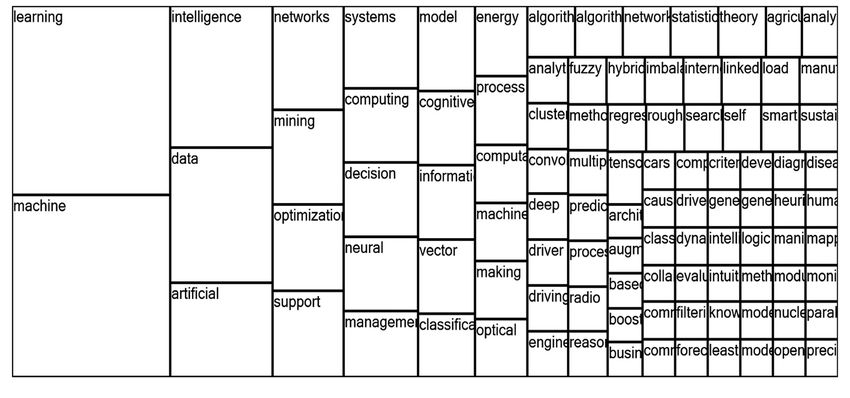
Sustainability 2020, 12, 492 3 of 26
The paper is organized as follows. Section 2 presents the proposed methodology and details the
research methodology adopted for the literature survey. Section 3 analyzes the main results of the
bibliometric analysis. Finally, in Section 4, the main contribution of the research is summarized.
2. Methodology
The methodological approach used mixes bibliometric, content analysis, and social network
techniques. In this study, a state-of-the-art research was conducted through the SCOPUS and Web
of Science databases. For the publication time span, the time from 1999 to 2019 was considered with
the intent to understand how the level of attention towards the topic has changed before and after
the introduction of Industry 4.0. The research methodology chosen for this study was a systematic
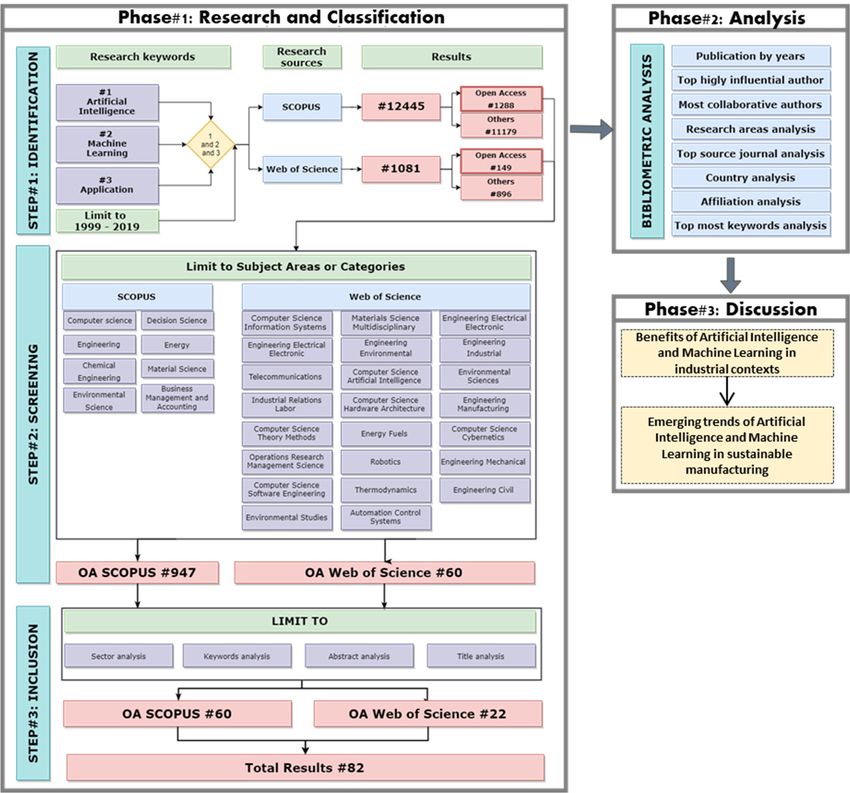
literature review [25]. The main phases of the study were as follows:
1. Phase 1: Research and Classification. The present phase was divided into three steps:
• Step 1: Identification;
• Step 2: Screening; and
• Step 3: Inclusion.
In phase 1, bibliometric data was collected (step 1). Then, a screening of the overall result was
carried out to identify which documents can be taken into consideration, in line with the research areas
deemed interesting and relevant (step 2). At the end of this step, the last step (step 3) aimed to select
the documents to be analyzed in detail.
2. Phase 2: Analysis. Once phase 1 was completed, the next phase was phase 2, which was the
analysis of the results. The approach used for the bibliometric analysis included:
• The use of indicators for the parameters studied; and
• SNA (social network analysis) for the keywords.
The indicators chosen to perform the analysis were total papers (TPs), which is the total number
of publications, and total citations (TCs), which is the total number of citations.
SNA finds application in various social sciences, and has lately been employed in the study of
various phenomena, such as international trade, information dissemination, the study of institutions,
and the functioning of organizations. The analysis of the use of the term SNA in the scientific literature
has undergone exponential growth in the use of this mode of computable representation of complex
and interdependent phenomena. For the purpose of the study, UCINET, NetDraw software was used,
which was expressly designed for the creation and graphic processing of networks, and was used to
represent the keywords in the network, and Excel for data input.
The software UCINET, NetDraw returned a sociometric network that describes the relationships
between the classes, that is, data entered as input.
Furthermore, NVivo 12 software, the leading program for computer-assisted qualitative analysis
(CAQDAS), was used to analyze keywords of all documents. In this specific case, it was used to
identify the possible links between the keywords of the various documents examined, developing
conceptual schemes from which to make interpretative hypotheses.
3. Phase 3: Discussion. At the end of the second phase, a third and final one followed, where the
results were discussed, and conclusions were drawn.
In Figure 1, the main phases and steps followed for the analysis are shown.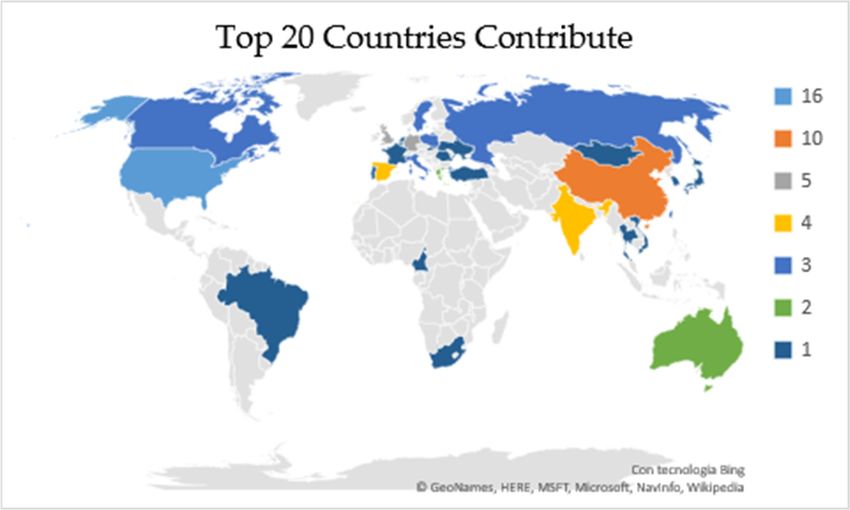
Sustainability 2020, 12, 492                                                                              4 of 26
Sustainability 2020, 12, x FOR PEER REVIEW                                                               4 of 24

                                             Figure 1.
                                             Figure 1. Process
                                                       Process flow
                                                               flow chart.
                                                                    chart.

3. Results of
3. Results of the
              the Bibliometric
                  Bibliometric Analysis
                               Analysis

3.1. Phase 1:
3.1. Phase  1: Research
               Research and
                        and Classification
                            Classification
      The
      The first
          first phase
                phaseconsisted
                       consistedofofthe
                                     thesearch
                                          searchfor documents,
                                                  for documents, which included
                                                                   which         thethe
                                                                          included   activities of collecting
                                                                                        activities            the
                                                                                                    of collecting
material  belonging   to the academic    universe.   This first phase was  divided into three  steps
the material belonging to the academic universe. This first phase was divided into three steps as     as follows.
follows.
3.1.1. Identification (Step 1)

3.1.1.For a comprehensive
       Identification       survey of the phenomenon, an investigation on the Scopus (SCP) and Web of
                      (Step 1)
Science (WoS) databases was carried out using Boolean operators. We began by making a search query
      For a comprehensive survey of the phenomenon, an investigation on the Scopus (SCP) and Web
on the Scopus and WoS databases with the general keywords “artificial intelligence” AND “machine
of Science (WoS) databases was carried out using Boolean operators. We began by making a search
learning” AND “application”, as shown in Table 1.
query on the Scopus and WoS databases with the general keywords “artificial intelligence” AND
      In order to maintain the consistency of the results, the same keywords were used in both databases
“machine learning” AND “application”, as shown in Table 1.
and a time horizon of 20 years was chosen, from 1999 to 2019.
      In order to maintain the consistency of the results, the same keywords were used in both
      The choice of keywords for performing the survey was based on the awareness that AI and ML
databases and a time horizon of 20 years was chosen, from 1999 to 2019.
can be an important tool in the effort to adopt responsible business practices in the context of smart
      The choice of keywords for performing the survey was based on the awareness that AI and ML
production. In this regard, it is worthy to note that with the increasingly urgent discussions of climate
can be an important tool in the effort to adopt responsible business practices in the context of smart
change, it seemed appropriate to focus our research on the topic of sustainability. Thus, the selection of
production. In this regard, it is worthy to note that with the increasingly urgent discussions of climate
papers also considered applications on sustainability.
change, it seemed appropriate to focus our research on the topic of sustainability. Thus, the selection
of papers also considered applications on sustainability.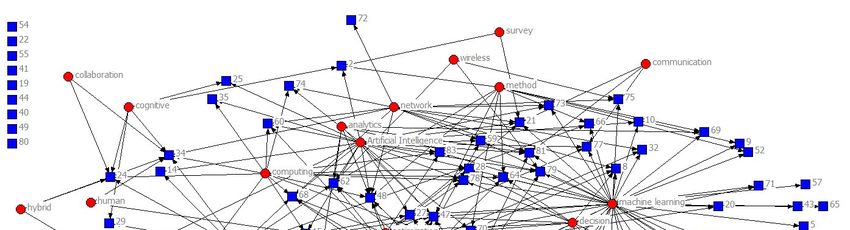
Sustainability 2020, 12, 492                                                                                        5 of 26

                                                Table 1. Keywords and time period.

                                               Keywords                       Time Period
                                      Artificial Intelligence
                                         Machine Learning                      1999–2019

                                               Application

      The search returned in total 13,512 documents.
      The results extracted by Scopus are numerically superior to Web of Science (WoS): 12,445 for the
first and only 1081 for the second one (Table 2).

                                    Table 2. Total results of research on Scopus and WoS.

                                                   Research Carried out on 2019
                      Source of research                        Scopus                  Web of Science
                               Results                          12,445                       1081

      The result is not entirely unexpected, and the reason is to be found in the fact that Scopus, being
an Elsevier product, collects data from all the other databases, in particular Science Direct and those
queried by the Scirus search engine, while Web of Science (WoS) collects fewer documents.
      From the documents extracted in Scopus, it was found that most of them are conference papers
(57.28%) and, subsequently, articles (33.85%).
      On the contrary, the research on Web of Science (WoS) underlines that most of the documents are
articles (46.12%) and, subsequently, proceedings papers (42.86%).
      All the document types are filled in Table 3.

                        Table 3. Distribution of document types in Scopus and Web of Science.

                               Web of Science                                           Scopus
         Document Types             Records         Contribute %    Document Types        Records    Contribute %
              Article                    481            46.12       Conference Paper        7128         57.28
        Proceedings paper                447            42.86            Article            4212         33.85
              Review                     133            12.76            Review             412           3.31
        Editorial material                16             1.53        Article in Press        194          1.56
         Meeting abstract                 2              0.19         Book Chapter           177          1.42
           Book chapter                   1               0.1       Conference Review        177          1.42
       Retracted publication              1               0.1             Book                90          0.72
                 -                         -               -            Editorial             27         0.22
                 -                         -               -              Note                10         0.08
                 -                         -               -              Letter               9         0.07
                 -                         -               -          Short Survey             9         0.07

     AI began working in the 1940s and researchers showed strong expectations until the 1970s when
they began to encounter serious difficulties and investments were greatly reduced.
     Since then, a long period began, known as the “AI winter” [26]: Despite some great successes,
such as IBM’s Deep Blue system, which in the late 1990s defeated the then chess world champion
Garri Kasparov, the study of solutions for AI has only come back for a few years. The push for a new
technological development has been given by the I4.0, which considered AI as one of the primary key
enabling technologies (KETs).
     From this period onwards, the literature has been enriched with documents, as shown in Figure 2.
Growth is apparent after 2011 when new technologies began to be implemented more frequently.
In fact, the Industry 4.0 term first appeared at Hannover Messe in 2011 when Professor Wolfgang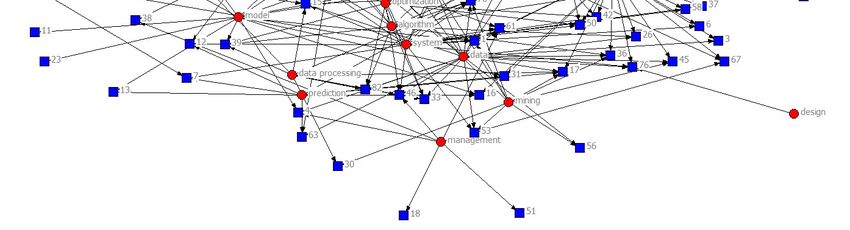
Sustainability 2020, 12, 492 6 of 26
Wahlster, Director
Sustainability 2020, and CEO
12, x FOR of REVIEW
PEER the German Research Center for Artificial Intelligence, addressed
6 of 24 the
opening ceremony audience.
Figure 2. Research growth on Scopus and Web of Science.
Figure 2. Research growth on Scopus and Web of Science.
In fact, this research indicates that over the time period considered (1999–2019), the number of
publishedSubsequently, the increase
articles remains almost in the adoption
constant of these
until 2013, ones
from has led
which researchers to
it undergoes ankeep pace with
increase.
the growth of I4.0 [27].
Subsequently, the increase in the adoption of these ones has led researchers to keep pace with the
growth of I4.0 [27].
3.1.2. Screening (Step 2)
3.1.2. Screening (Step
Trying to give2)
an overview of the topics and areas interface, in the screening phase, an analysis
of documents characterized by free access was chosen, excluding those that have restrictions, and to
Trying to give an overview of the topics and areas interface, in the screening phase, an analysis
restrict the field to the thematic areas of scientific interest.
of documents characterized by free access was chosen, excluding those that have restrictions, and to
With this in mind, the number of open access items has been drastically reduced (1288 results
restrict
forthe fieldand
Scopus to the
149thematic
for WoS) areas of scientific
and, also applying interest.
the filter related to the thematic areas (Table 4), it
With this in mind, the number of open
determined a further reduction: 947 for Scopus access
and 60 items has been drastically reduced (1288 results
for WoS.
for Scopus and 149 for WoS) and, also applying the filter related to the thematic areas (Table 4), it
determined a further reduction:Table 947 4. Subject
for Scopusareaand
filter60
onfor
Scopus
WoS.and WoS.
Subject Area
Scopus Table 4. Subject area filter on Scopus and WoS.
Web of Science (WoS)
Computer Chemical Computer Science Computer Science Artificial Automation Control
Science Engineering Information Subject
Systems Area Intelligence Systems
ScopusEnergy Materials Science Web of Science (WoS) Environmental
Engineering Environmental Sciences
Multidisciplinary Studies
Materials Chemical Computer
Engineering Science
Electrical ComputerScience
Computer Science Automation
Operations Control
Research
Computer Science Decision Science
Science
Engineering Information
Electronic
Systems Artificial Intelligence
Hardware Architecture
Systems
Management Science
Business Materials Science Environmental
Engineering
Environmental Energy Environmental Studies
Management Multidisciplinary
Telecommunications Industrial Sciences
Relations Labor Robotics
Science
and accounting
Engineering Electrical Computer Science Operations Research
Materials Science Decision Science
Engineering Environmental Engineering Manufacturing Thermodynamics
Electronic Hardware Architecture Management Science
Computer Science Theory
Business Engineering Industrial Energy Fuels
Environmental Methods
Industrial Relations
Management and Telecommunications Robotics
Computer Science
Science Engineering Civil Labor
Engineering Mechanical
accounting Cybernetics
Computer Science Software
Engineering Engineering
Multidisciplinary Sciences Thermodynamics
Engineering
Environmental Manufacturing
Computer Science
Engineering Industrial
Note how the number of filters applied is different. The databases, in fact, offer theEnergy
Theory Methods same Fuels
search
options, but, in the specific case of the thematic areas, the latter Engineering
are more numerousComputer
and structured
Science
Engineering Civil
on Web of Science (WoS) compared to Scopus. Mechanical Cybernetics
Computer Science Multidisciplinary
Software Engineering Sciences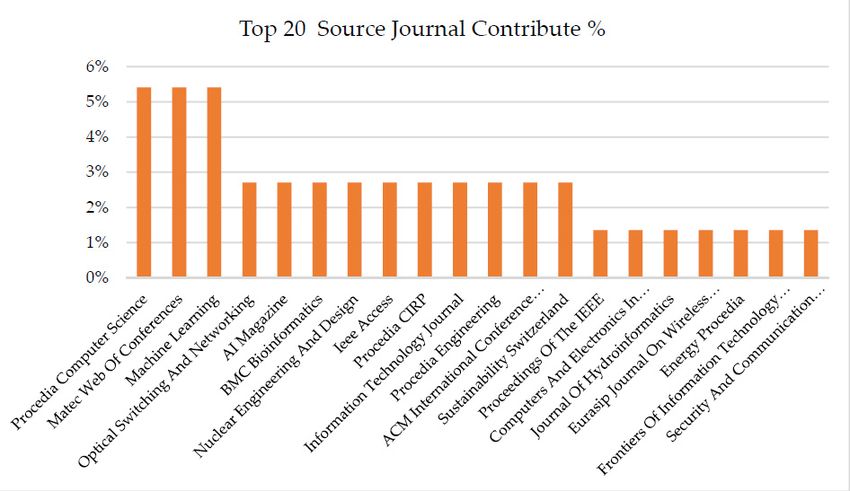
Sustainability 2020, 12, 492                                                                        7 of 26

     Note how the number of filters applied is different. The databases, in fact, offer the same search
options, but, in the specific case of the thematic areas, the latter are more numerous and structured on
Web of Science (WoS) compared to Scopus.

3.1.3. Inclusion (Step 3)
     At the end of the screening process, the inclusion step was started, which consisted in the selection
of documents, which was extracted from the last passage, destined to be included in the sample on
which bibliometric analysis was performed. In this review step, for the purposes of eligibility, we
examined the complete text of each document independently. For each article, we examined whether
there was interest from the academic world, and if it contained case studies or real applications,
proposals for new AI and ML algorithms, or possible future scenarios.
     Therefore, the final sample to be analyzed consisted of 60 documents for Scopus and 22 for WoS.

3.2. Phase 2: Analysis
     This section presents and discusses the findings of this review.
     First, an overview of the selected studies is presented. Second, the review findings according to
the research criteria, one by one in the separate subsections, are reported.

3.2.1. Top Highly Influential Analysis
      This section lists the most highly cited documents in WoS and Scopus. The list is structured by
research source, date, title, authors, source title, and top citation (TP) in WoS or Scopus, according
to the research source. The whole list is available in the Appendix A. Looking into the Appendix A,
it is possible underline that the document by Larrañaga, Calvo, Santana et al. in 2006 [28] has the
highest citation count of 298. This article reviews machine learning methods for bioinformatics and
it presents modelling methods. Moreover, the document year is 2006, so before I4.0 was introduced.
Therefore, having more years than today has an advantage in terms of diffusion. This means that it is
one of the most influential documents in the academic world, as it proposes some of the most useful
techniques for modelling, giving the document the opportunity to become a pioneer in the computer
science research area.
      Obviously, all documents before I4.0, in general, have more citations than the most recent
documents. However, it is significant to note that even recent documents have a very high number
of citations compared to the year of publication. This denotes the interest in the topic from the
scientific community.
      The citation analysis revealed that the first article that we can identify among the most cited in
the I4.0 period dates to 2016. The work, published by Krawczyk [29], proposes application models to
further develop the field of unbalanced learning, to focus on computationally effective, adaptive, and
real-time methods, and provides a discussion and suggestions on the lines of future research in the
application subject of the study. It received 119 citations. Moreover, an article published by Wuest,
Weimer, Irgens et al. [30] received much attention among the scientific community. It contributes by
presenting an overview of the available machine learning techniques.
      Finally, the citation analysis pointed out that the average number of citations of all documents is
16.58. This value is expected to increase rapidly considering the interest in the issues of ML and AI.

3.2.2. Publications by Years
      Consistent with what is defined in Section 3.1.1., the study shows that the number of items included
in the analysis is definitely low for the entire period before I4.0 and then suddenly increases, starting
in 2012. The data shown in Figure 3 also show two holes in the 2001–2008 and 2008–2011 intervals.
This means that the technological applications were limited before it became an enabling technology of
I4.0 in all respects, only to have a peak of technological implementation, as was foreseeable.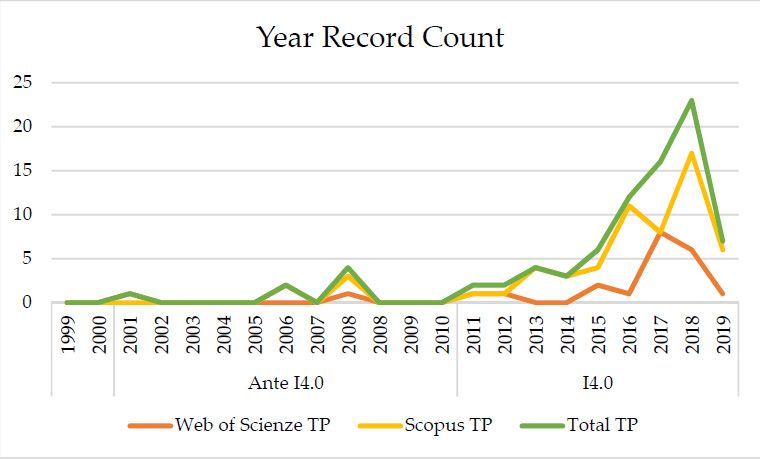
Sustainability 12, 492
2020, 2020,
Sustainability 12, x FOR PEER REVIEW 8 of 248 of 26
Sustainability 2020, 12, x FOR PEER REVIEW 8 of 24
Figure 3. Years of publications.
Figure 3. Years of publications.
With reference to 2019, the figure Figure refers 3.
toYears of publications.
the first months of the year, so it is plausible that during
With reference to 2019, the figure refers to the first months of the year, so it is plausible that
the year, there
With
will be a further increase in the documents in the literature. Furthermore, an increase is
during thereference to 2019,
year, there will bethe figure refers
a further to the
increase first
in the months ofinthe
documents theyear, so it isFurthermore,
literature. plausible that
an
expected
duringin
increase
the
the coming
is year,
years,
thereinwill
expected the be
in parallel
a further
coming
with the
increase
years,
growth
in the
in parallel with
of I4.0
documents
the growthin of
theI4.0
literature. Furthermore, an
increase is expected in the coming years, in parallel with the growth of I4.0
3.2.3. 3.2.3.
MostMost
Collaborative Authors
Collaborative Authors
3.2.3.analysis
The Most Collaborative
highlighted Authors
thatthat
most of of
publications
The analysis highlighted most publicationshave
havemore
more than
than one author.From
one author. Fromthis
thispoint
point of
view, of
it is
view, it is possible to identify the number of authors for each document. As shown in Figuremost
possible
The to
analysis identify the
highlighted number
that most of
of authors for
publications each
have document.
more than As
one shown
author. in Figure
From this 4,
point4, of
of view,
the manuscripts it is possible to
were produced
most of the manuscripts identify
wereby the number
groups by
produced of
rangingauthors
groupsfrom for each
twofrom
ranging document.
to five
twoauthors. As shown in
The indicators
to five authors. Figure 4,
chosen to
The indicators
most
chosen
perform of the
the to manuscripts
perform
analysis were werepapers
the analysis
total produced bypapers
were total
(TPs), groups
which ranging
(TPs), from
which
is the twototal
isnumber
total the to five authors.
number
of The indicators
of publications.
publications.
chosen to perform the analysis were total papers (TPs), which is the total number of publications.
Figure 4. Collaborative groups.
Figure4.4. Collaborative
Figure groups.
Collaborative groups.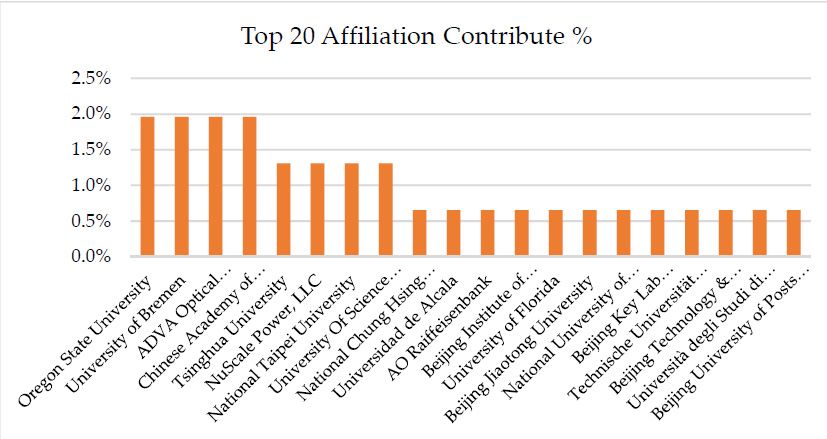
The total research area analysis collected from the 82 papers was 164 because each paper can be
considered as more than one research area analysis. Given the small number of documents identified
in the period before I4.0, the ranking refers mostly to the current industrial revolution. Also, in this
case, the result is consistent with the introduction of paradigm 4.0, which has intensified research and
Sustainability
the adoption       of12,
               2020,     492
                       technology.                                                                                     9 of 26

       The first thematic areas and disciplines that are at the top of the ranking are computer science,
engineering and biochemistry, genetics, and molecular Biology, respectively, with 29%, 23%, and 6%
3.2.4. Research Areas Analysis
of publications. Furthermore, the other disciplines identified for which applicative findings are found
      The total research
are considered                 area to
                      transversal    analysis   collected
                                        the first          from the 82
                                                   three disciplines      papers
                                                                        and  this iswas  164 because of
                                                                                     a consequence     each   paper
                                                                                                           I4.0.      can be
                                                                                                                 In terms   of
considered      as more     than  one research    area analysis.    Given  the small   number
the percentage contribution, the first three areas cover about 60% of the papers considered.    of  documents     identified
in theConsidering
        period before    theI4.0,
                              topthe
                                   20 ranking
                                       researchrefers
                                                  areas,mostly
                                                          given theto the current industrial
                                                                       frequency                revolution.
                                                                                    of the research            Also, in this
                                                                                                      areas’ distribution,
case,
Figure the5 result
             showsisa consistent    with
                         higher level       the introduction
                                        of concentration     in of
                                                                theparadigm    4.0,indicated
                                                                     disciplines     which has   intensified research and
                                                                                              above.
the adoption
       In fact, inofterms
                      technology.
                             of the percentage contribution, the first five areas cover about 70% of the papers
      The firstRegardless,
considered.        thematic areas      andcounting
                                 by only     disciplines  that are
                                                       research      at the
                                                                  areas     top once,
                                                                         found   of thethere
                                                                                         ranking
                                                                                              is a are
                                                                                                   totalcomputer
                                                                                                          of 27.     science,
engineering      and   biochemistry,
       This means two things:           genetics,   and  molecular    Biology, respectively,  with   29%,   23%,  and  6% of
publications. Furthermore, the other disciplines identified for which applicative findings are found are
       • The large number of fields in which this kind of research is involved; and
considered transversal to the first three disciplines and this is a consequence of I4.0. In terms of the
       • Most papers have a transversal approach, that is, the object of each research crosses more
percentage contribution, the first three areas cover about 60% of the papers considered.
than one field of application, thus involving more research areas.
      Considering the top 20 research areas, given the frequency of the research areas’ distribution,
Figure   5 shows
       This          a higher
              confirms           levelinterest
                           the wide     of concentration    in the disciplines
                                                in these subjects    from severalindicated
                                                                                     fields. above.

                                     Figure 5. Top 20 research areas contributions.
                                     Figure 5. Top 20 research areas contributions.
      In fact, in terms of the percentage contribution, the first five areas cover about 70% of the papers
3.2.5. Top Source
considered.           Journals
               Regardless,   byAnalysis
                                  only counting research areas found once, there is a total of 27.
      This means two things:
      In this section, the top 20 sources or journals that were published most frequently were extracted.
•     A journal
     The            is a time-bound
           large number     of fields inpublication   withofthe
                                          which this kind        objective
                                                              research       of promoting
                                                                        is involved;  and and monitoring the
progress
•           of the  discipline  it represents.
     Most papers have a transversal approach, that is, the object of each research crosses more than
      In this
     one       specific
           field        case, the total
                  of application,   thus source  journals
                                         involving   more detected
                                                           research from
                                                                    areas.the documents is 74, but, considering
the top 20, given the frequency of the source journals’ distribution, only the first 13 sources have more
thanThis    confirms
       one paper       the widewith
                    published,     interest in these
                                       a total       subjects
                                               percentage     from several
                                                            contribution   of fields.
                                                                              43% of the total.
      After analyzing the sources separately, the results obtained in the two databases were found to
3.2.5. Top Source Journals Analysis
not be the same. In WoS, the top source journal was IEEE Access with two publications while in
Scopus,   thesection,
      In this   top source  journals
                        the top        are Procedia
                                  20 sources         Computer
                                              or journals       Science,
                                                          that were      Matec Web
                                                                     published    mostoffrequently
                                                                                         Conferences, andextracted.
                                                                                                   were   Machine
Learning   with   four  publications,   which   contribute  5% of the total.
      A journal is a time-bound publication with the objective of promoting and monitoring the progress
of the discipline it represents.
      In this specific case, the total source journals detected from the documents is 74, but, considering
the top 20, given the frequency of the source journals’ distribution, only the first 13 sources have more
than one paper published, with a total percentage contribution of 43% of the total.
      After analyzing the sources separately, the results obtained in the two databases were found to
not be the same. In WoS, the top source journal was IEEE Access with two publications while in Scopus,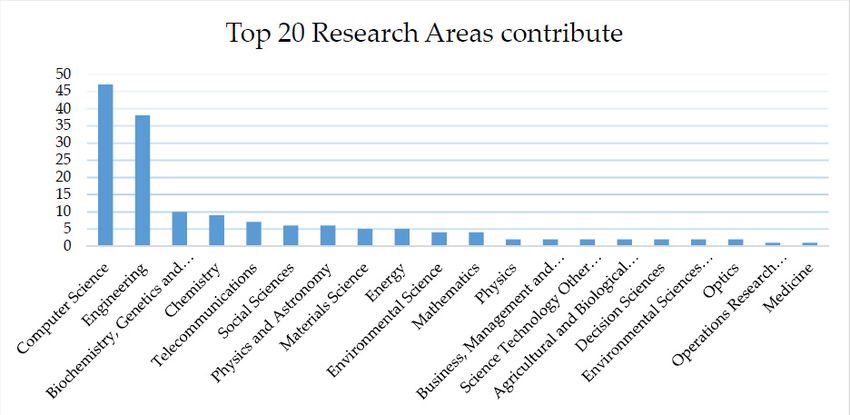
Sustainability 2020, 12, 492 10 of 26
Sustainability 2020, 12, x FOR PEER REVIEW 10 of 24
the top source journals are Procedia Computer Science, Matec Web of Conferences, and Machine Learning
with four publications,
Aggregating the datawhich contribute
collected from5% theoftwo
the total.
databases, the ranking moves to that obtained by
Aggregating
Scopus, making surethe that
dataIEEE
collected
Accessfrom
is nothe two databases,
longer the rankingbut
first in the standings, moves
only to that obtained
eighth, and that theby
Scopus, making sure that IEEE Access is no longer first in the standings, but only
former are precisely those of Scopus: Procedia Computer Science, Matec Web Of Conferences, and Machine eighth, and that the
former arewith
Learning, precisely thosenumber
the same of Scopus: Procedia Computer
of publications. Next,Science, Matec Web
the 10 source Of Conferences,
journals have a 3%and Machine
publication
Learning, withwhile
contribution the samethe number
rest have of publications.
a one-to-one Next, the 10 source
relationship (1%) withjournals
the have a 3% publication
corresponding source
contribution
journal. while the rest have a one-to-one relationship (1%) with the corresponding source journal.
The
The low level of
low level ofconcentration
concentrationofofthe the sources
sources suggests
suggests that
that there
there is a is a great
great dealdeal of interest
of interest in
in these
these topics from several scientific journals. As a matter of fact, it is foreseeable that
topics from several scientific journals. As a matter of fact, it is foreseeable that specialized sector specialized sector
sources (AI Magazine
sources (AI Magazine and and Machine
Machine Learning)
Learning) are are among
among the the first
first 13;
13; however,
however, itit is
is interesting
interesting toto note
note
that
that other
other sources
sources are
areinvolved,
involved, such
such as asSustainability
Sustainability Switzerland
Switzerland or or BMC
BMC Bioinformatics
Bioinformatics andand Nuclear
Nuclear
Engineering
Engineeringand
andDesign.
Design.
Figure
Figure 6 shows the
6 shows thetop
top2020source
sourcejournals
journalscontributions.
contributions.
Figure 6. Top 20 source journals contributions.
Figure 6. Top 20 source journals contributions.
3.2.6. Country Analysis
3.2.6. Country Analysis
The results that emerged through research on the two databases are consistent with each other.
In bothThecases,
results
in that
fact, emerged
the countriesthrough
thatresearch
give the on the two
greatest databases are
contribution consistent
to the researchwith each other.
are China and
In both
the Unitedcases, in fact,
States the countries
(Figure that is
8). The result give the greatest
obvious since incontribution
China and to thethe research
United are more
States, Chinathanand
thebillion
1.3 UnitedandStates
0.3(Figure
millions 8).of
The resultlive,
people is obvious since inand
respectively, China so and
therethe
areUnited
more States, more than 1.3
researchers in
billion
the andEuropean
single 0.3 millions of people
nations. live,on
Focusing respectively,
Europe, Germanyand so published
there are more
moreresearchers
papers thanthanany in the
other
single European
European country. nations.
This is notFocusing
a random onresult:
Europe,I4.0 Germany
was born inpublished
Germany, more
so thispapers
outcome than
wasany other
expected.
European the
However, country.
followingThisobservation
is not a randomcannotresult: I4.0 was
be ignored fromborn in Germany,
this data: The USAso this
and outcome
China carry was
the
expected.
first However,
two places in thethe
listfollowing
while it isobservation
not the same cannot be ignored
for European from thisEurope,
countries. data: The USA and
despite China
its talents
carry
and the first two
resources, places
has lost in the Presenting
ground. list while ititsisreport
not theonsame for European
artificial countries.
intelligence, Europe,
the French deputy despite
and
its talents and resources,
mathematician Cédric Villanihas lost ground.
declared Presenting
that, “Europe mustits report on artificial
be able to compete intelligence,
with China theand
French
the
deputy and mathematician Cédric Villani declared that, “Europe must be able to
United States while protecting its citizens and pointing the way to go on ethical issues”. If we are not compete with China
and thethe
careful, United States while
21st century rules protecting
will not be its citizens
defined and pointing
in Brussels, but inthe way to go
Shanghai. on ethical
Artificial issues”. isIf
intelligence
we are
also not marked
a land careful, bytheintense
21st century rules will
geopolitical rivalrynotthat
be defined in Brussels,
could redefine globalbut in Shanghai.
power relations.Artificial
intelligence
Even so,isregarding
also a land marked
Europe, it isby intense
worthy togeopolitical
also note that rivalry
since that
2017,could
France,redefine global
Germany, andpower
Italy
relations.
have intensified their trilateral cooperation to promote digitizing the manufacturing industry. In thisSustainability 2020, 12, x FOR PEER REVIEW 11 of 24
Sustainability 2020, 12, 492 11 of 26
Even so, regarding Europe, it is worthy to also note that since 2017, France, Germany, and Italy
have intensified
regard, in the neartheir trilateral
future, cooperation
we expect to promote
a significant digitizing
evolution of smartthe manufacturing
production industry.
initiatives In this
and therefore
regard,
an in the
increase near future,
in scientific we expect a significant evolution of smart production initiatives and
research.
therefore an increase in scientific research. distribution.
Figure 7 shows the country contribution
Figure 7 shows the country contribution distribution.
Figure 7.
Figure Top 20
7. Top 20 countries
countries contributions.
contributions.
3.2.7. Affiliation Analysis
3.2.7. Affiliation Analysis
The total number of affiliation detected from the 82 papers is 153. Also, in this case, considering
The total number of affiliation detected from the 82 papers is 153. Also, in this case, considering
the top 20, the frequency of the affiliation distribution shows that most papers have a one-to-one
the top 20, the frequency of the affiliation distribution shows that most papers have a one-to-one
relationship with the corresponding affiliation. Only the first four affiliations have three papers (2% of
relationship with the corresponding affiliation. Only the first four affiliations have three papers (2%
the contribution) and the second four have two papers (1.3% of the contribution). This result gives us
of the contribution) and the second four have two papers (1.3% of the contribution). This result gives
information about the wide interest on this subject from several universities and research centers all
us information about the wide interest on this subject from several universities and research centers
over the world. Then, the affiliation analysis confirms the result of the country analysis (Figure 8). In
all over the world. Then, the affiliation analysis confirms the result of the country analysis (Figure 8).
fact, if we try to sum the first eight affiliations by their own country, the outcome is:
In fact, if we try to sum the first eight affiliations by their own country, the outcome is:
• Nine papers from China;
• Nine papers from China;
• Six
• papers from from
Six papers Germany; and and
Germany;
• Five papers from the USA.
• Five papers from the USA.
In September
September2018,2018,thethemost
mostimportant
importantevent on artificial
event intelligence
on artificial was held
intelligence wasinheld
Shanghai. China
in Shanghai.
is very determined to focus on future technologies.
China is very determined to focus on future technologies.
For some
somemonths,
months, China has become
China the world’s
has become leading leading
the world’s power inpower
terms ofinscientific
terms publications.
of scientific
Late in the 20th
publications. century
Late in thetechnologies,
20th centuryChina chose to do
technologies, whatchose
China the English-speaking
to do what the people call a “frog
English-speaking
jump” and focus on 21st century technologies.
people call a “frog jump” and focus on 21st century technologies.
China, with
with its
its 800
800 million
millionInternet
Internetusers
usersand
andwithout
withoutanyanyprivacy
privacyprotection
protectionpolicy,
policy,hashas
access to
access
more personal
to more data
personal than
data thethe
than United States
United andand
States Europe.
Europe.Sustainability 2020,
Sustainability 2020, 12,
12, xx FOR
FOR PEER
PEER REVIEW
REVIEW 12 of
12 of 24
24
Sustainability 2020, 12, 492 12 of 26
Figure 8. Top 20 institute affiliations contributions.
Figure 8.
Figure 8. Top
Top 20
20 institute
institute affiliations
affiliations contributions.
contributions.
3.2.8. Top Keywords Analysis
3.2.8. Top
3.2.8. Top Keywords
Keywords Analysis
Analysis
Through NVivo 12, the top 20 keywords were extracted directly, which are those that always
appearThrough
Through NVivo 12,
NVivo
in association 12, the
withthe topdocument.
top
each 20 keywords
20 keywords were
were extracted
extracted directly,
directly, which
which are
are those
those that
that always
always
appear
appear in association
in association
Starting with
from thiswith each document.
each document.
classification, the graphic representation, a word cloud shape, of the keywords
Starting
Starting
(Figure 9) wasfrom
from this classification,
this classification,
extracted. the graphic
the
It can be noted graphic representation,
that therepresentation,
most used term aa word
word cloud shape,
cloud
is precisely shape, of
“machine”,of the
the“learning”,
keywords
keywords
(Figure
(Figure
and 9) was
9) was extracted.
extracted.
“intelligence”, whichItItthe
can
can be noted
be noted
software that the
that the most
represents most used
with used term
term
greater is precisely
is precisely
characters “machine”,
than“machine”,
all the other “learning”,
“learning”,
terms.
and “intelligence”, which the software represents with greater characters than all the
and “intelligence”, which the software represents with greater characters than all the other terms. other terms.
Figure 9.
Figure Top 20
9. Top
Top 20 keywords
keywords cloud
cloud contribution by NVivo
contribution by NVivo 12.
12.
The font
The font size
font size describes
size describes how
describes how much
how much the
the keyword
much the keyword is
is indexed. Another
indexed. Another mode of
Another mode
mode representation
of representation is
representation is
is
The keyword is indexed. of
the
the tree
tree words
words (Figure
(Figure 10).
10). Also, in
Also, in this
this case,
case, the
the most
most indexed
indexed words
words are
are those
those represented
represented in the
in the
the tree words (Figure 10). Also, in this case, the most indexed words are those represented in the
larger boxes.
larger boxes.
boxes.
largerSustainability 2020, 12, 492 13 of 26
Sustainability 2020, 12, x FOR PEER REVIEW 13 of 24
Figure 10. Top 20 keywords tree contribution by Nvivo 12.
Figure 10. Top 20 keywords tree contribution by Nvivo 12.
As expected, the most indexed words are obviously “learning”, “machine”, and “intelligence”,
with As
high numbers.the
expected, It is logical
most that among
indexed wordsthe arefirst results,“learning”,
obviously words that recall the technology
“machine”, itself were
and “intelligence”,
obtained,
with high but it is interesting
numbers. It is logical to note that words
that among referring
the first to other
results, wordsfields of AI applications
that recall the technology areitself
also
indexed. The reason is to be found in the fact that AI and ML are technologies that
were obtained, but it is interesting to note that words referring to other fields of AI applications are cross all the sectors
involved in I4.0
also indexed. Theand that, is
reason therefore,
to be found do not remain
in the fact circumscribed.
that AI and ML are technologies that cross all the
Specifically,
sectors involved words, suchthat,
in I4.0 and as “data”, “neural”,
therefore, do not“decision”, and “management”, are very or average
remain circumscribed.
indexed, demonstrating
Specifically, words,the fact as
such that AI also“neural”,
“data”, extends to“decision”,
many otherand sectors.
“management”, are very or
Another
average tool for
indexed, the analysis for
demonstrating thekeywords
fact that AIis the
alsoUCINET
extendssoftware, through
to many other which social networks
sectors.
analysis is carried out.
Another tool for the analysis for keywords is the UCINET software, through which social
Socialanalysis
networks network is analysis
carried out. (SNA), which is also often called social network theory, is a modern
technology of social relations.
Social network analysis (SNA), which is also often called social network theory, is a modern
SNA finds
technology application
of social relations. in various social sciences, and has recently been used in the study of
various
SNA phenomena, such as in
finds application international
various socialtrade, information
sciences, and hasdissemination,
recently been theused
studyinofthe
institutions,
study of
and the phenomena,
various functioning such of organizations.
as internationalThe analysis
trade, of the dissemination,
information use of the term theSNA
studyinofthe scientific
institutions,
literature shows that inofthe
and the functioning last five years,The
organizations. there has been
analysis ofexponential
the use of growth
the term of the
SNA useinofthe
thisscientific
mode of
computable
literature showsrepresentation
that in theof complex
last and there
five years, interdependent phenomena.
has been exponential The software
growth returns
of the use a graph
of this mode
representing a socio-metric network (Figure 11), which draws the relationships
of computable representation of complex and interdependent phenomena. The software returns that exist within thea
class.
graphEach relationship
representing is represented
a socio-metric by an oriented
network (Figure arrow.
11), which draws the relationships that exist
within the class. Each relationship is represented by an oriented arrow.Sustainability 2020, 12,
Sustainability 2020, 12, 492
x FOR PEER REVIEW 14 of
14 of 26
24
Figure 11. Keywords Network by UCINET Software.
Figure 11. Keywords Network by UCINET Software.
In Figure 11, nodes and leaves can be identified. The nodes are represented by red circles and are
In Figure 11, nodes and leaves can be identified. The nodes are represented by red circles and
correspond to the most common keywords, where the words “machine”, “learning”, “artificial”, and
are correspond to the most common keywords, where the words “machine”, “learning”, “artificial”,
“intelligence” have been united to form the key words “machine learning” and “artificial intelligence”.
and “intelligence” have been united to form the key words “machine learning” and “artificial
The leaves, on the other hand, are represented by blue squares and correspond to the articles. To
intelligence”.
facilitate reading, the document titles were not inserted, but the (Identification) ID count for each of
The leaves, on the other hand, are represented by blue squares and correspond to the articles.
them is shown in the Appendix A.
To facilitate reading, the document titles were not inserted, but the (Identification) ID count for each
The first thing that can be noticed is the isolation of many leaves that are not connected to the
of them is shown in the Appendix A.
nodes. This means that the corresponding documents are not described by the keywords represented
The first thing that can be noticed is the isolation of many leaves that are not connected to the
by the nodes. Really, they are characterized by keywords that have a frequency of the order of units.
nodes. This means that the corresponding documents are not described by the keywords represented
Another thing that easily jumps to the eye is a density that is larger around the keywords
by the nodes. Really, they are characterized by keywords that have a frequency of the order of units.
“machine learning”, “decision”, “data”, “algorithm”, “system”, “artificial intelligence”, “method”,
Another thing that easily jumps to the eye is a density that is larger around the keywords
and “optimization”. This density is reflected in the cloud and the box chart produced by NVivo 12.
“machine learning”, “decision”, “data”, “algorithm”, “system”, “artificial intelligence”, “method”,
Therefore, we can say that those are the words that most often appear in the documents analyzed,
and “optimization”. This density is reflected in the cloud and the box chart produced by NVivo 12.
emphasizing, once again, that they include terms that do not just refer to the technology object of study
Therefore, we can say that those are the words that most often appear in the documents analyzed,
but also to other fields of application.
emphasizing, once again, that they include terms that do not just refer to the technology object of
study
3.3. but 3:
Phase also to other fields of application.
Discussion
3.3. Phase
3.3.1. 3: Discussion
Benefits of Artificial Intelligence and Machine Learning in Industrial Contexts
From the analysis of the research carried out, the first information that emerged is that there is a
3.3.1. Benefits of Artificial Intelligence and Machine Learning in Industrial Contexts
growing importance of innovation and digitalization in products, services, and processes. Consequently,
From
it means thethe
that analysis
adoptionof the research carried
of advanced out, the technologies,
manufacturing first information
suchthat emerged
AI and ML, isisan
that there is
emerging
a growing
issue. importance
In other words, AI/ML of algorithms
innovationrepresent
and digitalization
an opportunity in to
products, services,
handle high and processes.
dimensional problems
Consequently,
and it means
data. The interest inthat the adoption
the subject of advanced
is extended manufacturing
to all scientific sectors,technologies,
but with a focussuchonAIcomputer
and ML,
is an emerging issue.
science and engineering. In other words, AI/ML algorithms represent an opportunity to handle high
dimensional
The most problems
significantandbenefits
data. Theof interest
using AIinandthe subject is extendedsectors
ML in industrial to all scientific
include: sectors, but
(1) Greater
with a focus on computer science and engineering.
innovation, (2) process optimization, (3) resources optimization, and (4) improved quality.
The most
After all, AIsignificant
with ML is benefits of using
one of the AI and ML
most important in industrial
technologies sectors
today and is include: 1) Greater
transforming the
innovation,
economy and2)society,
processasoptimization,
demonstrated 3) by
resources
the overoptimization,
340,000 patent and 4) improved
applications quality.
filed since the 1950s.
After all, AI with ML is one of the most important technologies today and is transforming the
economy and society, as demonstrated by the over 340,000 patent applications filed since the 1950s.Sustainability 2020, 12, 492 15 of 26
Other information that emerged is about the authors and affiliation. Many of these are in a 1:1 ratio
compared to the selected documents and this supports the fact that there is no interest in technological
applications in one direction, but that, once again, the interest is very wide in the scientific community.
Furthermore, it can be said that the countries most interested in scientific research are the USA,
China and European countries. This result is not a surprise.
In terms of investment, the effort currently being deployed by the United States and China to
acquire dominance in the AI sector is far superior to that of other countries. More specifically, China
has clearly stated its ambition to become a world leader in AI by 2030 [31]. Among the Chinese plans,
of absolute interest is the “Made in China 2025” plan, dedicated to the manufacturing sector; the
“Internet +” plan is also dedicated to smart manufacturing and innovation.
A direct consequence of the above considerations could be having new generations of researchers
who will contribute to future comparisons, accompanied by new questions for investigations.
3.3.2. Emerging Trends of Artificial Intelligence and Machine Learning in Sustainable Manufacturing
From the perspective of sustainability, the analysis highlighted that the new paradigm of smart
manufacturing has the potential to bring fundamental improvements in the industry by addressing
the issue of scarce resources and improving productivity.
In fact, the survey pointed out a growing interest on applications related to green manufacturing
and sustainable development, proving that AI/ML play an important role in increasing sustainability
through the intelligent utilization of materials and energy consumption (i.e., reduction of energy
consumption and pollutant emissions, environmental footprint monitoring and evaluation, etc.).
Furthermore, it emerged that AI/ML algorithms present a wide array of applications that provide
an opportunity for sustainable development, which will involve several stakeholders from different
countries and sectors, including inventory and supply chain management, predictive maintenance,
and production.
In particular, Pérez-Ortiz, Jiménez-Fernández, Gutiérrez et al. [32] reviewed the most important
classification algorithms applied to renewable energy (RE) problems. The main use of algorithms
is as a tool for predictive analysis and consequently for data preprocessing, result interpretation, or
evaluation in order to improve energy and resource management.
In this context, it also emerged that AI/ML have been successfully utilized in various processes’
optimization, applications in manufacturing, and predictive maintenance in different industries.
The work published by Lieber, Stolpe, Konrad et al. [33] represents a good research within steel
industry production. It proposes an approach for automatically preprocessing value series data to
improve the quality of the process and products. It means that AI/ML techniques were found to
provide promising potential for improved quality control optimization in manufacturing systems.
Appropriate adoption of AI/ML technologies will promote sustainable manufacturing and the
formation of a new generation of intelligent manufacturing, including all areas that characterize a
sustainable process, ranging from the supply chain management to quality control, to predictive
maintenance, to energy consumption.
Table 5 summarizes the main areas in sustainable manufacturing, their respective key objectives,
and the main AI/ML applications.
However, the relationship between I.4 technologies, AI/ML, and sustainability demands a more
conceptual and empirical investigation. This is corroborated by an article recently published in Nature
Sustainability by the director of the Earth Institute at Columbia University, Jeffrey Sachs, and other
experts, and the so-called Fourth Industrial Revolution (made of artificial intelligence and other digital
technologies) is even cited as one of the six transformations necessary to achieve the sustainable
development goals [34].Sustainability 2020, 12, 492 16 of 26
Table 5. Main areas in sustainable manufacturing.
Main Areas in Sustainable Key AI/ML
Manufacturing Objective Applications
Improves transparency, accelerates
Ready product available in the
Supply Chain Management decision-making, and produces accurate
appropriate place at a specific time
demand forecasting
Recognize the early signs of
potential production failures
Improves the response time and allows
Quality Control within the shortest terms in order
eliminating possible failures
to save resources and sustain
operational efficiency
Detects possible production
Creates accurate forecasts as to when
Predictive Maintenance malfunctions that may cause
the machinery must be repaired
product quality issues
Improves excessive use of certain
materials, redundant production scrap
Recommendations that will strike
Energy consumption waste, inefficient supply chain
a balance in energy use
management, logistics, and unequal
distribution of energy resources.
4. Conclusions
This research focused on the study of the state of the art of AI and ML applications, selecting
literature on what has now become a particularly hot topic in scientific research. The literature available
on any subject is now wide and a complete coverage of all the documents published with respect to a
particular topic can be challenging or even impossible. Therefore, a systematic selection of the most
relevant literature was implemented. This document provides a systematic review of applications
in various scientific fields using ML techniques. For the selection of documents, objective and clear
methods of investigation were used, independent of the experience of the researchers. Among the
objectives of the document, it aimed to not only provide a comprehensive framework on the literature
on the research of AI and ML but also a starting point for integrating knowledge through research in
this area and to suggest future research paths. It is important to underline that this document was
produced using only two databases, i.e., WoS and Scopus, in which only documents with open access
were included. There are, therefore, many other documents with restricted access and other indexing
databases, such as Google Scholar, that could be integrated for future research.
Author Contributions: All authors contributed equally to this work. All authors have read and agreed to the
published version of the manuscript.
Funding: This work has been conducted under the framework of the Italian project “Linee Guida per
I4.0-Campania”—funded by Regione Campania within POR FSE 2014–2020 Asse IV “Capacità istituzionale e
amministrativa” objectives 18 (RA) 11.3 and 21 (RA) 11.6.
Conflicts of Interest: The authors declare no conflict of interest.You can also read