3 Apatite as a Monitor of Dynamic Magmatic Evolution at Torfajökull Volcanic Center, Iceland
←
→
Page content transcription
If your browser does not render page correctly, please read the page content below
3
Apatite as a Monitor of Dynamic Magmatic Evolution at Torfajökull
Volcanic Center, Iceland
Lissie Connors1, Tamara L. Carley1, and Adrian Fiege2
ABSTRACT
Apatite, a powerful geochemical tool for understanding the evolution of volatile and trace elements in magmatic
systems, is a common accessory phase in Icelandic rocks. Torfajökull, a historically active Icelandic volcano
erupting apatite‐bearing magmas, exhibits a unique compositional history; from more‐evolved peralkaline
rhyolites (Pleistocene) to less‐evolved metaluminous rhyolites (Holocene). Geochemical analyses of apatites and
volcanic glasses from five eruptions spanning Torfajökull’s rhyolitic history (384 ka to 1477 CE) contribute new
insights into the volatile (H-F-Cl-S) and rare earth element (REE) evolution of the system. Some of the apatites
contain exceptionally high REE compositions (≤ 20 wt% REE2O3), with concentrations decreasing over time.
This temporal trend corresponds to changing magma compositions and saturation of different REE‐bearing
phases, as mafic–felsic magma mingling becomes more prominent. Volcanic glass and apatite compositions indi-
cate increasing volatile abundances in magmas through time. Sulfur concentrations are low in apatite (20–100 μg
g−1), as is expected in reduced systems, with the exception of elevated sulfur in apatite from the 67 ka eruption
(20–570 μg g−1). Magma oxidation induced by volcanic degassing (further exemplified by Cl–OH contents in
apatite), perhaps explains this signature. The success of this apatite‐focused investigation of Torfajökull reveals
the potential of apatite to elucidate magmatic and volcanic processes in Iceland.
3.1. INTRODUCTION Mathez & Webster, 2005; Webster et al., 2009; Webster
et al., 2017). Apatite can also incorporate significant
Apatite—commonly (Ca5(PO4)3(F,Cl,OH))—is distinctive amounts of rare earth elements (REE), reaching total con-
in its ability to incorporate all major magmatic volatiles in tents of > 1 wt% oxides (Hughes & Rakovan, 2002) and
its crystal structure as major (F, Cl, OH) or trace elements rarely even > 10 wt% oxides (Rønsbo, 1989). These features
(S, C, Br) (Hughes & Rankovan, 2002; Marks et al., 2012; make apatite a powerful geochemical tool for investigating
Piccoli & Candela, 2002). Here, the structural incorpora- the volatile, redox, and REE evolution of magmas (e.g.
tion of sulfur (S) is influenced by the oxygen fugacity of the Belousova et al., 2002; Fleet & Pan, 2002; Konecke et al,
system (e.g., S2− or S6+; Konecke et al, 2017b). Experimental 2017b; Piccoli & Candela, 2002; Rønsbo, 1989; Webster &
studies of apatite have constrained volatile partitioning in Piccoli, 2015).
apatite–melt and apatite–melt–fluid systems for a contin- The geochemistry of apatite has been used to study a
ually expanding series of magmatic conditions and compo- range of processes in magmatic systems from a variety of
sitions (e.g. Doherty et al., 2014; Konecke et al, 2017b; tectonic regions, and from terrestrial to extraterrestrial envi-
ronments (e.g. Boyce et al., 2010; McCubbin et al., 2011;
Parat et al., 2002; Piccoli & Candela, 2002; Streck & Dilles,
1
Department of Geology and Environmental Geosciences,
Lafayette College, Easton, PA, USA 1998). In conjunction with matrix glass compositions, apa-
2
Department of Earth and Planetary Sciences, American tite geochemistry can be used to quantify pre-eruptive volatile
Museum of Natural History, New York, NY, USA contents, and estimate gas emissions of volcanic systems,
Dynamic Magma Evolution, Geophysical Monograph 254, First Edition. Edited by Francesco Vetere.
© 2021 American Geophysical Union. Published 2021 by John Wiley & Sons, Inc.
6162 DYNAMIC MAGMA EVOLUTION
providing new perspectives on volcanic degassing (e.g., while fractional crystallization from a basaltic parent
Boyce & Hervig, 2008a; Scott et al., 2015; Stock et al., 2016). magma dominates at cool, off‐rift volcanoes. This hypo-
Despite the valuable contributions that apatite studies thesis has been supported and refined in subsequent,
have made globally, and despite apatite’s ubiquity as an isotope‐based studies (e.g., Carley et al., 2020; Martin &
accessory phase in Icelandic magmas (e.g., Carmichael, Sigmarsson, 2010; Schattel et al., 2014). The concept of
1964; Moorbath et al., 1968; Wood, 1978), Icelandic localized tectonics is complicated, including an ongoing
apatite has rarely been investigated (c.f. Bergþórsdóttir, history of rift relocations and rift jumps, through Iceland’s
2018). This study focuses on Torfajökull, an active central thickened crust. For example, there is evidence of extinct
volcano in southern Iceland. Torfajökull has ~400 kyrkyr abandoned rifts dating to 26–15 Ma in the Westfjords
eruptive history (the longest documented activity of any (Hardarson & Fitton, 1997; Martin & Sigmarsson, 2010;
historically active Icelandic volcano; McGarvie et al., Sæmundsson, 1979), and the propagating Eastern Volcanic
2006), and prior studies indicated pronounced changes in Zone (EVZ) is thought to be establishing the future loca-
geochemistry over time (from peralkaline to metalumi- tion of the Mid‐Atlantic Ridge in south‐central Iceland.
nous; Gunnarsson et al., 1998; Jónasson, 2007; McGarvie, This suggests that throughout its life cycle, changing tec-
1984; McGarvie et al., 2006; Zellmer et al., 2008). Apatites tonic conditions of a central volcano may impact silicic
from five eruptions spanning Torfajökull’s history, from petrogenesis and other magmatic processes.
384 ka to its most recent eruption in 1477 CE, are used to
examine the volatile and trace elemental evolution of this 3.2.2. Torfajökull Volcanic Complex
rhyolitic system and to explore the possibility of redox
effects as a function of degassing. Torfajökull, a historically active volcano in south‐
central Iceland (Figure 3.1), is unique among Icelandic
3.2. GEOLOGICAL BACKGROUND volcanoes. Its tectonic setting is transitional and dynamic,
located on the margin of the nonrifting Southern Flank
3.2.1. Silicic Volcanism in Iceland Zone (SFZ)—at the convergence of the South Iceland
Seismic Zone (SISZ) and the southward‐propagating EVZ.
Iceland has been constructed by productive magmatism During its > 400 kyr eruptive history (McGarvie et al.,
and volcanism at the intersection of the Mid‐Atlantic Ridge 2006), Torfajökull (Figure 3.2) has erupted significant
and the Icelandic hotspot (Pálmason & Sæmundsson, 1974; volumes of rhyolitic material (~250 km3; Gunnarsson
Schilling, 1973; Vink, 1984; Vogt, 1971). Icelandic crust is et al., 1998), making it the greatest concentration of
significantly thicker than typical oceanic crust (25–40 km vs. exposed silicic rock in Iceland (Jónasson, 2007) and thus in
3–7 km; Bjarnason, 2008), and contains an unusual abun- the modern ocean (Gunnarsson et al., 1998).
dance of silicic material for an oceanic island (≥ 10% of Individual rhyolitic eruptions contributing to this
exposed crust contain > 6 wt% SiO2; Jonasson, 2007; large silicic center span across the Pleistocene–Holocene
Walker, 1963). The processes resulting in the formation boundary. Older (≥ 67 ka), larger volume (> 1 km3), rhy-
of this overly thickened silicic crust has long been studied olites erupted subglacially to form ridges and tuyas,
and debated (Bindeman et al., 2012; Carley et al., 2014; while the younger (< 67 ka), smaller volume (< 1 km3),
Carmichael, 1964; Furman et al., 1992; Jónasson, 1994; rhyolites erupted subaerially as lava flows (McGarvie
Macdonald et al., 1987, 1990; Martin & Sigmarsson, 2007, et al., 2006). Torfajökull rhyolites exhibit dramatic,
2010; Nicholson et al., 1991; Prestvik et al., 2001; Sigmarsson well‐documented, compositional changes with time
et al., 1991; Sigurdsson & Sparks, 1981; Wood, 1978). (Figure 3.2). The oldest, Pleistocene rhyolites have the
Icelandic rhyolites are concentrated at central volcanoes, highest SiO2 and alkalinity. The Pleistocene rhyolites
i.e., localized, polygenetic features that erupt magmas of have undergone more extensive post-emplacement
diverse compositions (e.g., Thordarson & Larsen, 2007). alteration compared to the younger units. The younger,
Fissures often accompany central volcanoes, i.e., laterally Holocene rhyolites are progressively less evolved, with
extensive mafic eruption features following the strike of the lower SiO2 and alkalinity as well as increasing evidence
rift. Central volcanoes typically consist of ~20–30% rhyo- of interaction with mafic magmas (e.g., Blake, 1984;
lite, but there are rare examples of central volcanoes with Gunnarsson et al., 1998; Larsen, 1984; McGarvie, 1984;
substantially greater abundances of rhyolite (e.g., > 80% at McGarvie et al., 1990; McGarvie et al., 2006; Mørk,
Torfajökull; Gunnarsson et al., 1998; Walker, 1963). 1984; Zellmer et al., 2008). This compositional “devolu-
The local tectonic setting of a central volcano (e.g., on‐ tion” observed at Torfajökull is thought to be a function
rift, off‐rift) may have significant influence on its particular of Torfajökull’s transitional tectonic setting, with
rhyolite generation process. Martin and Sigmarsson (2007) increasing influence of the southward‐propagating EVZ
hypothesized that the anatexis or extensive assimilation at ~70 ka. Specifically, the younger Torfajökull rhyolites
dominates silicic petrogenesis at hot, on‐rift volcanoes, have experienced magma mixing with tholeiitic basaltAPATITE AS A MONITOR OF DYNAMIC MAGMATIC EVOLUTION AT TORFAJÖKULL 63
KR
TFZ
a
5M
–1
24
NVZ
a
M
–7
15
SVB
MIB
VB
O
Z
EV
SISZ 64°N
B
RV
N
100 km 16°W
< 0.7 Ma Active Rift Torfajökull
0.7 to 3.3 Ma Propagating Rift Glaciers
3.3 to 8.5 Ma Extinct Rift
8.5 to 15 Ma Volcanic Belt
> 15 Ma Fracture Zone
Figure 3.1 Geologic map of Iceland. Torfajökull is located in southern Iceland at the junction of the Eastern Volcanic
Zone (EVZ) and the South Iceland Seismic Zone (SISZ). Ages of volcanics are indicated by shades of gray (i.e., white
youngest and black oldest). Major tectonic features: WVZ, Western Volcanic Zone; NVZ, Northern Volcanic Zone;
RVB, Reykjanes Volcanic Belt; KR, Kolbeinsey Ridge; SVB, Snæfellsness Volcanic Belt; OVB, Öræfi Volcanic Belt;
MIB, Mid‐Iceland Belt; TFZ, Tjörnes Fracture Zone. [Modified from Thordarson & Hoskuldsson (2002).]
from the rift‐related Veiðivötn‐Bárdarbunga fissure are still poorly constrained in subglacial rhyolitic erup-
swarm (e.g., Blake, 1984; Larsen, 1984; McGarvie, 1984; tions (e.g., Owen et al., 2012, 2013).
Zellmer et al., 2008). Icelandic rhyolites have traditionally been character-
ized as H2O‐poor (e.g., Jónasson, 2007; Macdonald et al.,
3.2.3. The Role of Volatiles at Torfajökull 1990; Sigurdsson, 1977), but feldspar‐hosted melt
inclusions (MIs) from the 67 ka subglacial rhyolites from
Volatiles within magmatic systems can influence magma Torfajökull contain up to 4.8 wt% H2O (Owen et al.,
evolution at depth, dictate eruption styles, and control the 2013). Chlorine concentrations measured from the
environmental impacts of volcanic eruptions (e.g., De same volcanic edifice indicate the degassing of a relatively
Vivo et al., 2005; Oppenheimer et al., 2003; Wallace Cl‐rich magma (Owen et al., 2013). These findings sug-
et al., 2015). Understanding the abundance and compo- gest that Icelandic rhyolites (at least at Torfajökull) are
sition of these volatile constituents within a magma body not as volatile‐depleted as previously thought. However,
is important, as they are the drivers of the ascent, effer- it remains unclear how these volatiles have evolved,
vescence, expansion, and fragmentation of magma in degassed, or been replenished throughout Torfajökull’s
explosive eruptions (e.g., Lowenstern, 2003)—all of which ~400 kyr rhyolitic history. There is even greater u
ncertainty64 DYNAMIC MAGMA EVOLUTION
19°00W
64°00N
N
10 km
Rhyolitic edifices Edifices related to this study
Namshraun (ITN, 1477 CE) Fissure
Holocene subaerial
Hrafntinnuhraun (ITHN, 871 CE)
Caldera wall
Ring fracture rhyolite subglacial Rauðufossafjöll (IETR, 67 ka)
Gvendarhyrna (IETG , 278 ka) Glacier
Pleistocene subglacial
Habarmur (IETHB, 384 ka)
Figure 3.2 Geologic map of Torfajökull volcano, showing the distribution of rhyolites: light gray, older rhyolitic
subglacial eruptives; gray, ring fracture rhyolites; black, recent postglacial lava flows. Fissures indicated on the
western region of the map illustrate the intersection of Torfajökull with the Veidivötn Fissure Swarm. [Modified
from McGarvie et al. (2006), Sæmundsson & Friðleifsson (2001), and Owen et al. (2013).]
regarding the S budget and evolution of the system, as is typically occupied by P5+ and exhibits a four‐fold
the S contents of these MIs were all below the analytical coordination, but the X‐site can also accommodate cat-
detection limit (Owen et al., 2013). ions such as Si4+, C4+, S6+, As5+, and V5+ (Hughes &
Rankovan, 2002; Riker et al., 2018). The Z‐site, or anion‐
3.2.4. Apatite as a Tracer of Volatile Evolution column site, is occupied by the halogens F−, Cl− and OH−,
but can also contain reduced S species (e.g., HS−, S2−;
Apatite is a common accessory phosphate mineral that Kim et al., 2017; Konecke et al, 2017b). The wide variety
has been observed in a variety of igneous and metamor- of cations able to substitute within the apatite structure
phic rocks globally (Piccoli & Candela, 2002; Webster & yields diverse apatite compositions in natural systems
Piccoli, 2015; and references therein). Minerals within the (e.g., Hughes & Rakovan, 2002). Apatite is a developing
apatite group have a general formula of A10(XO4)6Z2 geochemical tool in tracing the evolution of F, OH, and
where the A‐site is primarily occupied by Ca2+, but can Cl in magmatic and volcanic systems (eg., Boyce &
also accommodate Sr2+, Pb2+, Ba2+, Mg2+, Mn2+, Re2+, Hervig, 2008b; Scott et al., 2015). Studies of S speciation
REE3+, Eu2+, Cd2+, and Na2+ (among others). The X‐site in the apatite structure (e.g., S2− or S6+) enable the use ofAPATITE AS A MONITOR OF DYNAMIC MAGMATIC EVOLUTION AT TORFAJÖKULL 65
(a) (b) slower (Peng et al., 1997). Complex zonation of S is thus
relatively common in volcanic apatites (Peng et al., 1997;
500 μm 500 μm Streck & Dilles, 1998; Scott et al., 2015). This suggests
that the S signature of a magma is better retained in the
apatite structure relative to the halogens, and zonation of
S may correspond to a record of changing T, P, and fO2
pl cpx within the system (see also Konecke et al, 2017a; Konecke
an
an et al, 2017b).
xe
ve Previous studies of volatiles in magmatic systems
(including Torfajökull) have been largely based on the com-
(c) (d) positions of silicate MIs (e.g., Head et al., 2011; Johnson
et al., 2011; Owen et al., 2013; Portnyagin et al., 2007). Melt
inclusions are vulnerable to post-entrapment modifications
such as alteration, leakage, devitrification, and shrinkage
5 μm 20 μm
bubble formation (Baker et al., 2005; Bucholz et al., 2013;
Esposito et al., 2014; Lloyd et al., 2013; Lowenstern, 1995;
Moore et al., 2015; Wallace et al., 2015), which may
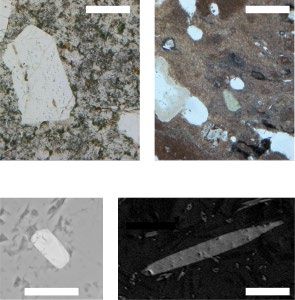
Figure 3.3. Example thin‐section photographs of eruptive compromise their primary compositional signatures. The
units IETHB and ITHN and backscatter electron (BSE) images formation of vapor bubbles within slower cooling MIs, as
of apatites. Thin‐section photographs in plane polarized light well as diffusion processes causing the migration of H2O
of (a) peralkaline rhyolitic units older than 67 ka (IETHB,
towards the melt–crystal interface, can lead to misrepresen-
IETG) with euhedral anorthoclase (an) phenocrysts and
homogeneous matrix and (b) metalluminous rhyolitic units
tation of primary volatile contents (Audétat & Lowenstern,
67 ka and younger (IETR, ITHN, ITN) with a diverse mineral 2014; Baker et al., 2005).
assemblage and evidence of mingling between rhyolitic and Apatite is relatively more resistant to weathering and
basaltic magmas (pl, plagioclase; ol, olivine; cpx, clinopy- alteration compared to volcanic glasses (Piccoli & Candela,
roxene; xe, xenolith; vs, vesicle). (c) BSE image of a small 2002). Therefore, it may preserve a more representative
anorthoclase‐hosted inclusion. (d) BSE image of a large record of volatile and trace elemental concentrations
matrix‐hosted apatite. within a magma. Considering the significant influence of
temperature on apatite saturation (Harrison & Watson,
1984; Piccoli & Candela, 2002; Pichavant et al., 1992;
apatite as an oxybarometer in magmatic and hydro- Webster & Piccoli, 2015), the timing of apatite crystalli
thermal systems (Kim et al., 2017; Konecke et al, 2017a; zation can differ from the MI entrapment, recording
Konecke et al, 2017b; Sadove et al., 2019). Future potentially an alternative range of post-entrapment and
advances in measuring and understanding C in apatite syneruptive volatile contents. Furthermore, chemical zona-
may make this mineral an even more powerful tracer for tion is often preserved in apatite phenocrysts and may
volatiles in magmas (Riker et al., 2018). record temporal volatile changes not preserved in MIs.
Apatite is a particularly useful geochemical tracer in fel- Hence, even for magmatic systems with well‐characterized
sic systems, where it saturates early and crystallizes over a MI compositions, apatite can contribute a valuable new
wide temperature range (often > 200°C; Harrison & temporal perspective.
Watson, 1984; Piccoli & Candela, 2002; Pichavant et al.,
1992; Webster & Piccoli, 2015). 3.2.4.1. Equilibrium Dissociation Constant versus
Most volcanic apatites are compositionally unzoned Nernst Partitioning Coefficient
with respect to halogens (e.g., Piccoli & Candela, 2002; The compositional relationship between a mineral
Webster & Piccoli, 2015). However, intracrystalline vari- phase and a coexisting melt under equilibrium conditions
ability with respect to trace elements and halogens is can be described by either equilibrium dissociation
sometimes identified in volcanic apatite (e.g., Boyce & constants (Kd) or by Nernst‐type partitioning coefficients
Hervig, 2008a, 2008b; Parat et al., 2002). Experiments (D). Nernst partitioning coefficients describe a ratio bet-
performed by Brenan (1993) show relatively fast time- ween an elemental constituent in a melt versus a mineral
scales of halogen diffusion in the apatite structure. phase, while equilibrium dissociation constants (Kd)
Halogen zoning in apatite is therefore interpreted to be describe the exchange relationship between multiple ele-
evidence of short residence times of apatite in preerup- ments found at the same structural site. As a first-order
tive magmas with heterogeneous halogen compositions approximation, Kd values are applied and required to
(Boyce & Hervig, 2008). For other volatiles, such as describe apatite–melt chemical relationships for major
S, processes of diffusion in apatite are comparably structural components that compete with each other.66 DYNAMIC MAGMA EVOLUTION
This includes F, OH, and Cl on the anion column site glass compositions versus modeled melt compositions
(e.g., KdOH–Cl = Clmelt × OHap/OHmelt × Clap; for details see can then be used to investigate degassing processes during
Webster et al., 2017). Thus, the relative concentrations of an eruptive event (i.e., Scott et al., 2015).
F, OH, and Cl in the melt dictate the F–OH–Cl composi-
tion of a crystallizing apatite. For example, the proportion 3.3. METHODS
of F in apatite greatly exceeds F in the melt, because F is
compatible in the apatite structure (Webster & Piccoli, 3.3.1. Sample Selection and Preparation
2015). The relative concentrations of F, OH, and Cl
cannot serve as a direct proxy for volatiles in the melt Five samples are used to represent the ~400 kyr silicic
because the relative compatibilities of F, OH, and Cl vary history of the Torfajökull volcanic system (384 ka to 1477
as a function of melt compositions and conditions (Boyce CE). The samples represent subglacial and subaerial erup-
et al. 2014; Webster et al., 2017). tions, as well as peralkaline and metaluminous magma
In contrast, as a first-order approximation, Nernst compositions. Unit locations are shown in Figure 3.2, and
partitioning coefficients only apply for trace, and some- exact coordinates of sample sites, and a brief overview of
times minor, elements. Their incorporation should not sample characteristics, are provided in Table 3.1.
affect other (major) elements, or this effect should at Rock chips with dimensions of approximately 2 × 2 cm
least be negligible (i.e., D(X) = C(X)ap/C(X)melt), where were mounted in epoxy and polished for subsequent
C(X) is the concentration the element of interest in the analyses. For scanning electron microscopy (SEM) char-
apatite or melt). The D values are more appropriate for acterization, the polished samples were coated in gold
trace elements in apatite, such as S, whose incorporation using a Denton Desk V sputter coater. For electron probe
(on the order of 100–1000s of μg g−1; e.g., Konecke et al, microanalysis (EPMA), the gold coating was removed
2017b; Parat et al., 2011) has minimal effects on the melt and replaced with carbon using a Denton Vacuum
in comparison to major elements, such as F and Cl Benchtop Turbo Carbon Coater.
(Boyce et al., 2014).
Experimentally derived equilibrium dissociation 3.3.2. Bulk Rock Geochemistry
constants and partition coefficients for rhyolitic apatites
(i.e. Doherty et al., 2014; Konecke et al, 2017a; Webster Samples of silicic lava from the five units of interest
et al., 2009, 2017) can be used to approximate the condi- were sent to Activation Laboratories (ActLabs, Ancaster,
tions of a magma body in a setting such as Torfajökull. Ontario, Canada) for commercial lithogeochemical anal-
By comparing apatite estimates of volatiles in the melt ysis. Upon arrival at ActLabs, samples were pulverized in
with measured glass compositions, the applicability of a steel mill. Major and trace element concentrations were
apatite partition coefficients can be assessed for Icelandic then measured by multiple techniques (analytical package
systems. Differences in volatile components in measured code: 4E‐Research+ICP/MS): inductively coupled plasma
Table 3.1 Sample Names, Locations, and Ages
Sample Unit Epoch Agea Location Composition ASIb
ITN Namshraun Holocene 1477 CE 27W 0595465 Metaluminous rhyolite 0.87
710064
Hjorsey 1955
ITHN Hrafntinnuhraun Holocene 870 CE 27W 0583860 Metaluminous rhyolite 0.92
7094213
Hjorsey 1955
IETR Rauðufossafjöll Pleistocene 67 ka 27W 0576365 Peralkaline rhyolite 0.88
7095290
WGS 1984
IETG Gvendarhyrna Pleistocene 278 ka 27W 0597859 Peralkaline rhyolite 0.87
7097451
WGS 1984
IETHB Harbarmur Pleistocene 384 ka 27W 0600092 Peralkaline rhyolite 0.87
7094232
WGS 1984
Note. a Ages from McGarvie et al. (2006). b Aluminum Saturation Index, calculated from Frost and Frost (2008).APATITE AS A MONITOR OF DYNAMIC MAGMATIC EVOLUTION AT TORFAJÖKULL 67
optical emission spectrometry (ICP‐OES), instrumental relatively increased by 2.6% during the correction. This
neutron activation analysis (INAA), inductively coupled correction affected 36 out of 109 analyses, clearly indi-
plasma mass spectrometry (ICP‐MS) and X‐ray fluores- cated in Table SM2. The settings for S result in a detection
cence spectrometry (XRF). Results, which were verified by limit of ~25 μg g−1 when applying the Ancey et al. (1979)
ActLabs using a suite of internationally recognized stan- method. Line transects of point analyses were programmed
dards, are summarized in Table SM1 (see link in to measure chemical variation across some larger (e.g.,
Supplementary Material (SM) section). The results for > 20 μm diameter) apatite grains, using on average a 2 μm
two units (ITN, ITHn) have been published previously step size. Multiple point analyses were also collected at the
(Carley et al., 2011). rims and cores of larger crystals. In smaller crystals (e.g.,
< 10 μm) only core measurements were possible.
3.3.3. Scanning Electron Microscopy For the matrix glass analyses, the electron microprobe
was calibrated to measure Na, K, Fe, Mg, Al, Si, Ca, Ti,
Samples were characterized by using a Phenom ProX Mn, P, F, Cl, and S. The standards used for the calibration
Desktop SEM at the Acopian Engineering Center at were MgF2 (F), jadeite (Na), orthoclase (Al, K), scapolite
Lafayette College. Apatite crystals suitable for EPMA were (Cl), rutile (Ti), diopside (Si, Ca, Mg), rhodonite (Mn),
located and identified through a combination of backscat- fayalite (Fe), FeS (S), and Durango apatite (P). The glasses
tered electron (BSE) imaging and energy dispersive spectros- were analyzed with an acceleration voltage of 15 kV and a
copy (EDS; used for elemental mapping and spot analyses). beam size of 2 μm. Fluorine, Na, K, and Fe were analyzed
Phosphorus element maps were created at an acceleration using a beam current of 2 nA. The beam current was
voltage of 10 kV using a focused beam. Phases rich in P were increased to 10 nA for the analyses of Mg, Al, Si, Ca, Ti,
further investigated by using EDS spot analyses (15 kV, Mn, and P, and to 40 nA for the analyses of S and Cl. Peak
focused beam) to accurately identify apatite crystals. count times were 5 s for volatiles and trace elements, and
300 s for S. The reliability and precision of the glass analyses
3.3.4. Electron Probe Microanalysis was verified by measuring reference glasses (e.g., VG‐2;
Jarosewich et al., 1980). Sodium migration was negligible;
Samples were analyzed using a Cameca SX100 electron i.e., the Na contents in the reference glasses were repro-
microprobe at the American Museum of Natural History duced within 1σ uncertainty of ±0.15 wt%. Representative
in New York City. We followed the procedure applied by EPMA data are listed in Table 3.2 (apatites) and Table 3.3
Konecke et al, 2017a for the apatite analyses. The electron (glasses). All EPMA data are available in Table SM2
microprobe was calibrated to measure 17 elements in apa- (apatites) and Table SM3 (glasses).
tites, in major and trace quantities (P, Ca, F, Cl, S, Ba, Ce,
La, Nd, Fe, Mg, Mn, Al, K, Na, Si, Ti, and Sr). The refer-
ence materials used for calibration were Durango apatite
(P, Ca), MgF2 (F), scapolite (Cl), barite (Ba, S), CePO4 Table 3.2 Average Major and Volatile Element Compositions
(Ce), LaPO4 (La), NdPO4 (Nd), fayalite (Fe), rhodonite of Torfajökull Glasses
(Mn), orthoclase (Al, K), jadeite (Na), diopside (Si, Mg), Sample
Elements
rutile (Ti), and strontianite (Sr). Elements in apatite were
(wt%) ITN ITHN IETR IETG IETHB
analyzed by using an acceleration voltage of 15 kV, a
beam current of 10 nA and a beam size of 2 μm for all SiO2 64.83 69.33 73.95 78.93 73.48
elements besides S. For S, a beam current of 40 nA and a Al2O3 14.85 14.08 12.14 10.26 12.80
K2O 3.54 4.75 4.25 4.32 5.22
beam size of 1 μm was used on two spectrometers. The
Na2O 5.72 5.16 5.15 4.32 5.53
peak count times were 5 s for F, 10 s for P and Ca, 20 s for CaO 2.23 1.06 0.42 0.03 0.05
Ce, La, Nd, Fe, Mn, K, Si, Ti, Ba, and Sr, 60 s for Cl, as FeO 4.10 2.09 1.69 1.78 2.57
well as 300 s for S. Fluorine, along with major elements MgO 0.42 0.21 0.07 0.21 0.01
Ca and P, were analysed first. This procedure, in MnO 0.09 0.04 0.07 0.02 0.04
combination with the low beam current and low count TiO2 0.55 0.47 0.41 0.10 0.09
time minimized the effect of F migration during analyses P2O5 0.12 0.09 0.04 0.02 0.02
(e.g., Goldoff et al., 2012; Konecke et al, 2017b; Stock F 0.11 0.25 0.23 0.04 0.05
et al., 2015; Stormer et al., 1993). The reliability and pre- Cl 0.14 0.20 0.10 0.01 0.02
cision of the apatite analyses was confirmed by frequent SO2 0.11 0.10 0.08 0.02 0.02
monitoring of Durango apatite; e.g., the F content was Total 96.80 97.82 98.62 99.86 99.88
AST (°C)a 845 890 865 830 779
typically reproduced within 1σ uncertainty of ±0.3 wt%.
However, a linear, time‐interpolated drift correction had Note. a Apatite saturation temperature calculated from
to be applied for one session, where F in Durango apatite average glass compositions (Piccoli & Candela, 1994).Table 3.3 Representative Analyses of Torfajökull Apatites (25th, 50th, and 75th Percentiles Based on Fluorine Compositions) for Each Eruptive Unit (ITN, ITHN, IETR, IETG, IETHB) Elements ITN ITHN IETR IETG IETHB (wt %) 25th 50th 75th 25th 50th 75th 25th 50th 75th 25th 50th 75th 25th 50th 75th P2O5 41.11 39.82 41.82 41.78 39.80 40.28 37.07 40.80 38.30 32.01 31.57 30.27 38.28 32.12 33.72 CaO 50.60 51.17 50.19 52.10 52.14 50.76 54.44 49.94 51.71 43.87 41.52 41.15 51.76 42.88 42.95 SiO2 1.64 1.45 1.40 1.17 1.47 1.46 0.97 1.56 1.14 6.35 5.81 7.26 2.32 7.24 5.00 Na2O 0.99 0.03 0.30 0.02 0.04 0.07 0.05 0.07 0.21 0.44 0.42 0.63 0.01 0.46 0.36 K2O 0.14 0.14 0.08 0.12 0.13 0.10 0.21 0.38 0.20 0.20 0.23 0.20 0.28 0.27 0.19 Al2O3 0.10 0.07 0.11 0.09 0.14 0.15 0.03 0.10 0.04 0.60 0.30 0.62 0.05 0.33 0.33 FeO 0.56 0.49 0.57 0.43 0.61 0.59 0.43 0.41 0.36 BDL BDL BDL 0.19 BDL BDL MgO 0.12 0.10 0.14 0.14 0.12 0.19 0.15 0.06 0.14 0.04 0.28 0.16 0.02 0.00 0.00 MnO BDL BDL 0.02 BDL BDL BDL BDL BDL BDL BDL BDL BDL BDL BDL BDL TiO2 0.06 0.03 0.11 0.05 0.04 0.05 0.17 0.08 0.21 BDL BDL BDL BDL BDL BDL SrO 0.03 BDL 0.05 0.00 BDL BDL 0.06 BDL BDL 0.07 0.05 0.10 BDL 0.02 0.03 BaO BDL BDL BDL 0.03 BDL 0.02 0.06 BDL BDL 0.05 0.07 0.04 0.03 0.04 0.02 La2O3 0.45 0.49 0.05 0.37 0.57 0.67 0.50 0.52 0.43 3.10 2.84 2.57 1.07 2.38 2.50 Ce2O3 1.23 1.18 0.35 1.05 1.20 1.36 1.23 1.61 1.33 7.81 6.88 7.25 2.66 5.93 6.52 Nd2O3 0.49 0.51 0.05 0.45 0.53 0.52 0.53 0.73 0.61 3.92 3.45 3.63 1.26 3.15 3.51 Total REE* 2.16 2.18 4.35 1.87 2.29 2.55 2.27 2.87 2.37 14.83 13.17 13.45 4.98 11.46 12.53 SO2 BDL BDL 0.06 0.01 0.01 0.01 0.07 0.04 BDL BDL 0.02 BDL BDL 0.00 0.00 F 2.40 2.84 3.35 3.31 3.46 3.63 2.72 3.30 3.63* 2.43 3.33 3.67 1.91 3.15 3.64 Cl 0.34 0.24 0.28 0.21 0.27 0.27 0.12 0.19 0.10 0.02 0.03 0.02 0.01 0.01 0.01 OH* 0.34 0.24 0.28 0.58 0.30 0.10 1.17 0.52 0.00 1.36 0.30 0.00 2.17 0.88 0.06 Total 100.33 98.58 98.93 101.31 100.52 100.12 98.82 99.89 98.78 100.92 96.82 97.57 99.89 98.65 98.85 O = F,Cl 1.12 1.25 1.48 1.44 1.52 1.59 1.17 1.47 1.71 1.03 1.41 1.55 0.83 1.33 1.33 Total 100.67 98.29 97.90 100.44 99.30 98.63 98.82 98.94 97.06 101.26 95.71 96.02 101.23 98.20 97.38 Note. BDL, below detection limit. * Total REE, La2O3+Ce2O3+NdO3 * OH calculated stoichiometrically using method from Ketcham (2015)
APATITE AS A MONITOR OF DYNAMIC MAGMATIC EVOLUTION AT TORFAJÖKULL 69
3.3.5. Data Analysis 2.0
1.8
The EPMA data were filtered to ensure only “clean”
(i.e., single phase) measurements were included in the 1.6 Deloneite
final data assessment. Mixed analyses (i.e., measurements
1.4
of apatite grains contaminated with signals from adjacent
phases) were identified by elevated Si, Na, and K con- 1.2
P/Ca (apfu)
tents. These elements are rarely present in high abundance
1.0
in apatite (i.e., above detection limit), and thus these
analyses were removed from the data set. To further eval- 0.8 Apatite
uate the validity of measurements, the Ca, P, and anion
0.6
(F–OH–Cl) site occupation was verified. Here, atoms per
formula unit (apfu) were calculated on the basis of 26 0.4
anion sites in the apatite structure (Ca10(PO4)6(F,Cl,OH)2; Britholite
0.2
see Ketcham, 2015) and are listed in Table SM1. The total
apfu values for the P‐site were calculated using the sum of 0
P, Si, and Ti values. Data points with P‐site totals lower EMP Analyses
than 5 or higher than 7 apfu were excluded from the data
Figure 3.4 Evaluation of the EPMA apatite data. The P/Ca
set. The total apfu values for the Ca‐site were calculated
apfu ratios of the filtered data set are shown in comparison to
using the sum of the Ca, La, Ce, Nd, Fe, Mn, Na, Ba, Sr, P/Ca apfu ratios of end‐member apatite (Ca5(PO4)3(F,Cl,OH)),
and Al values (for common substitution mechanisms, see britholite ((Ce,Ca,Th,La,Nd)5(SiO4,PO4)3(OH,F)), and deloneite
Pan & Fleet, 2002). Contents of Mn (detection limit: (NaCa2SrCe(PO4)3F).
~900 μg g−1), Ba (~2000 μg g−1), Al (~250 μg g−1), and Sr
(~1400 μg g−1) in apatite were typically below their mea-
sured detection limit, having negligible contributions to the absolute values may be affected, the F–Cl–H trends
the Ca‐site totals. All Ca‐site totals lower than 9 and recorded by the apatites should remain intact.
higher than 11 were excluded from the data set. We high- The OH contents within the apatites were estimated
light that the remaining analyses show the P/Ca apfu based on stoichiometry, due to the inability of the electron
ratio typical for apatite (Figure 3.4). Thus, possible con- microprobe to measure H concentrations. This method is
tributions by the host phase (glass or feldspar) to the applied frequently in the literature (e.g., Doherty et al.,
analyses are negligible as their P/Ca apfu ratios are vastly 2014; Goldoff et al., 2012; Piccoli & Candela, 2002;
different. Similarly, accessory REE phases such as britho- Stoppa & Liu, 1995) and was recently refined by Ketcham
lite, chevkinite, and deloneite are characterized by signifi- et al. (2015). The calculations assume that all halogen
cantly different P/Ca apfu ratios (0.18, 0, and 1.5, sites within the crystal structure are occupied, allowing
respectively). Analyses with anomalously high apfu F use of the measured F and Cl contents for the estimation
values (> 2.45 apfu) were removed, as these values greatly of OH.
exceed what is stoichiometrically possible for an apatite Glass analyses with unreasonably low totals for (mostly)
crystal. The filtered data set contains 138 apatite analyses. degassed matrix glass (e.g., < 96%) were excluded. Glass
Besides signal contamination from nearby phases, we data points with apparent contamination from other
suggest that uneven surfaces and cracks (both common in phases, as determined by characteristics such as high Fe
the samples from Torfajökull and relating to the fragile (> 6%), Ca (> 2%), or Al (> 15%) were removed from the
nature of the samples) are the main reason for nonstoi- final data set, which contains 48 analyses (Table SM1).
chiometric nature of some discarded analyses.
High F measurements with values between 2.15 and 3.4. RESULTS
2.45 apfu were corrected, calculating a maximum F value
assuming an OH concentration of zero. This was done by 3.4.1. Petrography
subtracting the Cl values from 2 apfu, the maximum
occupancy of the halogen sites within apatite. Data The oldest samples (IETHB, 384 ka; IETG, 278 ka) are
points with corrected F values (25 out of 129 analyses) highly altered porphyritic rhyolites with devitrified matrices.
are indicated by an asterisk in Table SM2. The high F Samples from the subglacial Pleistocene rhyolites are sim-
contents measured in several samples indicate some beam ilar to one another in texture and mineralogy, although
damage (Goldoff et al., 2012), resulting in an overestima- IETHB is more visibly altered than IETG. Matrix‐hosted
tion of F and an underestimation of OH, where the latter phenocryst phases include large anorthoclase crystals
was calculated based on stoichiometry. However, while (≤ 5 mm in diameter) and augite. In both of these units,70 DYNAMIC MAGMA EVOLUTION
a patites exist in low abundances and are almost exclusively microscopic mixing and mingling features (e.g.,
hosted in large anorthoclase phenocrysts (Figure 3.3). The Figure 3.3).
apatites are typically small (often < 5 μm), rarely reaching
diameters of 10 μm. Additional mineral inclusions present 3.4.3.1. Major Elements Contents of Matrix Glasses
within anorthoclase phenocrysts are chevkinite, pyrrhotite, The matrix glasses (Table 3.3 and Figure 3.5) corre-
augite, and ilmenite. One apatite microphenocryst, ~8 μm spond to trends in bulk‐rock data, exhibiting a progres-
in length, was identified in the highly altered matrix of sive decrease in SiO2 content and an increase in CaO,
sample IETG. No other matrix‐hosted apatites were identi- Na2O, TiO, MgO, and P2O5 with decreasing age. Notably,
fied in samples older than 67 ka. K2O contents in the matrix glasses are the highest (4.1–
The sample from the 67 ka eruption (IETR) is also a 5.3 wt%) in the 67 ka (IETR) and 871 CE (ITHN) erup-
porphyritic rhyolite, showing few signs of alteration. The tions, but comparably low (2.6–4.5 wt%) in the 384 ka
matrix is glassy and poor in microlites, with phenocryst (IETHB), 278 ka (IETG), and 1477 CE (ITN) eruptions.
phases including plagioclase, augite, ilmenite, apatite, and Concentrations of FeO are low (0.83–2.77 wt%) in the
zircon. Larger phenocrysts are glomeratic, with plagio- 384 ka (IETHB), 278 ka (IETG), 67 ka (IETR), and 871
clase phenocrysts exhibiting sieve textures. Mafic enclaves CE (ITHN) samples, but high (2.51–5.56 wt%) in the
consisting of olivine‐bearing tholeiitic basalt are distrib- most recent eruption (1477 CE; ITN).
uted throughout the sample. Apatites in this sample are
dominantly present as isolated phenocrysts within a 3.4.3.2. Volatile (F, Cl, S) Contents of the Matrix
glassy matrix, but are also present in lower abundances as Glasses
inclusions in plagioclase phenocrysts and glomerocryst Volatile (F, Cl, S) contents in the matrix glasses show
masses. Of all units, apatites in sample IETR are the most significant variability from unit to unit, and within
abundant and largest (up to 200 μm in length). individual units (Table 3.3 and Figure 3.5i–k). For each
The two youngest samples (ITHN, 871 CE; ITN, 1477 unit, concentrations of volatiles in the matrix glasses
CE) are vesicular and porphyritic with glassy rhyolitic, increase with increasing SiO2 content.
microlite‐rich, matrices. As with the 67 ka sample, basaltic Chlorine values are below the detection limit (~60 μg
enclaves are distributed throughout these young samples, g−1 Cl) in samples older than 67 ka. In the 67 ka unit
thus, bulk‐rock geochemistry reflects a SiO2 less than that (IETR), Cl ranges from below the detection limit up to
associated with rhyolite (i.e., the bulk‐rock analyses clas- 1560 μg g−1 Cl (average ~1010 μg g−1 Cl). In the 871 CE
sify these samples as dacite). Mineral phases include pla- unit (ITHN), Cl values are the highest, ranging from
gioclase, augite, ilmenite, apatite, and zircon. These phases 1130 to 3170 μg g−1 Cl (average 1950 μg g−1 Cl). The 1477
typically occur as isolated phenocrysts in the matrix, and CE unit (ITN) shows Cl values from 860 to 1680 μg g−1 Cl
as glomerocrysts. Plagioclase and augite phenocrysts show (average 1420 μg g−1 Cl).
thin bright rims in BSE images and exhibit sieve textures In samples older than 67 ka, F values are lower than
and embayments. Within these units apatites are predom- detection limit. Fluorine values are highest in the 67 ka
inantly matrix hosted, with rare plagioclase‐hosted apatite unit (IETR), reaching values up to 6000 μg g−1 F (average
inclusions. Apatites are abundant and large (up to 100 μm 2340 μg g−1 F). In the 871 CE unit (ITHN), F values range
in length) when compared to those in the oldest samples from 1230 to 3460 μg g−1 F (average 2490 μg g−1 F). In the
(IETHB, IETG), but are not as abundant and large com- 1477 CE unit (ITN), values range from below detection
pared to those in the 67 ka sample (IETR). limit (BDL) to 2730 μg g−1 F (average 1080 μg g−1 F).
The S contents in the matrix glasses are typically higher
3.4.2. Bulk Rock Compositions in the younger samples (Figure 3.5j). Samples older than
67 ka have S values ranging from BDL to 230 μg g−1 S
The data set includes five bulk‐rock analyses across the (average 80 μg g−1 S). The 67 ka eruption (IETR) shows S
five studied units (Table 3.1). Temporal trends in bulk values from 240 to 590 μg g−1 S (average 390 μg g−1 S).
composition feature decreasing SiO2 and K2O, consistent Sulfur values are the highest in the 871 CE unit (ITHN),
Na2O, and increasing Al2O3, FeO, CaO, MgO, TiO2, and ranging from 240 to 2000 μg g−1 S (average 490 μg g−1 S).
P2O5 over time (Figure 3.5). In the 1477 CE sample S values range from 290 to 650 μg
g−1 S (average 530 μg g−1).
3.4.3. Glass Compositions
3.4.4. Apatite Hosts and Apatite Compositions
The data set includes 48 matrix glass analyses across
the five units studied (Table 3.3; Table SM3). All units are The filtered data set includes a total of 138 analyses
characterized by compositionally heterogeneous matrix collected on 48 apatites from the five units studied (see
glasses (Figure 3.5), which is consistent with macro‐ and Table SM2).(a) (b)
18 9
8
16
Al2O3 (wt %) 7
Na2O (wt %)
14
6
12
5
10
4
8 3
60 65 70 75 80 85 60 65 70 75 80 85
SiO2 (wt %) SiO2 (wt %)
(c) (d)
7 7
6
6
5
5
FeO (wt %)
K2O (wt %)
4
3
4
2
3
1
0 2
60 65 70 75 80 85 60 65 70 75 80 85
SiO2 (wt %) SiO2 (wt %)
(e) (f)
3.5 2.0
3.0
1.5
2.5
MgO (wt %)
CaO (wt %)
2.0
1.0
1.5
1.0
0.5
0.5
0.0 0.0
60 65 70 75 80 85 60 65 70 75 80 85
SiO2 (wt %) SiO2 (wt %)
Figure 3.5 Major elements and volatiles in bulk rock samples and matrix glasses. (a)–(h) Harker diagrams showing
major element variation (Al2O3, Na2O, FeO, K2O, CaO, MgO, TiO2, P2O5) in measured volcanic glasses (small dia-
monds) and in the bulk samples (large squares). (i)–(k)Volatile contents (F, S, and Cl, respectively) are displayed for
the matrix glasses. The concentrations of SiO2 and K2O generally decrease with time, while the concentrations of all
other major elements increase with time. Concentrations of volatile elements are lowest for samples older than
67 ka, and relatively higher for samples 67 ka and younger: F exhibits the highest contents at 67 ka, and Cl exhibits
the highest contents at 871 CE. Bulk rock data for ITN and ITHN were previously published by Carley et al. (2011).72 DYNAMIC MAGMA EVOLUTION
(g) (h)
0.8 0.20
0.6 0.15
TiO2 (wt %)
P2O5 (wt %)
0.4 0.10
0.2 0.05
0.0 0.00
60 65 70 75 80 85 60 65 70 75 80 85
SiO2 (wt %) SiO2 (wt %)
(i) (j)
0.6 800
600
0.4
F (wt %)
S (µg/g)
400
0.2
200
0.0 0
60 65 70 75 80 85 60 65 70 75 80 85
SiO2 (wt %) SiO2 (wt %)
(k)
0.35
0.30 Namshraun (ITN, 1477 CE)
0.25 Hrafntinnuhraun (ITHN, 871 CE)
Rauðufossafjöll (IETR, 67 ka)
0.20
Cl (wt %)
Gvendarhyrna (IETG , 278 ka)
0.15
Habarmur (IETHB, 384 ka)
0.10
Bulk-rock composition
0.05
Glass composition
0.00
60 65 70 75 80 85
SiO2 (wt %)
Figure 3.5 (Continued)APATITE AS A MONITOR OF DYNAMIC MAGMATIC EVOLUTION AT TORFAJÖKULL 73
F
Namshraun (ITN, 1477 CE)
90 10 Hrafntinnuhraun (ITHN, 871 CE)
80 20 Rauðufossafjöll (IETR, 67 ka)
70 30 Gvendarhyrna (IETG , 278 ka)
Habarmur (IETHB, 384 ka)
60 40
Phenocryst-hosted apatite
50 50
Matrix-hosted apatite
40 60
30 70
20 80
10 90
Cl*10 90 80 70 60 50 40 30 20 10 OH
Figure 3.6 Apatite halogen ternary plot showing F, Cl, and OH compositions of Torfajökull apatite hosted in
matrix glass (circles) and in feldspar phenocrysts (triangles). Compositions are expressed as atoms per formula
unit (apfu). Open icons indicate rim analyses on crystals large enough for multiple analyses. The Cl contents are
multiplied by 10 for illustrative purposes.
Except for one matrix‐hosted apatite, all apatites from 67 ka (ITHN, ITN) have the highest Cl contents, ranging
the oldest two units (> 67 ka; IETHB and IETG) are from 0.11 to 0.40 wt% Cl (ITHN, average 0.29 wt% Cl) and
anorthoclase hosted, whereas the majority of apatites from 0.13 to 0.34 wt% Cl (ITN, average 0.26 wt% Cl),
from units ≤ 67 ka (IETR, ITHN, ITN) are matrix hosted. respectively. Chlorine zonation was identified only in the
Based on the data set available, a correlation between 67 ka apatites, where core analyses show slightly lower Cl
host phase and apatite compositions is not observed (i.e., concentrations (average 0.13 wt% Cl) than rim analyses
Figures 3.6–3.8). Dissolution–reprecipitation features, (average 0.18 wt% Cl). This core–rim distinction may be pre-
the presence of nearby REE phosphates, REE‐depleted sent in apatites from other units that were too small to mea-
(or enriched) areas in apatite, or other features forming as sure transects. In apatites older than 67 ka, the calculated
a consequence of metasomatic alteration were not OH values are highly variable, ranging from 0 to 2.45 wt%
observed (Harlov, 2015; e.g., Figure 3.3). Due to the small OH for unit IETHB (average 0.70 wt% OH) and to 1.75
size of apatite phenocrysts measured, zoning patterns wt% OH for unit IETG (average 0.13 wt% OH). The OH
could not be identified with confidence. values in the 67 ka eruption range from 0 to 3.26 wt% OH
(average 0.48 wt% OH). Notably, apatites from the 871 CE
3.4.4.1. Volatile (F, Cl, OH, S) Contents of Apatites eruption have the most restricted range of OH values, from
Apatites from Torfajökull are dominantly fluorapatite 0 to 1.16 wt% OH (ITHN, average 0.24 wt% OH), while
(Figure 3.6), with F contents ranging from 1.02 to 4.03 apatites from the 1477 CE eruption have a much wider
wt% F, Cl contents ranging from BDL (~0.013 wt% Cl) to range, from 0 to 3.16 wt% OH (ITN, average 1.16 wt% OH).
0.40 wt% Cl, and highly variable calculated OH contents Sulfur contents in apatite are typically low, except for
(from 0 to 3.26 wt% OH). Since the OH contents were apatites in the 67 ka unit (Figure 3.7). In samples older
calculated based on stoichiometry (see section 3.3.5), than 67 ka (IETHB, IETG), S contents are typically near
they vary as a function of F. the detection limit (20 μg g−1 S) and reach maximum values
Apatites from all samples—regardless of age, magma of ~100 μg g−1 S. Sulfur in apatites from the 67 ka eruption
composition, or host phase (glass or feldspar)—have F con- show the greatest variability, ranging from BDL to 570 μg
tents that range from 1.02 to 4.03 wt% F. In units older than g−1 S. In samples younger than 67 ka (ITHN, ITN), S
67 ka (IETHB, IETG), Cl values are close to or below the values typically range from BDL to ~110 μg g−1 S. However,
detection limit. Apatites from the 67 ka eruption (IETR) each of the < 67 ka units contained one measured outlier
have higher Cl contents, ranging from 0.07 to 0.35 wt% Cl with significantly (2–4 times) higher S concentrations
(average 0.16 wt% Cl). Apatites from samples younger than (ITHN, ~420 μg g−1 S; ITN, ~290 μg g−1 S).74 DYNAMIC MAGMA EVOLUTION
600 older than 67 ka. In samples 67 ka and younger, MnO
Namshraun (ITN, 1477 AD) values range from BDL to 0.25 wt% MnO.
Hrafntinnuhraun (ITHN, 871 AD) Apatites from all units show high concentrations of
500 LREEs (Ce2O3 + La2O3 + Nd2O3) (Figure 3.8a and b), up
Rauðufossafjöll (IETR, 67 ka)
Gvendarhyrna (IETG , 278 ka)
to 18.9 wt% in total LREE2O3. As Ce, La, and Nd were
the only REEs measured in this study, the term LREE
400 Habarmur (IETHB, 384 ka)
will be used to refer to Ce, La, and Nd. Unless stated oth-
Phenocryst-hosted apatite
erwise, LREE contents will be given as the total of Ce2O3
S (µg g–1)
Matrix-hosted apatite
300 + La2O3 + Nd2O3. These particular REE were measured
because apatite preferentially incorporates LREE over
heavy REE within its structure (Pan & Fleet, 2002;Watson
200 & Green, 1981) and Ce, La, and Nd are typically the most
abundant (L)REEs in apatite (Fleet & Pan, 1995; Pan &
Fleet, 2002; Watson & Green, 1981). Most of the apatite
100 EPMA totals in this study are close to 100% (Table SM1),
validating the decision to focus on Ce, La, and Nd as rep-
resentative of (L)REE in apatite.
0
A progressive decrease in LREE content and vari-
0
0
00
00
00
ability is observed at Torfajökull over time (Figure 3.8).
0
10
20
30
40
Cl (ppm) The LREE concentration is especially high in anortho-
clase‐hosted apatite older than 67 ka. The highest REE
Figure 3.7 Sulfur evolution in Torfajökull apatites as a function values are from the 278 ka eruption, with compositions
of Cl content. Scatter plot showing S and Cl compositions of ranging from 8.4 to 18.9 wt% LREE oxides (average 14
Torfajökull apatite hosted in matrix glass (circles) and in feld- wt% LREE). Samples from the 384 ka eruption have
spar phenocrysts (triangles). Open icons indicate rim analyses similarly high LREEs, ranging from 5.0 to 15.5 wt%
on crystals large enough for multiple analyses. Chlorine‐
(average 10 wt% LREE). While these compositions are
in‐apatite increases with time at Torfajökull as observed with
certainly higher than most magmatic apatites, P/Ca do
progression from low Cl (< 1000 μg g−1) in the 384 ka and
278 ka samples, to high Cl (> 1000 μg g−1) in the 871 CE and confirm these phases are indeed apatite, and not other
1477 CE samples (see also Figure 3.4). Thus, Cl is used as a REE phosphates. Apatites in the 67 ka unit have much
time proxy in this plot. A significant increase of S‐in‐apatite lower and restricted LREE contents, ranging from 2.1 to
is observed for the 67 ka eruption (IETR), whereas the 2.6 wt% (average 2.4 wt% LREE). In the apatites from
apatites from all other units are characterized by fairly similar the 871 CE unit, LREE contents range from 1.9 to 3.3
S contents. wt% LREE. In the youngest sample (1477 CE), two dis-
tinct populations of apatite with low (0.5–1.3 wt%
LREE) and relatively higher (2.0–2.8 wt% LREE)
3.4.4.2. Trace Element Contents of Apatites LREEs are present.
Trace elements measured in Torfajökull apatites include
SiO2, Na2O, FeO, MgO, MnO, light rare earth elements 3.5. DISCUSSION
(LREE: Ce2O3, La2O3, Nd2O3), and SO2.
Apatites from all units are enriched in SiO2. Apatites The discussion is divided into three subsections in
from eruptions older than 67 ka have the highest SiO2 order to facilitate interpretation of the compiled geo-
values, with averages of 4.36 wt% (IETHB) and 7.29 wt% chemical data and their implications to elucidate mag-
(IETG) SiO2. In units 67 ka and younger, SiO2 values are matic and volcanic processes at Torfajökull.
generally lower, with averages of 1.25 wt% (IETR), 1.54 1. Apatite compositions are placed in a broader global
wt% (ITHN), and 1.77 wt% SiO2 (ITN). The apatites context, identifying features that make Torfajökull apa-
from units older than 67 ka show the highest Na2O con- tites specifically (and perhaps Icelandic apatites more
centrations, with values up to 0.63 wt% Na2O. Units 67 ka generally) compositionally unique (section 3.5.1).
and younger have Na2O contents in apatite BDL (~0.025 2. Volatile evolution at Torfajökull from the Pleistocene
wt% Na2O). Both FeO and MgO values in apatites through the Holocene is examined by using new apatite
increase over time. In units older than 67 ka, FeO and and matrix‐glass data (section 3.5.2).
MgO values are BDL (~0.045 wt%). In units 67 ka and 3. Torfajökull’s 67 ka eruption, an important inflection
younger, FeO values range from 0.30 to 1.21 wt% FeO, point in the system’s history, is investigated in greater
while MgO contents range from 0.10 to 0.60 wt% MgO. detail by comparing apatite data with published MI data
All MnO values are BDL (~0.024 wt% MnO) in units (section 3.5.3).APATITE AS A MONITOR OF DYNAMIC MAGMATIC EVOLUTION AT TORFAJÖKULL 75
(a)
10
Namshraun (ITN, 1477 CE)
Hrafntinnuhraun (ITHN, 871 CE)
8
Rauðufossafjöll (IETR, 67 ka)
Gvendarhyrna (IETG , 278 ka)
Ce2O3 (wt %)
6
Habarmur (IETHB, 384 ka)
4 Phenocryst-hosted apatite
Matrix-hosted apatite
2 Measured REE distribution
0
0 1 2 3 4
La2O3 (wt %)
(b) (c)
20
400
16
Sample/Chondrite
LREE2O3 (wt %)
12 100
8
4
0 10
ka
ka
ka
E
E
La
Ce
Pr
d
Pm
Sm
Eu
d
Tb
Dy
o
Er
Tm
Yb
Lu
N
G
H
C
C
4
8
67
0
7
38
27
Rare earth elements
87
7
14
Figure 3.8 Rare‐earth‐element contents and evolution in apatite. (a) Scatterplot of La2O3 versus Ce2O3 in apatites,
showing a near linear relationship. (b) The LREE content (here LREE = La2O3 + Ce2O3 + Nd2O3; in wt%) are
displayed as box and whisker plot as a function of time (or eruptive unit). Whiskers extend to the 5th and
95th percentiles, boxes define the 25th to 75th percentiles, and median values bisect the boxes. (c) Chondrite
normalized (McDonough & Sun, 1995) bulk‐rock REE compositions for each unit (Supplementary Table SM2).
Bulk‐rock REE contents generally decrease over time, however the highest REE contents are recorded in the
intermediate 67 ka unit (IETR).
Throughout this discussion, we interpret the 3.5.1. Icelandic Apatites in a Global Context
Torfajökull apatite described in section 3.4 and shown
in Figure 3.3 to represent primary magmatic signatures The Icelandic apatites examined in this study crystal-
because (a) measured apatites exhibit P/Ca ratios of lized from magmas formed in an oceanic setting, at the
stoichiometrically ideal apatites and (b) of the absence junction of a hotspot and a mid‐ocean ridge. In contrast,
of dissolution–reprecipitation features that are typi- previous studies of volcanic apatite compositions have
cally a consequence of metasomatic alteration (Harlov, focused on highly explosive subduction‐related arc sys-
2015). tems, such as Mount Pinatubo (Van Hoose et al., 2013),76 DYNAMIC MAGMA EVOLUTION
Santiaguito (Scott et al., 2015), or Augustine (Webster cations (e.g., Ti4+). In addition, any combination of
et al., 2017). The composition of volatiles and trace equations (3.1)–(3.3) is conceivable, e.g.:
elements in magmas and accessory minerals vary dramat-
ically between tectonic settings (e.g., chlorine (Webster REE3 Si 4 Na __ Ca 2 P5 (3.4)
et al., 2017) and zircon (Grimes et al., 2007, 2015)). Thus,
Icelandic apatites may also record compositional patterns A more encompassing but simplified substitution
unique to their magmatic‐tectonic setting. mechanism may consider all cations (M) measured in
Globally, apatites from most volcanic–plutonic systems apatite:
share similar compositional characteristics and are typically
F‐rich (Webster & Piccoli, 2015). Apatites from mafic rocks REE3 M Ca 2 P5 (3.5)
show the most compositional variability with respect to Cl,
whereas apatites from felsic systems are more compositionally The relevance of these various substitution mecha-
restricted (e.g., characteristically low Cl). Fluorine and OH nisms can be tested by applying equations (3.1)–(3.5) to
concentrations in apatite typically exceed Cl contents, which Torfajökull apatite data (Figure 3.9). In each scenario
has been interpreted as an effect of anion size (Pan & Fleet, considered, a fitted slope of −1 is ideal, because this rep-
2002; Piccoli & Candela, 2002; Webster & Piccoli, 2015). resents an empirically ideal substitution mechanism.
The REE composition of a typical igneous apatite is, on Apatite compositions from the oldest two units (384 ka
average, ~0.5 wt% total REE oxides (Pan & Fleet, 2002). and 278 ka) are roughly consistent with equations (3.3)
Consistent with global apatite trends, Torfajökull apatites and (3.5): the data follow a slope of approximately ‐0.9
are fluorapatite with Cl‐poor compositions. However, com- (equation (3.3); Figure 3.9c; n = 19, 2 excluded) and of
pared to typical igneous apatites globally, Torfajökull apa- approximately −1.5 (equation (3.5); Figure 3.9e; n = 21, 0
tites have distinctly higher LREE contents. excluded), respectively. This suggests that the charge
imbalance and structural strain created by the extremely
3.5.1.1. LREE Evolution high LREE contents in apatites from these oldest units
The most distinctive geochemical feature of Torfajökull (up to 20 wt% LREE oxides) is accommodated by a
apatites is their high concentrations of LREEs (Figure 3.8). variety of cation substitutions and cation site vacancies,
Apatites from the oldest, peralkaline, samples (384 ka and which are partially covered by equations (3.1)–(3.5). The
278 ka) reach up to 18.9 wt% LREE oxides. Torfajökull imperfect fit between measured data and the ideal
apatites from the peralkaline 67 ka unit and the younger, situation may be attributed to unknown contributions of
metaluminous, samples (871 CE and 1477 CE) are charac- cation vacancy sites. While vacancies are difficult to mea-
terized by LREE contents of ~0.5 to 2.5 wt%, which is still sure directly, their existence in the apatite structure has
high compared to the global average. All apatite analyses been well documented (e.g., Kim et al., 2017; Pan & Fleet,
used in this study exhibit a stoichiometric composition for 2002) and provides a plausible explanation for apfu
the P (~6 apfu) and Ca (~10 apfu) sites (see section 3.3.5), values. This is considered in equation (3.6), which is sug-
with P/Ca ratios between 0.49 and 0.68 (see Figure 3.4). gested for apatites containing > 2 apfu REE:
This suggests that the measured REE compositions of
apatite are real, and not the result of contamination by REE3 M n ___ Ca 2 P5 (3.6)
other phases (e.g., chevkinite) during EPMA analysis.
The elevated LREE compositions observed in Apatite compositions from the youngest three units
Torfajökull apatite crystals raise several questions, (67 ka, 871 CE, 1477 CE) are best explained by
including: What substitution mechanism(s) facilitated equations (3.1) and (3.5), with collective slopes of approx-
such extreme LREE compositions in these apatite crys- imately ‐0.5 (equation 3.1) and ‐0.7 (equation 3.5), respec-
tals?; and What magmatic conditions or processes made tively (n = 103; 5 excluded). This suggests that Si4+ is mainly
these apatite compositions possible? responsible for charge balancing the structural incorpora-
Incorporation of REEs into the apatite structure can tion of (L)REEs in the apatites from the 67 ka unit and
be facilitated by several different substitution mecha- younger, and the Na+ plays a minimal role in substitution.
nisms (Pan and Fleet, 2002), including: Further investigation is required to fully understand the
incorporation of REEs into the apatite structure, but
REE3 Si 4 Ca 2 P5 (3.1) substitution mechanisms are likely a complex combination
(3.2) of each of the above‐mentioned equations.
REE3 Na 2Ca 2
In previous studies, the peralkalinity of magmas has
2REE3 __ 3Ca 2 (3.3) been found to encourage REE substitution in apatites
(Roeder et al., 1987; Rønsbo, 1989). For example, apatites
where Na+ can be replaced by other monovalent cations from the Ilimaussaq intrusion in South Greenland reach
(e.g., K+) and Si4+ can be replaced by other tetravalent total REE concentrations of 16 wt%, SiO2 values of 7 wt%,You can also read