Tissue-specific patterns of regulatory changes underlying gene expression differences among Ficedula flycatchers and their naturally occurring F1 ...
←
→
Page content transcription
If your browser does not render page correctly, please read the page content below
Downloaded from genome.cshlp.org on November 26, 2020 - Published by Cold Spring Harbor Laboratory Press

Research

Tissue-specific patterns of regulatory changes
underlying gene expression differences among Ficedula
flycatchers and their naturally occurring F1 hybrids
Carina F. Mugal,1 Mi Wang,1 Niclas Backström,1 David Wheatcroft,1,2
Murielle Ålund,1,3 Marie Sémon,1,4 S. Eryn McFarlane,1,5 Ludovic Dutoit,1,6
Anna Qvarnström,1 and Hans Ellegren1
1
  Department of Ecology and Genetics, Uppsala University, 752 36 Uppsala, Sweden; 2Department of Zoology, Stockholm University,
106 91 Stockholm, Sweden; 3Department of Integrative Biology, Michigan State University, East Lansing, Michigan 48824, USA;
4
  ENS de Lyon, Laboratory of Biology and Modelling of the Cell, Lyon University, 69364 Lyon Cedex 07, France; 5Institute of
Evolutionary Biology, University of Edinburgh, EH9 3FL Edinburgh, United Kingdom; 6Department of Zoology, University of Otago,
Dunedin 9016, New Zealand

        Changes in interacting cis- and trans-regulatory elements are important candidates for Dobzhansky-Muller hybrid incompat-
        ibilities and may contribute to hybrid dysfunction by giving rise to misexpression in hybrids. To gain insight into the mo-
        lecular mechanisms and determinants of gene expression evolution in natural populations, we analyzed the transcriptome
        from multiple tissues of two recently diverged Ficedula flycatcher species and their naturally occurring F1 hybrids. Differential
        gene expression analysis revealed that the extent of differentiation between species and the set of differentially expressed
        genes varied across tissues. Common to all tissues, a higher proportion of Z-linked genes than autosomal genes showed dif-
        ferential expression, providing evidence for a fast-Z effect. We further found clear signatures of hybrid misexpression in
        brain, heart, kidney, and liver. However, while testis showed the highest divergence of gene expression among tissues, it
        showed no clear signature of misexpression in F1 hybrids, even though these hybrids were found to be sterile. It is therefore
        unlikely that incompatibilities between cis-trans regulatory changes explain the observed sterility. Instead, we found evidence
        that cis-regulatory changes play a significant role in the evolution of gene expression in testis, which illustrates the tissue-
        specific nature of cis-regulatory evolution bypassing constraints associated with pleiotropic effects of genes.

        [Supplemental material is available for this article.]

Following the seminal work of King and Wilson (1975) postulating                          Compared to regulatory changes, changes in protein-coding
that evolution occurs at two levels, the relative importance of                     sequences are suggested to have greater pleiotropic effects
changes in protein sequences and changes in gene expression                         and therefore to evolve under stronger selective constraint
has been a long-standing debate (Hoekstra and Coyne 2007;                           (Prud’homme et al. 2007; Wray 2007; Fraser 2011; Romero et al.
Wray 2007; Wagner and Lynch 2008). These two levels translate                       2012; Wittkopp and Kalay 2012). Likewise, changes in trans-regu-
into the respective role of protein-coding sequences and gene reg-                  latory elements are suggested to have greater pleiotropic effects
ulatory sequences in adaptation and speciation. Methodological                      than changes in cis-regulatory elements because individual trans-
limitations have led to a bias in favor of studies of the former cat-               acting factors often bind to multiple cis-regulatory elements
egory since it is easier to identify and functionally annotate pro-                 from multiple genes (Prud’homme et al. 2007). Changes in a single
tein-coding sequences than regulatory sequences/elements. To                        cis-regulatory element may be expected to have mostly targeted ef-
circumvent these limitations inherent to the study of regulatory                    fects and could therefore play an important role in adaptation by
evolution, the role of regulatory changes has mostly been studied                   bypassing the constraints associated with pleiotropic genes or
via analysis of gene expression (Khaitovich et al. 2005; Brawand                    trans-factors (Carroll 2005; Wray 2007). This has recently been ex-
et al. 2011; Sudmant et al. 2015). However, this is only an indirect                emplified for single traits, such as pigmentation in Drosophila
approach since gene expression itself is a phenotype, which is not                  (Hollocher et al. 2000; Kopp et al. 2000; Kopp and True 2002;
only genetically determined but also varies due to environmental                    Gompel and Carroll 2003; Gompel et al. 2005) and pelvic reduc-
conditions. To control for environmental variation, studies on                      tion in sticklebacks (Cresko et al. 2004; Shapiro et al. 2004;
gene expression evolution have therefore commonly been per-                         Morris et al. 2014; Marques et al. 2016).
formed under laboratory conditions or common garden settings                              On the other hand, accumulation of changes in interacting
(Romero et al. 2012; Signor and Nuzhdin 2018).                                      cis- and trans-regulatory elements may show reciprocal effects on
                                                                                    gene expression level and thereby be compensatory. As a result,
                                                                                    conservation of gene expression can be maintained at the same
                                                                                    time as mutations in regulatory elements accumulate (Johnson

Corresponding author: carina.mugal@ebc.uu.se
Article published online before print. Article, supplemental material, and publi-   © 2020 Mugal et al. This article, published in Genome Research, is available un-
cation date are at http://www.genome.org/cgi/doi/10.1101/gr.254508.119.             der a Creative Commons License (Attribution 4.0 International), as described at
Freely available online through the Genome Research Open Access option.             http://creativecommons.org/licenses/by/4.0/.

30:1–13 Published by Cold Spring Harbor Laboratory Press; ISSN 1088-9051/20; www.genome.org                                       Genome Research                1
                                                                                                                                     www.genome.org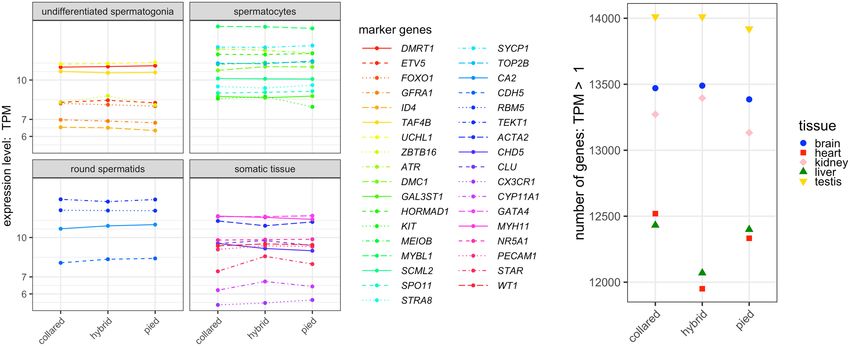
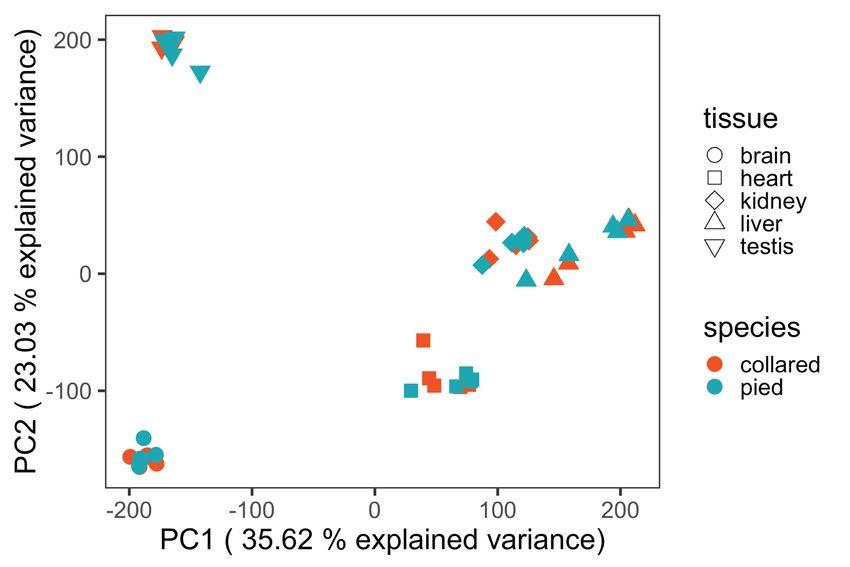
Downloaded from genome.cshlp.org on November 26, 2020 - Published by Cold Spring Harbor Laboratory Press

Mugal et al.

and Porter 2000; Wittkopp and Kalay 2012). Because of this,               between a female pied flycatcher and a male collared flycatcher
regulation of gene expression may be of particular relevance to           (Supplemental Fig. S1).
speciation where the interaction between divergent cis- and
trans-regulatory elements is a candidate process for the formation        Tissue-specific patterns of gene expression evolution
of Dobzhansky-Muller hybrid incompatibilities (Haerty and
Singh 2006; Hochholdinger and Hoecker 2007; Mack and                      Principal component analysis (PCA) of gene expression patterns
Nachman 2017; Signor and Nuzhdin 2018). Specifically, previous            across tissues and species showed that the main source of gene ex-
studies suggest that incompatible interactions between cis- and           pression variability was attributed to differences among tissues
trans-factors from hybridizing species would lead to misexpression        rather than species identity (Fig. 1A). This finding was confirmed
of genes and hybrid dysfunction (Signor and Nuzhdin 2018) and             quantitatively by between-groups PCA. While the variance associ-
contribute to intrinsic postzygotic reproductive isolation (Landry        ated with tissue identity was 86%, only a nonsignificant propor-
et al. 2005; Haerty and Singh 2006; Tulchinsky et al. 2014; Mack          tion of the variance (
Downloaded from genome.cshlp.org on November 26, 2020 - Published by Cold Spring Harbor Laboratory Press

                                                                                                  Tissue-specific patterns of regulatory changes

            A                                                                           B

            C                           D                          E                          F                           G

Figure 1. Variation in gene expression across tissues, and within and between species. (A) Principal component analysis (PCA) plot of the first two prin-
cipal components of variation in gene expression across five different tissues for five collared flycatchers (red) and five pied flycatchers (blue). (B) Venn di-
agram of differentially expressed genes across the five tissues. Numbers indicate the number of genes in each category. The number of genes not
differentially expressed in any of the tissues is provided in the bottom right corner. (C–G) PCA plots of the first two principal components of variation in
gene expression separately for the five different tissues. Ellipses indicate the species-specific mean with a range of ±1 standard deviation, in red for collared
flycatchers, in blue for pied flycatchers.

     Common to all tissues, a higher proportion of Z-linked genes                  pression might be coupled, at least in some tissues. FST was posi-
than autosomal genes showed differential expression (Table 1).                     tively associated with differential gene expression in several
Across tissues, the mean proportion of DE genes was 5.70% on                       tissues (kidney, liver, and testis), highlighting the importance of
the Z Chromosome compared to 3.19% for autosomes. The differ-                      genomic background, and is possibly related to the degree of cis-
ence was statistically significant across all tissues, which provides              regulatory variation.
evidence for a broad fast-Z effect in gene expression evolution.                        Multiple linear regression (MLR) analysis of log2-fold change
                                                                                   against the same six candidate explanatory variables largely con-
                                                                                   firmed the GLM results (Supplemental Table S2), but MLR suggests
Determinants of gene expression evolution
We performed generalized linear regression (GLM) analysis of dif-
ferential gene expression (n = 9658 autosomal genes) using the
                                                                                   Table 1. Numbers of differentially expressed (DE) genes and nondif-
number of protein–protein interactions (PPI), tissue specificity
                                                                                   ferentially (nDE) expressed genes between collared flycatcher and
(τ), intraspecific variation in gene expression (ϕ), the ratios of                 pied flycatcher in five different tissues, separately for autosomes and
nonsynonymous to synonymous diversity (πN/πS) and divergence                       the Z Chromosome
(dN/dS), and genomic differentiation between the two flycatcher
                                                                                                                                   Z
species (FST) as candidate explanatory variables. The analysis was
                                                                                                      Autosomes               Chromosome
performed for each tissue separately, which revealed similarities
as well as some interesting differences in key factors underlying                  Tissue          DE          nDE            DE        nDE            P-value
gene expression evolution across tissues (Table 2). While τ was
the major determinant of gene expression evolution in heart, kid-                  Brain            41        12,427          11         531         1.0 × 10⁻⁷
ney, liver, and testis, selective constraint on the protein sequence               Heart           127        10,832          14         463         4.0 × 10⁻⁴
                                                                                   Kidney          448        11,412          37         483         7.3 × 10⁻⁵
(dN/dS) was the major determinant in brain. The overall impor-
                                                                                   Liver           269        11,251          17         487         4.8 × 10⁻²
tance of τ for gene expression evolution clearly suggests that                     Testis          908        11,180          57         471         2.1 × 10⁻³
tissue-specific genes experience faster divergence of gene expres-
sion level, even though tissue-specific differential gene expression               Only genes that could be assigned a chromosomal location and showed
might also be achieved by tissue-specific regulation of broadly ex-                significant expression in the respective tissue are included in the list.
                                                                                   Differences in the distribution of DE and nDE genes between autosomes
pressed genes (Fig. 1B). The role of selective constraint on the pro-
                                                                                   and the Z Chromosome were assessed by a hypergeometric test.
tein sequence in brain, on the other hand, supports the hypothesis                 Significant differences (P-value < 0.05) are highlighted in bold and un-
that selective constraint on gene sequences and their level of ex-                 derlined if significance was retained after Holm-Bonferroni correction.

                                                                                                                                   Genome Research               3
                                                                                                                                    www.genome.org
Downloaded from genome.cshlp.org on November 26, 2020 - Published by Cold Spring Harbor Laboratory Press
Mugal et al.
Table 2. Generalized linear regression (GLM) analysis of differential gene expression between collared flycatcher and pied flycatcher against the
number of protein–protein interactions (PPIs), tissue specificity (τ), intra-species variation in gene expression (ϕ), the ratio of nonsynonymous to
synonymous diversity (πN/πS) and divergence (dN/dS), and genomic differentiation between collared flycatcher and pied flycatcher (FST) as can-
didate explanatory variables separately for five different tissues
Brain Heart Kidney Liver Testis
t-stat P-value t-stat P-value t-stat P-value t-stat P-value t-stat P-value
PPI 0.33 7.38 × 10⁻¹ −1.81 7.03 × 10⁻² −0.50 9.60 × 10⁻¹ −1.64 1.00 × 10⁻¹ −0.52 6.04 × 10⁻¹
τ 0.90 3.67 × 10⁻¹ 2.26 2.37 × 10 −2 4.25 2.11 × 10 −5 3.22 1.26 × 10 −3 5.62 1.88 × 10 −8
ϕ −1.59 1.13 × 10⁻¹ −1.87 6.21 × 10⁻² −3.60 3.23 × 10 −4 −3.19 1.43 × 10 −3 −4.36 1.33 × 10 −5
πN/πS −0.12 9.03 × 10⁻¹ 0.84 3.98 × 10⁻¹ −0.28 7.82 × 10⁻¹ 0.23 8.20 × 10⁻¹ 0.62 5.38 × 10⁻¹
dN/dS 3.20 1.39 × 10 −3 1.67 9.41 × 10⁻² −0.52 6.04 × 10⁻¹ 2.36 1.82 × 10⁻² 1.66 9.66 × 10⁻²
FST 0.34 7.35 × 10⁻¹ 1.05 2.95 × 10⁻¹ 3.48 5.02 × 10 −4 3.15 1.64 × 10 −3 4.79 1.69 × 10 −6
For each tissue, the t-statistic of the association and P-values are reported. Significant associations (P-value < 0.05) are highlighted in bold and under-
lined if significance was retained after Holm-Bonferroni correction.
stronger significance for determinants of gene expression evolu- (Fig. 2F–J). However, separate clustering of F1 hybrids in heart, kid-
tion, while GLM appears to be more conservative. ney, and liver further suggests that misexpression is abundant in
these tissues. In testis, F1 hybrids still clearly clustered between
Gene expression in naturally occurring hybrids the parental species, suggesting an absence of misexpression but
additive inheritance in this tissue. Results for brain revealed little
To visualize the relative position of gene expression patterns of F1 separation between F1 hybrids and their parental species, replicat-
hybrids compared to those of the parental species without letting ing the finding from the comparison of parental species that gene
potential misexpression in F1 hybrids blur the signal of evolution- expression divergence is limited in brain.
ary divergence between species, F1 hybrids were, in a first step, pro- Analyses of differential gene expression between hybrids and
jected onto the PCA of collared flycatcher and pied flycatcher each parental species (Table 3) were consistent with the PCA and
individuals (Fig. 2A–E). For brain, projection placed the F1 hybrids revealed a limited number of DE genes in brain (four in the
closer to pied flycatcher than to collared flycatcher, while the op- hybrid–collared flycatcher (HC) comparison and eight in the hy-
posite trend was observed for heart, kidney, and liver. For testis, F1 brid–pied flycatcher (HP) comparison). In line with the clustering
hybrids were clearly placed between the parental species. These of F1 hybrids between their parental species, testis also showed a
differences in clustering are suggestive of different modes of gene relatively limited number of DE genes in the hybrid/parental spe-
expression inheritance across tissues, that is, pied-dominant inher- cies comparisons (61 in each case), much fewer than was observed
itance in brain, collared-dominant inheritance in heart, kidney, in heart (210 in HC, 452 in HP), kidney (500, 1539), and liver (577,
and liver, and additive inheritance in testis. Direct inclusion of 1123). The consistently higher number of DE genes in the HP than
F1 hybrids into the PCA revealed consistent inheritance patterns in the HC comparison for heart, kidney, and liver provides
A B C D E
F G H I J
Figure 2. Principal component analysis plots of the first two principal components of variation in gene expression in five different tissues for five collared
flycatchers (red), five pied flycatchers (blue), and three F1 hybrids (yellow). Ellipses indicate the species-specific mean with a range of ±1 standard deviation,
in red for collared flycatchers, in blue for pied flycatchers. Note that a sample size of three does not allow computing ellipses for the F1 hybrids. (A–E) F1
hybrids are projected onto the PCA of the parental species. (F–J) F1 hybrids are directly included in the PCA.
4 Genome Research
www.genome.orgDownloaded from genome.cshlp.org on November 26, 2020 - Published by Cold Spring Harbor Laboratory Press
Tissue-specific patterns of regulatory changes
Table 3. Number of differentially expressed genes between collared and overdominant inheritance for autosomal as well as Z-linked
flycatcher and pied flycatcher (CP), between F1 hybrids and pied fly- genes (indicated by the type II regression lines), such trend was
catcher (HP), and between F1 hybrids and collared flycatcher (HC) in
not observed in the testis. Instead, for testis the regression lines
five different tissues
suggested a primary mode of collared-dominant inheritance for
Tissue CP HP HC autosomal genes and a primary mode of additive inheritance for
Z-linked genes. Comparison of the distribution of different modes
Brain 52 8 4 of inheritance across tissues clearly supports a distinct pattern for
Heart 141 452 210
Kidney 485 1539 500 gene expression inheritance in testis (Fig. 4). A higher frequency
Liver 286 1123 577 of collared-dominant than pied-dominant inheritance is again
Testis 965 61 61 consistent with biased inheritance patterns toward the collared
flycatcher.
Only genes that could be assigned a chromosomal location are included
in the list.
The transcriptome provides no evidence for differences
in testis cell composition between F1 hybrids and
additional evidence for collared-dominant inheritance in these tis- their parental species
sues and indicates that gene expression in F1 hybrids is more sim-
ilar to collared flycatcher than to pied flycatcher. Given that we We found motile sperm with forward motility in the ejaculates of
studied male hybrids, which were the result of crosses between all 10 collared flycatcher and pied flycatcher males. In contrast, we
male collared flycatcher and female pied flycatcher, the observa- were not able to detect any sperm cells in the ejaculates of the three
tion is consistent with sex-specific genomic imprinting (Reik and F1 hybrid flycatcher males, even though their testes were of similar
Walter 2001; Gregg et al. 2010). However, existence of genomic size as compared to the testis of purebred males (Supplemental Fig.
imprinting in birds is still under debate (Frésard et al. 2014). S5). Because of this lack of functional sperm production in F1 hy-
Moreover, biased inheritance patterns in F1 hybrids toward one brids, it is possible that their testes have a different cell-type com-
of the parental species irrespective of the direction of the cross position compared to samples of the parental species due to lower
may primarily reflect dominance relationships between ortholo- production or absence of sperm precursor cells in the testis (i.e.,
gous alleles of gene regulatory elements (McManus et al. 2010; spermatogonia, spermatocytes, and spermatids). Under such a sce-
Combes et al. 2015). nario, we would expect that cell-type markers characteristic of
spermatogenesis show lower expression levels in F1 hybrids than
in the parental species, that is, underdominant inheritance. In ad-
Distinct mode of gene expression inheritance in testis dition, misexpression of somatic cells that are essential constitu-
Misexpression in F1 hybrids is defined by an expression level being ents of the germline stem cell niche (i.e., cells contributing to
either lower or higher in hybrids than in any of the parental spe- the regulation of testes stem cell renewal and differentiation)
cies, that is, underdominant or overdominant inheritance of might be expected if they are at the origin of spermatogenesis dys-
gene expression. We found evidence for abundant hybrid misex- function in F1 hybrids. Note that misexpression patterns identified
pression in heart, kidney, and liver but not in brain and testis by the differential gene expression analysis did not reveal any can-
(Table 3). For example, there were 1539 DE genes in kidney in didate genes that followed such expression patterns in testis. To
the HP comparison but only 485 in the interspecific CP compari- corroborate these findings, we specifically investigated expression
son of the same tissue. In contrast, for testis the number of differ- levels of spermatogenesis cell-type markers (Hermann et al. 2018).
ently expressed genes was vastly higher in the interspecific CP This analysis revealed that neither cell-type markers of early sper-
(965) than in the HP (61) or HC (61) comparisons. Again, this sug- matogenesis, late spermatogenesis, or testis niche cells show con-
gests that regulatory evolution is highly tissue-specific. sistently deviating expression levels in testis samples of F1
In line with the additive inheritance pattern suggested by the hybrids (Fig. 5A). We therefore find no evidence for differences
PCA, all testis genes that were differentially expressed in the in cell composition between testes samples of the parental species
HC as well as the HP comparisons were also differentially expressed and their F1 hybrids.
between collared flycatcher and pied flycatcher. They consistently A characteristic signature of spermatogenesis is spurious tran-
showed intermediate expression levels in the F1 hybrids (Sup- scription as a result of a permissive chromatin environment during
plemental Fig. S4). We thus found no evidence that misexpres- this process (Soumillon et al. 2013). Thus, if spermatogenesis is in-
sion of genes in testis could explain the observed sterility of male terrupted at an early stage in the F1 hybrids, this should lead to a
F1 hybrids. Also, misexpression was generally not more pro- reduced signature of spurious transcription in the testis samples
nounced for Z-linked genes than for autosomal genes (Supplemen- of F1 hybrids. To investigate the signature of spurious transcription
tal Table S3). during spermatogenesis, we adapted the approach by Soumillon
To study the inheritance patterns of gene expression across et al. (2013) and counted the number of genes that showed a
tissues in more detail, we investigated the relationship between mean gene expression level of TPM > 1 separately for each of the
HC and HP expression differences based on log2-fold changes. tissues (Fig. 5B). While for brain, heart, kidney, and liver, the num-
This approach allowed us to classify genes into six categories: ber of expressed genes in F1 hybrids either fell below or above the
(1) conserved genes; (2) genes showing pied-dominant inheri- range of the parental species, for testis the number of expressed
tance; (3) collared-dominant inheritance; (4) additive inheritance; genes in F1 hybrids was within the range of the parental species
(5) overdominant inheritance; and (6) underdominant inheri- (collared flycatcher: 14,012 genes, F1 hybrids: 14,011 genes, and
tance (McManus et al. 2010). Figure 3 shows log2-fold changes be- pied flycatcher: 13,920 genes). This provides further evidence
tween pied flycatcher and F1 hybrids against log2-fold changes that spermatogenesis takes place in F1 hybrid individuals at least
between collared flycatcher and F1 hybrids across tissues. While until early-stage spermatids are produced and is consistent
brain, heart, kidney, and liver showed a clear trend toward under- with earlier findings (Ålund et al. 2013). We therefore find no
Genome Research 5
www.genome.orgDownloaded from genome.cshlp.org on November 26, 2020 - Published by Cold Spring Harbor Laboratory Press
Mugal et al.
Figure 3. Inheritance mode of gene expression patterns in natural F1 hybrids of collared flycatcher and pied flycatcher in five tissues. The scatterplots
show shrunken log2-fold changes between F1 hybrids and collared flycatcher on the x-axis, and between F1 hybrids and pied flycatcher on the y-axis.
One dot represents the inheritance pattern of one gene. Autosomal genes are shown in black, genes located on the Z Chromosome are shown in red.
The black and the red type II regression lines represent the major variation in log2-fold changes for autosomal and Z-linked genes, respectively. Vertical
and horizontal black solid lines indicate the coordinate axes. Gray dashed lines indicate the fold-change threshold of 1.125, used for classification of in-
heritance patterns. Right, bottom panel: The color code illustrates the thresholds used for classification of genes, with conserved in yellow, pied-dominant
inheritance in light gray, collared-dominant inheritance in dark gray, additive inheritance in green, overdominant inheritance in red, and underdominant
inheritance in blue.
evidence that potential differences in cell composition between We found a statistically significant association between differen-
testes of the parental species and their F1 hybrids manifest in the tial gene expression and ASE in both the parental species and in
transcriptome. F1 hybrids for kidney and liver (Table 4). For testis, differential
gene expression and ASE were only associated in F1 hybrids. This
cis-regulatory variation plays a role in the rapid divergence again indicates tissue-specific patterns of regulatory evolution
of gene expression in testis and a role of cis-regulatory sequences in the rapid divergence of
gene expression in testis.
We sought to test the hypothesis that different combinations of cis-mediated variation could be caused by sequence changes
cis- and trans-regulatory changes can explain the distinct mode in binding motifs or by epigenetic changes and remodeling of sur-
of gene expression inheritance in testis. Since only 737 genes rounding chromatin. To test if sequence differences in cis-regulato-
have fixed coding sequence differences between collared flycatch- ry regions between collared flycatcher and pied flycatcher were
er and pied flycatcher, we could not use the approach by Wittkopp associated with differential gene expression, we analyzed fixed dif-
et al. (2004), designed for crosses of species/inbred lines with sub- ferences in conserved noncoding elements (CNEs) located either
stantially divergent genomes, to study regulatory evolution. within 5 kb upstream of or in introns of each gene (Table 5).
Instead, we used a protocol suitable for natural populations, where Such elements are prominent candidates for representing cis-regu-
polymorphism is abundant, that tests for an association between latory regions, such as promoters, enhancers, silencers, etc.
differential gene expression and allele-specific expression in F1 hy- (Wittkopp and Kalay 2012; Polychronopoulos et al. 2017; Glaser-
brids as well as ASE in their parental species. ASE was determined Schmitt et al. 2018). Once again, this revealed a testis-specific sig-
using a novel approach that aggregates information across multi- nal, where genes with fixed CNE differences had significantly
ple SNPs in a gene and produces individual-based, gene-level tests higher expression divergence between species specifically in testis
for ASE (Wang et al. 2018). compared to genes without fixed CNE differences.
Segregating variation in cis-regulatory elements forms the While lack of an association between differential gene expres-
basis for ASE in parental species but can also contribute to ASE sion and fixed CNE differences for brain, heart, kidney, and liver
in F1 hybrids. Therefore, a signal of ASE in the parental species does not rule out the possibility that gene expression in those tis-
and in F1 hybrids is not indicative of cis-regulatory divergence be- sues is controlled by more distal cis-regulatory elements, lack of an
tween species. Only a signal of ASE specific to F1 hybrids supports association between differential gene expression and ASE in F1 hy-
the role of cis-regulatory changes in gene expression divergence. brids for the same tissues is not consistent with this explanation.
6 Genome Research
www.genome.orgDownloaded from genome.cshlp.org on November 26, 2020 - Published by Cold Spring Harbor Laboratory Press
Tissue-specific patterns of regulatory changes
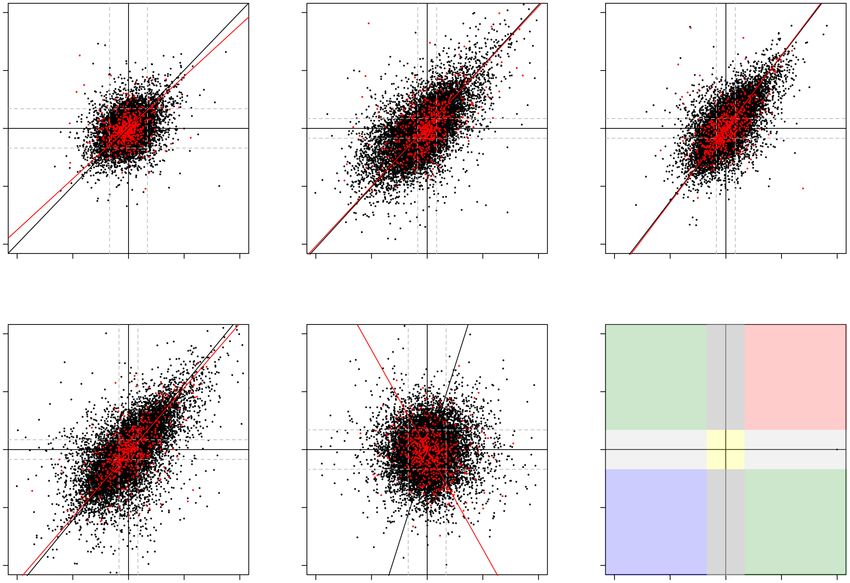
Figure 4. Inheritance mode of gene expression patterns across the five tissues, separately for genes located on autosomes (opaque colors) and the Z
Chromosome (transparent colors). The height of the bars shows the frequency of genes in each of the categories.
Alternative explanations could be that expression differences in classified conserved genes into those misexpressed in F1 hybrids
those tissues are driven by divergence in trans-acting factors, or (i.e., HC and HP) and those not misexpressed in F1 (neither HC
that cis-regulatory changes are compensated by changes in rele- or HP). There was a significant association between ASE and misex-
vant trans-acting factors and therefore do not lead to differential pression in F1 hybrids for heart and kidney, and a weak trend in the
gene expression. In the latter case, we would expect an overrepre- same direction in liver (Table 6). The signal was specific to ASE in F1
sentation of ASE among genes that show conserved expression lev- hybrids, and not found for ASE in the parental species (see
el between parental species but are misexpressed in F1 hybrids. We Supplemental Table S4). These results suggest that cis-trans
A B
Figure 5. Transcription profile of the testis. (A) Gene expression levels (inTPM) of spermatogenesis cell-type marker genes categorized into four different
stages—undifferentiated spermatogonia, spermatocytes, round spermatids, and testis niche cells—in testis of collared flycatcher, pied flycatcher, and their
F1 hybrids. (B) Number of genes expressed at an expression level TPM > 1 for the five tissues, for collared flycatcher, pied flycatcher, and their F1 hybrids.
Genome Research 7
www.genome.orgDownloaded from genome.cshlp.org on November 26, 2020 - Published by Cold Spring Harbor Laboratory Press
Mugal et al.
Table 4. Association between differential gene expression (log2-fold to keep gene expression level conserved in those tissues.
changes between collared flycatcher and pied flycatcher) and ASE in Stabilizing selection on gene expression may thus cause regulation
either F1 hybrids, collared flycatcher, or pied flycatcher across the
of gene expression to diverge more rapidly than gene expression
five tissues for genes located on autosomes
itself (Lemos et al. 2005; Gilad et al. 2006; Coolon et al. 2014).
Tissue F1 hybrids Collared flycatcher Pied flycatcher However, purifying selection pressure on brain expression patterns
seems sufficiently strong to prevent any change in regulatory re-
Brain 8.96 × 10⁻¹ 5.78 × 10⁻² 4.78 × 10⁻² a gions in the first place, keeping the need of compensatory cis-trans
Heart 8.32 × 10⁻¹ 1.07 × 10⁻¹ 9.55 × 10⁻¹
Kidney 1.29 × 10⁻² 2.39 × 10⁻² 2.04 × 10⁻² regulatory changes at a low level. Although the exact cause of high
Liver 1.86 × 10⁻² 1.27 × 10⁻³ 1.08 × 10⁻¹ selective constraint on gene expression in the brain is not well un-
Testis 3.61 × 10⁻² 1.40 × 10⁻¹ 8.58 × 10⁻¹ derstood, one hypothesis is that conservation of gene expression is
related to severe fitness consequences of changes in gene expres-
The table reports P-values based on a Mann–Whitney U test between sion level (Strand et al. 2007; Barbash and Sakmar 2017). It is
log2-fold changes for ASE genes and non-ASE genes. Significant associa-
tions (P-value < 0.05) are highlighted in bold. further possible that we underestimate the abundance of
a
The association showed higher log2-fold changes for non-ASE genes misexpression in F1 hybrids since we study adult flycatcher males.
than for ASE genes and is of the opposite direction than significant asso- If misexpression impacts hybrid survival, results observed for adult
ciations highlighted in bold. birds may not necessarily reflect results observed if younger birds
had been sampled.
Testis showed a distinct pattern in flycatchers, with no evi-
compensation plays a role in the conservation in gene expression
dence for misexpression in F1 hybrids despite the fact that none
between the parental species and that associated incompatibilities
of the hybrid individuals studied here showed any evidence for
between regulatory elements in F1 hybrids contribute to misex-
motile sperm cells in their ejaculates. This is in contrast to previous
pression. In brain and testis, no genes that could be assessed for
findings of misexpression being more pronounced in sterile than
ASE were classified as misexpressed, and a test for significance
fertile F1 hybrids of, for example, Drosophila and house mice
could not be performed.
(Haerty and Singh 2006; Mack et al. 2016), which is suggested to
be caused by the accumulation of compensatory cis-trans regulato-
ry changes. The observed lack of misexpression in flycatcher F1 hy-
Discussion brids suggests that compensatory cis-trans changes do not
Studies of gene expression evolution across a wide range of species counteract expression divergence between testis of collared fly-
suggest that stabilizing selection on gene expression is prevalent catcher and pied flycatcher. Instead, we find evidence for a rapid
and acts to maintain expression levels of genes around their stable divergence of gene expression and a role of cis-regulatory changes
optima (Lemos et al. 2005; Gilad et al. 2006; Bedford and Hartl in testis. While we cannot rule out the contribution of trans-regu-
2009; Chen et al. 2019). However, differences among tissues latory changes, such changes are prone to pleiotropic effects
have been revealed, where reproductive organs belong to the whereas complex cis-regulatory systems enable the establishment
most divergent tissues and brain to the most conserved tissues of compartmentalization and a wide diversity of tissue-specific
across species (Khaitovich et al. 2005; Voolstra et al. 2007; patterns to arise (Arnone and Davidson 1997; Wittkopp et al.
Brawand et al. 2011; Sudmant et al. 2015). Furthermore, gene reg- 2002; Carroll 2005; Gompel et al. 2005; Saha et al. 2017).
ulation has also been found to be tissue-specific (The GTEx We conclude that the role of tissue-specific regulatory mech-
Consortium 2015). Despite these findings, tissue-specific differ- anisms may play a more central role for our general understanding
ences have so far mostly been neglected in studies addressing mis- of the molecular basis for reproductive isolation and hybrid dys-
expression and Dobzhansky-Muller incompatibilities between function than previously realized. Specifically, our study demon-
divergent regulatory elements in F1 hybrids. Abundant misexpres- strates important differences in regulatory evolution among
sion in F1 crosses of inbred strains of mice subspecies has been de- tissues. On the one hand, we find evidence for widespread signa-
tected in liver (Goncalves et al. 2012) and testis (Mack et al. 2016). tures of misexpression in F1 hybrids in heart, kidney, and liver, sug-
In contrast, low levels of misexpression in brain have been ob- gesting a role of incompatibilities between divergent regulatory
served in crosses of two zebra finch subspecies and were suggested elements in those tissues. On the other hand, testis showed no sig-
to reflect the slow build-up of postzygotic reproductive isolation nature of misexpression, even though it showed the highest diver-
observed in many bird lineages (Davidson and Balakrishnan gence of gene expression among tissues, possibly facilitated by
2016). Our findings suggest that the reported differences in pat- tissue-specific cis-regulatory changes. It is therefore unlikely that
terns of gene expression evolution might in part be tissue-specific incompatibilities between cis-trans regulatory changes explain
rather than taxon-specific. While brain showed relatively low lev-
els of misexpression in F1 hybrids of flycatcher species, we ob-
served abundant misexpression in heart, kidney, and liver. Table 5. Association between log2-fold changes between collared
Epigenetic modifications have been suggested as candidate and pied flycatchers and fixed differences in gene-associated CNEs
mechanisms to form the molecular basis of misexpression in hy- for genes located on autosomes
brids (Groszmann et al. 2013; He et al. 2013). In addition, recent Tissue Brain Heart Kidney Liver Testis
evidence suggests that compensatory divergence of cis- and trans-
regulatory elements in the parental species (be it genetic or epige- P-value 7.94 × 10⁻² 2.94 × 10⁻¹ 7.06 × 10⁻¹ 6.39 × 10⁻¹ 7.69 ×
netic) can lead to incompatibilities between regulatory elements in 10−3
hybrids and thereby cause misexpression (Hochholdinger and
The table reports P-values based on a Mann–Whitney U test between
Hoecker 2007; McManus et al. 2010; Mack and Nachman 2017). log2-fold changes for genes showing fixed differences in their associated
Thus, our observation of abundant misexpression in heart, kidney, CNEs and genes not showing fixed differences in their associated CNEs.
and liver suggests that compensatory changes are frequent and act Significant associations (P-value < 0.05) are highlighted in bold.
8 Genome Research
www.genome.orgDownloaded from genome.cshlp.org on November 26, 2020 - Published by Cold Spring Harbor Laboratory Press
Tissue-specific patterns of regulatory changes
Table 6. Association between misexpression and ASE in F1 hybrids Dissections and storage of tissues
for genes located on autosomes
All sacrifices and dissections occurred on the same morning. On
Not the night before tissue collection, all males were transferred to cli-
Misexpressed misexpressed mate chambers with identical conditions for all individuals. All
males were sacrificed by decapitation and tissues were collected
Tissue ASE Non-ASE ASE Non-ASE χ2 test in this order: blood, brain, heart, lung, gut, liver, right testis, left
testis, kidney, and muscle. Brains were subsequently dissected
Brain 0 0 177 1959 NA
into six regions: hindbrain, midbrain, thalamus, and three telence-
Heart 5 27 81 1542 2.25 × 10⁻²
Kidney 11 40 143 1517 3.3 × 10⁻³ phalic regions (caudal, rostroventral, and rostrodorsal).
Liver 11 64 141 1505 1.07 × 10⁻¹ Dissections were completed within 20 min for all individuals.
Testis 0 0 209 1763 NA Tissue samples were placed in RNAlater in 1.5-mL Eppendorff
tubes, snap-frozen in liquid nitrogen, and subsequently stored at
The table provides numbers of genes showing ASE and non-ASE in F1 −80°C until RNA extraction. All sampling procedures were ap-
hybrids in five different organs, separately for misexpressed and not mis- proved by the Swedish Board of Agriculture (Jordbruksverket –
expressed genes. Only genes that could be assigned a chromosomal lo-
cation are included in the list. Differences in the distribution of ASE and
DNR 21-11).
non-ASE genes between a misexpressed and not misexpressed gene
were assessed by a χ2 test. P-values are provided in the sixth column.
Significant differences (P-value < 0.05) are highlighted in bold and un-
RNA extraction, library preparation, and sequencing
derlined if significance was retained after Holm-Bonferroni correction. Tissues were homogenized using a bead beater with ceramic beads
(Omni, Intl.), and aliquots of the homogenate were used for total
RNA extraction using the Qiagen RNeasy kit (Qiagen) following
the observed sterility (lack of normal sperm production) in natural the manufacturer’s instructions. Total RNA for the caudal region
F1 hybrids. However, results on testis histology and/or single-cell of the telencephalon (in this study referred to as brain), heart, kid-
RNA sequencing data will be necessary to validate this finding ney, liver, and left testis were used for Illumina paired-end library
and get a better understanding of spermatogenesis in flycatcher preparation. RNA integrity numbers were all ≥7.7 (Supplemental
F1 hybrids. Table S5). RNA-seq libraries were prepared from 1 μg total RNA us-
ing the TruSeq stranded mRNA sample HT prep kit with poly(A) se-
lection (Illumina, RS-122-2103). Sequencing was performed on an
Illumina HiSeq instrument with paired-end reads of 125 bp using
v4 chemistry, and a sequencing library for the phage PhiX was in-
Methods cluded as 1% spike-in in the sequencing run. FastQC was used to
All statistical analyses were completed using R version 3.3.2 (R check the quality of reads, and no trimming was performed.
Core Team 2016).
Read mapping
The FicAlb1.5 collared flycatcher assembly (GenBank Accession:
GCA_000247815.2) was used as a reference genome, where anno-
Sampling and sample treatment
tated repeat sequences were masked according to Suh et al. (2018).
Thirteen male flycatchers were collected from a population on the We mapped RNA-seq reads from each sample to the reference ge-
Baltic island of Öland (57°10′ N, 16°56′ E) during the breeding sea- nome using STAR v.2.5.1b (Dobin et al. 2013) with default param-
son of 2014. These represented five individuals each of collared fly- eters and the gene feature annotation from Ensembl version 73
catcher (F. albicollis) and pied flycatcher (F. hypoleuca), and three (see Uebbing et al. 2016 for detailed description). Gene feature an-
first generation (F1) hybrids between these species. Classification notation included sequence coordinates for a total of 16,221 anno-
of species and hybrids was initially done using plumage score tated flycatcher genes, including 15,561 genes located on
(Qvarnström et al. 2010) and subsequently confirmed genetically autosomes, 623 genes located on the Z Chromosome, and 37 genes
(further details provided below). As established from banding data, located on the mitochondria. To avoid any mapping bias toward
eight of the 13 individuals were in their third calendar year or the collared flycatcher, we masked all positions in the reference ge-
older, that is, born 2012 or before. Two collared flycatchers, two nome that show fixed differences between collared flycatcher and
pied flycatchers, and one hybrid were not banded and their ages pied flycatcher using SAMtools v.1.3 prior to the mapping (Li et al.
are thus unknown. 2009). Fixed differences were identified based on polymorphism
All studied individuals were held in 2 × 3 × 3 (h × l × w)-meter data for 19 collared and 19 pied flycatchers from the island of
aviaries containing a nest box, food, water, and nest building ma- Öland retrieved from Burri et al. (2015). Only RNA-seq reads that
terial for at least 2 wk prior to tissue sampling. All collared flycatch- mapped uniquely to annotated genes were used for further analy-
er and pied flycatcher males were placed with a conspecific female ses (Supplemental Table S1). After mapping, all duplicate reads
and all F1 hybrids with a collared flycatcher female in order to stim- were marked and reduced to a single copy using Picard v 2.0.1.
ulate sperm production. All males were sampled for ejaculates the
night before they were sacrificed. Ejaculates were collected
through cloacal protuberance massaging (Wolfson 1952) into a Genetic classification of species and hybrids
tube containing 5 µL of phosphate buffered saline, and 1 µL of To genetically confirm the identity of all individuals (i.e., whether
this mixture was immediately transferred to a prewarmed (40°C) they were collared flycatchers, pied flycatchers, or F1 hybrids), we
microscope slide and observed at 100× total magnification using called SNPs individually and compared them to the fixed differ-
a UB100i microscope fitted with a heated stage and video camera ences between collared flycatcher and pied flycatcher described
(Projectes i Serveis R + D S.L.). Ejaculates were scanned in a system- above. More specifically, we pooled uniquely mapped reads from
atic matter for sperm cells showing progressive mobility (Cramer different tissues of the same individual for each species. Then,
et al. 2016). we called SNPs individually using GATK 3.5.0 following the best
Genome Research 9
www.genome.orgDownloaded from genome.cshlp.org on November 26, 2020 - Published by Cold Spring Harbor Laboratory Press
Mugal et al.
practice protocol with recommended parameter settings (Van der ria from HTSeq with a mapping quality of at least 30. For each
Auwera et al. 2013). sample, we mapped the filtered reads to the corresponding individ-
To identify the direction of the cross between collared and ual reference genome using STAR v.2.5.1b and obtained allelic
pied flycatchers, we conducted a phylogenetic analysis based on counts using SAMtools v.1.5. Additionally, for each sample allelic
mitochondrial RNA (mtRNA). We mapped RNA-seq reads from counts from SNPs that showed evidence of strong mapping bias
all three hybrid individuals to the mtDNA reference of collared fly- were removed following Degner et al. (2009).
catcher assembly FicAlb1.5 and the mtDNA annotation of We used RPASE to conduct individual-based ASE analyses
Ensembl version 73 by using STAR v.2.5.1b with the same param- (Wang et al. 2018). To be included in the ASE analysis, we required
eter settings as described above. We extracted reads that were each gene to contain at least two phased SNPs and each SNP to
uniquely mapped to the 37 annotated mitochondrial genes for fur- have minimum coverage of 10 and minimum allelic depth greater
ther analysis. For each hybrid individual, we used GATK version than 2. Gene-specific P-values were adjusted for multiple testing
3.5.0 with default parameter settings to call SNPs. For each individ- using Benjamini-Hochberg correction. The number of genes that
ual, we constructed mtDNA sequences by replacing sites on the could be studied for ASE in each tissue and individual is shown
mtDNA reference with the called nonreference genotype using in Supplemental Table S7. Since RPASE identifies ASE at the indi-
SAMtools v.1.5. We aligned mtDNA sequences from all individuals vidual level and we are interested in ASE at the population level,
and constructed a phylogeny using the maximum parsimony we applied further criteria to leverage individual-level ASE up to
method available in using Seaview version 4 with default parame- population-level ASE. To do so, we required genes to have at least
ter settings (Gouy et al. 2010). two individuals tested for ASE (i.e., we removed genes that had
only one individual tested for ASE) and defined genes to show
ASE as those that had adjusted P-value < 0.05 in at least two
Read counting and differential gene expression analysis individuals.
We computed differential gene expression patterns using the
DESeq2 package provided in R (Love et al. 2014). Since DESeq2 re- Tissue specificity of gene expression
quires raw read counts as input data, we used HTSeq v0.6.1 (Anders
et al. 2015) to generate the input matrix for DESeq2. We limited To estimate normalized expression levels in transcripts per million
the read counting to reads with a mapping quality of at least 30. (TPM), we used uniquely mapped reads from STAR and calculated
Read counting was configured to handle reverse-stranded sequenc- TPM using RSEM 1.2.29 (Li and Dewey 2011) for all 16,221 anno-
ing data, and the parameter that controls for overlapping gene fea- tated genes and for each tissue separately. We then calculated tis-
tures was set to union. For all other parameters in HTSeq, we kept sue specificity following Yanai et al. (2005). Tissue specificity was
default parameter values. Averages of total counts per sample are highly correlated between collared flycatcher, pied flycatcher,
provided in Supplemental Table S6. and F1 hybrids (r ≥ 0.97). We used PCA and computed the major
For each tissue, the count data of all 13 individuals was for- variation in tissue specificity across species as a representative of
matted as an R matrix and used as input data for DESeq2. flycatcher-specific tissue specificity.
Differential gene expression analysis was performed for each tissue
separately based on pair-wise contrasts. Genes with a FDR adjusted Computation of population genomic parameters
P-value < 0.05 were considered to show significant differential Fixed differences between collared flycatcher and pied flycatcher
gene expression (DE genes). Genes with a FDR adjusted P-value ≥ were restricted to the set of sites located in conserved noncoding
0.05 were considered to show no differential gene expression elements obtained from Craig et al. (2018). We associated CNEs
(nDE genes). Genes for which differential gene expression could with a gene by considering all CNEs that were located either 5 kb
not be assessed were not classified. We further calculated shrunken upstream of or in introns of genes as gene-associated CNEs.
log2-fold changes, which removes the noise associated with log2- We calculated FST based on the filtered polymorphism data
fold changes for genes with low count values. In order to investi- from Burri et al. (2015), described above. FST was calculated for
gate clustering of individual gene expression patterns in each tis- 50-kb windows all along the genome using VCFtools v0.1.14
sue, we applied a regularized log-transformation on the count with default settings (Danecek et al. 2011). Moreover, nonsynon-
data as implemented in DESeq2 and subsequently performed ymous/synonymous nucleotide diversity (πN/πS) was calculated
PCA as implemented in the ade4 package (Dray and Dufour based on the site frequency spectrum of zero- and fourfold degen-
2007). In addition, data matrices were combined across tissues in erated sites following Bolívar et al. (2018).
order to perform principal component analysis (PCA) across tis-
sues and species together. The proportion of variance associated
with species and tissue was computed based on between-groups Regression analysis
PCA. Statistical significance was evaluated by a Monte-Carlo test We investigated the association between differential gene expres-
on the percentage of explained inertia based on 99 permutations. sion and genomic and gene-specific features using a generalized
linear regression with binomial error distribution. For this pur-
pose, differential gene expression between collared flycatcher
Allele-specific expression analyses and pied flycatcher was encoded by 1 if the FDR adjusted P-value
Since we retrieved five individuals for collared flycatcher and pied < 0.05, and 0 otherwise. We included a total of six explanatory var-
flycatcher but only three for their hybrids, we only involved three iables: tissue specificity index τ, gene-wise dispersion parameter ϕ
individuals of each parental species in the ASE analyses to balance from DESeq2 (Love et al. 2014) as a proxy for the degree of intra-
the power (COL01, COL02, and COL03 for collared flycatcher; specific variation in gene expression, the number of protein–pro-
PIE01, PIE02, and PIE03 for pied flycatcher). To avoid mapping tein interactions retrieved from Uebbing et al. (2015), flycatcher-
bias originating from mapping of heterozygous alleles to a single specific nonsynonymous/synonymous nucleotide divergence
reference genome, we masked SNP positions in the reference ge- (dN/dS) obtained from Bolívar et al. (2016), nonsynonymous/syn-
nome and repeated the mapping following the same protocol as onymous nucleotide diversity (πN/πS), and FST. In addition, we
described above. To be consistent with the differential gene expres- used log2-fold change in gene expression as a response variable
sion analyses, we only considered reads that passed filtering crite- in order to check for consistency between results based on 0/1
10 Genome Research
www.genome.orgDownloaded from genome.cshlp.org on November 26, 2020 - Published by Cold Spring Harbor Laboratory Press
Tissue-specific patterns of regulatory changes
encoding of differential expression judged by significance and Arnone MI, Davidson EH. 1997. The hardwiring of development: organiza-
log2-fold changes in gene expression. For this purpose, we per- tion and function of genomic regulatory systems. Development 124:
1851–1864.
formed multiple linear regression analyses against the same six ex- Barbash S, Sakmar TP. 2017. Brain gene expression signature on primate ge-
planatory variables. nomic sequence evolution. Sci Rep 7: 17329. doi:10.1038/s41598-017-
17462-3
Bedford T, Hartl DL. 2009. Optimization of gene expression by natural selec-
Gene expression patterns of spermatogenesis cell-type markers tion. Proc Natl Acad Sci 106: 1133–1138. doi:10.1073/pnas.0812009106
Cell-type markers for three different stages of spermatogenesis (un- Bolívar P, Mugal CF, Nater A, Ellegren H. 2016. Recombination rate varia-
tion modulates gene sequence evolution mainly via GC-biased gene
differentiated spermatogonia, spermatocytes, round spermatids) conversion, not Hill–Robertson interference, in an avian system. Mol
and markers of the germline stem cell niche were inferred from hu- Biol Evol 33: 216–227. doi:10.1093/molbev/msv214
man (Hermann et al. 2018). Gene names were associated with the Bolívar P, Mugal CF, Rossi M, Nater A, Wang M, Dutoit L, Ellegren H. 2018.
respective collared flycatcher Ensembl gene ID with BioMart, Biased inference of selection Due to GC-biased gene conversion and the
rate of protein evolution in flycatchers when accounting for it. Mol Biol
Ensembl release 98. For each gene that was associated with a
Evol 35: 2475–2486. doi:10.1093/molbev/msy149
unique Ensembl gene ID, mean expression level (in TPM) across Brawand D, Soumillon M, Necsulea A, Julien P, Csárdi G, Harrigan P, Weier
testis samples was computed separately for collared flycatcher, M, Liechti A, Aximu-Petri A, Kircher M, et al. 2011. The evolution of
pied flycatcher, and F1 hybrid individuals. gene expression levels in mammalian organs. Nature 478: 343. doi:10
.1038/nature10532
Burri R, Nater A, Kawakami T, Mugal CF, Olason PI, Smeds L, Suh A, Dutoit
L, Bureš S, Garamszegi LZ, et al. 2015. Linked selection and recombina-
Data access tion rate variation drive the evolution of the genomic landscape of dif-
ferentiation across the speciation continuum of Ficedula flycatchers.
The RNA-seq data generated in this study have been submitted to Genome Res 25: 1656–1665. doi:10.1101/gr.196485.115
the NCBI BioProject database (https://www.ncbi.nlm.nih.gov/ Carroll SB. 2005. Evolution at two levels: on genes and form. PLoS Biol 3:
bioproject/) under accession number PRJNA551584. e245. doi:10.1371/journal.pbio.0030245
Chen J, Swofford R, Johnson J, Cummings BB, Rogel N, Lindblad-Toh K,
Haerty W, di Palma F, Regev A. 2019. A quantitative framework for char-
acterizing the evolutionary history of mammalian gene expression.
Competing interest statement Genome Res 29: 53–63. doi:10.1101/gr.237636.118
Combes MC, Hueber Y, Dereeper A, Rialle S, Herrera JC, Lashermes P. 2015.
The authors declare no competing interests.
Regulatory divergence between parental alleles determines gene expres-
sion patterns in hybrids. Genome Biol Evol 7: 1110–1121. doi:10.1093/
gbe/evv057
Acknowledgments Coolon JD, McManus CJ, Stevenson KR, Graveley BR, Wittkopp PJ. 2014.
Tempo and mode of regulatory evolution in Drosophila. Genome Res
We thank Paulina Bolívar for help with organizing data, Douglas 24: 797–808. doi:10.1101/gr.163014.113
Scofield for help with data upload, and William Jones for assis- Craig RJ, Suh A, Wang M, Ellegren H. 2018. Natural selection beyond genes:
tance catching and dissecting birds. The authors also thank the identification and analyses of evolutionarily conserved elements in the
genome of the collared flycatcher (Ficedula albicollis). Mol Ecol 27: 476–
UPPMAX Next-Generation Sequencing Cluster and Storage
492. doi:10.1111/mec.14462
(UPPNEX) project, funded by the Knut and Alice Wallenberg Cramer ERA, Alund M, McFarlane SE, Johnsen A, Qvarnstrom A. 2016.
Foundation and the Swedish National Infrastructure for Females discriminate against heterospecific sperm in a natural hybrid
Computing, for access to computational resources. This study zone. Evolution (N Y) 70: 1844–1855. doi:10.1111/evo.12986
was funded by grants from the Swedish Research Council (2013- Cresko WA, Amores A, Wilson C, Murphy J, Currey M, Phillips P, Bell MA,
Kimmel CB, Postlethwait JH. 2004. Parallel genetic basis for repeated
8271 to H.E. and 2012-3722 to A.Q.), the Knut and Alice evolution of armor loss in Alaskan threespine stickleback populations.
Wallenberg Foundation (2014/0044 to H.E.), the Natural Proc Natl Acad Sci 101: 6050–6055. doi:10.1073/pnas.0308479101
Sciences and Engineering Research Council of Canada (PGS-D to Danecek P, Auton A, Abecasis G, Albers CA, Banks E, DePristo MA,
S.E.M.), and the “Stiftelsen för Zoologisk forskning” (to M.Å., Handsaker RE, Lunter G, Marth GT, Sherry ST, et al. 2011. The variant
call format and VCFtools. Bioinformatics 27: 2156–2158. doi:10.1093/
S.E.M., and D.W.).
bioinformatics/btr330
Author contributions: C.F.M. and H.E. conceived of the study. Davidson JH, Balakrishnan CN. 2016. Gene regulatory evolution during
C.F.M. carried out the analysis, with contributions from M.W. speciation in a songbird. G3 (Bethesda) 6: 1357–1364. doi:10.1534/g3
and M.S. L.D. contributed to population genomic analysis. N.B., .116.027946
D.W., M.Å., S.E.M., and A.Q. designed the field experiment and Degner JF, Marioni JC, Pai AA, Pickrell JK, Nkadori E, Gilad Y, Pritchard JK.
2009. Effect of read-mapping biases on detecting allele-specific expres-
collected samples. N.B. and D.W. performed lab work. C.F.M. sion from RNA-sequencing data. Bioinformatics 25: 3207–3212. doi:10
and H.E. wrote the manuscript with contributions from all other .1093/bioinformatics/btp579
authors. All authors contributed critically to the drafts and ap- Dobin A, Davis CA, Schlesinger F, Drenkow J, Zaleski C, Jha S, Batut P,
proved the final manuscript. Chaisson M, Gingeras TR. 2013. STAR: ultrafast universal RNA-seq align-
er. Bioinformatics 29: 15–21. doi:10.1093/bioinformatics/bts635
Dray S, Dufour AB. 2007. The ade4 package: implementing the duality dia-
gram for ecologists. J Stat Softw 22: 1–20. doi:10.18637/jss.v022.i04
References Emerson JJ, Hsieh LC, Sung HM, Wang TY, Huang CJ, Lu HH, Lu MY, Wu
Alatalo RV, Gustafsson L, Lundberg A. 1982. Hybridization and breeding SH, Li WH. 2010. Natural selection on cis and trans regulation in yeasts.
success of collared and pied flycatchers on the island of Gotland. Auk Genome Res 20: 826–836. doi:10.1101/gr.101576.109
99: 285–291. Fraser HB. 2011. Genome-wide approaches to the study of adaptive gene ex-
Alatalo RV, Eriksson D, Gustafsson L, Lundberg A. 1990. Hybridization pression evolution. Bioessays 33: 469–477. doi:10.1002/bies.201000094
between pied and collared flycatchers - sexual selection and specia- Frésard L, Leroux S, Servin B, Gourichon D, Dehais P, San Cristobal M,
tion theory. J Evol Biol 3: 375–389. doi:10.1046/j.1420-9101.1990 Marsaud N, Vignoles F, Bed’hom B, Coville JL, et al. 2014.
.3050375.x Transcriptome-wide investigation of genomic imprinting in chicken.
Ålund M, Immler S, Rice AM, Qvarnström A. 2013. Low fertility of wild hy- Nucleic Acids Res 42: 3768–3782. doi:10.1093/nar/gkt1390
brid male flycatchers despite recent divergence. Biol Letters 9: 20130169. Gilad Y, Oshlack A, Rifkin SA. 2006. Natural selection on gene expression.
doi:10.1098/rsbl.2013.0169 Trends Genet 22: 456–461. doi:10.1016/j.tig.2006.06.002
Anders S, Pyl PT, Huber W. 2015. HTSeq—a Python framework to work with Glaser-Schmitt A, Zečić A, Parsch J. 2018. Gene regulatory variation in
high-throughput sequencing data. Bioinformatics 31: 166–169. doi:10 Drosophila melanogaster renal tissue. Genetics 210: 287–301. doi:10
.1093/bioinformatics/btu638 .1534/genetics.118.301073
Genome Research 11
www.genome.orgYou can also read