Physiological Changes, Activity, and Stress During a 100-km-24-h Walking-March
←
→
Page content transcription
If your browser does not render page correctly, please read the page content below
ORIGINAL RESEARCH
                                                                                                                                                   published: 11 March 2021
                                                                                                                                            doi: 10.3389/fphys.2021.640710

                                                Physiological Changes, Activity, and
                                                Stress During a 100-km–24-h
                                                Walking-March
                                                Marc Jörres* , Hanns-Christian Gunga and Mathias Steinach
                                                Charité – Universitätsmedizin Berlin, corporate member of Freie Universität Berlin, Humboldt-Universität zu Berlin, and Berlin
                                                Institute of Health, Institute of Physiology, Center for Space Medicine and Extreme Environments, Berlin, Germany

                                                Background: Long-endurance exercises like ultramarathons are known to elicit various
                                                metabolic and physiological changes in the human body. However, little is known about
                                                very long-duration exercise at low intensities regarding healthy human subjects.
                                                Aim: The purpose of this study was to evaluate changes in body composition and
                                                metabolism in long-endurance but low-intensity events.
                                                Methods: Twenty-five male and 18 female healthy recreational athletes (age
                                                34.6 ± 8.8 years; BMI: 22.4 ± 2.0 kg/m2 ) of the “100 km Mammutmarsch” were
                                                recruited for participation during the events in 2014–2016. Other than classical
                                                ultramarathons, the “Mammutmarsch” is a hiking event, in which participants were
                                                required to walk but not run or jog. It was expected to complete the 100-km
                           Edited by:           distance within 24 h, resulting in a calculated mean speed of 4.17 km/h, which fits
                          Ginés Viscor,         to the mean speed observed (4.12 ± 0.76 km/h). As not all participants reached
        University of Barcelona, Spain
                                                the finish line, comparison of finishers (FIN, n = 11) and non-finishers (NON, n = 21)
                        Reviewed by:
                        Beat Knechtle,
                                                allowed differential assessment of performance. Body composition measured through
 Universitätsspital Zürich, Switzerland         bioelectrical impedance analysis (BIA) was determined pre- and post-event, and serum
                      Guillermo Olcina,
                                                samples were taken pre-event, at 30, 70, and 100 km to determine NT-pro-BNP,
     University of Extremadura, Spain
                                                troponin T, C-reactive protein (CRP), cortisol, low-density lipoprotein (LDL), high-density
                 *Correspondence:
                        Marc Joerres            lipoprotein (HDL), triglycerides, total cholesterol, total creatine kinase (CK), CK-MB,
             marc.joerres@charite.de;           aminotransferase (AST), ALT, and sodium levels. Nineteen participants wore actimeter
             marc.joerres@t-online.de
                                                armbands (SenseWear ) to gain information about body activity and exercise intensity
                                                                                 R

                   Specialty section:           [metabolic equivalent of task (MET)]. Sixteen participants wore mobile heart rate
         This article was submitted to          monitors to assess mean heart rate during the race. Serum parameter alterations over
   Environmental, Aviation and Space
                           Physiology,          the course of the race were analyzed with mixed-effects ANOVA and additional t-tests.
               a section of the journal         All serum parameters were analyzed for correlation concerning different MET levels,
               Frontiers in Physiology
                                                speed, age, BMI, baseline NT-pro-BNP, mean heart rate during the race, and sex with
       Received: 11 December 2020
                                                linear regression analysis.
        Accepted: 27 January 2021
         Published: 11 March 2021
                                                Results: We found significant elevations for muscle and cardiac stress markers (CRP,
                            Citation:
                                                CK, CK-MB, AST, ALT, cortisol, and NT-pro-BNP) as well as decreasing markers of
          Jörres M, Gunga H-C and
    Steinach M (2021) Physiological             lipid metabolism (cholesterol, triglycerides, LDL). Although the intensity level demanded
 Changes, Activity, and Stress During           from our participants was low compared with other studies on (ultra-) marathons, the
    a 100-km–24-h Walking-March.
          Front. Physiol. 12:640710.
                                                alteration of tested parameters was similar to those of high-intensity exercise, e.g., NT-
   doi: 10.3389/fphys.2021.640710               pro-BNP showed a fourfold increase (p < 0.01) and LDL decreased by 20% (p = 0.05).

Frontiers in Physiology | www.frontiersin.org                                           1                                           March 2021 | Volume 12 | Article 640710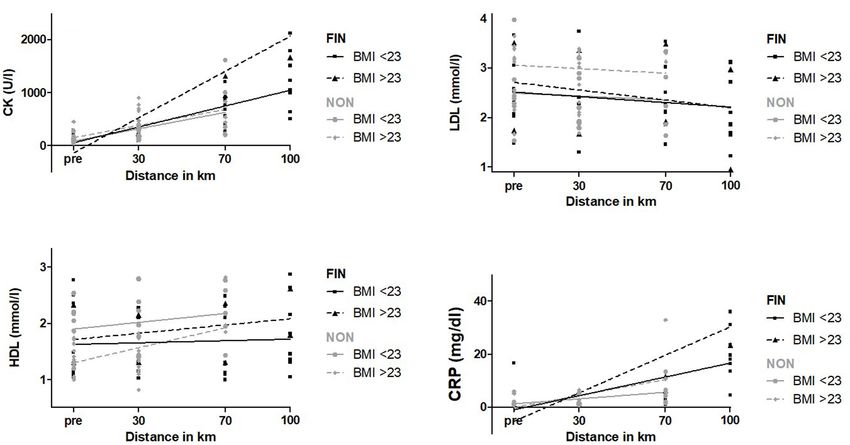
Joerres et al.                                                                                                  Physiological Changes During a 100-km-March

                                                Besides the duration of exercise, age, BMI, training status, and sex are relevant
                                                parameters that influence the elevation of stress factors. Notably, our data indicate that
                                                NT-pro-BNP might be a marker for cardiovascular fitness also in healthy adults.
                                                Conclusion: This low-intensity long-endurance walk evoked a strong systemic reaction
                                                and large cell stress and shifted to a favorable lipid profile, comparable to higher intensity
                                                events. Despite increasing cardiac stress parameters, there were no indications of
                                                cardiac cell damage. Remarkably, the duration seems to have a greater influence on
                                                stress markers and metabolism than intensity.
                                                Keywords: body composition, cardiac stress, endurance, exercise performance, low intensity, physiological
                                                changes, ultra-endurance, ultramarathon

INTRODUCTION                                                                         2014; Yoon et al., 2016). One study with a relatively low mean
                                                                                     speed covered a distance of up to 430 miles (≈690 km) but was
The knowledge about physiological changes in athletes                                conducted in extremely cold weather (daily average temperatures
participating in ultramarathons is scarce. While thousands                           around −25◦ C) (Coker et al., 2017).
of athletes compete in classic marathons, only a few hundred                             Research concerning NT-pro-BNP in endurance exercise
do so in ultramarathons, i.e., distances longer than 42.195 km.                      showed levels exceeding its upper reference limit (URL) in 35.9%
Nevertheless, in the last decades, the number of such events has                     of runners; however, only marathon and half-marathon races
been increasing, as well as the number of athletes participating                     were assessed (Vilela et al., 2015). Very few studies exist that
in such events (Whyte, 2014; International Association of                            evaluated changes in NT-pro-BNP during ultramarathons. The
Ultrarunners, 2020; Knechtle et al., 2020).                                          distances in existing studies varied between 60 (Salvagno et al.,
   Several studies have shown that engaging in endurance                             2014), 100 (Scharhag et al., 2005), 160 (Scott et al., 2009), and
sports elicits various metabolic and physiological changes in                        280 km (Kłapcińska et al., 2013) up to 308 km (Kim et al.,
the human body. Changes in lean body mass and body fat                               2014; Yoon et al., 2016) with running velocities varying from
(Knechtle et al., 2008a; Baur et al., 2016), as well as a decrease                   8.5 to 10.0 km/h (Kasprowicz et al., 2013), respectively. Two
in serum lipids (Ginsburg et al., 1996), are considered beneficial                   studies (Kim et al., 2014; Yoon et al., 2016) evaluating NT-
on diseases caused by western sedentary lifestyle, such as the                       pro-BNP at lower intensities (i.e., walking instead of jogging or
metabolic syndrome (Saklayen, 2018), while other alterations,                        running) covered more than triple the distance than the MM,
such as increases in cardiac and muscle cell damage markers                          assessed in the present study. Another study covering exercise
and markers indicating systemic inflammatory reaction, may                           at low intensities did not include healthy subjects but examined
indicate adverse effects (Fallon, 2001; Scharhag et al., 2005, 2006;                 patients with coronary heart syndrome, evaluated for only 30 min
Kasprowicz et al., 2013; Kłapcińska et al., 2013; Baur et al., 2016).               (Scharhag et al., 2007). To our knowledge, no data covering
Established markers to assess these changes are creatine kinase                      healthy athletes walking for a distance around 100 km exists.
(CK), transaminases, C-reactive protein (CRP), and cortisol                              Cardiac troponins have been analyzed in many studies
(Allen et al., 2015; Cerqueira et al., 2020). Markers to assess                      regarding half-marathon, marathon, and ultramarathon-runs
cardiac stress are NT-pro-BNP, released by cardiomyocytes in                         with increases in 51% of 1,045 evaluated athletes above the cut-
response to stretching caused by volume load (Nakagawa et al.,                       off value of 10 ng/L (Sedaghat-Hamedani et al., 2015). However,
1995), and cardiac troponins, indicating myocardial damage                           participants of the evaluated ultramarathons were running at
(Sarko and Pollack, 2002). These changes are discussed to be a                       jogging speed (9–10 km/h at a distance of 100 km) (Ohba et al.,
physiological response as cardiac and muscle cell markers return                     2001; Scharhag et al., 2005). Only few studies have evaluated
to baseline shortly after finishing a marathon or ultramarathon,                     troponins at low-intensity and long-duration exercise. However,
suggesting rapid cell repair without adverse long-term effects                       in these few studies, participants were either heart patients
(Scharhag et al., 2005, 2006, 2008; La Gerche et al., 2008;                          (Benda et al., 2016); were 55 years in mean age of which 82%
Kłapcińska et al., 2013).                                                           were prescribed diuretics, statins, or antihypertensive drugs; or
   However, the majority of these studies assessed triathlons,                       were of heterogenic age (21–82 years) of which 23% had cardiac
marathons, or ultramarathons where participants ran or jogged                        pathologies (Eijsvogels et al., 2010).
(Ohba et al., 2001; Wu et al., 2004; Scharhag et al., 2005; Scott                        Regarding metabolic and stress parameters, several studies
et al., 2009; Banfi et al., 2012; Kim et al., 2014; Salvagno et al.,                 have shown that ultramarathons may lead to a catabolic state
2014; Vilela et al., 2015; Emed et al., 2016; Yoon et al., 2016).                    and fatigue with a decrease in triglycerides and cholesterol (Emed
In those races, exercise intensity and, therefore, mean speed is                     et al., 2016) and increases of up to fourfold in cortisol (Baur
usually relatively high, e.g., around 14 km/h in 80-km races                         et al., 2016), 100,000 IU/L in CK, 40-fold in CRP, and 20-fold in
(Zingg et al., 2015). In studies with lower mean running speed                       aspartate aminotransferase (AST) (Wu et al., 2004; Baur et al.,
around 5 km/h, distances were much longer (up to 308 km), but                        2016). At present, only one study had included low-intensity
participants still ran or jogged instead of walking (Kim et al.,                     long-duration exercise at 60% of the participants’ VO2 max, but

Frontiers in Physiology | www.frontiersin.org                                    2                                    March 2021 | Volume 12 | Article 640710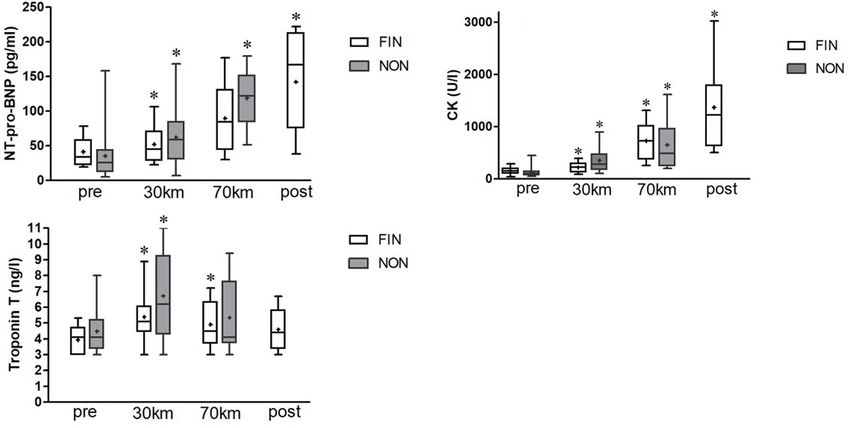
Joerres et al.                                                                                           Physiological Changes During a 100-km-March

included different disciplines like walking, cycling, and kayaking           gravel roads, soft forestry paths, or cobblestones leading through
(Marklund et al., 2013).                                                     partly flat and partly hilly terrain into the rural areas around
    Thus, previous studies assessed multiple changes during                  the city of Berlin. As shown by GPS data from 2015 to 2016,
ultramarathons in which athletes tried to reach their personal               the track has an overall ascend and descend from 600 to 700 m
limits, e.g., running or jogging the longest possible distance in            each, with an altitude profile from 7 to 85 m. In 2014, the march
48 h (Kłapcińska et al., 2013) or finish a certain distance as fast         led through the same terrain, with the same endpoint (Gusow,
as possible (Scharhag et al., 2005; Scott et al., 2009; Kim et al.,          Brandenburg, Germany).
2014; Salvagno et al., 2014; Baur et al., 2016; Yoon et al., 2016). As          Regardless of checkpoints along the track providing snacks
walking and running speed correlate with exercise intensity [e.g.,           and water as well as benches to rest, all participants were
expressed in metabolic equivalent of task (MET)] (Ainsworth                  responsible for their own gear and provisions and thus carried
et al., 1993; Mendes et al., 2018), the literature lacks information         around 2–4 kg of equipment in a backpack.
concerning long-endurance exercise of low intensity, i.e., walking              Handicaps of the march were the long distance, the lack of
instead of running among healthy human adults. While high-                   sleep, and cool temperatures especially at night. The events that
intensity endurance exercises are clearly associated with the                were part of this study took place on May 31/June 01, 2014, May
elevation of diverse stress markers, it is questionable whether low-         9/10, 2015, and May 14/15, 2016, starting at 5 pm and finishing
intensity exercise over long distances might be less stressful and,          5 pm the next day. Temperatures ranged from 6◦ C at night to
thus, more suitable for persons with pre-existing conditions, or             19◦ C during the day with average temperatures of 14.3◦ C in 2014,
if such events of low intensity elicit significant changes among             13.3◦ C in 2015, and 9.3◦ C in 2016. In 2014 and 2015, conditions
metabolic and stress parameters in healthy humans at all.                    were dry for 24 h, while in 2016, there was light drizzle (2 mm
    In addition, the number of persons living a sedentary lifestyle          over 3 h) at the end of the race.
is increasing (Arocha Rodulfo, 2019), leading to numerous                       As the conditions for all 3 years were similar concerning
adverse health effects like obesity and metabolic disorders                  temperature, weather, track, and season, all participants’ data
(Mayer-Davis and Costacou, 2001) where this western sedentary                were pooled for statistical analysis.
lifestyle could be construed as an adverse environmental factor
(Wachira et al., 2018; Koohsari et al., 2020; Lin et al., 2020).             Subjects
    The purpose of this study was, therefore, to evaluate if and             This study includes 43 healthy individuals of which were 25 male
to what extent changes in body composition and a wide range                  and 18 female. All participants attended in the MM 2014, 2015,
of serum markers are evoked in healthy adult participants by a               and 2016. Due to issues relating to serum sample data collection,
24-h–100-km walking–march of low intensity. In addition, we                  out of the 43 subjects, 32 (19 male, 13 female) were included in
aimed to assess whether there were any correlations to individual            the serum sample data analysis.
intensity, age, sex, and BMI.                                                    Recruitment was conducted with support of the event
    It was the null hypothesis of this study that there would be             organizers. All participants received an email announcing
no significant changes in the evaluated parameters evoked by the             the study with a call for participation. Interested individuals
low-intensity exercise and that individual intensity, age, sex, and          contacted the investigators via email and were provided with
BMI would not significantly influence the evaluated parameters.              information regarding the purpose of the study, methods, and
The findings might further contribute to our understanding of                used equipment before enrolling. Participants were chosen in
physiological processes of healthy human adults in response to               the order they applied and with the purpose to achieve an
low-intensity long-duration exercise and could help recreational             even distribution of females and males. There were no special
athletes in their training as well as being applied in clinical              requirements to partake in the study – all adult participants were
settings with respect to diseases of western sedentary lifestyle.            eligible for inclusion in the study. All were recreational athletes;
                                                                             some had a background of taking part in similar marches or other
                                                                             long-endurance events.
MATERIALS AND METHODS                                                            The potential study participants were given appropriate time
                                                                             to consider partaking in the study and to raise questions
Event                                                                        or concerns. All gave their informed written consent to
The “Mammutmarsch” (German for “Mammoth March,”                              partake in the study.
henceforth “MM”) is an ultramarathon challenging participants                    The study was approved by the Charité Ethics Board (review
to complete 100 km in less than 24 h (Mammutmarsch, 2018;                    number EA1/163/14), and all measurements and procedures
Maggioni et al., 2020). Other than in classical (ultra-) marathons,          complied with the Declaration of Helsinki (54th Revision 2008,
the goal is not to finish the event as fast or as far as possible            Korea) regarding the treatment of human subjects.
to cure a winner, instead the participants are required to only
walk the entire distance. Therefore, the MM addresses leisure                Measurements
athletes rather than professional (ultra-) marathon runners. As              Baseline Assessment
the event is designed as a “march” without running or jogging, it            Body mass, height, BMI, body composition, resting heart rate,
is leading to a continuous long-duration exercise of low intensity,          and serum parameters were measured pre-race in a standardized
which marks the unique setting of this event. In 2016, around                laboratory environment indoors in an air-conditioned laboratory
2,000 athletes participated. The track consists of paved roads,              (temperatures 18–21◦ C) the week prior to the event. To assess

Frontiers in Physiology | www.frontiersin.org                            3                                     March 2021 | Volume 12 | Article 640710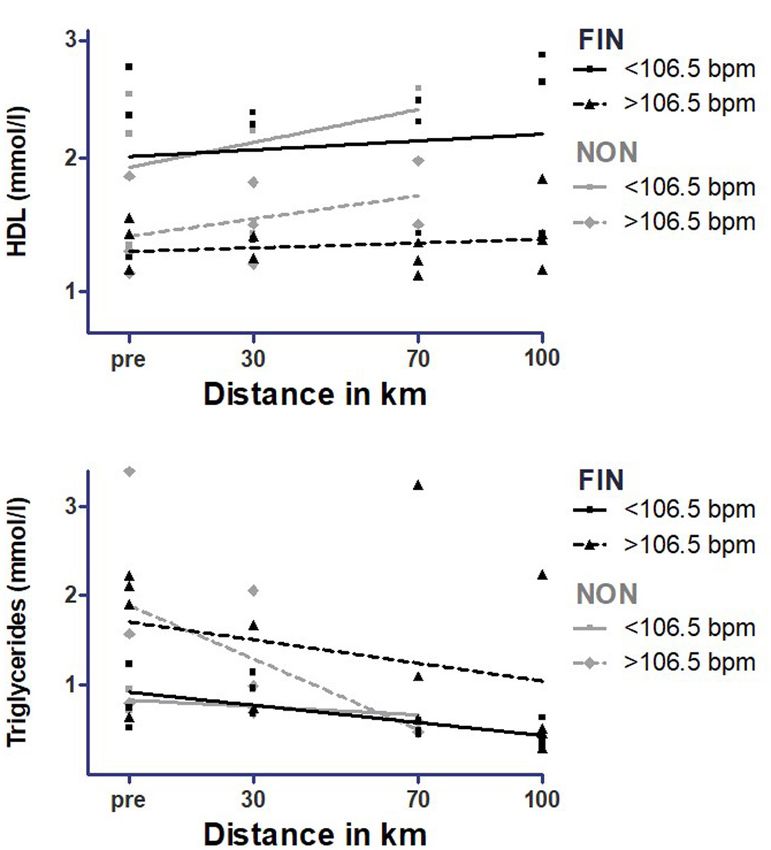
Joerres et al.                                                                                         Physiological Changes During a 100-km-March

training status with regard to our study, the participants filled          intensity {metabolic equivalent of task [1 MET = energy
out a questionnaire about the distances covered per week on                expenditure with an oxygen consumption of 3.5 ml O2 /kg/min,
foot (including both walking and jogging) of the previous                  resembling resting metabolic rate equal to 1 kcal/kg/h (Ainsworth
half year prior to the event and self-evaluated their endurance            et al., 1993)]}, energy expenditure, steps, time of activity,
capability on a rating scale from 1 to 10. Subjects were advised           and duration of wearing the armband. Especially in cooler
to have fasted for 6–8 h and to abstain from sleep deprivation             environments (Van Hoye et al., 2014) and in light exercise
the previous night as well as alcohol and drug consumption                 (Santos-Lozano et al., 2017) – like in the presented study –
(except for oral contraceptives for the female subjects) and from          the SenseWear armband can be considered an accurate tool
caffeine consumption the morning of the test. Directly before the          for assessment of energy expenditure. Each participant was
measurements, participants were instructed to empty the bladder            instructed how to wear the actimeter and to set a time
and to remove all jewelry for pre-race measurements.                       stamp right before starting and finishing the march. The
    Anthropometric data were gathered with a calibrated scale              collected data were analyzed using the manufacturer’s software
and height meter (Seca, Germany) on an even surface while                  (SenseWear Professional 7.0). From these data, mean walking
participants wore only minimal clothing (light underwear). Mean            speed was determined.
resting heart rate was measured for all the participants with                  To measure heart rate during the race, mobile heart rate
a mobile heart rate monitor [RS800CX, Polar (Williams et al.,              monitors [RS800CX, Polar (Williams et al., 2017)] were handed
2017)] in a supine position for 10 min.                                    out to 16 participants.
    Body composition was evaluated using bioelectrical                         Serum samples were taken at 30 and 70 km checkpoints
impedance analysis (BIA) via the tetra polar electrode method              and stored as mentioned above, and the same parameters were
with a BIA 101 device from AKERN, Italy (Lukaski and                       determined as in the pre-race measurements. For the collection,
Bolonchuk, 1988; Jaffrin and Morel, 2008). The BIA 101                     a pavilion with a bench and a table were set up at the checkpoints.
measures resistance at a fixed constant sine current of 50 kHz             To reduce influence on serum parameters by consumed food or
for the determination of reactance in human tissue and has been            fluids, the participants were instructed to neither eat nor drink
clinically validated to allow the evaluation of body composition           1 h before arriving at the checkpoints.
(Segal et al., 1988) and provided a mobile platform of data
collection during our study. For quantification of fat mass, lean          Post-race Measurements
tissue mass, and percent body fat, the formula of Segal et al.             Only for participants who reached the 70- or 100-km checkpoint,
for non-obese subjects was used. The equation is validated to              post-measurements were performed.
assess body composition in heterogeneous populations (Segal                    Post-race measurements for participants who reached the 100-
et al., 1988). To assess total body water, the formula of Sun et al.       km checkpoint were carried out within 30 min at the finishing
(2003) was applied. Measurements were conducted while the                  area; as for the earlier checkpoints, no foods or drinks were to
participants were in a supine position after having laid down              be consumed 1 h before reaching the finish and until completing
for 10 min to allow equal redistribution of body fluids in all             all measurements. For participants who dropped out at the 70-
instances, with minimal clothing and removed metals. For all               km checkpoint, all post-measurements were carried out there.
measurements, the right limbs were used. Undoubtedly incorrect             The BIA measurements were conducted in the same manner
calculations (one participant) were excluded.                              as during baseline assessment. After all participants finished the
    Serum samples were taken from cubital vein blood collections           march (or dropped out at an earlier stage), blood samples were
in a Sarstedt S-Monovette , immediately chilled on ice (without
                                  R
                                                                           transported and centrifuged for 10 min at 2,000 × g. They were
direct contact to the ice to avoid freezing), and stored in                stored overnight at 4◦ C and sent to the laboratory the next day.
a sealed cooling box. Directly after the race, samples were
centrifuged for 10 min at 2,000 × g. Afterward, they were                  Statistical Analysis
stored overnight at 4◦ C and sent to the laboratory the                    Acquired data were analyzed using appropriate statistical
next day. The parameters NT-pro-BNP (pg/ml), troponin T                    tests (mixed-effects analysis, t-test, and linear regression for
(ng/L), CRP (mg/L), cortisol (µg/dl), low-density lipoprotein              correlation analysis) with the statistical software GraphPad
(LDL) (mmol/L), high-density lipoprotein (HDL) (mmol/L),                   Prism , Version 8, GraphPad Software Inc., United States.
                                                                                 R

triglycerides (mmol/L), total cholesterol (mmol/L), total CK                  We analyzed two groups accordingly to their performance:
(U/L), CK-MB (U/L), AST (U/L), ALT (U/L), and sodium                       participants who were able to finish the entire MM (FIN) and
(mmol/L) were determined by a certified laboratory [Labor 28               participants who dropped out at an earlier stage (NON).
GmbH, Berlin, Germany, accredited at the “DAkkS” (Deutsche                    Differences in anthropometric data in FIN and NON-and
Akkreditierungsstelle GmbH), the national accreditation body               in between sexes were analyzed with an unpaired t-test. Body
for the Federal Republic of Germany, pursuant to regulation (EC)           composition pre- and post-race was analyzed with paired t-test.
number 765/2008 and the accreditation body act of Germany]                    All statistical analyses for serum parameters were carried out
(Deutsche Akkreditierungsstelle GmbH, 2020).                               with mixed-effects ANOVA. This mixed model uses a compound
                                                                           symmetry covariance matrix and is fit using restricted maximum
In-Race Measurements                                                       likelihood (REML). In the absence of missing values, this method
Actimeter armbands (SenseWear ) were given to 20 participants
                                           R
                                                                           gives the same p values and multiple comparisons tests as
in order to measure body activity parameters such as exercise              repeated measures ANOVA. In the presence of missing values

Frontiers in Physiology | www.frontiersin.org                          4                                    March 2021 | Volume 12 | Article 640710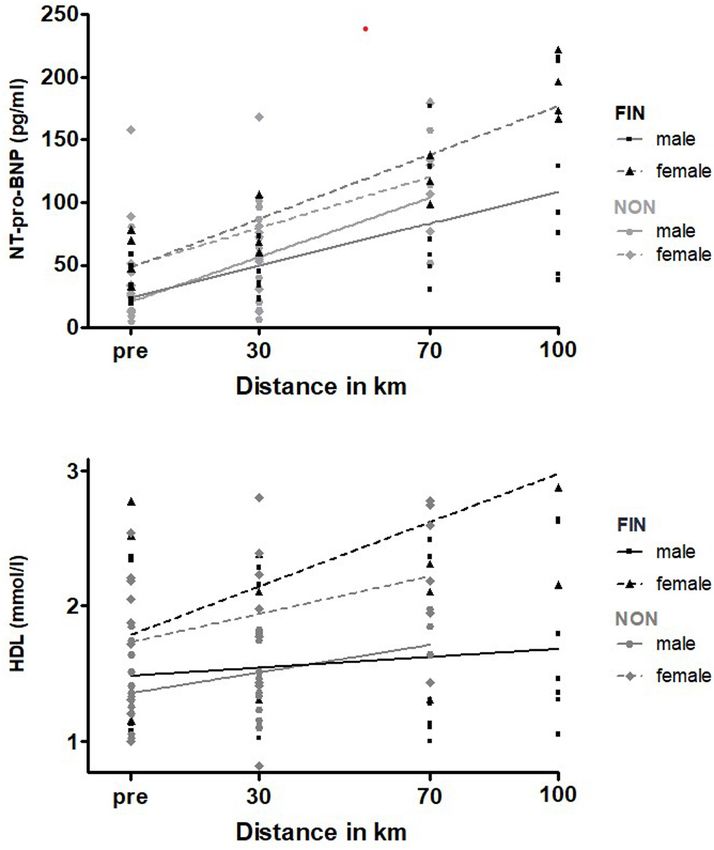
Joerres et al.                                                                                                  Physiological Changes During a 100-km-March

(missing completely at random), the results can be interpreted             TABLE 1 | Anthropometric data and demographics.
like repeated measures ANOVA.
                                                                                                                                    FIN
   Additionally, to assess differences in between single time
points, paired t-tests were performed in FIN and NON.                                                                m              f           p (m vs. f)
   Overall, these were the following numbers of cases in each
                                                                           n                                          7             4
group:
                                                                           Age (years)                           35.9 ± 10.8    33.8 ± 4.8         0.72
    – FIN: pre: n = 11; 30 km: n = 9; 70 km: n = 10; 100 km: n = 11        Height (cm)                          182.7 ± 11.0 176.8 ± 4.5           0.33
                                                                           Weight (kg)                           76.1 ± 8.6     68.3 ± 46.1        0.14
In 2014, only pre- and post-values were assessed, and in 2015,
                                                                           BMI (kg/m2 )                          22.8 ± 1.1     21.1 ± 0.5       < 0.02*
one finishing participant missed the tent for collection of blood
                                                                           Resting heart rate (bpm)              69.0 ± 5.3    56.75 ± 10.1        0.09
samples at 30 km.
                                                                           Distance covered per week (km)        39.5 ± 5.1     79.3 ± 27.2        0.11
    – NON: pre: n = 21; 30 km: n = 21; 70 km: n = 8; 100 km:               Endurance capability (self-rating,      7.7 ± 0.2     7.5 ± 0.5         0.73
      n=0                                                                  1–10)

                                                                                                                                   NON
Means at different time points between groups (FIN; NON) were
analyzed using unpaired t-tests.                                                                                     m              f           p (m vs. f)
   All serum parameters were analyzed for correlation
concerning different MET levels, speed, age, BMI, baseline                 n                                         12             9
NT-pro-BNP, mean heart rate during the race, and sex with                  Age (years)                           39.3 ± 2.3     27.8 ± 1.9       < 0.01*
linear regression analysis. Regression lines were analyzed                 Height (cm)                          179.5 ± 3.7    171.8 ± 2.3       < 0.03*
regarding goodness of fit (r2 ), differences in increase or decrease       Weight (kg)                           82.5 ± 2.7     64.4 ± 2.9       < 0.01*
of parameters between the evaluated groups (slope), and                    BMI (kg/m2 )                          25.5 ± 0.5     21.8 ± 0.7       < 0.01*
differences in overall levels of parameters between the evaluated          Resting heart rate (bpm)              63.1 ± 7.2     66.7 ± 11.3        0.41
groups (y-intercept = elevation). If slopes differed too much,             Distance covered per week (km)        34.0 ± 9.0     38.7 ± 11.7        0.77
it was not possible to calculate whether y-intercepts differed             Endurance capability (self-rating,      8.0 ± 0.8     6.4 ± 1.3         0.02*
significantly (“not computable” = “n.c.”).                                 1–10)
   Data of participants reaching the finish line after the 24-h time                                                            FIN vs. NON
limit were used for statistical analyses as well (n = 2).
   Results are presented as means ± SD. Statistical significance                                                   FIN            NON         p (FIN vs. NON)
was assumed at p < 0.05.
                                                                           n                                         11            21
                                                                           Age (years)                           35.7 ± 9, 7    34.3 ± 9.0         0.72
                                                                           Height (cm)                          180.5 ± 9.4    176.2 ± 8.2         0.18
RESULTS
                                                                           Weight (kg)                          72.36 ± 8.5     74.8 ± 12.7        0.58
                                                                           BMI (kg/m2 )                          22.2 ± 1.3     23.9 ± 2.6       < 0.05§
Demographics and Performance
                                                                           Resting heart rate (bpm)              64.5 ± 9.2     64.6 ± 9.1         0.97
A total of 32 athletes out of the 43 (25 male, 18 female; age
                                                                           Distance covered per week (km)        55.4 ± 38.6    36.6 ± 29.7        0.18
33.4 ± 8.9 years; BMI: 23.6 ± 2.7 kg/m2 ; resting heart rate
                                                                           Endurance capability (self-rating,      7.6 ± 0.2     7.1 ± 0.3         0.32
66.7 ± 11.3 bpm) partaking in all three MM competitions
                                                                           1–10)
delivered usable serum samples and were included in the
statistical analysis. Out of those 32 athletes, 11 athletes                Depicted are anthropometric data and subject demographics for male (m) and
                                                                           female (f) subgroups in FIN and NON as well as a comparison between all subjects
were able to complete the 100-km course (FIN) and 21                       of FIN and NON (presented are means ± SD).
competitors withdrew during the race (NON), due to fatigue or              ∗ Significant difference between male and female.
                                                                           § Significant difference between FIN and NON.
musculoskeletal complaints. Table 1 depicts demographic and
anthropometric data, as well as resting heart rate and the history
of weekly covered distance on foot of the half year prior to the
MM and the self-rated endurance capability of FIN and NON as               slowest after 24.78 h. The fastest female completed the race
well as female and male participants.                                      in 21.75 h and the slowest in 23.32 h. Mean speed was
   In both groups, FIN and NON, males had a significantly                  4.12 ± 0.76 km/h in both sexes.
greater BMI than females. Additionally, in NON, male subjects                 Subjects of FIN (4.39 ± 0.26 km/h) were faster compared
were significantly older, taller, and heavier than female subjects,        with subjects of NON (3.87 ± 0.98 km/h) as a trend (p = 0.19).
and the FIN group showed a more homogenous distribution                    The subjects with the highest and lowest mean speed were both
in demographic and baseline parameters. Individuals who were               subjects of NON, with a mean speed of 4.94 and 2.32 km/h,
able to finish the race (FIN) had a significantly lower BMI than           respectively. FIN had a greater history of endurance training per
participants who dropped out at an earlier stage (NON).                    week as a trend (55.4 ± 38.6 vs. 36.6 ± 29.7 km; p = 0.18). Overall,
   On average, finishers needed 22.83 h to complete the race,              participants self-rated their endurance capability (mean) with a
while the fastest male finisher ended after 21.68 h and the                7.3 out of 10 points; there were no significant differences between

Frontiers in Physiology | www.frontiersin.org                          5                                             March 2021 | Volume 12 | Article 640710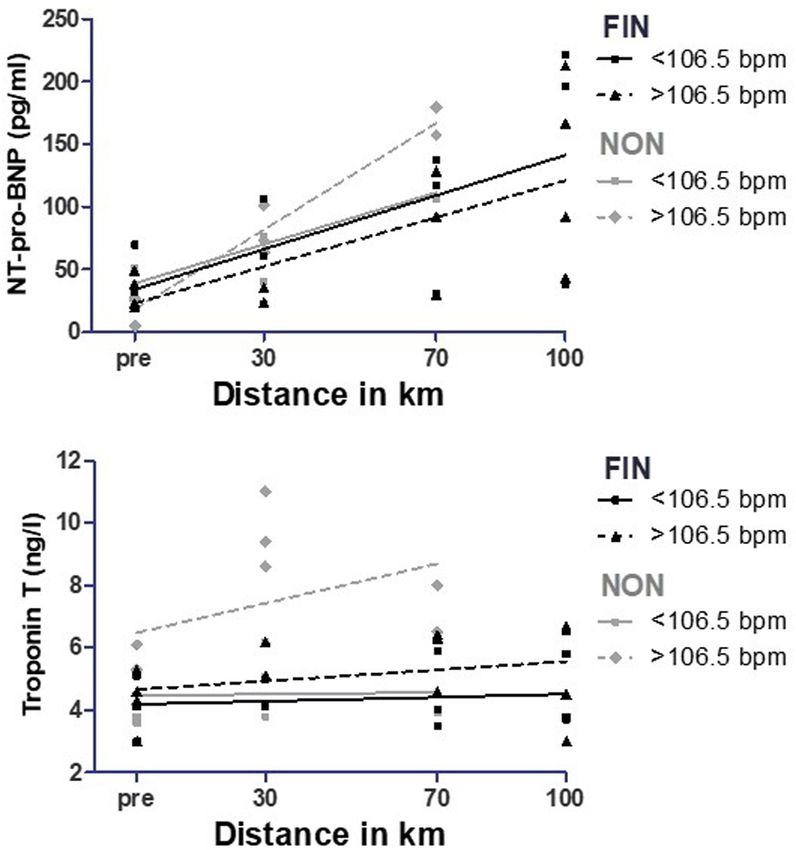
Joerres et al. Physiological Changes During a 100-km-March
FIN and NON (7.6 ± 0.2 vs. 7.1 ± 0.3, p = 0.32), but male subjects LDL, and triglycerides as well as a significant HDL increment
in NON-self-rated their endurance capability significantly higher (p < 0.05 for all).
than female subjects (8.0 ± 0.8 vs. 6.4 ± 1.3, p = 0.02).
Stress and Inflammatory Markers
Body Composition C-reactive protein increased significantly over the course of the
Participants reaching the 70-km checkpoint or the 100-km finish MM in both groups starting at 70 km (Figure 3A). Cortisol
were included in this analysis (n = 18, 9 female, 9 male), and one levels also changed significantly in both groups (Figure 3B). Of
participant who delivered faulty data was ruled out. interest, at 30 km, the cortisol level in NON-was significantly
Pre-event mean body weight was 70.4 ± 10.3 kg with a mean higher than that in FIN, since the cortisol level initially declined
BMI of 22.4 ± 2.0 kg/m2 . Both weight and BMI decreased in the FIN group.
significantly post-event to 69.7 ± 10.2 kg (mean 1 = 0.7 kg;
p < 0.01) and 22.1 ± 2.0 kg/m2 (p < 0.01), respectively. BIA Sodium Alterations
testing revealed significant changes: lean body mass decreased Sodium levels declined in both FIN and NON-groups, while a
from 57.1 ± 10.5 to 56.2 ± 10.3 kg (p < 0.01) that correlated with stronger decrease was observed in the FIN group up to 70 km
a loss in total body water (42.1 ± 8.5 L before vs. 41.3 ± 8.1 L after distance (Figure 4).
MM; p < 0.01) (Mayer-Davis and Costacou, 2001). According to
the fat-specific formula (male < 20%; female < 30% body fat) of
Segal et al., this represents a loss of approximately 1.6% (0.9 kg)
Correlation Analysis
and 1.9% (0.8 L), respectively. The percentage of body fat did not Metabolic Equivalent of Task
change significantly (Table 2). Out of the 20 participants wearing actimeter armbands, 15
delivered usable serum samples (n = 15) for correlation analysis
[7 out of 11 finishing participants (FIN) and 8 of 21 non-finishers
Serum Analysis (NON)]. From those participants, serum samples were gathered
Serum parameter of FIN and NON-are depicted in
for correlation analysis. Mean MET did not differ significantly
Supplementary Table 3.
between groups or sex (Supplementary Table 2).
Data from the SenseWear armbands showed that participants
Cardiac and Skeletal Muscle Cell Markers
had a higher MET in the first quarter of the race (18:00–24:00)
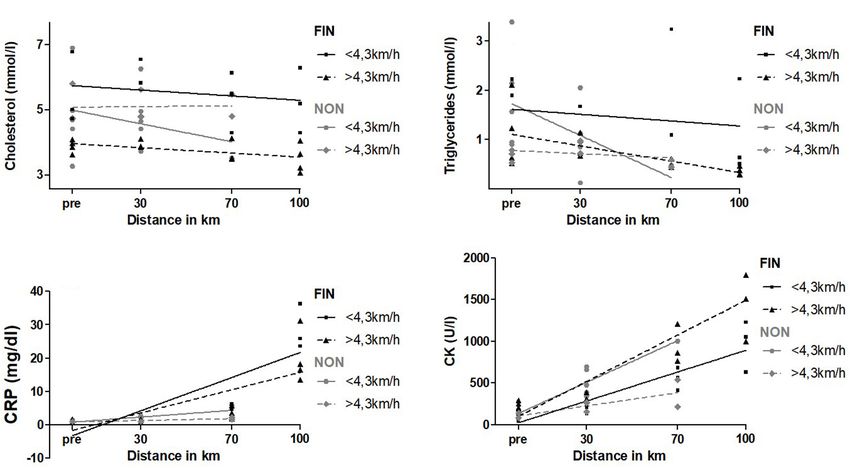
In both groups, serum levels of NT-pro-BNP, CK, and CK-
in comparison to the last three quarters: mean MET from 18:00
MB increased significantly over the course of the MM. There
to 24:00 h was 5.2, and from 24:00 to 18:00 h the next day, 4.4
were no significant differences for means at certain checkpoints
(p < 0.01). Five MET was chosen as a cut-off value for a most
between NON-and FIN (Figures 1A–C). Interestingly, mixed-
even distribution. Participants who exhibited a higher mean MET
effects ANOVA for troponin T showed significant results, driven
(MET > 5) finished the track in a shorter time and walked with
by a significant increase only at the 30-km checkpoint (p < 0.05),
a higher speed as a trend [3.95 ± 0.89 vs. 4.36 ± 0.47 km/h
but not at 70 and 100 km (Figure 1B).
(p = 0.32)]. Mean MET for subjects with a mean MET < 5 was
4.54 ± 0.31; for MET > 5, it was 5.25 ± 0.18.
Fat Metabolism
Participants with mean MET < 5 showed a significantly higher
Triglycerides decreased significantly over the duration of the
slope (= higher increase) for NT-pro-BNP (Figure 5) and CK-
MM by over 50% (Figure 2A) in NON-and in FIN as a strong
MB in FIN. In NON, CK increased significantly greater for
trend (p < 0.06). LDL decreased by approximately 20% as
participants with lower mean MET (Supplementary Table 3).
a strong trend in FIN (p = 0.05) (Figure 2B), while HDL
Our data indicate that NT-pro-BNP increased stronger in
increased significantly in NON (Supplementary Table 1). Paired
non-finishing participants (NON). The slope for NT-pro-BNP
t-tests showed a significant decrease after 70 km for cholesterol,
was significantly greater in NON-for participants that walked
with a mean MET > 5 than in FIN (Table 3).
TABLE 2 | Body composition pre- and post-race.
Speed
Body composition Concerning speed, participants were divided into two subgroups:
mean speed >4.3 km/h (mean: 4.65 ± 0.15 km/h) and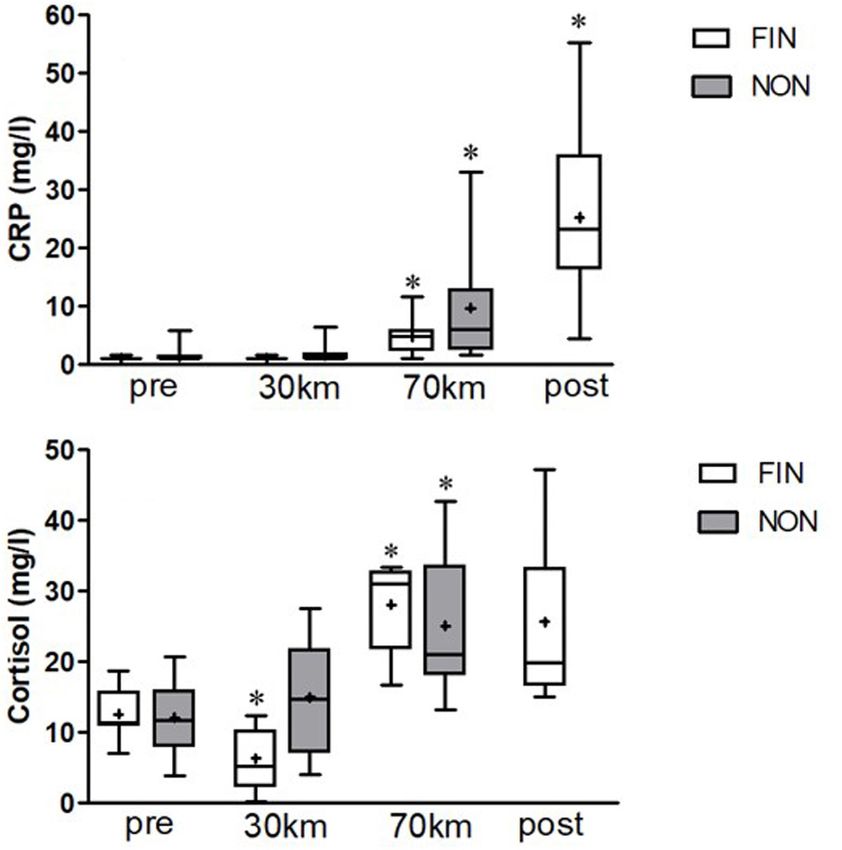
Joerres et al.                                                                                                       Physiological Changes During a 100-km-March

  FIGURE 1 | NT-pro-BNP (A), troponin T (B), and creatine kinase (CK) (C) alterations in finishers (FIN) and non-finishers (NON). Boxes represent 25th to 75th
  percentile, and whiskers minimum to maximum. Horizontal line shows median, and + shows mean. *Shows significant alterations to the previous checkpoint (paired
  t-tests, p < 0.05).

greater increase of CK (Figure 6D). Exact values are presented                      significantly higher increase for CK, CK-MB, and AST for
in Supplementary Table 4.                                                           participants with a higher BMI in FIN (p < 0.01) (Figure 8A).
   In the subgroup of faster participants > 4.3 km/h, finishers                     In NON, participants with higher BMI showed significantly
showed a significantly greater increment of CK than non-                            higher elevations of LDL and lower HDL levels. Slopes did not
finishers (slope FIN: 13.9 ± 2.0; slope NON: 3.9 ± 1.3; p < 0.01).
In participants with a mean speed  23 kg/m2                                  represent 25th to 75th percentile, and whiskers minimum to maximum.
                                                                                     Horizontal line shows median, and + shows mean. *Shows significant
was 25.4 ± 2.0 kg/m2 ; in the group < 23 kg/m2 , it                                  alterations to the previous checkpoint (paired t-tests, p < 0.05).
was 21.4 ± 1.3 kg/m2 . Linear regression analysis showed a

Frontiers in Physiology | www.frontiersin.org                                   7                                          March 2021 | Volume 12 | Article 640710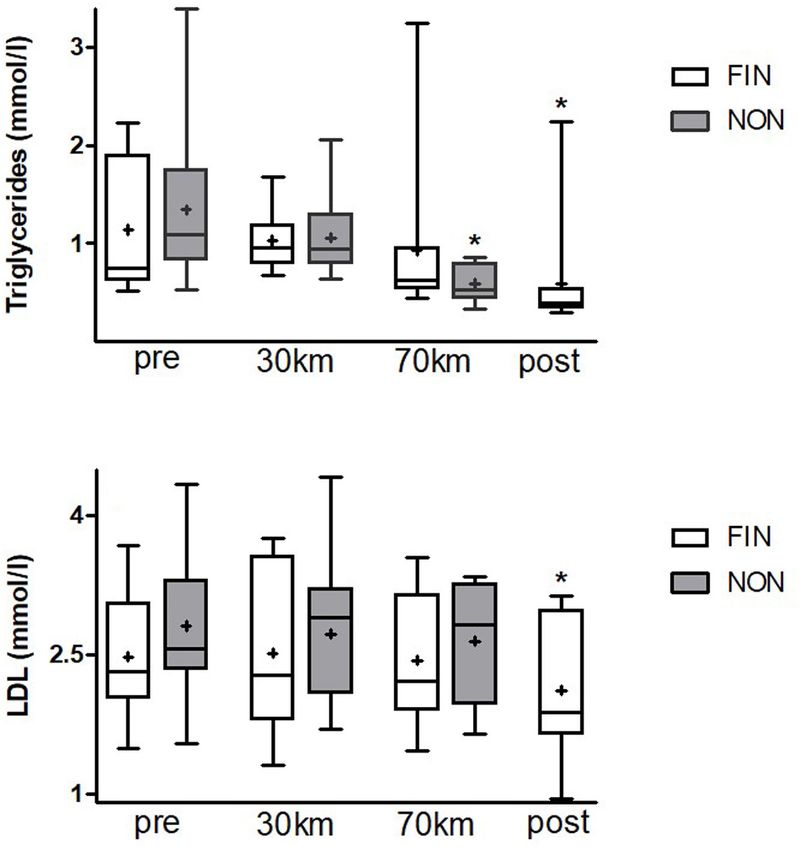
Joerres et al.                                                                                                            Physiological Changes During a 100-km-March

                                                                                         FIGURE 5 | NT-pro-BNP over MET in FIN and NON. The black line represents
                                                                                         the regression line in FIN, and the gray line represents the regression line in
                                                                                         NON.

                                                                                           For all the other parameters, there were no significant changes,
                                                                                        or linear regression was not a fitting model.

                                                                                        Baseline NT-pro-BNP
                                                                                        It was also evaluated whether a higher baseline NT-pro-BNP > 30
  FIGURE 3 | C-reactive protein (CRP) (A) and cortisol (B) alterations in FIN and       pg/ml led to different changes in serum parameters than a lower
  NON. Boxes represent 25th to 75th percentile, and whiskers minimum to                 baseline NT-pro-BNP < 30 pg/ml with linear regression analysis.
  maximum. Horizontal line shows median, and + shows mean. *Shows                       NT-pro-BNP values for participants with higher baseline NT-
  significant alterations to the previous checkpoint (paired t-tests, p < 0.05).
                                                                                        pro-BNP increased relatively stronger, shown by a significantly
                                                                                        higher slope in linear regression analysis in FIN (Supplementary
                                                                                        Table 8 and Figure 10).
                                                                                            In the subgroup of participants with a baseline NT-pro-
                                                                                        BNP < 30 pg/ml, subjects who were not able to finish the race
                                                                                        (NON) had a significantly greater increment of NT-pro-BNP
                                                                                        over the course of the MM, compared with FIN (slope NON:
                                                                                        1.37 ± 0.24; slope FIN: 0.30 ± 0.09; p < 0.01). In subjects with
                                                                                        a baseline NT-pro-BNP > 30 pg/ml, there were no significant
                                                                                        changes. Finally, heart rate did not differ significantly for groups
                                                                                        with regard to NT-pro-BNP.

                                                                                        Mean Heart Rate During the Race
  FIGURE 4 | Sodium alterations in FIN and NON. Boxes represent 25th to 75th            All serum parameters were analyzed with linear regression
  percentile, and whiskers minimum to maximum. Horizontal line shows                    analysis for significant differences between participants that had
  median, and + shows mean. *Shows significant alterations to the previous              a mean heart rate 106.5 bpm during the race;
  checkpoint (paired t-tests, p < 0.05).
                                                                                        106.5 bpm was the median and chosen as the cut-off value. Mean
                                                                                        heart rate during the race in FIN was 106.8 ± 8.5 bpm; in NON,
                                                                                        it was 108.5 ± 13.4 bpm (p = 0.79).
differ significantly (Figures 8B,C). CRP increased stronger in                              In NON, NT-pro-BNP showed a significantly higher increase
participants with a higher BMI as a trend in both FIN and                               in participants with a mean heart rate > 106.5 during the MM
NON (p < 0.10) (Figure 8D). Exact values are presented in                               (p = 0.02) (Figure 11A and Supplementary Table 9). Participants
Supplementary Table 6.                                                                  with a greater heart rate during the MM > 106.5 bpm showed
                                                                                        significantly higher levels for troponin T (p = 0.02) and higher
Sex                                                                                     levels for triglycerides as a trend (p = 0.11) (Figures 11B, 12B and
All serum parameters were analyzed with linear regression                               Supplementary Table 9). In FIN, participants with greater heart
analysis for significant differences in male and female. NT-pro-                        rate during the race had significantly higher values of triglycerides
BNP and HDL showed significantly higher elevations in females                           (p = 0.02), and troponin T levels were greater as a trend (p < 0.10)
of both FIN and NON-groups (Figures 9A,B). Baseline NT-                                 (Figures 11B, 12B and Supplementary Table 9). In both FIN
pro-BNP was significantly higher in females (54.20 ± 10.60                              and NON, subjects with lower heart rates during the race had
pg/ml) as confirmed by t-test (male: 25.9 ± 4.6 pg/ml; p = 0.01).                       significantly higher elevations of HDL (p < 0.01 in FIN and
Supplementary Table 7 depicts the exact results.                                        p = 0.02 in NON) (Figure 12A and Supplementary Table 9).

Frontiers in Physiology | www.frontiersin.org                                       8                                           March 2021 | Volume 12 | Article 640710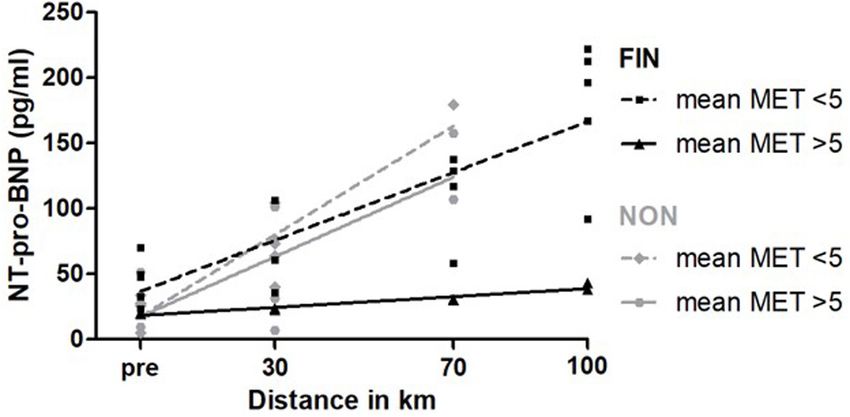
Joerres et al.                                                                                                             Physiological Changes During a 100-km-March

TABLE 3 | NT-pro-BNP over MET subgroups dependent on outcome.

Linear regression                                                                    MET < 5                                                    MET > 5

                                                                         FIN                          NON                           FIN                          NON

n                                                                          5                            4                            2                             4
NT-pro-BNP                                  r2                           0.67                         0.85                          0.93                         0.64
(pg/ml)                                   Slope                      1.30 ± 0.78                   2.08 ± 0.33                  0.21 ± 0.02                  1.52 ± 0.40
                                        Elevation                   36.86 ± 15.21                17.60 ± 10.06                 18.19 ± 1.45                 17.63 ± 14.80
                                    p (lines different?)             Slope: 0.17                 Elevation: 0.98               Slope: < 0.01                Elevation: n.c.

Presented are linear regression parameters for NT-pro-BNP in participants exercising with a mean MET > 5 and < 5 in FIN and NON. Presented are goodness of fit (r2 ),
slope ± SD, elevation ± SD, and p values for slope and elevation to determine whether regression lines are significantly different. NT-pro-BNP levels rise significantly
stronger in NON in the subgroup of MET > 5, shown by a significantly greater slope.

    FIGURE 6 | Cholesterol (A), triglycerides (B), CRP (C), and CK (D) over speed in FIN and NON. The black line represents the regression line in FIN, and the gray line
    represents the regression line in NON.

DISCUSSION                                                                               actimeter armbands showed that the MM was conducted at a
                                                                                         lower mean speed (4.12 km/h) and therefore lower intensity
This study was conducted to evaluate whether a low-intensity                             (mean MET ≈5) than in classical (ultra-) marathons, conducted
long-endurance march, during which participants were walking                             with jogging and running speeds of 8–14 km/h (Scharhag et al.,
instead of running or jogging, would elicit similar changes                              2005; La Gerche et al., 2008) and a mean energy expenditure of
in body composition, metabolism, and cardiovascular risk                                 8–10 (Mendes et al., 2018); in addition, the average in-race heart
markers as described previously in higher intensity marathons or                         rate (≈106–108 bpm) was comparatively low.
ultramarathons (Ginsburg et al., 1996; Fallon, 2001; Wu et al.,                             The considerable amount of distances covered on foot per
2004; Scharhag et al., 2005, 2006; Knechtle et al., 2008a; Scott                         week (≈35–55 km), a good self-evaluated endurance capacity
et al., 2009; Kasprowicz et al., 2013; Kłapcińska et al., 2013;                         (≈7.3 out of 10) combined with the low-normal mean resting
Marklund et al., 2013; Kim et al., 2014; Salvagno et al., 2014; Vilela                   heart rates (≈67 bpm) (Kannel et al., 1987), and a normal mean
et al., 2015; Baur et al., 2016; Emed et al., 2016; Yoon et al., 2016;                   BMI (≈22–25 kg/m2 ; Global Bmi Mortality Collaboration et al.,
Coker et al., 2017). To our knowledge, this is the first investigation                   2016) suggest that our study participants were aerobically fit and
to evaluate a broad range of physiological parameters among                              healthy recreational athletes, but not highly trained endurance
healthy human adults in such a unique setting. Data from                                 athletes who display much lower resting heart rates of below

Frontiers in Physiology | www.frontiersin.org                                        9                                           March 2021 | Volume 12 | Article 640710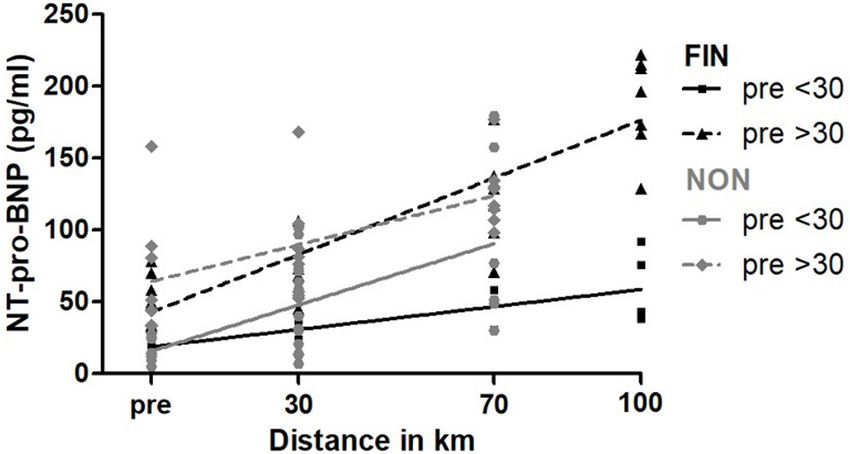
Joerres et al.                                                                                                         Physiological Changes During a 100-km-March

                                                                                          required to walk instead of running or jogging, would cause no
                                                                                          elevation of muscle and cardiac stress markers among our study
                                                                                          participants. However, measurements of several physiological
                                                                                          parameters as well as testing for the various serum stress markers
                                                                                          indicated that, opposite to our working hypothesis, significant
                                                                                          changes in stress parameters, such as CRP, CK, CK-MB, AST,
                                                                                          ALT, cortisol, and NT-pro-BNP, have occurred, as well as in
                                                                                          parameters of lipid metabolism (cholesterol, LDL, HDL, and
                                                                                          triglycerides). As further discussed below, we conclude that the
                                                                                          distance, intensity, and most importantly duration determine the
                                                                                          exertion and, thus, the physiological impact.

  FIGURE 7 | Sodium over speed in FIN and NON. The black line represents the              Body Composition and Hydration Status
  regression line in FIN, and the gray line represents the regression line in NON.        As previously shown by other studies (Knechtle et al., 2008a; Baur
                                                                                          et al., 2016), we observed a significant decrease in total body
                                                                                          mass (−1%, p < 0.01) over the course of this low-intensity long-
50 bpm (Doyen et al., 2019) and, in severe cases, even below                              endurance event. In contrast to the higher intensity multistage
30 bpm (Jensen-Urstad et al., 1997).                                                      ultramarathons described by Baur et al. (2016) and Knechtle et al.
   It is a noteworthy finding that despite a greater amount of                            (2008a), the weight loss in our study was caused by a loss of fat-
distance covered on foot per week by the female subjects of our                           free mass (−1.6%, p < 0.01) and a decrease in total body water
study in both FIN and NON, the self-rated endurance capability                            (TBW; −1.9%, p < 0.01), respectively. In contrast, the mentioned
was lower as a trend among women compared with men in                                     studies found a significant loss in fat mass [24.4% (Baur et al.,
FIN and differed significantly between men and women in NON                               2016) and 42.7% (Knechtle et al., 2008a)] with no significant
(8.0 ± 0.8 vs. 6.4 ± 1.3; p = 0.02). This supports previous                               changes in TBW (Baur et al., 2016) and lean body mass or even
findings that women underestimate their capabilities in general                           a significant increase in TBW (Knechtle et al., 2008a). Knechtle
(Beyer, 1990) and their physical performance in particular                                et al. (2008b) described a correlation between intensity and loss
(Obling et al., 2015). Further research appears warranted with                            of body fat during the Triple Iron Triathlon Germany 2006 in
regard to self-perceived gender differences among marathon and                            Lensahn. Participants with a better performance during the MM
ultramarathon runners.                                                                    showed a moderately larger decrease in fat mass. This effect is also
   We hypothesized that the low working intensity of the                                  described in laboratory settings; in their study with 18 moderately
evaluated “Mammutmarsch,” during which participants were                                  trained cyclists taking part in continuous prolonged exercise tests,

  FIGURE 8 | CK (A), LDL (B), HDL (C), and CRP (D) over BMI in FIN and NON. The black line represents the regression line in FIN, and the gray line represents the
  regression line in NON.

Frontiers in Physiology | www.frontiersin.org                                        10                                      March 2021 | Volume 12 | Article 640710
Joerres et al. Physiological Changes During a 100-km-March
FIGURE 10 | NT-pro-BNP over baseline NT-pro-BNP in FIN and NON. The
black line represents the regression line in FIN, and the gray line represents
the regression line in NON.
2013; Coker et al., 2017), we conclude that a loss of body
mass is most likely a consequence of sweating in connection
with insufficient rehydration. This assumption is supported by
our data showing a decrease in serum sodium levels over
the course of the MM that resulted in a mild hyponatremia
in six participants (minimum: 131 mmol/L). This could be
interpreted as a consequence of dehydration and rehydration
with large amounts of fluids, resulting in dilution hyponatremia
FIGURE 9 | NT-pro-BNP (A) and HDL (B) over sex in FIN and NON. The black
(Knechtle and Nikolaidis, 2018).
line represents the regression line in FIN, and the gray line represents the Nevertheless, sodium levels reached no critical values,
regression line in NON. implying adequate rehydration. Supportingly, Noakes
et al. (2005) described a loss of body mass < 3% as a
status of euhydration.
Achten et al. (2002) found that with higher intensity, there is an Linear regression analysis showed that younger participants
increase in fat oxidation, up to a maximum fat oxidation rate at had a stronger decrease of sodium. A possible explanation for
an intensity of 64 ± 4% of VO2 max. Nevertheless, Coker et al. this might be training status. In their review, Knechtle and
(2017) described that during the Yukon Arctic Ultramarathon, Nikolaidis (Knechtle and Nikolaidis, 2018) suggested an age of
which also takes place at lower intensities, in this case with 30–50 to be the “best” years to take part in an ultramarathon.
an average speed of 2–3 mph (corresponding to 3.2–4.8 km/h), The longer the distance, the better the achievements of the
fat loss occurred. It should be mentioned that in this setting older participants were (Knechtle et al., 2014). This implies
participants marched up to 430 miles (≈690 km) in 7–14 days adaptation to long-term training (Knechtle and Nikolaidis, 2018).
in adverse climate conditions with temperatures reaching down Additionally, it is scientific consensus that aging reduces the
to −45◦ C. Thus, participants suffered from exercise-induced sensitivity of sweat glands to acetylcholine, leading to a reduced
caloric expenditure for a much longer period of time, with sudomotor function (Lee et al., 2016). Therefore, by sweating
chronic exposure to extreme cold as an additional burden. Also more, younger participants might have lost more sodium than
in the studies of Baur et al. (2016) and Knechtle et al. (2008a), older participants. Furthermore, it is widely accepted that older
participants exercised 30 to more than 48 h in two to three subjects feel less thirst and therefore drink later (Arai et al.,
consecutive days. Alpert (2005) described 290 kJ/kg per day the 2014). Thus, we speculate that there was less sodium loss and
maximal transfer rate of energy from FM. With a mean FM of blood dilution, explaining the relatively higher sodium levels in
approximately 13.3 kg in this study, this results in a maximal older participants.
possible fat loss of roughly 120 g, assuming 7,700 kcal (about
32,000 kJ) is needed to burn 1 kg of body fat (Wishnofsky, 1958). NT-pro-BNP
Thus, most likely the maximum duration of 24 h was not enough Synthesis of NT-pro-BNP is triggered mechanically by ventricle
to exhibit a significant loss of FM, regardless of the intensity. But stretching and neurohumoral stimulation (Nakagawa et al.,
even under these extreme settings, several studies reported high 1995). Among other cardiac stress markers, NT-pro-BNP
levels of muscle preservation (Knechtle et al., 2008a; Saugy et al., increased significantly in every single participant. Over the course
2013; Coker et al., 2017). of the march, there was almost a fourfold increment from 37.4
From the fact that the loss of body mass in our study is to 142.2 pg/ml. Notably, NT-pro-BNP values of > 125 pg/ml
mainly a loss of TBW, associated with muscle preservation in can indicate acute congestive heart failure (Maisel et al., 2002;
even more extreme settings (Knechtle et al., 2008a; Saugy et al., Cowie et al., 2003).
Frontiers in Physiology | www.frontiersin.org 11 March 2021 | Volume 12 | Article 640710Joerres et al. Physiological Changes During a 100-km-March
FIGURE 11 | NT-pro-BNP (A) and troponin T (B) over mean heart rate during
the race in FIN and NON. The black line represents the regression line in FIN, FIGURE 12 | High-density lipoprotein (A) and triglycerides (B) over mean
and the gray line represents the regression line in NON. heart rate during the race in FIN and NON. The black line represents the
regression line in FIN, and the gray line represents the regression line in NON.
Elevation of NT-pro-BNP after and during long-endurance
events as a cardiac stress parameter is well described in several et al.: NT-pro-BNP release is triggered by ventricle stretching
studies (Scharhag et al., 2005; Scott et al., 2009; Banfi et al., and therefore preload changes. Higher intensities result in higher
2012; Kłapcińska et al., 2013; Kim et al., 2014; Salvagno et al., heart rates and shorter R-R intervals, so preload stretch is limited
2014). In a 48-h run with a mean distance of 170 km, NT- and intensity and preload do not increase in a linear fashion
pro-BNP increased 10-fold in the first 24 h from 54 to 508 (Nakagawa et al., 1995; Legaz-Arrese et al., 2011). However,
pg/ml (Kłapcińska et al., 2013). In male athletes, Scharhag et al. the aforementioned studies were conducted at much higher
described a threefold increase (40–130 pg/ml) after a marathon, a intensities at above 85% of their participant’s anaerobic threshold
sixfold increase (40–250 pg/ml) in a 100-km ultramarathon, and (Legaz-Arrese et al., 2011; Serrano-Ostáriz et al., 2011).
a fourfold increase (20–80 pg/ml) in a 110-km mountain bike Interestingly, participants who could only sustain a lower
marathon (Scharhag et al., 2005). These events were running or mean MET showed a greater increment of NT-pro-BNP.
biking events; therefore, intensity levels were higher, compared Furthermore, in the subgroup of participants exercising with a
with our study. In a longer low-intensity 308-km run, Yoon et al. mean MET > 5, non-finishing participants showed significantly
(2016) reported an almost 10-fold increase (27–257 pg/ml). stronger increasing NT-pro-BNP values. This raises the question
It is one of the main findings of our study that also a low- whether NT-pro-BNP might be a marker for cardiovascular
intensity long-endurance march like the MM leads to changes capacity also in healthy adults. Our data indicate that NT-pro-
in NT-pro-BNP levels comparable to higher intensity long- BNP values increased stronger in participants with higher heart
endurance running events. Currently, the majority of studies rates during the race (>106.5 bpm) in NON, underpinning this
(Scharhag et al., 2005, 2008; Banfi et al., 2012; Kłapcińska theory, as heart rate is inversely correlated with cardiorespiratory
et al., 2013) interpret increasing NT-pro-BNP levels as part fitness (Kang et al., 2017). Moreover, recent studies showed
of a process of myocardial adaption rather than a harmful that higher NT-pro-BNP levels were associated with lower
effect (La Gerche et al., 2008). Moreover, recent studies cardiorespiratory fitness in patients with chronic heart disease
described that the duration of the exercise might have a higher (Nichols et al., 2018). Scharhag et al. (2006) found a similar
influence on NT-pro-BNP levels than exercise intensity (Legaz- result with a negative correlation between the increase in NT-
Arrese et al., 2011; Serrano-Ostáriz et al., 2011). Comparing pro-BNP and the amount of endurance training per week
our study to longer low-intensity endurance events, showing in healthy athletes: participants with higher training volumes
a greater NT-pro-BNP increment, our data supports this showed lower increases in NT-pro-BNP, one given explanation
hypothesis (Kłapcińska et al., 2013; Yoon et al., 2016). A possible was a better adapted myocardium on endurance exercise bouts.
explanation for this phenomenon was given by Legaz-Arrese A greater increment for NT-pro-BNP in participants with higher
Frontiers in Physiology | www.frontiersin.org 12 March 2021 | Volume 12 | Article 640710Joerres et al. Physiological Changes During a 100-km-March
baseline NT-pro-BNP values observed in finishing participants to gain more understanding into the release of cardiac troponins
of this study supports this hypothesis. All in all, our data and exercise intensity and duration.
suggest that even at low intensities as observed in our study,
NT-pro-BNP increases take place among healthy adults that Markers for Cell Damage
might indicate a cardiac stimulation and may thus represent Aminotransferase, CK, and CK-MB are muscle cell enzymes,
possible cardiac training previously seen only at higher intensities released by the breakdown of skeletal muscle (Khan, 2009).
(Vilela et al., 2015). Nevertheless, to gain unambiguous data, For all, levels increased significantly over the course of the
further studies are needed, as, e.g., the subgroup of participants MM. CK reached levels more than 10 times above the URL,
with a lower mean MET did not show significant differences which indicates severe muscular damage. CK-MB and AST
between FIN and NON. increased fourfold and threefold, respectively. A generally
accepted explanation is cell leakage due to mechanical tissue
Troponin T damage (Kłapcińska et al., 2013).
Exercise-induced troponin elevations after prolonged physical Increases of muscle stress markers after long-endurance
activity have been described in several studies (Scharhag et al., exercise were described in several studies (Scharhag et al., 2005;
2005, 2006, 2008; Scott et al., 2009; Eijsvogels et al., 2010; Legaz- Banfi et al., 2012; Waśkiewicz et al., 2012; Kłapcińska et al., 2013;
Arrese et al., 2011; Serrano-Ostáriz et al., 2011; Banfi et al., Kim et al., 2014; Arakawa et al., 2016; Baur et al., 2016; Yoon
2012; Kłapcińska et al., 2013; Kim et al., 2014; Salvagno et al., et al., 2016; Knechtle and Nikolaidis, 2018). Training status, sex,
2014; Arakawa et al., 2016; Yoon et al., 2016; Knechtle and duration, BMI, age, and intensity are considered as an impact
Nikolaidis, 2018). The clinical significance is still debated. While factor for interindividual CK elevation (Neal et al., 2009; Banfi
some authors postulate exercise-induced irreversible myocardial et al., 2012; Waśkiewicz et al., 2012; Kłapcińska et al., 2013; Yoon
injury, cell necrosis, or damage (Koller et al., 1999; Eijsvogels et al., 2016; Kim and So, 2018; Nichols et al., 2018).
et al., 2010), others presume a reversible release of cytoplasmic In our study, CK and CK-MB levels increased continuously
troponins due to membrane leakage or changes in intracellular over distance, reaching its maximum level at 100 km or the
calcium levels without any pathological consequence (Scharhag individual point of dropping out of the MM. Studies covering
et al., 2005, 2008; Shave et al., 2007; Benda et al., 2016). ultramarathons observed a strong variance in CK levels: Scharhag
Interestingly, some studies on ultramarathons indicated no et al. (2005) and Yoon et al. (2016) described relatively moderate
increase of troponin T (Kim et al., 2014). In this study, we CK elevations after a marathon and 100 km ultramarathon,
observed a significant elevation of troponin T after the 30- although participants ran with a higher running speed (around
km distance but found normal levels at the 70- and 100-km 10 km/h). In contrast, in a 308-km ultramarathon, CK levels
checkpoints. A similar troponin dynamic was found in a 48- reached 5,270.06 U/L, an almost 35-fold increment (Yoon et al.,
h ultramarathon (Kłapcińska et al., 2013). This might show 2016). Waśkiewicz et al. (2012) described CK elevations up to
an adaption process to the prolonged myocardial and volume 17,500 U/L in a 24-h ultramarathon with a mean speed of 7 km/h.
stress. Another possible explanation might be the impact of Such large CK elevations were also observed by Kłapcińska et al.
intensity. The activity data suggests that participants started with (2013) after running 24 h with a mean speed of 7.3 km/h,
a significantly higher mean MET in the first third of the race reaching 18,000 U/L. It is worth mentioning that in the studies
possibly leading to troponin T elevation. Similar observations of Kłapcińska et al. (2013) and Waśkiewicz et al. (2012), amateur
were made in the 48-h ultramarathon, in that subjects ran with a runners were tested, while Scharhag et al. (2005) and Yoon et al.
higher mean speed in the first 12 h (8.6 km/h) compared with the (2016) assessed experienced endurance athletes. In our study,
next 12 h (6.0 km/h) (Kłapcińska et al., 2013). With exhaustion- recreational athletes were recruited and CK increased to a greater
induced lowering of walking or running speed in the last two degree in all participants with a mean MET < 5. Strikingly, this
thirds of the race, intensity might be below the exertion level contradicts the view of intensity being the relevant impact factor.
causing troponin T excretion. Nevertheless, it can be argued that athletes who were only able
This conclusion is supported by Scharhag et al. (2005). to walk with a lower mean MET are possibly less trained and
They compared a marathon, mountain bike marathon, and therefore training status has the major impact (Banfi et al., 2012).
a 100-km ultramarathon. Median troponin T concentrations We observed that age, BMI, and sex impact CK elevation
increased significantly during the marathon and the mountain in the low-intensity MM. Older participants with a higher BMI
bike marathon only, but not during the lower intensity and males compared with females showed higher CK elevations.
100-km ultramarathon. Supporting this theory, Shave et al. Males had a higher BMI in this study, so there might be a
(2007) suggested a cardiac troponin correlation to intensity, as confounding effect. Nevertheless, higher BMI is described as an
shown in their meta-analysis, where athletes in shorter long- impact factor for CK elevation (Neal et al., 2009; Banfi et al.,
endurance events, such as marathons, expressed the highest 2012; Kim and So, 2018). For age as an impact factor, variable
troponin elevations. results exist. As assessed in a review (Baird et al., 2012), some
Our study supports the hypothesis of an intensity-related authors describe age as a factor contributing to greater exercise-
release of cardiac troponins. Furthermore, greater troponin T induced damage, and others report lower CK elevations, pointing
elevations in subjects with higher heart rate during the race to age-related sarcopenia as a cause.
support the findings of Mehta et al. of an inverse correlation to Aminotransferase is generally accepted as a marker for
training status (Mehta et al., 2012). Further studies are warranted skeletal muscle cell damage after long-endurance exercise
Frontiers in Physiology | www.frontiersin.org 13 March 2021 | Volume 12 | Article 640710You can also read


