Genomic binding by the Drosophila Myc, Max, Mad/Mnt transcription factor network
←
→
Page content transcription
If your browser does not render page correctly, please read the page content below
Genomic binding by the Drosophila
Myc, Max, Mad/Mnt transcription
factor network
Amir Orian,1 Bas van Steensel,3 Jeffrey Delrow,1 Harmen J. Bussemaker,4 Ling Li,1
Tomoyuki Sawado,1 Eleanor Williams,2 Lenora W.M. Loo,1 Shaun M. Cowley,1 Cynthia Yost,1
Sarah Pierce,1 Bruce A. Edgar,1 Susan M. Parkhurst,1 and Robert N. Eisenman1,5
1
 Division of Basic Sciences and 2Divison of Human Biology, Fred Hutchinson Cancer Research Center, Seattle, Washington
98109, USA; 3Netherlands Cancer Institute, 1066 CX Amsterdam, The Netherlands; 4Department of Biological Sciences and
Center for Computational Biology and Bioinformatics, Columbia University, New York, New York 10027, USA

The Myc/Max/Mad transcription factor network is critically involved in cell behavior; however, there is
relatively little information on its genomic binding sites. We have employed the DamID method to carry out
global genomic mapping of the Drosophila Myc, Max, and Mad/Mnt proteins. Each protein was tethered to
Escherichia coli DNA adenine-methyltransferase (Dam) permitting methylation proximal to in vivo binding
sites in Kc cells. Microarray analyses of methylated DNA fragments reveals binding to multiple loci on all
major Drosophila chromosomes. This approach also reveals dynamic interactions among network members as
we find that increased levels of dMax influence the extent of dMyc, but not dMnt, binding. Computer analysis
using the REDUCE algorithm demonstrates that binding regions correlate with the presence of E-boxes, CG
repeats, and other sequence motifs. The surprisingly large number of directly bound loci (∼ 15% of coding
regions) suggests that the network interacts widely with the genome. Furthermore, we employ microarray
expression analysis to demonstrate that hundreds of DamID-binding loci correspond to genes whose
expression is directly regulated by dMyc in larvae. These results suggest that a fundamental aspect of Max
network function involves widespread binding and regulation of gene expression.
[Keywords: myc; mad; Drosophila; target genes; transcription]
Supplemental material is available at http://parma.fhcrc.org/AOryan.
Received December 12, 2002; revised version accepted February 12, 2003.

The Myc, Mad, Max network comprises a group of                              ing sites (Laherty et al. 1997; Bouchard et al. 2001). Myc
widely expressed transcription factors, which function                      proteins associate with the TRRAP coactivator, which in
in cell proliferation and differentiation. This network in-                 turn binds the histone acetyltransferase, GCN5, permit-
cludes members of the Myc and Mad families, the Mad-                        ting Myc–Max dimers to direct acetylation of histones at
related protein Mnt, and Mga. All of these proteins pos-                    E-box binding sites (McMahon et al. 2000; Bouchard et
sess basic helix–loop–helix zipper domains (bHLHZ),                         al. 2001; Frank et al. 2001). Furthermore, Myc is known
which mediate dimerization with the small bHLHZ pro-                        to bind and inhibit the function of the transcription fac-
tein Max, thereby forming heterodimers capable of rec-                      tor Miz-1, leading to E-box-independent repression of
ognizing the E-box sequence CACGTG (Grandori et al.                         Miz-1 activated targets such as p15INK4b and other cy-
2000). Although Max homodimers lack transcriptional                         clin-dependent kinase inhibitors (Staller et al. 2001;
activity, recent evidence suggests that the transcrip-                      Ziegelbauer et al. 2001; Seoane et al. 2002).
tional activities of Max heterodimers derive from their                        The varied activities of Max network proteins are
ability to recruit chromatin-modifying complexes to                         manifested during proliferation and differentiation. Mad
DNA (Amati et al. 2001; Eisenman 2001). For example,                        family proteins are generally induced during terminal
Mad family proteins directly bind the mSin3–histone de-                     differentiation and act to limit cell proliferation (Zhou
actylase corepressor complex permitting Mad–Max het-                        and Hurlin 2001). Myc proteins are induced in response
erodimers to target histone deacetylation at E-box bind-                    to a large number of growth factors and cytokines and
                                                                            may serve to integrate these external signals to sustain
                                                                            growth and proliferation. Targeted deletion of either N-
5
 Corresponding author.                                                      myc or c-myc leads to early embryonic lethality in the
E-MAIL eisenman@fhcrc.org; FAX (206) 667-6522.
Article published online ahead of print. Article and publication date are   mouse (Stanton et al. 1992; Davis et al. 1993) and recent
at http://www.genesdev.org/cgi/doi/10.1101/gad.1066903.                     studies demonstrate that myc gene function is essential

    GENES & DEVELOPMENT 17:1101–1114 © 2003 by Cold Spring Harbor Laboratory Press ISSN 0890-9369/03 $5.00; www.genesdev.org      1101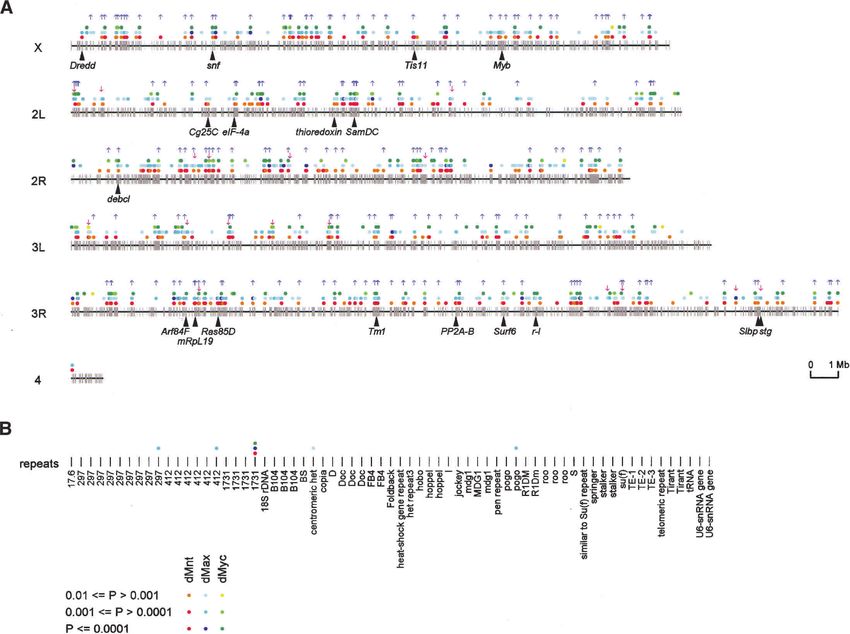
Orian et al.

for hematopoiesis and organogenesis (de Alboran et al.        functions of dMyc and dMnt. In order to ensure low lev-
2001; Douglas et al. 2001; Trumpp et al. 2001; Knoepfler      els of expression, the chimeric proteins were expressed
et al. 2002). Deregulated overexpression of myc genes         separately in Drosophila Kc cells under control of the
leads to malignant transformation, genetic instability,       heat-shock promoter, but in the absence of heat-shock
and apoptosis. In contrast to Myc and Mad, Max is a           (van Steensel and Henikoff 2000). At 24 h posttransfec-
stable, constitutively expressed protein acting primarily     tion, genomic DNA was extracted. Subsequently, 0.1–2-
as an obligate dimerization partner permitting Myc and        kb fragments generated by digestion with DpnI (which
Mad proteins to associate with DNA.                           cuts only at Gm6ATC) were purified by sucrose gradient
   The Max network is highly conserved and Drosophila         centrifugation, labeled with the fluorochromes Cy5 (chi-
orthologs of vertebrate Myc and Max (dMyc and dMax)           meric proteins) and Cy3 (Dam alone, serving as a refer-
have been identified and characterized previously (Gal-       ence for nonspecific binding/accessibility) and cohybrid-
lant et al. 1996; Schreiber-Agus et al. 1997; Johnston et     ized to a Drosophila cDNA array that contains 6255
al. 1999). More recently, a fly ortholog of mammalian         cDNAs and ESTs, representing roughly half of Dro-
Mad/Mnt was identified (termed dMnt; Bourbon et al.           sophila coding sequences. Targeted sequences were iden-
2002; L.W.M. Loo and R.N. Eisenman, in prep.). Whereas        tified based on the Cy5:Cy3 fluorescence ratio (van
vertebrates possess families of myc and mad genes, Dro-       Steensel and Henikoff 2000; van Steensel et al. 2001; see
sophila myc, max, and mnt have no paralogs. Both dMyc         Materials and Methods). The binding data for each pro-
and dMnt form heterodimers with dMax that specifically        tein on the entire array (chromatin profile) were gener-
bind CACGTG. Whereas dMyc–dMax heterodimers ac-               ated as described previously (van Steensel et al. 2001). A
tivate transcription, dMnt–dMax associates with Dro-          set of statistical tests, as well as a “self on self” experi-
sophila Sin3 and represses transcription in an E-box-de-      mental set (dMnt–Dam vs. dMnt–Dam), were used to
pendent manner (Gallant et al. 1996; L.W.M. Loo and           establish statistically significant targets and assess ex-
R.N. Eisenman, in prep.). Moreover, similar to mamma-         perimental noise (see Materials and Methods; Supple-
lian myc, dmyc is capable of cotransforming primary           mental Material S3 for access to raw DamID binding
mammalian cells and rescuing the proliferation defect         data).
in c-myc null fibroblasts (Schreiber-Agus et al. 1997;
Trumpp et al. 2001). Furthermore, both vertebrate and
                                                              Comparative chromatin profiling of Max
Drosophila myc regulate cell growth. The molecular and
                                                              network proteins
biological similarities between Drosophila and verte-
brate Myc, Max, Mad, Mnt proteins coupled with the            Having established chromatin profiles and a statistically
availability of Drosophila genetic tools and the complete     significant set of binding targets for each of the network
genome sequence (Rubin et al. 2000) make Drosophila           proteins, we compared the profiles derived from experi-
an attractive system to carry out a systematic analysis of    mental sets for each of the network proteins to examine
genomic binding by the network. In this study, we have        binding overlap among the different members. Figure 1A
employed the recently devised DamID method (van               is a scatter plot comparison between the chromatin pro-
Steensel and Henikoff 2000; van Steensel et al. 2001) in      files of dMnt and dMax in which we compare separate
which a bacterial DNA methylase, fused to dMax net-           binding data sets for each protein. These profiles show a
work transcription factors, is used to “mark” DNA-bind-       high degree of similarity (correlation coefficient, r = 0.49)
ing sites in living cells.                                    with both proteins displaying statistically significant
                                                              binding to the same 258 genes (Fig. 1A, purple points).
                                                              Many genes are not bound by either protein (Fig. 1A, gray
Results
                                                              points). We also found that increasing dMax levels had
To identify genomic binding regions for Max network           no effect on dMnt genomic binding (data not shown).
transcription factors we prepared fusion proteins consist-    The Venn diagrams in Figure 2 depict the number of
ing of the bacterial DNA adenine methylase (Dam)              overlapping and nonoverlapping genes. Overlapping
linked to the C termini of full-length dMax, dMnt, and        genes represent 60% of the total genes occupied by dMnt
dMyc as well as to the N terminus of dMyc. In each case,      and 40% of dMax bound genes (Fig. 2A). DamID analysis
the transcription factor sequence was separated from          of binding by GAF, a transcription factor unrelated to
Dam by a 9E10 (human Myc tag) peptide, permitting             dMax network proteins (van Steensel et al. 2003), shows
detection of the fusion protein with 9E10 antibody (see       only minimal overlap with dMnt bound loci (r = 0.11;
Materials and Methods for details). All of these fusion       Fig. 2F), further supporting the idea that the overlap de-
proteins were found to localize to the cell nucleus and       tected among dMax network proteins is specific.
activated (dMyc–Dam and Dam–dMyc) or repressed                   A similar comparison of data sets derived from dMax
(dMnt–Dam) transcription from a synthetic reporter            and dMyc produced a surprising result (Fig. 1B). First,
gene similar to their vertebrate orthologs (Grandori et al.   dMyc was recruited to a considerably smaller number of
2000). In contrast, the tagged Dam protein alone, or a        genes (22) than either dMax or dMnt (646 and 429 re-
Myc mutant (amino acids 1–624) lacking the bHLHZ do-          spectively; see Fig. 2B). Second, the dMax binding profile
main, had no effect on E-box-dependent transcription          displayed little overlap with binding by either the C-
(data not shown; see Materials and Methods). These re-        terminal or N-terminal fusions of dMyc to Dam (Fig. 2B;
sults indicate that fusion with Dam does not impair the       data not shown). We asked whether dMax might be lim-

1102       GENES & DEVELOPMENT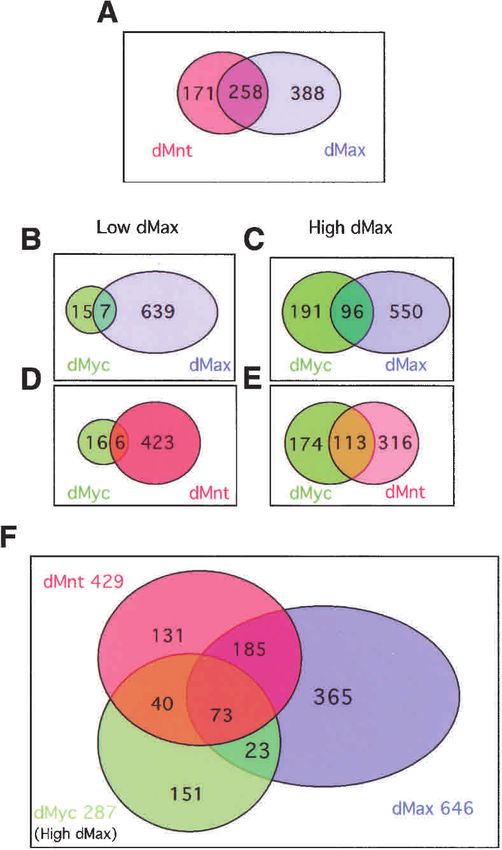
Genomic binding by the Drosophila dMax network

Figure 1. Comparison of chromatin profiles for the Drosophila Max network. Scatter plot comparisons of chromatin binding profile
data sets of the dMax network proteins derived from the entire cDNA array. The average binding is presented as Cy5:Cy3 log ratios
between dMax–Dam:Dam vs. dMnt–Dam:Dam, r = 0.49 (A); dMax–Dam:Dam vs. dMyc–Dam:Dam with dMax expressed at low levels,
r = −0.43 (B); dMax–Dam:Dam vs. dMyc–Dam:Dam with dMax expressed at high levels, r = 0.17 (C); dMnt–Dam:Dam vs. dMyc–
Dam:Dam where dMyc–Dam is coexpressed with low levels of dMax, r = 0.26 (D); dMnt–Dam:Dam vs. dMyc–Dam:Dam where
dMyc–Dam is coexpressed with high dMax levels, r = 0.71 (E); dMnt–Dam:Dam vs. dGAF–Dam, r = 0.11 (F). Ratios were calculated
using a full set of experiments as described in Materials and Methods. Pearson correlation coefficients (r) were calculated for each set.
Statistically significant binding targets are indicated by colored solid dots. Blue, dMax–Dam; green, dMyc–Dam; red, dMnt–Dam;
brown, dGAF–Dam; purple, overlapping targets. The bicaudal (bic) gene is marked by open black circle and is printed twice on the
array.

iting for dMyc binding under our experimental condi-                   ability to heterodimerize this result demonstrates that
tions and therefore we expressed relatively higher levels              association between Myc and Max proteins is most
of nonfused dMax along with the N-Dam–dMyc fusion                      likely responsible for the increased overlap between
(see Materials and Methods). As shown in Figures 1C and                identified target genes. Nonetheless, although dMax lev-
2C, dMyc recruitment to targets and the binding profile                els were limiting for Dam–dMyc binding, a substantial
overlap between dMyc and dMax were dramatically en-                    number of dMyc targets did not overlap with either
hanced when dMax levels were augmented. Under these                    dMax or dMnt in the presence of either low or high dMax
conditions the dMyc fusion associated with 287 targets,                levels (17 and 152 unique Myc targets respectively; Fig.
96 shared with dMax (33.4%) and 73 (25.4%) shared with                 2B,F; see Discussion). These findings suggest that dMax
both dMnt and dMax (cf. Fig. 1B,C and the Venn dia-                    is limiting for dMyc binding to certain targets in Kc cells.
grams in Fig. 2B,C,F). Augmented expression of dMax                    Furthermore, the fact that dMax binds a subset of sites
also resulted in increased overlap between dMyc and                    distinct from those bound by dMnt and dMyc implies
dMnt binding profiles, resulting in an overlap of 113                  that dMax heterodimerizes with an as-yet-unidentified
genes (39%; Figs. 1D,E, 2D–F). Myc recruitment to the                  factor (see Discussion).
majority of these target genes depends on functional
dMax as the vast majority of the targets were not bound
                                                                       Distribution of dMax network binding loci
by dMyc when dMax lacking its leucine zipper domain
(residues 91–119 deleted) was coexpressed (data not                    Of 6255 genes represented on the array, 968 (15.4%) were
shown). Because the zipper region is essential for Max’s               found to associate with one or more dMax network pro-

                                                                                                     GENES & DEVELOPMENT            1103
Orian et al.
2001). Therefore, although dMax network protein bind-
ing to chromatin is widespread, it appears to exclude
specific regions, at least some of which are silenced re-
gions associated with heterochromatin.
Binding regions correlate with E-box sequences as well
as other motifs
The E-box sequence CACGTG and several related se-
quences are binding sequences for vertebrate and Dro-
sophila Myc, Max, and Mad/Mnt proteins (Blackwell et
al. 1990, 1993; Blackwood and Eisenman 1991; Prender-
gast and Ziff 1991; Solomon et al. 1993; Gallant et al.
1996; James and Eisenman 2002; L.W.M. Loo and R.N.
Eisenman, in prep.). To determine whether such sites are
represented in our binding regions and to substantiate
our in vivo-binding results, we applied an unbiased bio-
informatics method, the REDUCE algorithm. REDUCE
identifies putative regulatory sequences of 8 bp or less
whose presence correlates with binding (Bussemaker et
al. 2001; for review, see Li 2002). The REDUCE algo-
rithm employs the binding profiles of the entire array
without any preclustering or cut-off data restrictions.
The readout of the REDUCE search is a list of distinct
motifs with their statistical significance and (positive)
regression coefficients quantifying their contribution to
binding to the locus in which they occur. As shown in
Table 1, binding sites for the canonical E-box CACGTG
display significant correlation with the dMnt binding
log-ratio (p < 10−12; Table 1A). However, the CACGTG
Figure 2. Venn diagrams depicting the number of shared genes correlated with dMyc binding only in the presence of
within the dMax network. Criteria for calculating statistically high levels of coexpressed dMax (p < 10−12; Table 1C). A
significant targets are described in Materials and Methods. (A) high correlation with short CG repeats may reflect a pre-
Comparison of dMnt and dMax targets. (B,D) dMyc data sets viously noted preference for binding by Myc and Mad to
generated in the presence of low dMax levels. (C,E,F) dMyc data E-boxes that contain CG in flanking regions (Prendergast
sets generated in the presence of high dMax levels. et al. 1991; Solomon et al. 1993; James and Eisenman
2002). When exogenous dMax levels are low, only AT-
rich motifs correlate with binding (see Supplemental
teins. The distribution and overlap is depicted in the Material S5).
Venn diagram in Figure 2F. Previous work showed that Interestingly, REDUCE analysis also identified other
significant and specific methylation by tethered Dam oc- sequence motifs that correlate with binding. Because of
curs within 1.5–2 kb of the DNA-binding site (van their high degree of association with Max network bind-
Steensel and Henikoff 2000) permitting us to link bind- ing sites these motifs may serve as binding sites for fac-
ing regions detected on the array with a map of Dro- tors that cooperate with dMyc and dMnt. One such pu-
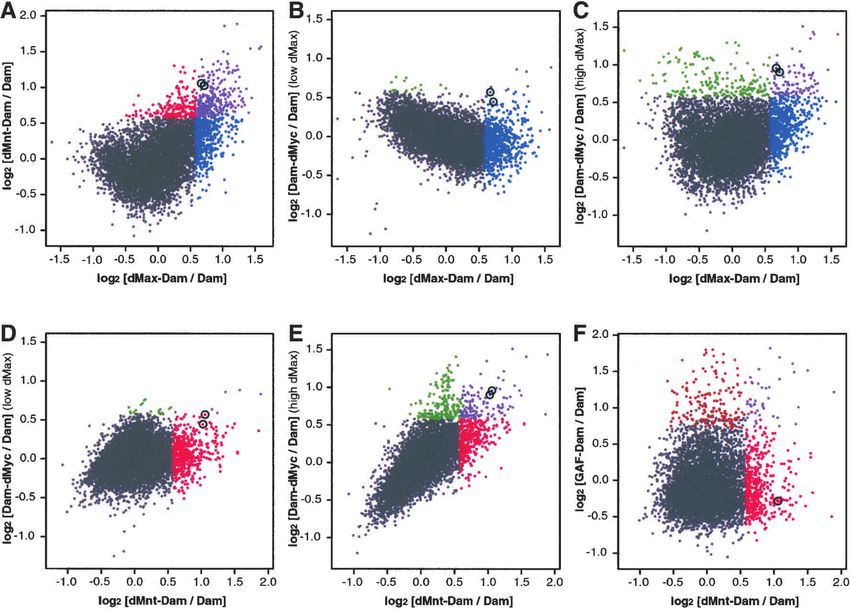
sophila chromosomes (Fig. 3A; see Discussion). Exten- tative binding site is the palindromic sequence TATC
sive binding of all three proteins was observed on the GATA (DNA replication element, DRE), a sequence re-
four major Drosophila chromosomes (Fig. 3A); however, ported near genes involved in cell proliferation and
repetitive DNA elements displayed relatively few bind- growth (Hirose et al. 1993, 2001; Jasper et al. 2002; Table
ing sites despite the presence of E-boxes (e.g., Tirant; Fig. 1, bold). The DRE was shown to be a consensus binding
3B). Even the low level of binding to repeats was not element for several factors: DREF (DNA replication ele-
reproducible on identical repeats spotted multiple times ment factor, a factor associated with the TRF2 complex;
on the array (e.g., the 297 and 412 repeats) and may there- Hochheimer et al. 2002), Cut (a repression component
fore represent false positive hits. A previous DamID within the Notch pathway; Jackson and Blochlinger
analysis showed that many of these repetitive elements 1997; Nepveu 2001), and BEAF32 (a boundary element
are bound by Drosophila HP1 (heterochromatin protein associated binding factor; Zhao et al. 1995). Interest-
1), suggesting the lack of dMax network protein binding ingly, REDUCE analysis demonstrates that the DRE se-
is likely to be specific, and not attributable to technical quence was the most significant motif among dMax tar-
limitations or a generalized exclusion of chromatin- gets (Table 1), suggesting that dMax is involved in as yet
binding factors from this region (van Steensel et al. unidentified complexes (see Discussion).
1104 GENES & DEVELOPMENTFigure 3. Map of dMax network binding across Drosophila chromosomes and repetitive elements. Annotation of binding targets was preformed using
the Drosophila gene collection subset (Rubin et al. 2000). Individual genes are depicted as vertical gray bars. dMyc, dMnt, and dMax binding sites are
GENES & DEVELOPMENT
denoted by green, red, and blue solid circles, respectively. Color intensity is directly linked to binding P values as depicted at the bottom. (A) dMax
network binding to the four Drosophila chromosomes. A partial list of genes found to be orthologs of direct targets of c-Myc (Fernandez et al. 2003)
are indicated by black triangles and gene names. dMyc-regulated genes in the larval expression study that were detected in the the DamID analysis
are denoted by purple (activated) and pink (repressed) arrows. (B) dMax network binding to repetitive elements.
1105
Genomic binding by the Drosophila dMax networkOrian et al.
Table 1. Highest scoring motifs detected by REDUCE analysis
Motif R2 P value F Matches Loci Consensus
A dMnt
CGCG 0.051 0.0E + 00 0.01 66,217 4366 CG-repeat
GCGC 0.048 0.0E + 00 0.01 97,925 4367 CG-repeat
CGCGC 0.047 0.0E + 00 0.02 16,661 4121 CG-repeat
GCGCG 0.042 0.0E + 00 0.02 17,392 4129 CG-repeat
TATCGATA 0.026 0.0E + 00 0.06 1618 1258 TATCGATA
ATCGATA 0.024 0.0E + 00 0.04 3863 2367 TATCGATA
TCGATA 0.015 1.0E − 12 0.02 8262 3541 TATCGATA
TATCGAT 0.015 5.0E − 12 0.03 3765 2369 TATCGATA
GGTCACAC 0.024 0.0E + 00 0.09 788 706 GGTCACACT
GTCACACT 0.017 0.0E + 00 0.08 691 633 GGTCACACT
CACGTG 0.019 0.0E + 00 0.03 4214 2558 CACGTG
GCACGTG 0.016 0.0E + 00 0.05 1370 1139 CACGTG
GCACGTGT 0.012 9.8E − 09 0.10 319 301 CACGTG
B dMax
CGCGC 0.025 0.0E + 00 0.02 16,401 4058 CG-repeat
CGCG 0.022 0.0E + 00 0.01 65,098 4301 CG-repeat
GCGCG 0.020 0.0E + 00 0.02 17,086 4069 CG-repeat
GCGC 0.014 2.0E − 12 0.00 96,364 4302 CG-repeat
TATCGATA 0.024 0.0E + 00 0.07 1600 1247 TATCGATA
ATCGATA 0.018 0.0E + 00 0.04 3797 2330 TATCGATA
TATCGAT 0.016 2.0E − 12 0.04 3705 2334 TATCGATA
GGTCACAC 0.013 2.0E − 09 0.08 776 693 GGTCACACT
GTCACACT 0.009 1.1E − 05 0.07 681 624 GGTCACACT
C dMyc (high dMax)
CACGTG 0.032 0.0E + 00 0.03 4203 2555 CACGTG
ACGTG 0.024 0.0E + 00 0.01 18,323 4228 CACGTG
CACGT 0.022 0.0E + 00 0.01 17,082 4221 CACGTG
GCACGTG 0.021 0.0E + 00 0.05 1365 1134 CACGTG
ATCGATA 0.022 0.0E + 00 0.03 3853 2362 TATCGATA
TCGATA 0.022 0.0E + 00 0.02 8255 3535 TATCGATA
TATCGATA 0.020 0.0E + 00 0.04 1616 1256 TATCGATA
ATCGAT 0.014 2.2E − 11 0.01 13,336 4037 TATCGATA
TATCGAT 0.013 2.1E − 10 0.02 3751 2362 TATCGATA
CGCGC 0.027 0.0E + 00 0.01 16,646 4116 CG-repeat
CGCG 0.026 0.0E + 00 0.00 66,118 4361 CG-repeat
GCGC 0.024 0.0E + 00 0.00 97,752 4362 CG-repeat
GCGCG 0.019 0.0E + 00 0.01 17,348 4124 CG-repeat
For each spot on the microarray the Berkeley Drosophila Genome Sequence Release 2 was used to generate an associated DNA region
comprising the sequence of the array probe plus 2 kb flanking region. The Matches column indicates the total number of matches to
the motif in the combined sequences. The Loci column indicates the number of sequences with at least one match. F represents the
regression coefficient for a given motif. R2 equals the square of the Pearson correlation between the binding log ratio and the motif
count (see Materials and Methods). All oligonucleotides of up to 8 bp in length were tested in parallel. Only the most significant motifs
(p < 10−4) with a positive correlation are shown. E-box and DRE sequences are depicted in bold. Complete REDUCE results available
in Supplemental Material S5.
Binding regions are proximal to genes implicated DamID in Kc cells could be identified as dMyc-respon-
in Max network functions as well as genes regulated sive genes in the rapidly growing third instar larvae. Us-
by dMyc ing the heat-shock Flp/Gal4 method (Pignoni and Zipur-
sky 1997; Neufeld et al. 1998), we have generated trans-
We sorted dMax network binding sites into functional genic flies expressing a marker GFP and dMyc, or GFP
groups using the Drosophila Gene Ontology database alone, both under UAS control. Total RNAs collected
(GO; http://www.godatabase.org), a gene annotation sys- from either Myc-expressing or control larvae 7 and 14 h
tem (Ashburner et al. 2000). Table 2 is a partial list of after heat-shock induction were Cy3;Cy5 labeled and hy-
annotated gene targets. Our screen reveals both novel bridized to the same Drosophila microarrays used for the
and previously described pathways and target genes as- DamID experiments (see Materials and Methods). Statis-
sociated with dMax network function (see Discussion). tically significant mRNA expression changes were de-
The complete binding profiles and partial annotation can fined for 845 genes: 544 genes activated and 301 re-
be found as Supplemental Material (S1, S2). pressed (see Supplemental Material S1, S4). Comparison
We next asked whether the binding loci defined by of the dMax network DamID binding profile with the
1106 GENES & DEVELOPMENTGenomic binding by the Drosophila dMax network
Table 2. Partial list of the dMax network target loci
Biological pathway/
molecular function dMnt targets dMax targets dMyc targets
Actin/cytoskeleton/cell Dmn, nup44A, Tm1, Sop2, nup44A, Tm1, Arp11, bif, Tm1
migration CG6546, CG25C, Dlc90F, CG15669, puc, Klp3A
nop5, bif
Cell cycle regulators Myt1, ial, slbp ial, cdk4, cdc2, cdc2c, Rbf, cdk4, CycA, CycB, CycB3,
CycJ, CycC, CycD, stg Rbf
Cell death Dredd Dredd, Dcp-1, Ice, debcl Reaper L
Channels/transports CG10444, icln CG10444, Nrv1, Nhe1, icln rpk, icln
Chromatin HP1b, HmgD, Df31, Nap1, HP1b, HmgD, Caf1 HP1b, fs (1) Ya
Caf1
Immunity FK506bp1, Dredd, Rel, FK506 bp1, Myd88, Rel, Rel
PGRP-LE PGRP-LE, CG10535,
CG3829
Mitochondria biogenesis, Tim10, Tim9, mRSp30, Tim10, mRpS30, mRp19, Tim10, mRpL10, mRpS7,
structure, function mRp19, mRpS7, TFAM, mRpS7, TFAM, colt TFAM, CG3476, mge
Ferrochelatase
Nucleolus CG12909, CG8939, Surf6 CG1135 CG1135, CG12909, Rpp30,
Surf6
Peptidyl prolyl Fk560bp1 CG3511, FK506bp1, FKBP59 CG5482, cyp33
cis-transisomerase
Protein synthesis/Ribosome Aast-g1n, eIF6, mRpL19, bonsai, cg1475, mRpL19, RpL1, RpL19, pelo, mRpS7,
mRpS30, mRpS7, RpL1, mRpS7, RpL1, eIF6, pelo mRpL1, RpS12, RpS13,
RpS5, RpS9, Nmd3, Surf6, RpS9, Surf6
CG1475
Replication/DNA repair RnrS, CG8142, pms2 RnrS, Rfc40, Mcm2, Mcm6, RnrS, UbcD6
SPT4, Orc1, mus209,
CG8142
RNA binding CG11738, CG12909, BcDNA: GH01073, CG11738, CG10214, CG11738,
CG14230, CG5589, CG14230, CG1704, CG12909, CG8862, cyp33,
CG8636, CG8862, mod, CG5589, CG8862, mod
Nmd3, Rbp1, SC35, SF2, Hrb98DE, mxc, Nmd3,
Slbp, tra2, U2af38 qkr58E-1, Rbp1, SC35, snf,
Srp54
RNA methyltransferase CG11837, CG5220, CG7319, CG5220, CG7319 CG1837, CG5220
CG7818
Signaling aay, CG1815, CG4527, loco, pak3, spz, grk, PP2-AB, aay, LD08534
CG6805, LD08534 puc, stg, cg66805, LD08534,
aay
Small GTPases GTP binding Rab14, RhoL Rab17, Ran, Rap21, Ras85D, Rab11
proteins RhoL, Arf84F
Splicosome CG10754, CG4980, CG6876, SC35, Snf, Srp54
SC35, SF1, SF2, SmB,
U2af38
Synaptic vesicles traffic Syx13, Syx16, Syx17, Syx18, Syx17, Syx18, Arf84D, Syx13, CG8862
Syndapin, usnp, Rop, KdelR Syndapin, Rop, KdelR
Transcription factors bic, Max, DREF, Pan, Ell, bic, DREF, bigmax, myb, bic, bigmax, E2F2, Rel, Rbf,
TFAM, Rel, Jra, Med6 Xbp1, Rpll33, Rbf, TFAM TFAM
Transcription initiation and Taf55, Tfb2, Cyp1 Taf60-2, Cyp1 Taf60-2, Cyp1
elongation
Transferase transferring CG18012, CG4802, CG5537, CG5220, CG7319, CG9249 CG3434, CG4802, CG5537,
glycosyl groups CG6437, CG9249 CG9249
Translation factors EfTuM, Adam, CG5705 EfTuM, Adam, eif6, eif4A Adam
Ub-proteasome CG5384, CG5505, smt3, CG5384, smt3, Ufd1-like, UbcD6, smt3
UfD1-like, Rpn5, Rpn7, Rpn5, Rpn7, Pros45, Tbp1,
Pros25, Pros26 Uba1
Standardized gene annotation was applied from the Drosophila Genome Ontology database (release February 2002). Only annotations
in the biological process and molecular function categories with three or more targets are listed. A list of the network target genes can
be found in Supplemental Material S2. Shared targets between all three proteins are in italic.
gene expression profile indicates a high degree of overlap degree of correlation between binding and expression
(Fig. 3, purple and pink arrows; Table 3). The highest was observed for loci that are bound by both dMyc and
GENES & DEVELOPMENT 1107Orian et al.
Table 3. Comparison of DamID binding loci with dMyc-induced larval gene expression targets
A Loci B No. of binding loci C No. of dMyc regulated genes D Percent E Activated F Repressed
bound by identified by DamID also identified by DamID of overlap genes genes
dMyc + dMax + dMnt 73 35 47.9% 34 1
dMyc + dMnt 40 24 60.0% 24 0
dMyc + dMax 23 6 26.0% 5 1
dMnt + dMax 185 64 34.5% 60 4
dMyc 151 24 15.8% 24 0
dMax 365 56 15.3% 42 14
dMnt 131 44 33.5% 43 1
Total targets 968 253 26.1% 232 21
Column A subgroups: targets were sorted according to subgroup specification as reflected in Figure 2F. Column B: Number of loci
detected as statistically significant DamID targets. Column C: Number of genes that are depicted in column B that also show
dMyc-regulated gene expression changes.
dMnt (60%) and by all three Max network proteins (48%; the DamID data, and promote opposing changes in chro-
Table 3). Furthermore, applying the REDUCE algorithm matin modification.
to the gene expression profile revealed a significant cor- To determine whether the endogenous dMnt protein
relation with E-box and DRE sequences, supporting the occupies the bic locus E-box, we induced Kc cell differ-
notion that our binding loci correspond to transcription- entiation using ecdysone. Other work has shown that
ally regulated genes (see Supplemental Material S5). dMnt is induced during differentiation and by ecdysone
Within the group of genes bound by both dMyc and dMnt in pupal stages (L.W.M. Loo and C. Thummel, unpubl.).
no genes were found to be repressed by dMyc, reinforcing Figure 4C shows that endogenous dMnt associates with
the notion that the distinct biological effects of dMyc the bic E-box only following ecdysone treatment (Fig.
and dMnt derives from their opposing transcriptional 4C, cf. lanes 6 and 7). Similar experiments with endog-
functions (see below). Of the total dMax network targets enous dMyc were not feasible because of the inability of
identified by DamID and whose expression is dMyc regu- our antibody to detect the low levels of endogenous pro-
lated (253), the majority (232) were activated and only 21 tein. Importantly, dMnt binding correlates with deacety-
repressed. Thus, the other 280 repressed genes are likely lation of histone H3 and H4 (Fig. 4C, lanes 8–12), con-
to be due to indirect or downstream effects of dMyc. sistent with the ability of dMnt to recruit a mSin3–
HDAC complex to its binding site (L.W.M. Loo and R.N.
Eisenman, in prep.).
Chromatin immunoprecipitation analysis of dMyc
and dMnt binding and histone acetylation
at the bic locus Discussion
We employed chromatin immunoprecipitation (ChIP) to A significant gap in our understanding of the function of
assess whether dMyc and dMnt bind the same site proxi- many transcriptional regulatory proteins has been the
mal to a DamID-identified target gene and alter the sta- lack of comprehensive identification of their in vivo
tus of histone tail acetylation. We chose Bicaudal (bic), binding sites and the genes whose expression they regu-
as an example of a gene that displayed binding by dMyc, late. This problem is especially pertinent for transcrip-
dMax, and dMnt (Fig. 1, bic is circled) and whose mRNA tion factors such as Myc, Mad/Mnt, Max, and other
is also induced by dMyc in our expression analysis. bic is members of the Max network that function as relatively
related to vertebrate BTF3, a general transcription factor weak transcriptional regulators, whose consensus bind-
whose expression was found to correlate with c-Myc in a ing site is ubiquitous, and whose expression elicits pro-
global expression study (Zheng et al. 1987; Watson et al. found effects on cell growth and proliferation. Standard
2002). bic possesses one E-box in the vicinity of its tran- methods of target gene evaluation do not reliably differ-
scriptional start site (Fig. 4A). Using the ChIP assay we entiate between genes bound and directly regulated by
specifically detect dMyc and dMnt association with the Myc and Mad from genes whose expression is altered as
bic E-box region in cells overexpressing each protein (Fig. a secondary or later consequence of Myc or Mad induc-
4B, cf. IgG control lanes 3,4 and dMyc binding lanes 5,6, tion. In principle, it is important to know about both sets
and dMnt binding lanes 7,8). Importantly, binding by of genes, but it is also crucial to distinguish between
dMyc and dMnt alters the status of endogenous histone them. The DamID method employed in this paper per-
acetylation at this site: dMyc binding correlates with mits determination of transcription factor binding site
hyperacetylation of both histones H3 and H4 (Fig. 4B, regions in live cells and is not dependent on chemical
lanes 11,13), whereas dMnt binding correlates with cross-linkers or PCR primers. Because it involves “mark-
deacetylation (Fig. 4, lanes 12,14). These findings support ing” of DNA in chromatin by a methyltransferase linked
the notion that dMyc and dMnt are capable of alternate to a transcription factor, even transient or low affinity
occupation of the same binding site, as predicted from interactions with DNA, as well as proximity to regions
1108 GENES & DEVELOPMENTGenomic binding by the Drosophila dMax network
The validity of our approach is strongly supported by
several lines of evidence. First, the degree of overlap be-
tween dMyc, dMax, and dMnt binding regions (Fig. 2) is
consistent with the relationship between E-box binding
and heterodimerazation with Max established previ-
ously for the vertebrate proteins as well as for their or-
thologs in Drosophila (Blackwood and Eisenman 1991;
Ayer et al. 1993; Zervos et al. 1993; Gallant et al. 1996;
L.W.M. Loo and R.N. Eisenman, in prep.). Importantly,
the GAGA factor, a ubiquitous transcription factor un-
related to the dMax network, displays only minimal
overlap with dMnt binding sites (Fig. 1F), suggesting our
results are specific for binding by dMax network tran-
scription factors. Furthermore, studies in mammalian
cells have shown both overlapping and nonoverlapping
functions and target genes for Myc and Mad proteins
(O’Hagan et al. 2000; Iritani et al. 2002; James and Eisen-
man 2002) in agreement with our DamID findings. Sec-
ond, using a ChIP assay, the direct binding of dMyc and
dMnt to a DamID-defined target gene, bic (bicaudal),
was demonstrated (Fig. 4). In addition, the mammalian
orthologs of at least 18 genes identified as binding targets
for dMyc, dMax, and dMnt in our study have been dem-
onstrated to be direct targets for vertebrate Myc using
ChIP (Fernandez et al. 2003) and are indicated in Figure
3. Third, application of the REDUCE algorithm, which
correlates binding with the occurrence of DNA sequence
Figure 4 Occupancy of the bic promoter by dMyc and dMnt motifs (Bussemaker et al. 2001) reveals a statistically sig-
proteins correlates with changes in histone acetylation. (A) Dia- nificant correlation between the E-box CACGTG and
gram of the bic promoter, the CACGTG E-box is denoted as an the presence of dMnt binding regions. CACGTG enrich-
open box. The PCR primer set (−50 left primer, +75 right primer) ment also correlated with dMyc binding in the presence
used is denoted by upper black arrows. (B) Promoter occupancy of high dMax levels, for dMax binding in the presence of
was determined using monoclonal antibodies to dMyc (lanes
high dMyc levels, and for genes whose expression is
5,6), dMnt (lanes 7,8), acetylated histone H3 (lanes 11,12), and
acetylated histone H4 (lanes 13,14). ChIP using genomic ex-
modulated by dMyc. Fourth, a substantial set of target
tracts derived from dMyc-expressing cells (odd-numbered lanes) genes identified in our Drosophila gene expression mi-
or dMnt-expressing cells (even-numbered lanes) is described in croarray analysis, employing larvae overexpressing
Materials and Methods. Input, 2 ng non-IP genomic DNA; bic, dMyc, correspond to target genes defined by DamID (Fig.
the bic E-box specific primers; kis, control primers for the kis 3; Table 3; Supplemental Material S1). In addition, target
gene promoter serving as a loading control; ␣IgGp and ␣IgGm, genes identified here are in accord with genes regulated
Anti-mouse polyclonal and monoclonal IgG antibodies. Enrich- by Myc and Mad as described in several recently pub-
ment is represented as the ratio between the bic and the kis lished gene-expression studies in vertebrate systems
PCR products as described in Materials and Methods. (C) Ecdy- (Coller et al. 2000; Guo et al. 2000; Boon et al. 2001;
sone treatment leads to endogenous dMnt recruitment to the
Neiman et al. 2001; Schuhmacher et al. 2001; Iritani
bic promoter and correlates with deacetylation of histone H3
and H4. Ecdysone treatment and ChIP were as described in Ma-
et al. 2002).
terials and Methods. Amplification linearity was tested in the
presence of ecdysone (lanes 2–4). All other abbreviations are as Drosophila Max network binding sites define
depicted in Figure 4B.
biological functions of the network
distal to the binding site (through looping or higher-order We have used the Drosophila Gene Ontology Database
folding), might be detected (van Steensel and Henikoff to derive an unbiased classification of genes associated
2000; van Steensel et al. 2001). Because we used a cDNA with dMax network binding regions (see Table 2 for a
array to detect targeted methylation regions, only bind- partial list; for complete list, see Supplemental Material
ing sites within a few kb of transcription units are de- S2). Many of our dMax network targets identified are
tected. Therefore, our enumeration of dMax network genes that fit well with the established biological func-
binding sites is likely to be an underestimate. The map- tions of Myc and Mad. In addition, a significant number
ping resolution also does not permit precise pinpointing of targets point to new pathways likely to be regulated by
of the binding site within each probed locus, although the network. Our data demonstrate both binding to, and
the REDUCE analysis strongly suggests that E-box mo- regulation of, genes encoding proteins broadly involved
tifs within target loci mediate the protein recruitment in biosynthetic processes, in accord with genetic and bio-
(e.g., as for bic; Fig. 4). chemical analyses demonstrating that Myc is involved
GENES & DEVELOPMENT 1109Orian et al.
in cell growth in Drosophila and vertebrates (Schmidt confers a permissive state on chromatin allowing bind-
1999; Schuhmacher et al. 1999; Kim et al. 2000; de Al- ing by other cis-acting factors at later times.
boran et al. 2001; Douglas et al. 2001), and from earlier The many dMax targets detected that are shared with
global gene expression studies (see http://www.myc- dMyc and dMnt most likely represent binding by dMyc–
cancer-gene.org/index.asp for a compilation of candidate dMax and dMnt–dMax heterodimers. However, the ex-
target genes; Guo et al. 2000; Boon et al. 2001; Neiman et tent of nonoverlap between binding sites for these pro-
al. 2001; Schuhmacher et al. 2001). Our DamID binding teins is more extensive than expected. For example, we
loci also include genes involved in cell cycle and DNA found that dMax expressed at low levels binds to 365
replication (Table 2). Our list of putative dMax network genes that do not overlap with either dMnt or dMyc tar-
targets also reveals potential novel pathways such as mi- gets. However, 15% of these binding loci are regulated by
tochondrial biogenesis and function, as well as vesicular dMyc in our larval expression analysis. Thus, the degree
transport. Other pathways known to be linked to Myc of overlap is probably influenced by the temporal pattern
such as apoptosis, proteolysis, and the immune response and levels of dMyc expression. This has implications for
are also reflected in our list of dMax network target tumorigenesis where vertebrate Myc proteins are often
genes as are a number of transcription factors (Table 2). dramatically overexpressed. Our work provides evidence
that such overexpression may shift the spectrum of tar-
get genes relative to those expressed in normal cells.
Widespread genomic binding by the dMax network
Max homodimers bind E-boxes with relatively low af-
Our findings demonstrate a surprisingly large number finity and in mammalian cells are inhibited by phos-
(968) of binding sites for proteins of the dMax network phorylation from binding DNA (Berberich and Cole
(Fig. 2). Considering that the array represents a random 1992; Koskinen et al. 1994). Although we do not know
sampling of ∼ 50% of Drosophila coding regions, a con- whether dMax homodimers are similarly blocked from
servative estimate is that dMax network proteins inter- binding to DNA in vivo, we favor the idea that the large
act with ∼ 2000 genes, and, as mentioned above, this is number (365) of unique dMax binding sites and the lack
likely to be an underestimate. It is important to note of correlation with E-boxes reflects dimerization and
however that dMax network proteins do not bind prof- DNA binding by dMax with as-yet-unidentified interact-
ligately to DNA, as evidenced by the low degree of over- ing proteins. Interestingly, in mammalian cells Max has
lap with GAGA factor, the general correlation of E-box been found, in association with the bHLHZ protein Mga,
sequences with binding, and the lack of association with in E2F6 repression complexes (Ogawa et al. 2002). Simi-
repeat elements linked to HP1 binding previously. HP1 larly, unique sites found for dMnt and dMyc may repre-
is predominantly localized to pericentric heterochroma- sent non-E-box DNA binding through formation of
tin, and its binding is associated with silenced chromatin higher-order complexes. For mammalian Myc, interac-
structure (James et al. 1989). The lack of association of tion of Myc–Max heterodimers with the Miz-1 protein
dMyc, dMax, or dMad with such elements may indicate has been shown to direct Myc to non-E-box sites (Staller
that the network proteins are primarily associated with et al. 2001). It is likely that associations with other part-
genes that are subject to ongoing transcriptional modu- ners may redirect dMyc and dMnt to unique binding
lation. These findings are in accord with extensive ChIP sites. If so, our findings indicate that such interactions
assays carried out by Fernandez et al. (2003) in human may be extensive and are an important part of dMax
cells. That study suggests that 8%–10% of cellular genes network function.
associate with Myc and in general display enhanced his- The canonical E-box sequence alone is unlikely to be
tone H3 and H4 acetylation. sufficient to determine specific binding by dMax net-
The large number of binding sites and regulated target work proteins and, indeed, many E-box-containing pro-
genes identified in this study contrasts with earlier ideas moters are not associated with Max network proteins
of Myc function that posited a small number of critical (Bouchard et al. 2001; Fernandez et al. 2003). One possi-
targets. However, not all binding sites necessarily result bility is that other sequences in the vicinity of an E-box
in direct transcriptional regulation by dMax network fac- may play a role in target gene specificity. For example,
tors. This is evident from our dMyc-dependent gene ex- the DRE, which correlated with binding of all three
pression data carried out in growing third instar larvae. dMax network proteins is located withinGenomic binding by the Drosophila dMax network
vicinity of genes lacking E-boxes, perhaps reflecting Microarray analysis and chromatin profiling
dMyc association with as-yet-undefined binding proteins All chromatin profiles were performed as described (van
when dMax levels are limiting. REDUCE analysis of Steensel et al. 2001) using spotted microarrays constructed from
dMax binding regions failed to detect a binding correla- release 1 of the Drosophila Gene Collection (Rubin et al. 2000)
tion with CACGTG. However, when high levels of and 430 additional cDNA and genomic sequences. Three inde-
dMyc were expressed together with dMax–Dam, REDUCE pendent experiments were performed for each of the proteins. In
analysis of dMax binding regions found the E-box signifi- an additional experimental set the dye labeling was reversed for
cantly correlated with binding (data not shown). This is Dam and the fusion protein to exclude bias related to the dye.
in accord with previous data that dMax homodimers Microarray images were quantified using GenePix Pro v3.0 im-
aging software (Axon Instruments). Microarray results were
bind only weakly to E-boxes, and that Max binding is
analyzed using Cyber-T microarray analysis software (Baldi and
largely directed by its heterodimeric partners (Berberich
Long 2001) and corresponding Bayesian-derived P values were
and Cole 1992; Fieber et al. 2001). Perhaps the AT- (and adjusted for multiple hypotheses testing using a false discovery
CG-) rich sequences influence architecture of the bind- rate (FDR) method (Benjamini and Hochberg 1995) where FDR
ing site or serve as binding motifs for factors that en- was set at 0.05. Additionally, dMnt–Dam versus dMnt–Dam
hance dMax network protein association with DNA. control experiments were used to assess experimental array
Taken together, our data suggest a rather more com- variation within the DamID assay. Accordingly, a lower-bound
plex picture of the functioning of Max network tran- ratio threshold of log2 0.58 (i.e., 3 × S.D.) was also imposed. For
scription factors then has been considered previously. access to DamID primary data, see Supplemental Material S3.
The results suggest extensive yet specific interaction
with chromatin probably encompassing thousands of Larval dMyc expression profile experiments
binding sites and directly affecting expression of hun- Fly strains: All transgenes are P[+] in w− strains. w+;+;Act
dreds of genes. In addition, the DamID results indicate 5c > CD2 > GAL4 UAS–GFP (Neufeld et al. 1998); y w hs-
the possibility of several different modes of Myc, Max, FLP122; +; UAS–dMyc (Zaffran et al. 1998). y w hs-FLP122; +; +.
and Mad/Mnt interactions. These include binding to Adult flies and larvae were raised in regular fly food consisting
partner proteins yet to be identified as well as potential of cornmeal and molasses at 25°C. Larvae overexpressing either
cooperation with other transcription factors. Earlier ex- UAS-regulated dMyc;GFP or GFP alone transgenes were gener-
ated using the Flp/Gal4 method (Struhl and Basler 1993; Pignoni
periments have shown that Myc and Mad expression is
and Zipursky 1997; Neufeld et al. 1998). Larvae were staged
under tight control by the cell. Such control is likely to
from hatching and raised at a density of 50 per vial at 25°C.
be important in balancing the multiple protein–protein Third instar larvae (110 h after egg deposition, AED) were heat
and DNA binding interactions inferred from our data. shocked at 37°C for 2 h, and larvae were collected 7 h after heat
shock (∼ 120 h AED). Total RNA was isolated using TRIzol re-
Materials and methods agent (Invitrogen) as described by manufacturer followed by
RNeasy (Qiagen) clear up. cRNA targets were generated using a
standard amino-allyl labeling protocol, where 30 µg each of “ex-
Plasmids and constructs
perimental” (dMyc;GFP: hs-FLP122; Act–GAL4, UAS–GFP;
Generation of chimeric Dam∼ proteins: Full-length cDNAs UAS–dMyc) and “reference” (GFP only :ywhs–FLP122; Act–
encoding Drosophila melanogaster Max, Mnt, Myc, and GAL4, UAS–GFP; +) total RNAs were coupled to either Cy3 or
Myc ⌬ct, (amino acids 1–624) were cloned in either pNDam- Cy5 fluorophores. Paired labeled targets were processed on mi-
9E10 or p9E10-CDam vectors (van Steensel and Henikoff croarrays using protocols described elsewhere (Fazzio et al.
2000) resulting in the formation of either N-terminal or C-ter- 2001). Posthybridized arrays were scanned using a GenePix
minal Dam-fusion proteins. GAF-Dam was described previ- 4000 scanner (Axon Instruments). Data were generated from
ously (van Steensel et al. 2001). For expression in Kc cells, the five independent replicates (two with one dye orientation and
appropriate cDNAs were subcloned into heat shock (hs)-induc- three with the reversed dye orientation) at 7 h and four inde-
ible pCasper vector or pMTV, a copper-inducible insect expres- pendent replicates (two with one dye orientation and two with
sion vector (Invitrogen). All constructs was verified by auto- the reversed dye orientation) at 14 h. Spot-level ratios were log2
mated sequencing. transformed and a loess normalization (f = 0.33) strategy was
applied using S-Plus (MathSoft, Cambridge, MA) to correct for
Cell culture, transfections, and reporter assays observed intra-array intensity-dependent ratio biasing. Expres-
sion data analysis was performed as described for DamID. Ac-
Reporter assays were performed as described previously using cordingly, any gene/est with a P value that meets the
pCI-Neo to express the different proteins in 293T cells (Laherty FDR = 0.05 criterion and has a fold-change outside of the range
et al. 1997). Kc167 Drosophila cells were maintained, trans- ±1.5 were identified as differentially expressed. Access to gene
fected, and stained as described earlier (van Steensel et al. 1995; expression data is available as Supplemental Material (S4).
Henikoff et al. 2000). Cells were treated with 0.2 µM 20-hy-
droxy ecdysone (Sigma) for 18 h where indicated. Cell cultures
Motif-based regression analysis of Max network proteins
for microarray analysis were as follows: Where indicated,
binding using REDUCE
pMTV–dMyc (Cu+2-inducible) was cotransfected in the pres-
ence of 0.5 mM CuSo4 (Sigma), along with hs-dMax–Dam. Al- To identify motifs responsible for the preferential binding of the
ternatively, cells were transfected with a plasmid coding for transcription factors studied, we used REDUCE, a tool origi-
either hs-dMax (low Max) or copper-induced pMTV–dMax (high nally developed for the analysis of gene expression data but
Max), or pMTV–dMax⌬Zip (⌬92–115) along with hs-Ndam– which can also be used to analyze binding data. To remove any
Myc. pMTV–dMax was also cotransfected with hs-dMnt–Dam. remaining bias attributable to the varying number of matches
All assays were carried out in the absence of heat shock. with GATC (the restriction site used in the DamID procedure)
GENES & DEVELOPMENT 1111Orian et al.
in the probe sequences, we first fitted a linear model based on and trasncription. Biochim. Biophys. Acta 1471: M135–
GATC. The corrected log-ratios were subsequently analyzed as M145.
described (Bussemaker et al. 2001) using software available at Ashburner, M., Ball, C.A., Blake, J.A., Botstein, D., Butler, H.,
http://bussemaker.bio.columbia.edu/reduce. REDUCE relies on Cherry, J.M., Davis, A.P., Dolinski, K., Dwight, S.S., Eppig,
standard linear regression of the binding log-ratio for each probe J.T., et al. 2000. Gene ontology: Tool for the unification
on the number of matches of a given motif to the DNA se- of biology. The Gene Ontology Consortium. Nat. Genet.
quence associated with the binding log-ratio (i.e., the probed 25: 25–29.
region plus flanking sequence). Ayer, D.E., Kretzner, L., and Eisenman, R.N. 1993. Mad: A het-
The regression coefficient (slope) associated with each motif erodimeric partner for Max that antagonizes Myc transcrip-
is determined by performing a least-squares fit of this model to tional activity. Cell 72: 211–222.
the data; it estimates the contribution to binding to a locus by Baldi, P. and Long, A.D. 2001. A Bayesian framework for the
each occurrence of the motif. The value of R2 for this fit is equal analysis of microarray expression data: Regularized t-test
to the square of the Pearson correlation r between the binding and statistical inferences of gene changes. Bioinformatics
log-ratio and the motif count; it measures the statistical signifi- 17: 509–519.
cance of the regression coefficient. The P value associated with Benjamini, Y. and Hochberg, Y. 1995. Controlling the false dis-
R2 has to be corrected to control the family-wise error rate in covery rate: A practical and powerful approach to multiple
the parallel test of a large number of motifs. We used the Bon- testing. J.R. Statistical Soc. Ser. B-Methodological 57: 289–
ferroni correction, which amounts to multiplying the P value by 300.
the total number of motifs tested. The complete REDUCE Berberich, S.J. and Cole, M.D. 1992. Casein kinase II inihibits
search results can be found in Supplemental Material S5. the DNA-binding activity of Max homodimers but not Myc/
Max heterodimers. Genes & Dev. 6: 166–176.
Blackwell, T.K., Kretzner, L., Blackwood, E.M., Eisenman, R.N.,
Chromatin immunoprecipitation and Weintraub, H. 1990. Sequence-specific DNA-binding by
Chromatin fixation and purification procedures were as de- the c-Myc protein. Science 250: 1149–1151.
scribed (Schubeler et al. 2000; Takahashi et al. 2000; Sawado et Blackwell, T.K., Huang, J., Ma, A., Kretzner, L., Alt, F.W., Ei-
al. 2001). Where indicated, cells were treated with 0.5 mM senman, R.N., and Weintraub, H. 1993. Binding of Myc pro-
CuSO4. Immunoprecipitation of cross-linked DNA was carried teins to canonical and noncanonical DNA sequences. Mol.
out using the following antibodies: rabbit polyclonal ␣AcH3, Cell. Biol. 13: 5216–5224.
␣AcH4 (Upstate), ␣dMnt mouse monoclonal antibodies (b8, b11; Blackwood, E.M. and Eisenman, R.N. 1991. Max: A helix–loop–
L. Loo, in prep.), and ␣dMyc mouse monoclonal (b10; Prober and helix zipper protein that forms a sequence-specific DNA
Edgar 2002). Duplex ␥[P32]-dCTP-labeled PCR reactions were binding complex with Myc. Science 251: 1211–1217.
preformed and quantified using “Storm” PhosphorImager sys- Boon, K., Caron, H.N., van Asperen, R., Valentijn, L., Hermus,
tem (Molecular Dynamics). Specific protein binding was mea- M.-C., van Sluis, P., Roobeek, I., Weis, I., Voute, P.A.,
sured as a comparison between the relative ratio of intensity of Schwab, M., et al. 2001. N-myc enhances the expression of a
the specific target “bic” PCR products to the reference. The large set of genes functioning in ribosome biogenesis and
reference gene kismet (kis) had negative binding values for both protein synthesis. EMBO J. 20: 1383–1393.
dMyc and dMnt, was not detected as a target in the larval myc Bouchard, C., Dittrich, O., Kiermaier, A., Dohmann, K., Men-
expression experiment, had linear amplification profile under kel, A., Eilers, M., and Luscher, B. 2001. Regulation of cyclin
the various conditions, and, therefore, serves as a loading con- D2 gene expression by the Myc/Max/Mad network: Myc-
trol. Primer sequences can be found in Supplemental Material. dependent TRRAP recruitment and histone acetylation at
the cyclin D2 promoter. Genes & Dev. 15: 2042–2047.
Bourbon, H.M., Gonzy-Treboul, G., Peronnet, F., Alin, M.F.,
Ardourel, C., Benassayag, C., Cribbs, D., Deutsch, J., Ferrer,
Acknowledgments P., Haenlin, M., et al. 2002. A P-insertion screen identifying
We are grateful to Steve Henikoff, Dirk Schübeler, Harmit Ma- novel X-linked essential genes in Drosophila. Mech. Dev.
lik, Fumiko Hirose, and Masamitsu Yamaguchi for valuable re- 110: 71–83.
agents, advice, and unpublished data. We are also grateful to Bussemaker, H.J., Li, H., and Siggia, E.D. 2001. Regulatory ele-
Bruno Amati and Paula Fernandez for discussion and sharing ment detection using correlation with expression. Nat.
unpublished data. We thank Steve Henikoff and Carla Grandori Genet. 27: 167–171.
for critical readings of the manuscript and Grace Navaja for Coller, H.A., Grandori, C., Tamayo, P., Colbert, T., Lander, E.S.,
technical assistance. Support for this work was from the Human Eisenman, R.N., and Golub, T.R. 2000. Expression analysis
Frontiers Science Program (A.O.), NIH grants GM47852 (S.P.), with oligonucleotide microarrays reveals MYC regulates
CA80295-03S (E.W.), 1P20LM007276-01 (HJB), Uehara Memo- genes involved in growth, cell cycle, signaling, and adhesion.
rial Foundation (T.S.), RO1CA57138 (R.N.E.), and NIH/NCI Proc. Natl. Acad. Sci. 97: 3260–3265.
Cancer Center Support Grant P30 CA15704-29 (J.D.), and R01 Davis, A.C., Wims, M., Spotts, G.D., Hann, S.R., and Bradley, A.
GM51186 (B.A.E.). 1993. A null c-myc mutation causes lethality before 10.5
The publication costs of this article were defrayed in part by days of gestation in homozygous and reduced fertility in het-
payment of page charges. This article must therefore be hereby erozygous female mice. Genes & Dev. 7: 671–682.
marked “advertisement” in accordance with 18 USC section de Alboran, I.M., O’Hagan, R.C., Gartner, F., Malynn, B., Da-
1734 solely to indicate this fact. vidson, L., Rickert, R., Rajewsky, K., DePinho, R.A., and Alt,
F.W. 2001. Analysis of C-MYC function in normal cells via
conditional gene- targeted mutation. Immunity 14: 45–55.
References Douglas, N.C., Jacobs, H., Bothwell, A.L., and Hayday, A.C.
2001. Defining the specific physiological requirements for
Amati, B., Frank, S.R., Donjerkovic, D., and Taubert, S. 2001. c-Myc in T cell development. Nat. Immunol. 2: 307–315.
Function of the c-Myc oncoprotein in chromatin remodeling Eisenman, R.N. 2001. Deconstructing myc. Genes & Dev.
1112 GENES & DEVELOPMENTGenomic binding by the Drosophila dMax network
15: 2023–2030. cell proliferation to terminal differentiation in the Dro-
Fazzio, T.G., Kooperberg, C., Goldmark, J.P., Neal, C., Basom, sophila eye. Dev. Cell 3: 511–521.
R., Delrow, J., and Tsukiyama, T. 2001. Widespread col- Johnston, L.A., Prober, D.A., Edgar, B.A., Eisenman. R.N., and
laboration of Isw2 and Sin3–Rpd3 chromatin remodeling Gallant, P. 1999. Drosophila myc regulates growth during
complexes in transcriptional repression. Mol. Cell. Biol. development. Cell 98: 779–790.
21: 6450–6460. Kim, S., Li, Q., Dang, C.V., and Lee, L.A. 2000. Induction of
Fernandez, P.C., Frank, S.R., Wang, L., Schroeder, M., Liu, S., ribosomal genes and hepatocyte hypertrophy by adenovirus-
Greene, J., Cocito, A., and Amati, B. 2003. Genomic targets mediated expression of c-Myc in vivo. Proc. Natl. Acad. Sci.
of the human c-Myc protein. Genes & Dev. (this issue). 97: 11198–11202.
Fieber, W., Schneider, M.L., Matt, T., Krautler, B., Konrat, R., Knoepfler, P.S., Cheng, P.F., and Eisenman, R.N. 2002. N-myc is
and Bister, K. 2001. Structure, function, and dynamics of the essential during neurogenesis for the rapid expansion of pro-
dimerization and dna-binding domain of oncogenic tran- genitor cell populations and the inhibition of neuronal dif-
scription factor v-myc. J. Mol. Biol. 307: 1395–1410. ferentiation . Genes & Dev. 16: 2699–2712.
Frank, S.R., Schroeder, M., Fernandez, P., Taubert, S., and Koskinen, P.J., Västrik, I., Mäkelä, T.P., Eisenman, R.N., and
Amati, B. 2001. Binding of c-Myc to chromatin mediates Alitalo, K. 1994. Max activity is affected by phosphorylation
mitogen-induced actylation of histone H4 and gene activa- at two NH2-terminal sites. Cell Growth Diff. 5: 313–320.
tion. Genes & Dev. 15: 2069. Laherty, C.D., Yang, W.-M., Sun, J.-M., Davie, J.R., Seto E., and
Gallant, P., Shiio, Y., Cheng, P.F., Parkhurst, S., and Eisenman, Eisenman R.N. 1997. Histone deacetylases associated with
R.N. 1996. Myc and Max homologs in Drosophila. Science the mSin3 corepressor mediate Mad transcriptional repres-
274: 1523–1527. sion. Cell 89: 349–356.
Grandori, C., Cowley, S.M., James, L.P., and Eisenman, R.N. Li, H. 2002. Computational approaches to identifying transcrip-
2000. The MYC/MAX/MAD network and the transcrip- tion factor binding sites in the yestad genome. Methods En-
tional control of cell behavior. Annu. Rev. Cell Dev. Biol. zymol. 350: 484–495.
16: 653–699. McMahon, S.B., Wood, M.A., and Cole, M.D. 2000. The essen-
Guo, Q.M., Malek, R.L., Kim, S., Chiao, C., He, M., Ruffy, M., tial cofactor TRRAP recruits the histone acetyltransferase
Sanka, K., Lee, N.H., Dang, C.V., and Liu, E.T. 2000. Identi- hGCN5 to c-Myc. Mol. Cell. Biol. 20: 556–562.
fication of c-myc responsive genes using rat cdna microarray. Neiman, P.E., Ruddell, A., Jasoni, C., Loring, G., Thomas, S.J.,
Cancer Res. 60: 5922–5928. Brandvold, K.A., Lee, R.m., Burnside, J., and Delrow, J. 2001.
Henikoff, S., Ahmad, K., Platero, J.S., and van Steensel, B. 2000. Analysis of gene expression during myc oncogene-induced
Heterochromatic deposition of centromeric histone H3-like lymphomagenesis in the bursa of Fabricius. Proc. Natl.
proteins. Proc. Natl. Acad. Sci. 97: 716–721. Acad. Sci. 98: 6378–6383.
Hirose, F., Yamaguchi, M., Handa, H., Inomata, Y., and Mat- Nepveu, A. 2001. Role of the multifunctional CDP/Cut/Cux
sukage, A. 1993. Novel 8-base pair sequence (Drosophila homeodomain transcription factor in regulating differentia-
DNA replication-related element) and specific binding factor tion, cell growth and development. Gene 270: 1–15.
involved in the expression of Drosophila genes for DNA Neufeld, T.P., de la Cruz, A.F.A., Johnston, L.A., and Edgar, B.A.
polymerase alpha and proliferating cell nuclear antigen. J. 1998. Coordination of growth and cell division in the Dro-
Biol. Chem. 268: 2092–2099. sophila wing. Cell 93: 1183–1193.
Hirose, F., Ohshima, N., Shiraki, M., Inoue, Y.H., Taguchi, O., Ogawa, H., Ishiguro, K., Gaubatz, S., Livingston, D.M., and Na-
Nishi, Y., Matsukage, A., and Yamaguchi, M. 2001. Ectopic katani, Y. 2002. A complex with chromatin modifiers that
expression of DREF induces DNA synthesis, apoptosis, and occupies E2F- and Myc- responsive genes in G0 cells. Science
unusual morphogenesis in the Drosophila eye imaginal disc: 296: 1132–1136.
Possible interaction with Polycomb and trithorax group pro- O’Hagan, R.C., Schreiber-Agus, N., Chen, K., David, G., Engel-
teins. Mol. Cell. Biol. 21: 7231–7242. man, J.A., Schwab, R., Alland, L., Thomson, C., Ronning,
Hochheimer, A., Zhou, S., Zheng, S., Holmes, M.C., and Tjian, D.R., Sacchettini, J.C., et al. 2000. Gene-target recognition
R. 2002. TRF2 associates with DREF and directs promoter- among members of the Myc superfamily and implications
selective gene expression in Drosophila. Nature 420: 439– for oncogenesis. Nat. Genet. 24: 113–119.
445. Pignoni, F. and Zipursky, S.L. 1997. Induction of Drosophila eye
Iritani, B.M., Delrow, J., Grandori, C., Gomez, I., Klacking, M., development by decapentaplegic. Development 124: 271–
Carlos, L.S., and Eisenman, R.N. 2002. Modulation of T lym- 278.
phocyte development, growth, and cell size by the Myc-an- Prendergast, G.C. and Ziff, E.B. 1991. Methylation-sensitive se-
tagonist Mad1 transcriptional repressor. EMBO J. 21: 4820– quence-specific DNA binding by the c-Myc basic region. Sci-
4830. ence 251: 186–189.
Jackson, S.M. and Blochlinger, K. 1997. cut interacts with Prendergast, G.C., Lawe, D., and Ziff, E.B. 1991. Association of
Notch and protein kinase A to regulate egg chamber forma- Myn, the murine homolog of Max, with c-Myc stimulates
tion and to maintain germline cyst integrity during Dro- methylation-sensitive DNA binding and Ras cotransforma-
sophila oogenesis. Development 124: 3663–3672. tion. Cell 65: 395–407.
James, L. and Eisenman, R.N. 2002. Myc and Mad bHLHZ do- Prober, D.A. and Edgar, B.A. 2002. Interactions between Ras1,
mains possess identical DNA-binding specificities but only dMyc, and dPI3K signaling in the developing Drosophila
partially overlapping functions in vivo. Proc. Natl. Acad. Sci. wing. Genes & Dev. 16: 2286–2299.
99: 10429–10434. Rubin, G.M., Hong, L., Brokstein, P., Evans-Holm, M., Frise, E.,
James, T.C., Eissenberg, J.C., Craig, C., Dietrich, V., Hobson, A., Stapleton, M., and Harvey, D.A. 2000. A Drosophila comple-
and Elgin, S.C. 1989. Distribution patterns of HP1, a hetero- mentary DNA resource. Science 287: 2222–2224.
chromatin-associated nonhistone chromosomal protein of Sawado, T., Igarashi, K., and Groudine, M. 2001. Activation of
Drosophila. Eur. J. Cell Biol. 50: 170–180. beta-major globin gene transcription is associated with re-
Jasper, H., Benes, V., Atzberger, A., Sauer, S., Ansorge, W., and cruitment of NF-E2 to the beta-globin LCR and gene pro-
Bohmann, D. 2002. A genomic switch at the transition from moter. Proc. Natl. Acad. Sci. 98: 10226–10231.
GENES & DEVELOPMENT 1113You can also read