Eukaryotic cell biology is temporally coordinated to support the energetic demands of protein homeostasis - Nature
←
→
Page content transcription
If your browser does not render page correctly, please read the page content below
ARTICLE
                  https://doi.org/10.1038/s41467-020-18330-x                OPEN

                  Eukaryotic cell biology is temporally coordinated
                  to support the energetic demands of protein
                  homeostasis
                  John S. O’ Neill 1 ✉, Nathaniel P. Hoyle 1, J. Brian Robertson2, Rachel S. Edgar3, Andrew D. Beale 1,
                  Sew Y. Peak-Chew 1, Jason Day4, Ana S. H. Costa 5,7, Christian Frezza 5 & Helen C. Causton6 ✉
1234567890():,;

                  Yeast physiology is temporally regulated, this becomes apparent under nutrient-limited
                  conditions and results in respiratory oscillations (YROs). YROs share features with circadian
                  rhythms and interact with, but are independent of, the cell division cycle. Here, we show that
                  YROs minimise energy expenditure by restricting protein synthesis until sufficient resources
                  are stored, while maintaining osmotic homeostasis and protein quality control. Although
                  nutrient supply is constant, cells sequester and store metabolic resources via increased
                  transport, autophagy and biomolecular condensation. Replete stores trigger increased H+
                  export which stimulates TORC1 and liberates proteasomes, ribosomes, chaperones and
                  metabolic enzymes from non-membrane bound compartments. This facilitates translational
                  bursting, liquidation of storage carbohydrates, increased ATP turnover, and the export of
                  osmolytes. We propose that dynamic regulation of ion transport and metabolic plasticity are
                  required to maintain osmotic and protein homeostasis during remodelling of eukaryotic
                  proteomes, and that bioenergetic constraints selected for temporal organisation that pro-
                  motes oscillatory behaviour.

                  1 MRC Laboratory of Molecular Biology, Cambridge CB2 0QH, UK. 2 Middle Tennessee State University, Murfreesboro, TN 37132, USA. 3 Molecular Virology,

                  Department of Medicine, Imperial College, London W2 1NY, UK. 4 Department of Earth Sciences, University of Cambridge, Cambridge CB2 3EQ, UK. 5 MRC
                  Cancer Unit, University of Cambridge, Cambridge CB2 0XZ, UK. 6 Columbia University Medical Center, New York, NY 10032, USA. 7Present address: Cold
                  Spring Harbor Laboratory, Cold Spring Harbor, NY 11724, USA. ✉email: oneillj@mrc-lmb.cam.ac.uk; hc2415@cumc.columbia.edu

                  NATURE COMMUNICATIONS | (2020)11:4706 | https://doi.org/10.1038/s41467-020-18330-x | www.nature.com/naturecommunications                           1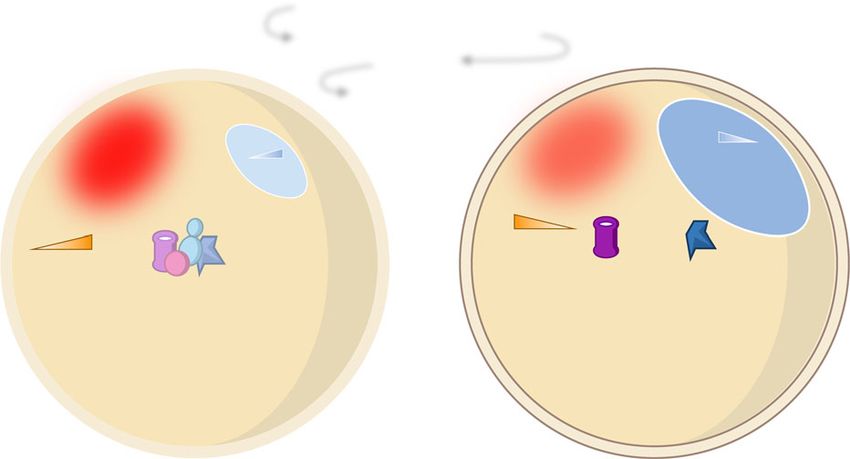
ARTICLE NATURE COMMUNICATIONS | https://doi.org/10.1038/s41467-020-18330-x
S
accharomyces cerevisiae undergo oscillations in oxygen a b
Dilution: 0.08 h–1 0.06 h–1 0.045 h–1
consumption and many other cellular processes that syn-
100 Total
OCR ( M s ) Dissolved O2 (%)
chronise spontaneously when cells are grown at high n =4 = Sample DO 9 LOC
density in aerobic, nutrient-limited culture at constant pH1–3. HOC
These metabolic cycles are thought to occur cell-autonomously, 50 p < 0.001
Duration (h)
6
p < 0.001
and to synchronise when the extracellular nutrient supply is
insufficient to support exponential growth4,5. Under normal 0
HOC LOC 3
conditions, DNA replication does not occur when oxygen con-
–1
3 n.s.
2
2 R > 0.9, n = 4
sumption is high, whereas respiratory rate does not affect the 0
1 0.04 0.06 0.08
timing of mitosis (Supplementary Fig. 1). Thus, yeast respiratory 0
Dilution rate (h–1)
oscillations (YROs) are a population-level phenomenon that is 20 25 30 35 40 45 50 55 60 80 85 90 95 100
Time (h)
distinct from, and with a different frequency to, the cell division
cycle but couples with it by imposing metabolic checkpoints on c d Mean abundance
0.045 h–1 Average
cell cycle progression6. Despite the importance of these oscilla- Min
LOC
Max
HOC
0.08 h–1 215 3 0.06 h–1
tions, the mechanism and utility of the YRO is poorly
11
understood7. 85 34
HOC cluster, n = 73
As with circadian and ultradian (33% across
all conditions). d Heatmap showing mean abundance of consistently
rhythmic proteins clustered with either LOC or HOC (see also
Results Supplementary Data 1). e Oxygen consumption and mean-normalized
Cell-intrinsic and -extrinsic factors regulate HOC and LOC. protein abundance, for representative examples of HOC (high-affinity
Oxygen consumption rates (OCRs) across the YRO can be sulfate permease, Sul1) and LOC (monocarboxylate transporter, Jen1)
interpolated by measuring dissolved oxygen in continuous cul- phase proteins. Source data are provided as a Source Data file.
ture, where phases of higher oxygen consumption (HOC, OCR
increases, DNA replication restricted) are distinguished from
lower oxygen consumption (LOC) during the rest of the cycle
60% of cellular mRNAs changing over the course of each
(Fig. 1a, Supplementary Fig. 1). Nutrient availability was cycle8,9,16. To gain mechanistic insight, we measured protein, ion
manipulated by changing the rate at which medium flowed
and metabolite content by mass spectrometry at multiple time
through the culture (dilution rate); higher dilution rates increase points over the respiratory cycle, from four independent biolo-
nutrient availability, medium turnover and removal of cells3. We
gical replicates at three dilution rates. Given the substantial
noticed that while the period of oscillation and LOC duration proteomic coverage, we were surprised to find that only 4% of
lengthened as dilution rate decreased, the duration of HOC was detected proteins varied with biologically significant amplitudes
invariant (Fig. 1a, b, Supplementary Fig. 1), suggesting that HOC (>33%17) across all three dilution rates. This argues against a
and LOC are regulated by cell-intrinsic and extrinsic factors, central role for dynamic changes in gene expression across the
respectively. To explain how YROs are generated, their physio- YRO, as does the poor correlation between the rhythmic ampli-
logical consequence and identify factors that determine oscilla- tude, and the stability, abundance, size of each protein or the
tory period, we sought to understand the differential activities energetic cost associated with production (Fig. 1c–e and Sup-
occurring during LOC versus HOC, and at the transition between plementary Figs. 2 and 3). Of the few proteins whose abundance
these two states. was rhythmic at the three dilution rates, unbiased k-means ana-
lysis suggested two clusters corresponding directly with LOC and
Rhythmic ion transport, metabolism and cytosolic granules. HOC (Supplementary Fig. 2a, b), with gene ontology analysis
Previous work suggested that YROs might organise through revealing a significant enrichment for terms associated with
differentially phased gene expression in order to minimize the transmembrane transport of ions and carboxylic acids (Table 1
cost of expressing large genes5,8,9,15, with the expression of up to and Supplementary Fig. 2c, d). For example, the abundance of the
2 NATURE COMMUNICATIONS | (2020)11:4706 | https://doi.org/10.1038/s41467-020-18330-x | www.nature.com/naturecommunications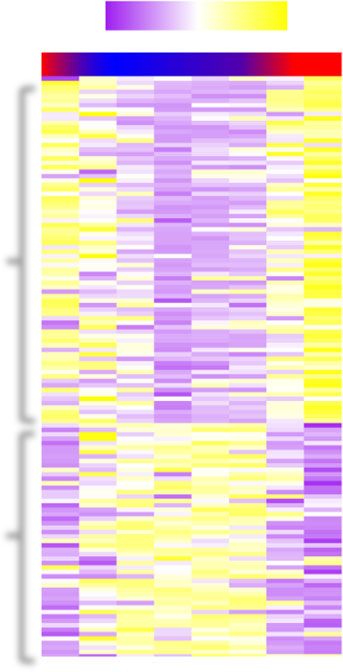
NATURE COMMUNICATIONS | https://doi.org/10.1038/s41467-020-18330-x ARTICLE
Table 1 Enrichment for proteins whose abundance changes rhythmically across the YRO reveals the importance of membrane
transport.
GO term Description p value Enrichment Activity
0055085 Transmembrane transport 2.31E−06 2.96 Ena1, Pex25, Hxt6, Vht1, Mgr2, Jen1, Mal11, Tim17, Fcy2, Ato3, Thi7, Yro2, Hip1,
Ato2, Agp1, Tim8, Itr1, Sul1, Mdh2, Fmp43, Ymr166C, Yor020W-A
0015718 Monocarboxylic acid 3.71E−05 11.03 Fmp43, Jen1, Vht1, Ato2, Ato3
transport
0034220 Ion transmembrane transport 4.98E−05 3.54 Ena1, Hxt6, Jen1, Mal11, Ato3, Yro2, Hip1, Ato2, Agp1, Sul1, Fmp43, Ymr166C,
Yor020W-A
The most highly enriched gene ontology processes for consistently rhythmic proteins, proteins within each GO term are coloured by their YRO phase of expression (bold, HOC; italics, LOC). The
complete list of proteins that change in abundance across the YRO is available in Supplementary Data 1. Enriched proteins support the conclusion that membrane transport is important for YROs, likely in
response to osmotic stress.
Most active transport in yeast occurs through proton-coupled
a b
0.08 h–1 0.06 h–1 0.045 h–1 1.0
secondary active transport, driven by a difference of 3 pH units
550/610 ratio
across the plasma membrane, that functions similarly to Na+ in
100 Cytosolic pH
% max
calibration
50 0.7 mammalian cells18. This ~1000-fold gradient is generated by the
0 Free AA p < 0.0001 0.4
R 2 = 0.99
essential ATP-dependent H+-pump, Pma1, which constitutes
100 5.5 6.0 6.5 7.0 15–20% of all yeast membrane protein19 and consumes 20–40%
% max
pHIC
50
of cellular ATP20. The large variation in cellular osmolyte content
0 Sol protein p < 0.0001 c 0.08 h–1 0.06 h–1 0.045 h–1 over the YRO strongly suggested differential rates of H+ export.
7.0
To test this, we derived the H+-export rate from the volume of
100
pHIC
% max
pHIC
50 6.5
0
NaOH required to maintain constant extracellular pH, as a proxy
100
trehalose p < 0.0001 6.0 for Pma1 activity. Our data revealed a robust rise in cellular H+-
OCR (µM s )
OCR
–1
% max
2.8 export during HOC, which increased >2-fold in parallel with
50
0
1.8 oxygen consumption, within each cycle (Fig. 2a and Supplemen-
AMP p < 0.0001
1003 0.8 tary Fig. 4a, b). Cytosolic pH functions as a second messenger in
% max
50 0 8 16 0 10 20 0 13 26 yeast21, so we investigated whether intracellular pH mirrored our
0 betaine p < 0.0001
Cycle time (h)
observed changes in H+-export. To do this we developed a
100 K+ p < 0.0001
ratiometric luciferase-based assay for real-time measurement of
d
% max
Ti
50 m
e cytosolic pH over the YRO (Fig. 2b). We found that increased H+
0 OCR p < 0.0001 Osmolytes Osmolytes export was consistently accompanied by a significant rise in
H+ export p < 0.0001
3 Amino acids Amino acids intracellular pH (pHic) of >0.5 units (>3-fold drop in [H+]),
–1
2
Ms
(CH2O)n (CH2O)n
1 irrespective of dilution rate (Fig. 2c), which rapidly returned to
0
Respiration Respiration the lower pH at the HOC-to-LOC transition.
0 3 6 0 4 8 0 5 10
Cycle time (h) pHIC pHIC In agreement with previous work22, >90% of other cellular
metabolites we detected showed consistent variation across the
LOC HOC YRO at each dilution rate (Supplementary Fig. 5), and unbiased
k-means analysis again suggested two clusters, corresponding to
Fig. 2 Variation of metabolites, transport, and soluble protein across the HOC and LOC. Metabolites in the major cluster increased during
YRO. a There are consistent phase relationships between intracellular free LOC and fell during HOC (Supplementary Fig. 5a, d). Of
amino acids (AA), soluble (Sol) protein, trehalose (storage carbohydrate), particular note, amino acids and storage carbohydrates such as
AMP, betaine, K+, OCR and H+ export under all conditions (n = 4 trehalose, and indicators of low energy charge such as AMP, all
biologically independent samples, two-way ANOVATime p value shown, showed similar profiles to cellular osmolytes—increasing by 2–3-
mean ± SEM). b Calibration curve for firefly luciferase emission ratiometric fold during LOC and then decreasing in HOC (Fig. 2a), whereas
reporter of intracellular (cytosolic) pH. c Intracellular pH (pHIC) oscillates acetate and intermediates of phospholipid synthesis showed
as a function of YRO phase under all conditions (representative data). opposite profiles (Fig. 2d).
d Summary of key events that occur during HOC and LOC. Source data are During glucose limitation or osmotic stress, yeast sequester
provided as a Source Data file. proteins and mRNAs within non-membrane-bound ribonucleo-
protein biomolecular condensates (BMCs), including stress
granules and p-bodies, whose formation is stimulated by a fall
sulfate transporter Sul1 clusters with HOC, whereas the mono- in pHic, and glucose starvation, and maintained by high osmotic
carboxylate/proton symporter Jen1 clusters with LOC (Fig. 1e potential23,24. We predicted that the dramatic decrease in cellular
and Supplementary Fig. 2d). osmolyte content and increase in intracellular pH during HOC
Our proteomic analyses suggested an unexplored requirement would increase the fraction of soluble protein liberated from
for differential ion transport during the YRO. Consistent with BMCs. We observed >2-fold variation in soluble cellular protein
this, elemental and metabolite analysis revealed striking >2-fold content, coinciding with HOC, whereas total cellular protein and
variations in cellular osmolytes (K+, betaine, choline) over the protein in the media showed no significant variation (Fig. 2a and
oscillation, which accumulated during LOC and decreased during Supplementary Fig. 6a, b). Gene ontology analysis of soluble
HOC (Fig. 2a and Supplementary Figs. 4 and 5). Increased proteins with greatest variation between HOC and LOC revealed
osmolyte export was also detectable in the extracellular media, significant enrichment for protein chaperones, proteasomes,
resulting in transient spikes in osmolality during HOC (Supple- ribosomal subunits and key metabolic enzymes such as enolase
mentary Fig. 5c). (Eno1/2), pyruvate kinase (Cdc19) and decarboxylase (Pdc1)
NATURE COMMUNICATIONS | (2020)11:4706 | https://doi.org/10.1038/s41467-020-18330-x | www.nature.com/naturecommunications 3
ARTICLE NATURE COMMUNICATIONS | https://doi.org/10.1038/s41467-020-18330-x
(Supplementary Fig. 6c). These proteins have previously been and ATP:ADP/AMP ratio relieve TORC1 inhibition via the Gcn2
found in BMCs24–26. and Snf1/AMPK pathways. Increased translation gradually
consumes stored vacuolar amino acids, while energetic require-
ments are met by liquidation of trehalose and glycogen stores that
A testable model of the YRO. To explain our observations, we fuel increased glycolysis and respiration. Liberation of chaper-
considered that protein synthesis is the most energetically ones, proteasomes and other quality control factors from BMCs
expensive process that cells undertake, requiring high ATP aids efficient protein synthesis, assembly of protein complexes
turnover and tRNAs charged with amino acids27. The assembly of and turnover of damaged or misfolded proteins. To maintain
macromolecular protein complexes (e.g., ribosomes, proteasomes, osmotic homoeostasis, the large increase in osmotic potential that
electron transport complexes) is particularly challenging since would result from increased cytosolic macromolecular solutes
subunits must be expressed stoichiometrically, at the same time, during HOC is buffered by export of osmolytes (K+, betaine,
and without exceeding chaperone capacity, otherwise they are choline) to maintain the cytosolic activity of water. In this model,
wastefully degraded or misfold and aggregate, with associated rhythms of respiration and metabolism are ultimately driven by
fitness costs27–29. Protein synthesis, folding and complex assem- the bioenergetic demands of increased TORC1-stimulated protein
bly are also sensitive to molecular crowding and osmolyte synthesis, triggered by elevated pHic. DNA replication and lipid
concentration24,30. Indeed, hyperosmotic challenge leads to synthesis are restricted during HOC (Supplementary Figs. 1 and
degradation or sequestration of macromolecular solutes and 5), because cellular resources are directed towards protein
export of osmolytes to maintain osmotic potential31,32. Since production.
macromolecular complexes account for ~40% of all cellular According to our model (Fig. 3a), the end of HOC occurs due
protein33,34, efficient complex assembly is particularly challenging to (1) cytosolic acidification due to insufficient ATP (a result of
for yeast under nutrient-poor conditions, when cells carry out depleted carbohydrate stores and reduced glucose supply), (2)
autophagy to generate free amino acids that serve as metabolic insufficient O2 supply which also reduces ATP production and/or
substrates for ATP production and accumulate carbohydrate (3) exhaustion of amino acid or osmolyte stores, resulting in
stores of glycogen and trehalose. These stores are rapidly mobi- Gcn2 activation or osmotic challenge, respectively. The period of
lised to fuel anabolic metabolism and cell cycle progression upon oscillation is therefore determined by the amount of time taken to
the return to growth35,36. replenish osmolyte, amino acid and carbohydrate stores during
Target-of-Rapamycin Complex 1 (TORC1) is the master LOC, and the (normally) invariant duration of HOC reflects a
regulator of protein homoeostasis that controls the switch between consistent time taken to spend stored carbohydrates, osmolytes
anabolic protein synthesis and catabolic autophagy37–39. In yeast, and/or amino acids on protein synthesis. We would therefore
TORC1 activity is regulated by glucose via increased pH/ expect that exit from HOC will be brought forward by acute
Gtr1 signalling, and indirectly by amino acid availability and hyperosmotic stress, translational or respiratory inhibition.
energy charge via Gcn2 and Snf1/AMPK, respectively21,26,39,40.
TORC1 activity is also sensitive to molecular crowding, pH and
osmolality30,38,41. Coincidence detection through TORC1 ensures YRO model validation. This model is consistent with available
that the high translation rates required for efficient protein data and makes many testable predictions. For example, we
complex biogenesis only occur when sufficient energetic and observed significantly higher rates of protein synthesis and
biosynthetic resources are available. TORC1 signalling during HOC, whereas autophagy was more
In light of these well-established features of yeast cell biology, active during LOC (Fig. 3b, c). Autophagic breakdown products
our observations suggest a mechanistic basis for understanding such as free amino acids are stored in the cell vacuole43, and we
YROs, where oscillations ultimately arise from the selective observed significant differences in vacuolar morphology between
pressure for efficient protein synthesis when nutrients are limiting LOC and HOC corresponding with differential autophagic flux
(Fig. 3a). In this model, LOC is the default sequester and store across the YRO (Fig. 3d and Supplementary Fig. 8c).
state, in which low amino acid availability, energy charge and To test our prediction that the energetic demands of increased
pHic inactivate TORC1, thus facilitating ATP generation through protein synthesis drive the characteristic increase in oxygen
respiration of acetate and autophagic products while protein consumption during HOC, we added cycloheximide (CHX) or
synthesis is low21. Low pHic also promotes progressive sequestra- rapamycin to cells to inhibit translation or TORC1 activity,
tion of macromolecules and glycolytic enzymes, such as Cdc19, respectively. Confirming expectation, both drugs immediately
into BMCs26 and cytosolic removal of these colloidal macro- curtailed the anticipated increase in oxygen consumption and
molecular solutes stimulates osmolyte accumulation to maintain proton export during HOC (Fig. 3e), and abolished subsequent
osmotic homoeostasis. Respiration of acetate, autophagic and oscillations, but without similar effect on basal levels of
residual glycolytic products generate sufficient ATP to fuel basal respiration. At lower, non-saturating concentrations, rapamycin
Pma1-mediated H+ export, but reduced activity of sequestered addition during HOC shortened the period of YRO oscillations,
glycolytic enzymes redirects the bulk of available glucose towards but critically the first effect of drug treatment was observed
polysaccharide, lipid and nucleotide biosynthesis. The latter two during the next HOC rather than the intervening LOC
are favoured because more glucose is available for NADPH and (Supplementary Fig. 7a, b). By our model LOC is expected to
ribose production via the pentose phosphate pathway, increasing be insensitive to acute TORC inhibition but reduced in length
production of the essential building blocks for cell growth during after a truncated HOC, since stores will not be fully depleted and
the G1/2 and S-phase of the cell cycle, respectively. so take less time to replenish. These observations strongly support
When carbohydrate stores are replete, surplus glucose and ATP our hypothesis that TORC1 inactivation suppresses protein
stimulates increased H+ export by Pma1 (ref. 42), thereby raising synthesis during LOC, and that TORC1 activation triggers the
pHic. Increased pHic triggers the checkpoint for entry into HOC increase in translation that drives the demand for greater
by stimulating a feed-forward switch that liberates glycolytic respiration during HOC.
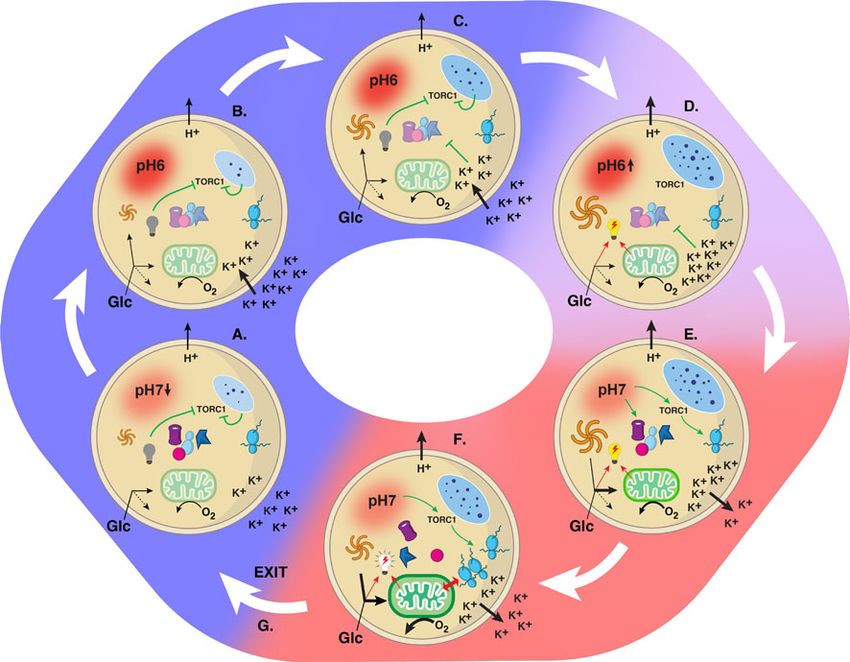
enzymes such as Cdc19 from BMCs to increase glycolysis, We next sought to assess the extent of differential BMC
increasing energy charge and further elevating pHic. Increased sequestration and glycogen storage over the YRO. Consistent with
pHic also stimulates TORC1 to license increased protein expectation, the stress granule marker, Pab1, was significantly
synthesis, which is sustained because high amino acid levels more diffuse during HOC, whereas brighter foci were evident
4 NATURE COMMUNICATIONS | (2020)11:4706 | https://doi.org/10.1038/s41467-020-18330-x | www.nature.com/naturecommunications
NATURE COMMUNICATIONS | https://doi.org/10.1038/s41467-020-18330-x ARTICLE
a 1. Stores replete
during LOC (Fig. 4a). Moreover, the amount of cellular glycogen
LOC 2. Energy charge
HOC fell by 40% during HOC (Fig. 4b), with a profile very similar to
‘Sequester ‘Spend on
& Store’
3. pH
synthesis’ that of trehalose (Fig. 2a), the other major storage carbohydrate.
Given the pivotal role of Pma1-mediated H+ transport in our
4. TORC1
+ +
H H
Metabolic
pH6 checkpoint pH7 AAs
model, we tested a prediction that the period of oscillation should
AAs
(CH2 O)n
be sensitive to increases in pH gradient across the plasma
Vacuole
(CH2 O)n
Granule
membrane because more ATP turnover will be required to
TORC1 maintain pHic, in both HOC and LOC. Concordantly, we found
TORC1 K+ active YROs run >2-fold faster with decreasing, but not increasing,
inactive Osmolytes K+ +
K
K+
K+
K
+ extracellular pH (Fig. 4c, d). Our model also predicts increased
+
K K
+
Pma1 activity will elicit shorter cycles, as this accelerates the HOC
K+ Exit
Glc
O2
Glc
O2 K
+
to LOC transition. We tested this with mutants of hsp30, a
K+ Stores spent
K K
+
+
negative regulator of Pma1 (ref. 44), observing shorter, truncated
or energy charge
or osmotic challenge cycles of oxygen consumption and pHic (Fig. 4e, f).
From the model (Fig. 3a), dynamic import and export of
b LOC HOC LOC HOC kDa c LOC HOC LOC HOC LOC kDa osmolytes during LOC and HOC, respectively, is critical for
35
puro 25 Full length 70
buffering cytosolic osmotic potential: permitting cycles of TORC1
loading 35
Cleavage
35
25
activity and reversible macromolecular sequestration in BMCs/
pRps6 25
loading 35 Loading 35
stress granules, both of which are critical for HOC translational
3 OCR 3 bursting and associated respiration increase. Consistent with this,
OCR (µM s )
OCR (µM s )
–1
–1
an acute osmotic challenge during HOC, which both inhibits
2 2 TORC1 activity30 and opposes protein liberation from BMCs,
Puromycin OCR
resulted in immediate exit from HOC (Supplementary Fig. 7c).
1 1
Phospho-Rps6 Autophagy To functionally validate the importance of intracellular
100 100
osmolyte accumulation to YRO period determination, at the
% maximum
% maximum
50
TWAINT
50 transitions between LOC and HOC, we manipulated the major
p < 0.0001
n=3
intracellular osmolyte K+. The model predicts that decreased
n=3 OWA p = 0.003
0 0 osmotic buffering will shorten the duration of both HOC and
70 72 74 76 78 44 48
Time (h)
52 56
LOC. This is because insufficient K+ accumulation in LOC means
Time (h)
that HOC cannot be sustained, resulting in early osmotic
d e OCR
challenge, whereas LOC will be shorter because stored carbohy-
+
H export
Rapamycin
drates/amino acids were not exhausted during the previous HOC.
LOC 3 CHX 3
HOC n=3
This, in turn, will reduce the time taken to reach the pHic
n=5
vacuole 2 2 threshold for HOC entry in the next cycle. To test this, the infeed
10 p = 0.002 p = 0.008 1 1 was switched to media where K+ was replaced with Na+. As
8 extracellular K+ decreased, we indeed observed a dramatic and
–1
0 Vehicle 0 Vehicle
m3 or m–1
Ms
6 3 3 reversible shortening of YRO period, whereas depleting Mg2+,
4 2 2 another essential metal ion but without significant osmotic
2 1 1
function, simply abolished oscillations (Fig. 4g, h and Supple-
0
mentary Fig. 7d, e). Conversely, pulse addition of K+ increased
0 0
Volume SA 100 107 114 121 128 205 215 225 235
YRO period, as well as basal OCR, HOC oxygen consumption
Volume Time (h) Time (h) and duration, because increased K+ availability facilitates greater
osmolyte accumulation during LOC allowing HOC to be
Fig. 3 Switching occurs between protein synthesis (HOC) and autophagy
sustained for longer (Supplementary Fig. 7f, g).
(LOC). a Model: cells accumulate carbohydrates (CH2O)n, amino acids and
osmolytes during LOC and consume/export them in HOC to sustain
translational bursts and maintain osmostasis. Replete stores increase H+
Physiological consequences. We next explored the physiological
export, a pH-dependent checkpoint activating TORC1 and releasing BMC
consequences of our YRO model, which predicts that the yeast
proteins. HOC ends when stores are exhausted, see Fig. 5e and
Supplementary Table 1 for more details. b Puromycin incorporation assay
should be more sensitive to a heat stress during HOC, as
increased cytosolic protein concentration, reduced osmotic buf-
and immunoblot for TORC1 activation (phospho-Rps6, Ser235/236) reveal
translational bursting in HOC (n = 3 biologically independent samples,
fering capacity and lower trehalose abundance should render cells
more susceptible to protein denaturation. To test this, cells
TWAINT: two-way ANOVAINTERACTION, total protein loading control).
c Immunoblots for cleaved/full-length Pgk1-GFP reveal increased
sampled from different points of the YRO were immediately
subjected to an acute heat shock, and survival measured under
autophagy during LOC (n = 3 biologically independent samples, OWA one-
standard growth conditions. Consistent with prediction, a twofold
way ANOVA, total protein loading control). d Differential variation in
difference in viability was observed between cells harvested at
vacuole volume vs. surface area:volume ratio (two-sided unpaired t-test,
the minimum and maximum OCR (Fig. 5a). We then tested
n = 7 independent experiments for HOC and LOC, n > 68 cells per image).
whether translational bursting during HOC is sensitive to acute
Data throughout presented as mean ± SEM where *p ≤ 0.05, **p ≤ 0.01,
perturbation of the transmembrane pH gradient and to osmotic
***p ≤ 0.001, ****p ≤ 0.0001. e Acute inhibition of protein synthesis (CHX,
challenge, as would be expected. For this assay, we measured
25 µg mL−1 cycloheximide or TORC1 activity 200 nM rapamycin) during
protein synthesis by puromycin incorporation. Cells were
HOC immediately terminates HOC and abolishes the YRO, representative
removed from the bioreactor during HOC and transferred
OCR and H+-export traces are shown. Source data are provided as a Source
immediately into media of different pH or osmolality. Consistent
Data file.
with expectations, higher pH acutely increased translation
NATURE COMMUNICATIONS | (2020)11:4706 | https://doi.org/10.1038/s41467-020-18330-x | www.nature.com/naturecommunications 5ARTICLE NATURE COMMUNICATIONS | https://doi.org/10.1038/s41467-020-18330-x
a b requires high ATP turnover that can only be sustained by the
Pab1-GFP rapid mobilization of glucose from carbohydrate stores. There-
OCR (µM s ) Intensity (%) STD/mean (%)
100 Glycogen
100 fore, glycogen metabolism mutants will have no temporal
% maximum
50 organization to the synthesis of proteins or respiration. This will
0 75 render nascent proteins more likely to exceed chaperone capacity,
100
OWA:
p < 0.0001 OWA: p = 0.004
and/or fail to find a binding partner, and so increase misfolded
50 n 72 LOC 50
n=3 and aggregated proteins. Consistent with this, glycogen storage or
3 consumption mutants did not exhibit respiratory oscillations and
OCR (µM s )
–1
0
3
showed a 50% increase in protein aggregation (Fig. 5c, d),
–1
2
indicating a profound deficiency in protein homoeostasis28,29.
2
HOC 1
1
88 90 92 94 96 98
112 116 120 124 Discussion
Time (h)
Time (h) We provide an experimentally derived, predictive and testable
model of the YRO wherein central metabolism, signal transduc-
c d 6
tion, active transport, and macromolecular condensation are
pH 3.4 Total
3.0
3.2 3.0 2.8 2.7
Duration (h) temporally organized to accommodate the bioenergetic demands
2.6 LOC of protein synthesis (Figs. 3a and 5e). This model accounts for the
OCR (µM s )
4
–1
period of oscillation in that HOC duration depends on the
2.2 HOC
2 amount of time taken to satisfy one or more of the conditions for
**** HOC exit, whereas the duration of LOC depends on the time
n 3, TWA INT
1.4 0
–25 0 25 50 75 4.5 4.0 3.5 3.0 2.5 taken to accumulate carbohydrate.
Time (h) pHEC Eukaryotes have evolved under conditions where nutrients are
limiting and environmental conditions vary. Given the high
e Wild type hsp30 f energetic cost of macromolecular complex assembly, and the
7.0 ****
TWAINT
selective pressure for efficient use of resources, we propose that
4
oscillations in global protein synthesis rate confer a general fitness
pHIC
6.5
Duration (h)
LOC
6.0
advantage, realised in many other biological contexts, that is
HOC
3.0
supported by the same save and spend partitioning of metabolic
OCR (µM s )
2
–1
n=5 resources we have observed in yeast.
2.2
Aspects of our model that involve H+ gradients and vacuoles
1.4 0 are unlikely to apply to eukaryotic cell types that lack cell walls or
0 10 20 0 10 20 WT hsp30 use Na+ instead of H+ gradients. However, we speculate that
Time (h)
dynamic transport of cellular osmolytes to buffer osmotic
homoeostasis against changes in macromolecular condensation,
g h
K+
6 Total and dynamic rerouting of metabolic flux to increase ATP pro-
3.0 LOC
duction during TORC1-dependent translational bursting, are
Duration (h)
4 HOC
OCR (µM s )
–1
essential for the temporal organization of proteome remodelling,
2.2
2 ****
TWAINT
and therefore common to most eukaryotic cells. Cell-autonomous
n=3
rhythms of TORC activity, protein synthesis, potassium transport
1.4 0 and cellular respiration have been all been observed in mam-
10 1 0.1
–25 0 25 50 75
[K+]EC (mM) malian cells over the course of the circadian cycle45–54. We
Time (h)
therefore speculate that the central utility of biological oscillations
Fig. 4 YROs regulate stress granules and glycogen, and are sensitive to such as the YRO, and circadian rhythms throughout the eukar-
H+ and K+. a The intensity and distribution (STD/mean) of stress granule yotic lineage, is to facilitate the efficient utilisation of metabolic
marker Pab1 (Pab1-GFP signal) varies over the YRO, with more foci during resources in order to minimize the cost of protein homoeostasis.
LOC and more diffuse during HOC, supporting dynamic variation in stress
granule formation (The scale bar represents 1 µm. OWA, nT90h = 4 images Methods
and nT92-97h = 8 images one experiment, n ≥ 72 granules per time point). Bioreactor continuous measurement and discrete sampling. Respiratory oscil-
b Cellular glycogen stores increase during LOC and decrease during lations were initiated and maintained in a DASgip bioreactor7,9. For generation of
samples for high-throughput analysis (metabolomics, proteomics, ionomics and
HOC (OWA, n = 3 biological replicates). Liquidation of storage
flow cytometry) the bioreactor was operated with four replicates in parallel at 220
carbohydrates is likely to fuel translational bursting during HOC. c, d sL h−1 aeration, 550 r.p.m. agitation, 1.5 L media per vessel, at 0.08, 0.06 or 0.045
Decreasing extracellular pH reduces the period of the YRO duration dilutions h−1, 30 °C; pH 3.4 was maintained by addition of 2 M NaOH in media
(representative OCR, npH3.4 = 4 or n = 3 independent experiments). e, f containing 10 g L−1 anhydrous glucose, 5 g L−1 ammonium sulfate, 0.5 g L−1
magnesium sulfate heptahydrate, 1 g L−1 yeast extract, 2 g L−1 potassium phos-
HSP30 mutants have truncated oscillations (maroon/red, pHIC; black/grey,
phate, 0.5 mL L−1 of 70% v/v sulfuric acid, 0.5 mL L−1 of antifoam A, 0.5 mL L−1
representative OCR, n = 4 biological replicates). g, h Extracellular K+ 250 mM calcium chloride, and 0.5 mL L−1 mineral solution A (mineral solution A is
concentration determines YRO period duration (representative OCR). This 40 g L−1 FeSO4.7H2O, 20 g L−1 ZnSO4.7H2O, 10 g L−1 CuSO4.5H2O, 2 g L−1
is unlikely to be due to loss of cell viability as YROs are rapidly restored MnCl2.4H2O and 20 mL L−1 75% sulfuric acid). To initiate YROs bioreactor vessels
when potassium becomes available (representative OCR). All data are were each inoculated with 100 OD (A600) units L−1 cells in the stationary phase. The
culture was allowed to grow, return to the stationary phase and maintained without
shown as mean ± SEM. Source data are provided as a Source Data file. addition of new media for 6 h. Oscillations were initiated by refeeding the culture at
the dilution rates above and allowed to stabilise for 1–2 days before data collection
or harvesting of samples. The dissolved oxygen (DO2) traces are shown in Sup-
whereas lower extracellular pH and hyperosmotic media reduced plementary Fig. 1a. pH was monitored using a calibrated pH electrode and the pH
it (Fig. 5b and Supplementary Fig. 8). maintained by automated addition of 2 N NaOH. In 1.5 L media, 1 mL h−1 2 N
NaOH neutralises H+ production equivalent to 0.37 μM s−1.
Moving beyond the mechanistic determinants and ramifica- Dissolved O2 was monitored with an O2 electrode. To establish the relationship
tions of this biological rhythm, our model makes an explicit between relative DO2 and oxygen consumption, the O2 electrode was calibrated by
prediction about its functional utility: translational bursting allowing anoxic media to equilibrate with atmospheric O2 under the conditions
6 NATURE COMMUNICATIONS | (2020)11:4706 | https://doi.org/10.1038/s41467-020-18330-x | www.nature.com/naturecommunicationsNATURE COMMUNICATIONS | https://doi.org/10.1038/s41467-020-18330-x ARTICLE
a c gsy2 gph1
described above (100% = 210 μM O2 at 30 °C, Supplementary Fig. 1b). This
permits OCR (μM s−1) to be derived for any steady-state concentration of O2
OCR (µM s–1) % Viability post-HS
100 100
WT (Supplementary Fig. 1d) where O2 is removed from the system. To allow
50 80 quantitative comparison between experiments, we defined HOC as a sustained
Dissolved O2(%)
increase in OCR such that the 10 min moving average of the first derivative of OCR
0
Viability 60
(dOCR/dt) is >0 for ≥10 min and increases by >10% overall within each bout. The
OCR
3
40
phase of LOC occurs between bouts of HOC.
At stated time points, 1.5 mL samples were removed from the bioreactor and
2 20 harvested by centrifugation (2840g, 4 °C, 3 min). The supernatant and pellet were
n = 3, OWA: p = 0.002
flash frozen separately in liquid nitrogen and stored at −80 °C. Cell pellets (60 µL
1 0 volume) were then thawed on ice, and washed twice in 1 mL ice cold, isosmotic
65 69 73 77 24 30 36 42 buffer X (25 mM iodoacetamide, 25 mM NaF, 25 mM NaN3, H2SO4 added to pH
Time (h) Time (h) 3.4, made up to 150 mOsm with 1 M sorbitol) to remove extracellular ions, proteins
and metabolites and inactivate cellular enzymes. Pellets were resuspended in 1 mL
b d buffer X, split into three aliquots, centrifuged, supernatant removed, and stored at
Translation (% puromycin)
**** ***
OWA
** OWA −80 °C for analysis by mass spectrometry.
% Protein aggregation
n=4 n=4 200 n=4
100 *
*** Unless stated, all other bioreactor experiments took place under identical
*** 150
Silver stain for conditions except that 175 sL h−1 aeration and 1.0 L media per vessel were used,
** aggregation with appropriate O2/pH calibrations and calculations also being performed. Drugs
100
60
were dissolved in DMSO (Sigma D2650) and added by pulse addition of drug or
50
vehicle to the bioreactor vessel and infeed media. Rapamycin (Sigma R0395) 15 or
20 0 200 nM final concentration, CHX 25 μg mL−1 (Sigma C7698) was used for the
2.8
3.4
4.5
gly
srb
veh
WT gph1 WT gph1 experiements.
pH Osmolyte
e Proteomics. Samples were prepared using 20 µL pellets of yeast, which were lysed
in 100 µL lysis buffer (6 M urea, 2 M thiourea, 20 mM HEPES pH 8, with protease
and phosphatase inhibitors) with 50 µL of 0.5 mm glass beads by agitation using a
Bioruptor Genie (Scientific Industries) at 4 °C (3 × 60 s with 5 min on ice between
runs). Lysates were clarified by centrifugation at 21,000g for 5 min and total protein
concentrations determined using the Pierce BCA assay (Thermo). The con-
centration of each sample was normalised to 200 µg at 1 mg mL−1. For each
dilution rate, 100 µL of supernatant from four biological replicates was pooled to
generate samples representing nine time points. A pooled cell extract reference
sample was made by mixing 25 μL from each of the nine samples.
Samples in 200 μL lysis buffer were reduced with 5 mM DTT at 56 °C, 30 min
and alkylated with 10 mM iodoacetamide in the dark at room temperature, 30 min.
Samples were then digested with Lys-C (mass spectrometry grade, Promega), 133:1
(protein: Lys-C ratio, w/w) for 4.5 h, 25 °C and then diluted from 8 M to 1.8 M urea
with 20 mM HEPES (pH 8.5) and digested with trypsin (Promega) 100:1 (protein:
trypsin ratio, w/w) overnight, 25 °C. Digestion was stopped by the addition of
trifluoroacetic acid (TFA) to 1% final concentration. Precipitates were removed by
centrifugation (9300g, 5 min). The supernatants were desalted using home-made
C18 stage tips (3M Empore) containing 4 mg poros R3 (Applied Biosystems) resin.
Bound peptides were eluted with 30–80% acetonitrile (MeCN) in 0.1% TFA and
Glc Glucose ATP production
lyophilized.
Tandem mass tag (TMT) labelling was carried out by resuspending peptide
Higher/lower oxygen consumption Increased mitochondrial ATP production mixtures in 75 μL 3% MeCN and concentrations determined using the Pierce
stimulated by translational bursting demand
Storage carbohydrates
Quantitative Colorimetric Peptide assay (Thermo Scientific) according to the
(trehalose and glycogen) Energy charge (high/intermediate/low) manufacturer’s instructions, except the absorbance was measured using NanoDrop
Spectrophotometers (Thermo Scientific) at 480 nm. TMT 10plex reagent (Thermo
Vacuole containing amino acids K+ Concentration of osmolytes e.g. K+ ions
Fisher Scientific) of 0.8 mg each was re-constituted in 41 μL anhydrous MeCN. In
all, 61.5 μL (1.5 × 0.8 mg) of the reagent was used for each sample. The labelling
Inactive components in condensates Predicted relative metabolic flux (high/low)
and macromolecular assemblies
reaction was performed in 150 mM triethylammonium bicarbonate, 1 h at room
temperature and terminated by 15 min incubation with 9 μL 5% hydroxylamine.
Active chaperones, proteasomes, Predicted energy flow to support growth
metabolic and other enzymes via nucleotide and lipid synthesis Labelled peptides were combined into a single sample and partially dried to remove
acetonitrile in a SpeedVac. The labelled mixture was desalted using C18 stage tips,
Translating ribosome Repression/stimulation of activity
with 6.6 mg of R3.
Off-line high pH reverse-phase peptides fractionation was carried out using
Fig. 5 The YRO regulates resistance to heat stress and protein approximately 100 μg of the labelled peptides. These were separated on an off-line,
homoeostasis. a Viability of cells removed from the bioreactor after heat high-pressure liquid chromatography (HPLC). The experiment was carried out
using XBridge BEH130 C18, 5 µm, 2.1 × 150 mm (Waters) column with XBridge
treatment (55 °C, 2 min) is greatest at the end of LOC, when the BEH C18 5 µm Van Guard cartridge, connected to an Ultimate 3000 Nano/
abundance of trehalose and osmolytes are greatest. Percentage of heat- Capillary LC System (Dionex). Peptides were separated with a gradient of 1–90% B
treated cells, corrected for viability of non-heat-treated cells harvested at (A: 5% MeCN/10 mM ammonium bicarbonate, pH 8 [5:95]; B: 90% MeCN/10 mM
the same time (OWA, n = 3 biological replicates). b Sensitivity of HOC ammonium bicarbonate, pH 8, [9:1]) in 60 min at a flow rate of 250 µL min−1.
Sixty fractions were collected, combined into 20 fractions and partially dried in a
protein synthesis rate to pH and hyperosmotic stress assayed by
SpeedVac to about 50 μL.
puromycin incorporation (gly, 10% glycerol; srb, 1 M sorbitol, n = 4 Liquid chromatography-tandem mass spectrometry (LC-MSMS) was
biological replicates). c Strains deficient in glycogen synthesis (gsy2) or performed on an Ultimate 3000 RSLC nano System (Thermo Scientific) fitted with
glycogen breakdown (gph1) do not initiate YROs and, d, gph1 strains a 100 µm × 2 cm PepMap100 C18 nano trap column and a 75 μm × 25 cm reverse-
phase C18 nano-column (Aclaim PepMap, Thermo Scientific). Samples were
accumulate aggregated protein, showing that glycogen breakdown is
separated using a binary gradient consisting of buffer A (2% MeCN, 0.1% formic
necessary for proteostasis. Representative silver-stained gel (two-sided acid) and buffer B (80% MeCN, 0.1% formic acid). Peptides were eluted with a step
unpaired t-test, n = 4). e A detailed, testable and experimentally derived gradient of 5–50% B in 87–105 min, 50–90% B in 6–10 min, with a flow rate of 300
model for the YRO. Green arrows/lines represent activation/repression, nL min−1. The HPLC system was coupled to a Q-Exactive Plus mass spectrometer
red arrows represent ATP production/stimulation of ATP production, (Thermo Scientific) with a nanospray ion source. The mass spectrometer was
operated in standard data dependent mode, performed MS full-scan at
black arrows represent predicted metabolic flux, see key for further details. 350–1600m/z range, resolution 140,000. This was followed by MS2 acquisitions of
Data are shown as mean ± SEM. Source data are provided as a Source the 15 most intense ions with a resolution of 35,000 and NCE of 32%. MS target
Data file. values of 3e6 and MS2 target values of 1e5 were used. Isolation window of
NATURE COMMUNICATIONS | (2020)11:4706 | https://doi.org/10.1038/s41467-020-18330-x | www.nature.com/naturecommunications 7ARTICLE NATURE COMMUNICATIONS | https://doi.org/10.1038/s41467-020-18330-x
precursor was set at 1.2 Da and dynamic exclusion of sequenced peptides enabled dissolve soluble protein, then clarified by centrifugation at 21,000g for 10 min.
for 40 s. Soluble and total protein concentration was measured by tryptophan fluorescence
The MSMS raw files were processed using Proteome Discoverer (v2.1, Thermo (excitation: 280 nm, emission: 325 nm) on a Spark 10M plate reader (Tecan), using
Scientific). MSMS spectra were searched against the reviewed Saccharomyces bovine serum albumin (BSA) to generate a standard curve. Variation in protein
cerevisae, UniProt Fasta database (July 2017), using Mascot (version 2.4, Matrix content was confirmed qualitatively by SDS-PAGE (Supplementary Fig. 6). Four
Science) search engine. Carbamidomethylation of cysteines was set as fixed bands containing soluble protein were excised from denaturing gels, reduced,
modification, while methionine oxidation, N-terminal acetylation (protein), alkylated and digested with trypsin, using the Janus liquid handling system (Per-
phosphorylation (STY) and TMT6plex (peptide N-terminus and lysine) as variable kinElmer, UK). The digests were subsequently analysed by LC-MS/MS on a Q-
modifications. Other parameters were precursor mass tolerance, 10 ppm and Exactive plus orbitrap mass spectrometer (Thermo Scientific, San Jose, USA). LC-
fragment mass tolerance, 0.03 Da. Only peptides with FDR of 1% based on a target MS/MS data were searched against a protein database (UniProt KB) using the
decoy approach (high confidence peptides) were included in the results. The output Mascot search engine programme57,58 (Matrix Science, UK). Proteins of the
file from Proteome Discoverer, proteins table was filtered for proteins with FDR of appropriate molecular weight (>70 kDa for band 1, 40–70 kDa for band 2, 30–40
1% and exported as Excel files. kDa for band 3 and 1.33 were clustered bonate at 98 °C for 4 h. One molar acetic acid and 0.2 M sodium acetate were added
(k means, Hartigan Wong algorithm, R version 3.3.3). The between-cluster sum of to bring the solution to pH 5.2. Glycogen was digested overnight using amy-
squares/total within cluster sum of squares was calculated for 1–10 clusters. Due to loglucosidase (10115, Sigma-Aldrich) and the glucose released measured using
the lack of inflection points in the plotted data (Supplementary Fig. 2b) we used Glucose (GO) Assay Kit (GAGO20, Sigma-Aldrich). Glucose release (mg mL−1)
two clusters for our analysis where the greatest change in cluster/total sum sum-of- was determined from a standard curve and corrected for the OD of starting
squares occurred. GO analysis was performed on each cluster independently, and, material.
when combined, using SGD GO Term Finder version 0.86 involving the process
ontology with p < 0.05 and default settings. Puromycin incorporation. Samples from the bioreactor were immediately incu-
bated with puromycin (AG Scientific, P-1033) at 8 mg mL−1 final concentration,
Ionomics. Twenty microliters cell pellets were dissolved in 550 µL 65% HNO3, 30 min, 30°C in the dark with agitation, before harvesting by centrifugation at
supplemented with 100 p.p.b. cerium, at 90 °C for 1 h, then centrifuged at 18,000g 1150g for 3 min at 4 °C. For testing the effect of an osmotic challenge, or change in
for 20 min to remove debris. The supernant was diluted 1:12 in HPLC-grade water pH, samples were first diluted into an equal volume of media containing 1%
to give a final matrix concentration of 5% HNO3. Cellular elemental composition glucose plus glycerol or sorbitol at pH 3.4, or into media of different pH, before
was determined by inductively-coupled plasma mass spectrometry (ICP-MS) on a addition of puromycin, 8 mg mL−1 final, and incubation for 20 min at 30 °C.
PerkinElmer Elan DRC II ICP-MS instrument in helium collision mode. Cerium
was used to correct for dilution errors introduced during handling, and then Western blot analysis. Yeast whole-cell extracts were prepared as described59,
normalized to sodium in buffer X. The operator was blinded to the samples, which except that disruption of the cell wall with glass beads was carried out using a
were randomised to avoid any effect of machine drift. Ion intensities were cali- Vortex Genie 2 (Scientific Industries, Bohemia, USA) fitted with a TurboMix head
brated against 10× SPS-SW2 standard (LGC), which was injected nine times during and the protein pellet resuspended in 50 μL Buffer A per OD unit of cells, with
the run. The calibration was checked for accuracy with a second multielement protease as described in ref. 7. Approximately 10 μg protein was separated by gel
standard purchased from SCP Science (Canada). electrophoresis in MES buffer on 4–12% bis-tris midi NuPAGE gels (Life Tech-
nologies) according to the manufacturer’s instructions. Proteins were transferred to
Immobilon-FL (Millipore) in Towbin buffer using a Biorad Transblot Turbo v1.02
Metabolomics. Cells were collected by centrifugation, the medium discarded and blotter set at 25 V, 1.0 A, 30 min, room temperature, stained for total protein using
the samples extracted with 200 μL 80 °C hot ethanol. Residual medium resulted in a REVERT (LI-COR) before scanning at 700 nm. Blocking was carried out in 1:1
final ethanol concentration of approximately 80%. The extract was heated for 2 min PBS:PBS blocking solution (LI-COR). After incubation with primary and sec-
at 80 °C, vigorously mixed on a vortex mixer and incubated for further 2 min at ondary antibodies, the membrane was scanned 800 nm and the results quantified
80 °C56. The extract was cleared of debris by centrifugation and stored at −80 °C using Image Studio Lite (LI-COR) or IMAGEJ60. The signal intensity of total
for subsequent analysis by liquid chromatography mass spectrometry (LC-MS). protein/lane was used for normalisation. All graphs were plotted using GraphPad
LC-MS analysis was performed on a Dionex U3000 UHPLC system coupled to Prism. Western blotting using phospho-specific antibodies was carried out using
a Q-Exactive mass spectrometer (Thermo Fisher Scientific). The liquid chemiluminescent detection of horseradish peroxidase (HRP) using TBST con-
chromatography system was fitted with a SeQuant ZIC-pHILIC column (150 × taining 0.5% milk and 0.5% BSA.
2.1 mm, 5 µm) and guard column (20 × 2.1 mm, 5 µm) from Merck Millipore. Primary antibodies: mouse monoclonal anti-puromycin (1:5000, Millipore),
The mobile phase was composed of 20 mM ammonium carbonate and 0.1% mouse monoclonal anti-GFP (1:3000, Roche), polyclonal rabbit anti-Phospho-S6
ammonium hydroxide in water (solvent A), and acetonitrile (solvent B). The flow Ribosomal Protein (Ser235/236), recognises Rps6 in yeast and is a readout for
rate was set at 200 µL min−1 with the following gradient: 0 min 80% B, 2 min 80% TORC1 activity in vivo61 (1:1000, Cell Signaling), HRP-conjugated antibodies
B, 17 min 20% B, 17.1 min 80% B, and a hold at 80% B for 5 min. Samples were (1:5000, Sigma), were detected using Luminata Forte (EMD Millipore). IR-labelled
randomized to avoid bias due to machine drift, and the operator was blind to the secondary antibodies were used at a 1:10,000. Blots were scanned on a gel doc (Bio-
key. The acquired spectra were analysed using the XCalibur Qual Browser and Rad) or Odyssey FC (LI-COR).
XCalibur Quan Browser software (Thermo Fisher Scientific) by referencing to an
internal library of compounds. Each metabolite is normalised to the total sum of
metabolites detected for each sample. ATP was measured enzymatically from cell Protein aggregation. Aggregated protein was visualised as in ref. 62: Wild type and
pellets, extracted as above, by adding 5 µL extract to 95 µL assay mix and compared gph1 cells were grown to exponential phase and ~10 OD units cells (10 A600 units)
with an ATP standard curve prepared in parallel. The assay buffer was 30 mM harvested by centrifugation. The cell pellet was washed, and resuspended in 300 µL of
HEPES pH 7.4, 10 mM β-mercaptoethanol, 1 mM potassium luciferin, 10 mM lysis buffer (50 mM potassium phosphate buffer, pH 7, 1 mM EDTA, 5% (vol/vol)
MgSO4, and 1 mg mL−1 bovine serum albumin and 10 nM QuantiLum (Promega). glycerol, 1 mM phenylmethylsulfonyl fluoride, and protease inhibitors: aminobenza-
Luminescence was monitored using a Spark 20 M plate reader (Tecan). mide dihydrochloride (200 µg mL−1), antipain(1 µg mL−1), aprotinin (1 µg mL−1),
leupeptin (1 µg mL−1), chymostatin (1 µg mL−1), PMSF (200 µg mL−1), TPCK (50
µg mL−1), and pepstatin (1 µg mL−1), all from Sigma-Aldrich). The cells were lysed
Soluble protein. Total protein extraction is described above. Soluble proteins were by freezing and thawing followed by incubation (30 °C for 30 min) with 100 µL of
those that dissolved in reducing denaturing buffer following ethanol precipitation, as lyticase (9830 U mL−1) (Sigma-Aldrich). Cells were disrupted with glass beads at 4 °C
follows: 20 µL cell pellets were washed twice in 1 mL ice-cold buffer X, then treated using a Vortex Genie 2 (Scientific Industries, Bohemia, USA) fitted with a TurboMix
with 200 μL 80 °C hot ethanol. The extract was heated for 2 min at 80 °C, vigorously head. Intact cells were removed by centrifugation at 3000g for 15 min. The membrane
mixed on a vortex mixer and incubated for further 2 min at 80 °C. The extract was and aggregated proteins were isolated by centrifugation at 15,000g for 20 min.
clarified by centrifugation, the supernatant removed and the residual pellet washed Membrane proteins were removed by washing twice with 320 µL of lysis buffer and
three times in 1 mL 100% ethanol before being air-dried overnight at room tem- 80 µL 10% Igepal CA-630 (NP-40) (Sigma-Aldrich) and centrifuging at 15,000g for
perature. The dried pellet was resuspended in 200 µL of 8 M urea, 2 M thiourea, 4% 20 min each time. The final aggregated protein extract was resuspended in 100 µL of
CHAPS, 10 mM TCEP and incubated at 37 °C with shaking at 400 r.p.m. for 2 h to lysis buffer and analysed by SDS-PAGE. Proteins were visualised by silver staining
8 NATURE COMMUNICATIONS | (2020)11:4706 | https://doi.org/10.1038/s41467-020-18330-x | www.nature.com/naturecommunicationsNATURE COMMUNICATIONS | https://doi.org/10.1038/s41467-020-18330-x ARTICLE
using the Silver Quest Kit (Invitrogen) and images captured using a Perfection V600 recircularising. The BamHI–XhoI fragment from pRS306-PTEF1CBR64 containing
Photo scanner (Epson). ImageJ was used to obtain the background corrected signal the TEF1 promoter, CBR luciferase, and ADH1 terminator was transferred to the
intensity per lane60. pRS306ΔXbaI plasmid to produce pRS306-PTEF1CBRΔXba. The luc2 CDS was
PCR amplified from pGL4.20 using primers: 5′-actactAGATCTATGGAAGATG
CCAAAAACATTA-3′, 5′-actacgTCTAGATTATTTTTCGAACTGCGGGT-3′
Flow cytometry. Propidium iodide labelling: 1.5 mL cells (OD 7 to 8) undergoing
adding a BglII and XbaI site upstream and downstream of the start and stop codons
oscillations in 1.5 L culture were harvested from the bioreactor (4 biological
respectively. Finally, the luc2 PCR product was added to pRS306-PTEF1CBRΔXba
replicates). Aliquots containing ~107 cells were washed in water, resuspended in
with BglII and XbaI (replacing the CBR luciferase CDS) and generating pRS306-
500 µL 70% ethanol and stored at 4 °C until use. Samples were harvested by cen-
PTEF1luc2, an integrating plasmid for constitutive luc2 expression. pRS306-
trifugation at 3381g, 4 °C for 10 min. Cell pellets were resuspended in 250 µL Tris
PTEF1luc2 was linearized with EcoRV and transformed into yBR-ura3ΔCEN.
buffer pH 7.4 (50 mM) containing RNase A (200 µg mL−1) and incubated at 37 °C
PK113-7D68, creating strain yBR-PTEF1luc2.
for 3 h. RNAse-treated cells were harvested by centrifugation at 9391g for 5 min
A nourseothricin selectable bioluminescent pH reporter was made by putting
and pellets resuspended in 500 µL sodium citrate (50 mM, pH 7.0) before soni-
the BamHI–SalI fragment from pRS306-PTEF1luc2 (containing the TEF1
cation to break up clumps of cells. The volume of sonicated cells was brought up to
promoter, luc2 luciferase, and ADH1 terminator) into pRS304-Nat64 creating
500 µL with sodium citrate (50 mM, pH 7.0) containing propidium iodide (Sigma
pRS304Nat- PTEF1luc2. This plasmid was linearized with EcoRV and integrated
P4170), to give a final concentration of 12.5 µg mL−1 and approximately 105 cells
into the native TRP1 gene of strain HYC1602.
mL−1. Tubes were put in the dark at 4 °C before processing. Flow cytometry was
carried out at the CCTI Flow Cytometry Core on a FACS Canto II (Becton
Dickinson). Analysis was performed using the FCS Express density plot function, Yeast strains. All strains are isogenic Mata haploids in the CEN.PK113-7D
with the gates shown in Supplementary Fig. 1. background unless stated.
HCY1514 prototrophic wild type
HCY1602 HSP30::KanMX
Ratiometric bioluminescence monitoring of pHic across the YRO. YROs were HCY1648 GPH1::KanMX
established in strains with a stably transformed bioluminescent pH reporter plas- HCY1674 GSY2::KanMX
mid (either pRS306-PTEF1luc2 or pRS304Nat- PTEF1luc2), 850 mL culture in a 3 HCY1325 Mata/Matα
L BioFlo 115 benchtop fermentor (New Brunswick) with pH 3.4, 54 L h−1 air, 550 HCY1689 to HCY1691 Mata/Matα PGK1/PGK1-GFP-KanMX
r.p.m., and an initial dilution rate of 0.08 h−1 (ref. 63). Luminescence was con- HCY1800 Mata yBR-PTEF1luc2
tinuously recorded using two Hamamatsu PMTs (HC135-01)64; however, the HCY1803 Mata BR-PTEF1luc2 HSP30::KanMX
PMTs were fitted with 550 ± 5 and 610 ± 5-nm band pass filters (65704 and 65709; HCY1820 Mata ura3Δ0 [pRP1657 Pab1-GFP Edc3-mCherry]69
Edmund Optics). Gene inactivation was carried out by amplification of the KanMX antibiotic
After monitoring luminescence from the YRO (as above), continuous culture resistance cassette from either the pFA6 plasmid65, or a deletion strain from the
was terminated and luminescence ratio data generated. The pH of the culture was Research Genetics Deletion Collection using their A and D primers and integrated
adjusted to 5.8 by addition of 2 M NaOH. Beetle luciferin (Promega), 5 µM final into the genome of a CEN.PK strain. The location of the cassette was confirmed by
concentration, and carbonyl cyanide m-chlorophenyl hydrazone (CCCP, Promega) PCR and/or sequencing.
was added (1.18 µM final). The culture was incubated for 4 h. The pH was
increased stepwise by 0.2 by addition of 2 M NaOH every 15 min covering a pH
range 5.8–8.2. Bioluminescence at 550 and 610 nm was continuously monitored Reporting summary. Further information on research design is available in the Nature
as above. Research Reporting Summary linked to this article.
Confocal microscopy. Samples from the bioreactor were incubated in the dark Data availability
with 7-amino-4-chloromethylcoumarin (CMAC, LifeTech C2110) 20 µM (final), Proteomic data that support the findings of this study have been deposited in the
30 °C, 10 min with agitation. Cells were washed 1× in media without glucose before ProteomeXchange Consortium via the PRIDE partner repository with the identifier
imaging. All microscopy was carried out using an Axioskop2 (Zeiss) equipped with PXD013653. Other data that support the findings of this study are available from the
a ×100/1.4 Plan-Apochromat objective, Orca ER cooled charge-coupled device corresponding authors upon reasonable request. Source data are provided with
(CCD) camera (Hamamatsu) and pE-4000 CoolLED light source at 405 nm, 200 this paper.
ms for CMAC and 470 nm, 250 ms for GFP (21 image z stack at 0.3 μm). Images
were deconvolved using iterative restoration and analysed using Volocity 5.3 and
6.5 (PerkinElmer) using default settings. Received: 5 May 2020; Accepted: 13 August 2020;
Survival after heat stress. Samples from the bioreactor were divided into two
aliquots. One hundred and fifty microlitres was incubated at 55 °C for 2 min before
serial dilution in media without glucose. The other was diluted in parallel and
plated directly (untreated control). The number of colonies/plate was counted after
2 days at 30 °C (median cells per plate 279) and number of colonies on heat-treated References
vs. non-treated samples expressed as a percentage. 1. Lloyd, D. Respiratory oscillations in yeasts. Adv. Exp. Med. Biol. 641, 118–140
(2008).
Osmotic challenge. Potassium chloride (3 M in media without glucose) was added 2. Cai, L. & Tu, B. P. Driving the cell cycle through metabolism. Annu Rev. Cell
to 200 mM final concentration. Sodium chloride (s), to 1 M final concentration, Dev. Biol. 28, 59–87 (2012).
was added directly to cells in the bioreactor. 3. Beuse, M., Bartling, R., Kopmann, A., Diekmann, H. & Thoma, M. Effect of
the dilution rate on the mode of oscillation in continuous cultures of
Saccharomyces cerevisiae. J. Biotechnol. 61, 15–31 (1998).
Statistics. Unless otherwise stated, statistical analyses were performed using Prism
4. Causton, H. C. Metabolic Rhythms: a framework for coordinating cellular
8 (Graphpad). Grubbs’ method for outlier detection was employed with p = 0.0001
function. Eur. J. Neurosci., https://doi.org/10.1111/ejn.14296 (2018).
for every species detected by ICP-MS and LC-MS, and found a single consistent
5. Mellor, J. The molecular basis of metabolic cycles and their relationship to
outlier (replicate 1, time point 5, dilution rate 0.06 h−1) with values that were
erroneously high. This was excluded from subsequent analysis. circadian rhythms. Nat. Struct. Mol. Biol. 23, 1035–1044 (2016).
6. Burnetti, A. J., Aydin, M. & Buchler, N. E. Cell cycle start is coupled to entry
into the yeast metabolic cycle across diverse strains and growth rates. Mol.
Reporter for autophagy. Pgk1/Pgk1-GFP-KanMX strains were made by ampli- Biol. Cell 27, 64–74 (2016).
fication of the GFP-KanMX cassette from pFA6 plasmid65 using primers: 7. Causton, H. C., Feeney, K. A., Ziegler, C. A. & O’Neill, J. S. Metabolic cycles in
5′-TAAGGAATTGCCAGGTGTTGCTTTCTTATCCGAAAAGAAACG yeast share features conserved among circadian rhythms. Curr. Biol. 25,
GATCCCCGGGTTAATTAA-3′ 1056–1062 (2015).
5′-CTTAAAATACGCTGAACCCGAACATAGAAATATCGAATGGGAATT 8. Klevecz, R. R., Bolen, J., Forrest, G. & Murray, D. B. A genomewide oscillation
CGAGCTCGTTTAAAC-3′ generating an amplicon containing the end of PGK1, a in transcription gates DNA replication and cell cycle. Proc. Natl Acad. Sci.
4 amino acid spacer, GFP, KanMX and the 3′ UTR of PGK1. This was integrated USA 101, 1200–1205 (2004).
into the genome of diploid CEN.PK at a single locus. Cleavage of Pgk1-GFP fusion 9. Tu, B. P., Kudlicki, A., Rowicka, M. & McKnight, S. L. Logic of the yeast
protein by non-selective bulk autophagy can be detected by western blotting66. metabolic cycle: temporal compartmentalization of cellular processes. Science
310, 1152–1158 (2005).
Construction of strain with bioluminescent pHic reporter. pRS306ΔXbaI was 10. Xu, Z. & Tsurugi, K. A potential mechanism of energy-metabolism oscillation
created by removing the XbaI site in pRS306 (ref. 67) by digesting the plasmid with in an aerobic chemostat culture of the yeast Saccharomyces cerevisiae. FEBS J.
XbaI, treating the digested product with DNA polymerase I large fragment and 273, 1696–1709 (2006).
NATURE COMMUNICATIONS | (2020)11:4706 | https://doi.org/10.1038/s41467-020-18330-x | www.nature.com/naturecommunications 9You can also read