Semantics, Classifications and Evidence in a Model for Global Catastrophic Risks
←
→
Page content transcription
If your browser does not render page correctly, please read the page content below
438 Knowl. Org. 38(2011)No.5
K. S. Søilen and P. B. Alipour. Semantics, Classifications and Evidence in a Model for Global Catastrophic Risks
Semantics, Classifications
and Evidence in a Model
for Global Catastrophic Risks
Klaus Solberg Søilen* and Philip Baback Alipour**
*Department of Management, School of Management,
Blekinge Institute of Technology, SE-371 79 Karlskrona, Sweden,
**Department of Computer Science, School of Computing,
Blekinge Institute of Technology, SE-371 79 Karlskrona, Sweden,
Klaus Solberg Søilen is an Assistant Professor at the School of Management (MAM), Blekinge Institute
of Technology, Sweden. His research emphasis is Competitive Intelligence, Business Intelligence, and
Evolutionary Economics. He has written numerous articles in international journals within the field of
Intelligence Studies and published two books; the last one Market Intelligence (Copenhagen Business
School Press, 2009) was translated into Chinese in 2010 (CEIBS Press). Prior to his academic career, he
worked in the USA, France and Scandinavia, the last 3 as auditor for KPMG.
Philip Baback Alipour received his B.Sc. (Hons) degree in Computing, Software Development, Hull
School of Computing, University of Lincoln, UK in 2005. He completed his M.Sc. thesis in Computer
Science and Software Engineering at Blekinge Institute of Technology, Sweden, in May 2010. He has
published papers and a scientific book on a Grand Unifying Equation within the norms of Theoretical
Physics, Mathematics, and Computing (2007). He has also been awarded as a “Top Referee” from the
journal Proceedings of Royal Society A: Mathematical, Physical and Engineering Sciences (UK) (2009).
Søilen, Klaus Solberg and Alipour, Philip Baback. Semantics, Classifications and Evidence in a Model
for Global Catastrophic Risks. Knowledge Organization, 38(5), 438-454. 30 references.
ABSTRACT: Life on the surface of the Earth is fragile and can be deteriorated by outside influence,
from nature, or inside influence, from humans. We present a macro perspective for the nation state as a
knowledge discourse system. To detect what might happen, a surveillance model needs to classify
emerging risks prior to occurrence. The state intelligence model presented here helps survey potential macro factors. During risk
analysis, a set of risk classification criteria was devised for linking inside and outside influence trigger points that can indicate ex-
istential catastrophes. The analysis is based on a classification of current risks rather than distant future potential risks. Each is
measured according to its respective impact, and whether or not it is highly probable to occur or recur in the surveillance system.
The inside influence is found most probable with a probability of P 0.4 compared to outside influence with a probability of P
0.28. The State Intelligence Surveillance Analysis Model presented here consists of an 8-by-8 risk matrix or, a 16 risk table with a
computable 20.92 trillion risk combinations per second. The relationships between inside and outside influences have been stud-
ied and grouped into classification schemes, where it is imagined that one may trigger the other, and by chance, acting autono-
mously for any type of catastrophe. The current study gives more focus and awareness to classifiers and the problem of which
surveillance components to detect, thereby improving simulations, being well aware that the exact calculations for catastrophes
are impossible.
Received 16 March 2011; revised 20 June 2011; accepted 20 June 2011.
https://doi.org/10.5771/0943-7444-2011-5-438
Generiert durch IP '46.4.80.155', am 19.02.2021, 05:22:23.
Das Erstellen und Weitergeben von Kopien dieses PDFs ist nicht zulässig.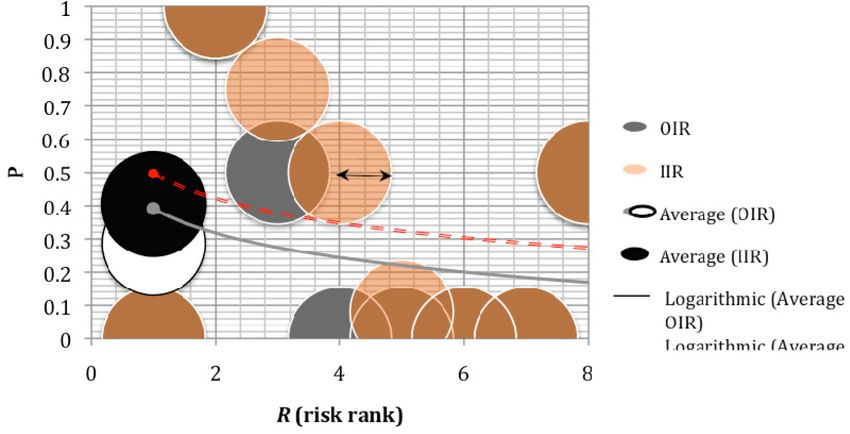
Knowl. Org. 38(2011)No.5                                                                                                               439
K. S. Søilen and P. B. Alipour. Semantics, Classifications and Evidence in a Model for Global Catastrophic Risks

1.0 Introduction                                                                could present that sole focus through a new classifica-
                                                                                tion scheme, in form of a knowledge model. This is
1.1 “Knowledge organization” in risk analysis                                   obtained by using relevant scientific tools to estimate
                                                                                the probability against certainty of the objectivity and
The aim of this study is to bring greater clarity or                            subjectivity of the problem. Therefore, by firstly de-
knowledge around the classification and computation                             fining the problem, then using the right and relevant
of potential risks to the planet as studied by the Na-                          information, on a “need-to-know rather than nice-to-
tion State as a knowledge discourse system. Dahlberg                            know basis” (Solberg Søilen 2005, 38), enables a clas-
(2006, 12) defines “knowledge” as a certain “existen-                           sifier in the system, to classify its probable risks,
tiality of a fact or a matter,” which later conveys to                          thereby surveying them with the right tools. For ex-
the “existentiality of a risk attached to it” where hu-                         ample, proper archiving, organizing relevant informa-
man subjects are involved (Bostrom and Ćircović                                 tion for specific information search, or efficient
2008, 2-4). Prior to the following definition about                             means of information retrieval (IR) (Hjørland 2008,
“knowledge,” the notion of “existentiality” becomes                             Xu and Bernard 2009) from the risk factor, simulating
clear in context (Dahlberg 2006, 12):                                           problem scenarios and its outcomes for that factor by
                                                                                a computer algorithm, could be said to be a part of
   Knowledge is the subjectively and objectively                                our knowledge organizing system and processes
   fairly well-founded certainty of somebody about                              (KOS and KOP). In return, our knowledge domain is
   the existence of a fact or a matter. This knowl-                             expanded to include similar problems as they get de-
   edge is not transferable; it can only be elaborated                          fined one-by-one using the same knowledge model.
   by somebody’s own personal reflection.
                                                                                1.2 Problem definition
Although by this definition, ‘knowledge’ is always but
the knowledge of some thing, which might be a body,                             Business Intelligence (BI) models are typically made
we do know, have the experience and certainty about                             to survey the company’s micro environment, that is
this fact, that it can yet be shared via our ability to deal                    the variables the company can influence (Solberg
with the ‘things of this world’, and by using our lin-                          Søilen, 2005). Larger companies also have the re-
guistic abilities to express our experience and insights                        sources to spend on the surveillance of macro factors
(Dahlberg 2006). In this paper the aim is to identify                           affecting their business, but are far less concerned
the “existentiality of a risk” (Bostrom and Ćircović                            with major risks to the planet even though these are
2008, 3) with a factual probability of occurrence re-                           real risks also to businesses. Instead, this is thought to
lated to “things” and “every living person” on Earth.                           be the responsibility of Nation States. The affecting
To identify a risk, the classification of knowledge be-                         factors in the current problem are defined as follows:
ing spread through the problem’s past (records), out-                           Life on the surface of the Earth is very fragile. It can
lines “the subjectivity and objectivity” (Dahlberg                              be deteriorated by outside influence, either from outer
2006, 12) of the problem per se. Moreover, benefiting                           space or from under the Earth’s surface, and inside in-
from the same specific definition above, “knowledge                             fluence (primarily, human effects, Bostrom and Ćir-
as a fairly well-founded certainty,” to one could be,                           cović 2008). There is a need for a model concept that
“the existence of a fact or a matter,” as quite visible or                      can help survey all potential factors. In this paper, the
least distant to occur, and can be elaborated by one’s                          layout of these risks is based on a set of classification
“own personal reflection.”                                                      criteria after defining the problem, the methods in use
    In this paper, dramatic probabilistic scenarios                             and a model for the organization. The obtained
based on research, are collated and sorted using scien-                         knowledge in the surveillance model is organized in
tific tools (Osińska and Bala 2010) to index relevant                           such a way as to study uncertainties vs. certainties,
information in a focused manner. One could conceive                             with respect to time and other risk dimensions for
this task as an experience-based system in form of a                            each probability impact. The evaluation of each risk is
simulation validating our knowledge about the prob-                             done after calculating each probability . From there,
lem. A structural-based knowledge organization                                  the most influential and visible risk is identified, as the
(Gnoli 2008) is useful in putting different disciplines                         least distant for one to experience, by mathematical
involved in the same problem set, all entangled with                            calculations relevant to the risk variable. For example,
risks. From a scientific, political, economic, social,                          a person crossing the road, seeing a car approaching
and environmentally-hazardous perspective, one                                  becomes relatively visible, and the more visible, the

                                                    https://doi.org/10.5771/0943-7444-2011-5-438
                                             Generiert durch IP '46.4.80.155', am 19.02.2021, 05:22:23.
                                      Das Erstellen und Weitergeben von Kopien dieses PDFs ist nicht zulässig.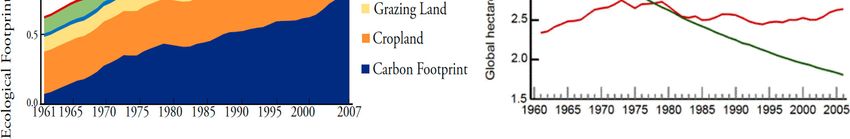
440                                                                                                  Knowl. Org. 38(2011)No.5
                K. S. Søilen and P. B. Alipour. Semantics, Classifications and Evidence in a Model for Global Catastrophic Risks

higher probability of relative to the risk taken to                            turn, the        quantity is more readable and compliant
collide with the car. The visibility factor is the main                        to its predecessor         , if predicted correctly before
focus of this study in calculating ’s relative to the                          any further updates. The longer into the future an
problem for the organization. The organization must                            event occurs, or                 , the less probability of
give the risk taker a prediction factor using a reliable                       predicting it, since more speculative variables must be
knowledge model about the problem. In the given ex-                            coupled with historical accounts, assuming all have
ample, this is simply defined when the car is visible                          been reliably reported in our analysis (see also, Solberg
enough to the person (risk taker) to get off the car’s                         Søilen 2005, 56-61). Therefore, the current study aims
path, avoiding collision. On a global scale, one may                           to formulate this focus based on the events that are
class the risk taker as a nation, company, government,                         visible, and quantify as high as 1.0, and as low as 0 in
etc.                                                                           the study’s risk classification. In fact, the emphasis is
                                                                               on the currently-obvious accounts parallel to the in-
1.3 Problem organization                                                       coming flow of new information that form a steady-
                                                                               state of our knowledge in predicting future events with
For the taxonomy and organization over risks, one                              the same high and low ’s. The boundary of this
should establish a database system with an efficient                           knowledge, as usual, is drawn between tacit knowledge
architecture. This is done by managing inherited                               and explicit knowledge, where the focus should readily
knowledge that surveys and detects the explicit influ-                         contain the explicit knowledge from current informa-
ences against the hidden ones to real-time observa-                            tion which strongly connects it to hidden risks. This
tions on the planet. The focus is to derive predictions                        forms a predictable pattern based on the explicit type.
from the explicit type (highly visible) in the surveil-                        However, “there is no absolute boarder between these
lance model’s algorithm. This approach is compared                             two kinds of knowledge” (Xu and Bernard 2009, 233),
with other studies like Osińska and Bala (2010), to                            where the surveillance model depend on, and there
measure up our model for its knowledge organization                            could be an act of coincidence from unknown risks
as well as predictability based on probability . This is                       which come from an unexpected flow of new informa-
identifiable as follows.                                                       tion. In the present model, however, the coincident
                                                                               probability is stressed upon where a visible or explicit
1.4 What’s our ?                                                                   triggers another visible or explicit     according to
                                                                               current piece of information coupled with strong his-
  Economists like to make people assign quantita-                              torical accounts. It is scientific-based data rather than
  tive probabilities to risks. ‘What’s your of ?’                              speculative reports. For instance, a report of a pro-
  we often ask, meaning ‘what probability do you                               phetic type with almost none or very few accounts of
  assign to     happening?’ The point is not that                              what could have happened or not in the past, as well as
  anyone has the definitive numbers. The point is                              future claims with no evidence, is strongly avoided
  rather that explicit probabilities clarify debate, and                       when forming the surveillance system. Such ’s that
  impose discipline on how beliefs should change as                            could trigger or coincide with other factual ’s hap-
  new evidence emerges (Tetlock, 2005). A person                               pening in parallel is what defines the study’s risk classi-
  says that two risks are both ‘serious’, it is unclear                        fication in terms of low vs. high hazard relative to its
  why he assigns a probability of 2% to one and                                interval [0, 1]. For example, a nuclear disaster could
  0.1% to another. Similarly, if a person says that                            definitely trigger an exclusion zone for a certain human
  the probability of an event is 2%, and relevant                              population and any living being for a long time period,
  new information arrives, consistency requires him                            i.e., the ecological negative effect in that zone, and is
  to revise his probability. How seriously do we                               the product of this disaster in evidence (e.g., Ivanov et
  take the possibility that a world totalitarian gov-                          al., 2009). In this case, one explicit triggered another
  ernment will emerge during the next 1000 years                                 , whereas the latter could have been influenced by
  and last for 1000 years or more? – Bostrom and                               some outside risk, like an asteroid hit upon a competi-
  Ćircović (2008, 516-17).                                                     tion of other risks.

Despite the complexity and guesswork inherent in an-                           1.5 Report structure
swering this question, the foci of our is conditional,
given all the information, the output remains explicit.                        The report is structured as follows: Section 2 outlines
Meaning that, visible risks as events get updated, and in                      the surveillance method; Section 3 outlines the objec-

                                                   https://doi.org/10.5771/0943-7444-2011-5-438
                                            Generiert durch IP '46.4.80.155', am 19.02.2021, 05:22:23.
                                     Das Erstellen und Weitergeben von Kopien dieses PDFs ist nicht zulässig.
Knowl. Org. 38(2011)No.5                                                                                                                441
K. S. Søilen and P. B. Alipour. Semantics, Classifications and Evidence in a Model for Global Catastrophic Risks

tives to present the taxonomy and organization for                                  curs, whereas this risk is classified as a high risk,
the risk classification presented in the later sections;                            such that the event before its close impact, is
the taxonomy, organization; Section 4 delivers the                                  subject to immediate actions beforehand.
surveillance matrix, its components, and risk classifi-
cation based on a summary of mathematical results                               This definition is mapped to worst-case scenarios
deduced for each risk factor; Section 5 focuses on re-                          with either high or low probability risk, but with less
lated studies as compared, and gives probability cal-                           or almost no scientific proof, or substantially a re-
culations, detailed data and charts; Section 6 outlines                         cently experienced issue or observation available in
the SISAM knowledge organization and a simulation                               databases (DBs). For example, a scientifically-based
proposal to survey risks; Section 7 provides discus-                            statement, hypothesis or a mathematical predicate
sions on the mostly-linked variable amongst risks as a                          representing: an asteroid with a size of 15 kilometers
priority deemed to be the responsibility of Nation                              has hit the planet 65 million years ago, and about to
States; Sections 8-9 conclude this report with future                           occur again shortly, conveys to the definition above.
work and studies.                                                               On the other hand, scenarios like nuclear disasters,
                                                                                large-scale earthquakes, Tsunamis, etc. are the most
2.0 Methodology                                                                 evident, since they have been experienced and yet
                                                                                their large scale version would likely to occur in a
2.1 Surveillance method: a detection to the most visible                        near future. A major asteroid hit changing the face of
    scenarios as global catastrophic risks                                      the planet, nuclear disaster, mass virus attacks, involv-
                                                                                ing all humans, etc. is always our concern, as informa-
Our surveillance method is developed by referring to                            tion and the number of intelligent decisions grow.
scientific work such as Mastrandrea and Schneider
(2004), Matheny (2007), Ewing et al. (2010), Pagli and                          3.0 Taxonomy and Organization
Sigmundsson (2008), Grossi et al. (2008), Solberg
Søilen (2005), and documentaries like “Humanity’s                               Let us look more closely at what would, and would
last days” by Sjöström et al. (2010), and those relevant                        not, count as a global catastrophic risk. “Recall that,
issues that threaten our survival on planet Earth (exis-                        the damage must be serious, and the scale is global.
tentiality) from Bostrom and Ćircović (2008), as well                           Given this, a catastrophe that caused 10,000 fatalities
as future facts and probability of occurrence. This                             or 10 billion dollar worth of economic damage (e.g.,
probability is measured in terms of probability factor                          influenza pandemic) would count as a global catas-
  , equal to a value between 0 and 1, on an avoidable                           trophe, even if some region of the world escaped un-
versus unavoidable scale. What is meant with “avoid-                            scratched” (Bostrom and Ćircović 2008, 2). There-
able,” hereon, is an indication of what constitutes a                           fore, we class hazardous events of this type propor-
risk factor, saying that:                                                       tional to probability calculated per region, as a valid
                                                                                measurement, or beyond the region of a global scale.
   Definition 1. The risk is now avoidable once de-                                In summary, the most important issues were gath-
   tected according to the priority of risks, or, the                           ered as deducible facts based on currently available
   degree of risk with respect to time as defined in                            and past information (historical), and calculated each
   its values for the model’s surveillance system.                              probability with a level of concern using concept in
                                                                                Figure 1 for each scenario. The “level of concern”
A similar definition by Knight (1971) broadens the                              here, associates a risk factor of which,     (in Figure
latter as the major part of an Intelligence function for                        1) indicates beyond life-based entities and monetary
a business organization, defining a risk as an event                            compensations within the environment’s atmosphere,
which the company can assure itself against if it is de-                        and       or            risk from the same figure, indi-
tected, while the company cannot assure itself against                          cates that, survival is possible under compensable cir-
uncertainty. Uncertainties are events the company has                           cumstances in due course after the event. The con-
to live with. To this account, an “unavoidable,” or in                          cern level is given in our thorough analysis section 5,
behavior uncontrollable or irreversible by man,                                 relative to surveillance costs per person in section 6.
hereon would be:                                                                Figure 1 is highly three-dimensional when one risk is
                                                                                analyzed per se, and is multi-dimensional when a risk
   Definition 2. Is neither possible to avoid the                               is antecedent to other consequent risks (one trigger-
   risk once detected, nor controlled when it oc-                               ing another). The hazardous and probability variables

                                                    https://doi.org/10.5771/0943-7444-2011-5-438
                                             Generiert durch IP '46.4.80.155', am 19.02.2021, 05:22:23.
                                      Das Erstellen und Weitergeben von Kopien dieses PDFs ist nicht zulässig.
442                                                                                                   Knowl. Org. 38(2011)No.5
                 K. S. Søilen and P. B. Alipour. Semantics, Classifications and Evidence in a Model for Global Catastrophic Risks

            Figure 1. Qualitative categories of risk with impact probability and hazard scale. This is a simplified ad-
                       aptation of Figure 1.1, (three-dimensional) by Bostrom and Ćircović (2008, 3). The current
                       figure, however, leads to -dimensional antecedents along the probability dimension.

constitute the risk scale (cosmic?) as well as intensity                        our surveillance components responding to the prior-
(hellish?) relative to the scale of impact. This builds                         ity of the risk relative to its degree of impact.
up the level of concern of every human being living
on this planet.                                                                 4.0 Risk classification and deductions
   In this paper, after introducing these concerns and                              to our Surveillance Components
probabilistic scenarios based on old and current facts,
a reliable futurology concept (next paragraph) is de-                           The specific calculations of the disasters are simpli-
duced for the most controllable scenario at hand, tak-                          fied from our findings in Table 2, data and charts
ing a BI action from a macro level to all business op-                          (section 5), and summarized in Table 1. We may,
erating organizations (Solberg Søilen, 2005). Some-                             however, consider Table 1 as the summary or deduc-
thing controllable by man should not need to lead to                            tion table of the specific calculations satisfying the
something bad or catastrophic if we can stop it.                                following criteria:

3.1 The empirical objectives                                                    1. Outside/inside risks are ranked according to prob-
                                                                                   ability rank = 1, 2, 3, …, , so if asteroids for
We empirically determine potential factors through                                 outside influence is the biggest risk i.e. highly
deducing statements or results from facts and re-                                  probable to occur or with a great , and quite visi-
searched excerpts, formulating our past, detecting                                 ble with a huge impact, then they will appear in the
which variable is the most connected to others as                                  first line. This probability, however, is focused on
source or cause of a potential disaster. Then, event re-                           priority (not of hidden or unknown risk type) as if
lationships are deduced as current and near-future ef-                             saying, the most threatening version compared to
fects, using a BI decision model to finalize a decision                            others, is thus surveyed.
point on how to classify and prioritize by time (see                            2. The 1-to- probability from criterion #1 is de-
the time horizon of an unexpected factor model as                                  duced based on the percentile version or scientific
defined by Frankelius, in Solberg Søilen 2005) with                                notation of probability , ranged between 0 and 1
the most effective risk(s) with a certain cost to con-                             for the degree of risk (Figure 1).
duct the survey per human. The cost is based on the                             3. By definition, surveillance responds not to how to
most highly accruable (here, increases in risk growth),                            solve the problem, but how to detect it. According
and most likely to occur even bearing a negative trend                             to this criterion, we detect the most risky one(s)
in mind. Primarily, the surveillance cost is calculated                            within the domain of inside influence and outside
by referring to the version presented by Matheny                                   influence classification, based on the gathered in-
(2007) in aim of reducing the risk of human extinc-                                formation and intelligence reports from across the
tion. Once outlined in an orderly manner this defines

                                                    https://doi.org/10.5771/0943-7444-2011-5-438
                                             Generiert durch IP '46.4.80.155', am 19.02.2021, 05:22:23.
                                      Das Erstellen und Weitergeben von Kopien dieses PDFs ist nicht zulässig.
Knowl. Org. 38(2011)No.5                                                                                                             443
K. S. Søilen and P. B. Alipour. Semantics, Classifications and Evidence in a Model for Global Catastrophic Risks

   globe (e.g., reliable databases, research notes,                             and via probability analysis techniques, publish the new
   demographics, documentaries and historical data).                            SISAM results to the network (section 6).
4. We thus make changes relative to these influences
   based on the deduced values on risk from the re-                             5.0 Data and Charts
   cords stated in criterion # 3. The great is built
   on a Population Mean of ’s from section 4.1.                                 5.1 Disaster-related issues, potential variables,
   Each represents a specific event, a risk-builder as                              analysis and deductions
   a contributor to a final risk with probability ,
   known as a trigger-point between one final and                               Concern level: Let the level of concern be high or 5
   another when concurrent ’s come “visible” (sec-                              per disaster, and a gradual state leading to a disaster,
   tion 1.2).                                                                   scaled between 2 and 4. This disaster would read in
                                                                                terms of human life destruction relative to its level of
The current risk classification is organized by linking                         concern. This could be, for example, a climate change
some of the risks to others, in terms of cataclysmic                            dangerous concern (later shown as issue # 4 relative
trigger points or contributors for a robust surveil-                            to CO2 emissions, in Table 2). For instance, the Inter-
lance i.e., an interrelated inside and/or outside influ-                        governmental Panel on Climate Change (IPCC) Rea-
ence. This is shown in Table 1.                                                 sons for Concern as dangerous anthropogenic inter-
   In some cases, e.g., row # 2 to 5, an inside influ-                          ference (DAI), is classed as a global impact (Figure 1).
ence risk (IIR) could also trigger a process (sequence                          The DAI is explicitly measured by Mastrandrea and
of events) of an outside influence type as a cataclysm,                         Schneider (2004), and reported as an organizational
quite relevant to the definition given of it as “some-                          and structural concern attribute. This attribute de-
thing which sets off a sudden and violent change, or                            notes our survival rate which relies on the atmosphere,
here triggers a process,” (Solberg Søilen 2005, 80).                            subsequent to the sustainability ratio changes we have
This implies that the outside influence cause more                              made to the way we consume natural resources. From
outside influence events as denoted by the OIR                                  these measurements, one derives the probability based
predecessor (–) against OIR successor (+) trends in                             on the DAI graphs as well as other factors and hy-
Table 1. The “predecessors” here, convey to the onto-                           potheses from reports indicating disaster-related is-
logical identification or inherence of risks in values,                         sues gathered in Table 2. For example, melting glaciers
prior to just phrases or expressions of the IIR or OIR                          develop other forces to spur quakes and volcanoes
risks. Being of “pluralistic nature” (Gnoli 2008, 140),                         (NASA 2004, Carolina and Sigmundsson 2008), later
pluralizing all of the possibly visible risks, acknowl-                         known as issue # 4, triggering #2, in the same table.
edges the notion of trigger-points between risks, acti-                             Table 2 attributes and calculations: In Table 2, cer-
vating one after another. Based on criterion #4, this                           tain particulars are reaffirmed as issues experienced
builds up the as a summary impact or an average                                 by humans on Earth, and a catastrophic version of it,
point , for all ’s, thus:                                                       either occurred way back before man, or centuries
                                                                                ago, or on the yet-to-happen basis. This is indicated
                                                                                by the “occurred event” column in Table 2. The issue
                                                                                is linked as a global type and/or with smaller scales to
This indicates the plurality of ’s into the KOS as the                          other issues, in the “Causes issue or the co-link-to
result of the KOP, in conducting our SISAM func-                                column” in Table 2. For instance, based on our deduc-
tions. Those IIRs that have nothing to do with an                               tions from Carolina and Sigmundsson (2008), we
OIR, shall remain limited to surveying budgetary re-                            conclude that, as # 4 frequently occurs to a rising
ports on reducing human risks from the outside in-                              scale, e.g., glaciers and icecaps melting on the plane-
fluence. In this case, row # 6 to 8.                                            tary surface, the more likely is a seismic rise occur-
   The budgetary risk reduction costs per human,                                rence. The latter indicates a set of newcomer large-
(avoiding extinction), is well-computed and hypothe-                            scale earthquakes, and eventually a trigger to a super-
sized by Matheny (2007) using cost-effectiveness analy-                         volcanic eruption. Other particulars like multiple
sis. The present surveillance cost per human is derived                         large-scale hurricanes and tsunamis represented by #
in detecting all risks in much smaller proportions. A col-                      7, could also be linked to # 4, which is directly linked
lective report of the specific risks in the analysis charts                     to # 5 as the core of the current problem. So:
and tables (section 5), is to focus the incoming data
from globally positioned real-time surveillance units,

                                                    https://doi.org/10.5771/0943-7444-2011-5-438
                                             Generiert durch IP '46.4.80.155', am 19.02.2021, 05:22:23.
                                      Das Erstellen und Weitergeben von Kopien dieses PDFs ist nicht zulässig.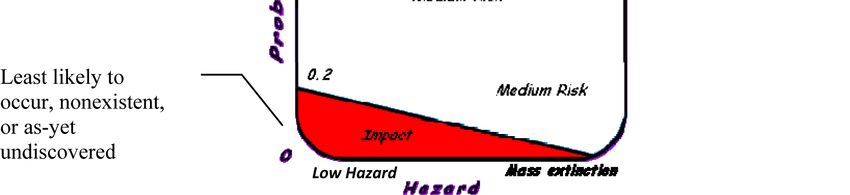
444 Knowl. Org. 38(2011)No.5
K. S. Søilen and P. B. Alipour. Semantics, Classifications and Evidence in a Model for Global Catastrophic Risks
Surveillance/ Outside Influence Inside Influence
Risks
Risks Surveillance Risks Surveillance
1 All the risks below All the risks below
with/without one another, Detect via all methods be- with/without one another, Detect via all methods be-
collaborating in small or low collaborating in small or low
bigger groups bigger groups
–
Average 0.28 – Average 0.4
2 Multiple-large scale natural
Metrological satellites, geo- Industrial BI reports, con-
disasters: hurricanes, fires, Human climate footprint
logical and seismic sensors, sumer-producer, ecological
Atlantic Tsunamis, earthqua- (current)
medical surveys, etc. effects, biodiversity re-
kes, acid rains, virus attacks,
ports, etc.
pandemic, etc.
OIR – 4, 5, 6, 7 and/or 1
Average = 1.0 IIR– 2-5, and/or 1 Average = 1.0 OIR + 2 and/or 1
3 Could happen anytime by
Hostile extraterrestrials or a altering space-time fabric; Frequent geopolitical, and
cosmological catastrophe (e.g., we refer to speculative re- real-time security reports,
Nuclear disaster footprint
an ultimate space-time di- ports, hypotheses, observa- via surveillance, intelligence
(less concurrent)
mensional rip) tories or other means of organizations, databases,
current space and time etc.
technologies
Average = 0.5 OIR + 8 and/or 1 Average = 0.75 OIR + 2 and/or 1
4 Detect through geological Medical reports and cur-
Synthetic biology
Super-volcanoes sensors and current reports rent biotechnological haz-
(less concurrent)
on surface + underground ardous developments, su-
Earth activities per bacteria, etc.
OIR + 2 and/or 1;
Average = 0.00000082 OIR– 2, 5 and/or 1 Average 0.5 OIR + 2
5 Detect through satellite be-
fore impact; non-
Energy physics reports,
compensable after impact
probability impact reports
relative to reduction risk Physics experiments
Asteroids or deadly impact on subatomic strangelet
reports like Matheny (less concurrent)
possibilities (strange mat-
(2007), or migration to
ter)
elsewhere, below surface or
other planets
Average = 0.00000002 OIR+ 4, and/or 2 Average = 0.08 OIR + 1
6 Detect through satellite Currently unavailable or
telescopes; non- com- Machine Super Intelli- sci-fi material, but might be
Sun’s death or a nearby col- pensable on a global scale gence or AI developed in the future as a
lapsing star (supernova) after death. (N/A to current, or to be in new risk; academic research
a distant future) reports and patented inven-
tions on paper
Average 0 OIR + 1-5 and/or 8 Average 0 IIR + 1
7 Anomalies between all the
Psychological large-scale Psychological profiles and
above and below risks, their
mass suicide/systematic or cases of mass suicides via
correlation and time/order of
collective genocide e.g., psychological warfare,
occurrence!
(current) media, religion, etc.
>0
IIR – 1 and/or OIR – 1
Average = 0.0000277
8 Other unknown outside risks Hidden Other unknown inside risks Hidden
Average = 0.5 – Average = 0.5 –
Table 1. An 8-by-8 summary surveillance table on risks as inside and outside influence, their trends and relationships
Legend:
OIR+ = could result in one or more outside influence risk(s), respectively; IIR+ is for inside influence risk.
OIR – = could be triggered by certain outside influence risk(s), respectively; IIR– is for inside influence risk.
= probability
https://doi.org/10.5771/0943-7444-2011-5-438
Generiert durch IP '46.4.80.155', am 19.02.2021, 05:22:23.
Das Erstellen und Weitergeben von Kopien dieses PDFs ist nicht zulässig.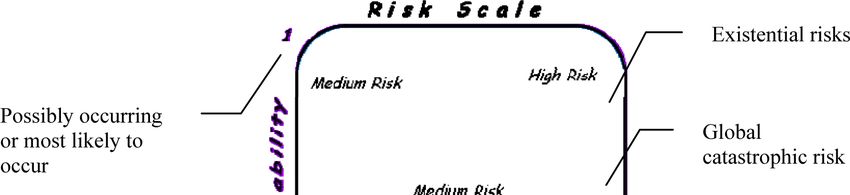
Knowl. Org. 38(2011)No.5 445
K. S. Søilen and P. B. Alipour. Semantics, Classifications and Evidence in a Model for Global Catastrophic Risks
Disaster-related Causes Global Concern Impact
No. Occurred Controlled
issue issue impact level probability
1 Asteroid a. size= 10-50m 0 0% 2 0.2 + +
b. 100m 0 1-to-1.66 % 3 0.001 +
c. 1-2km {2,3,4,7} 100% 4 0.00001 +
d. 15km {2,3,4,7} 5 0.00000002 ∆ ∆
Large-scale earthquakes
2 0 0.01% 5 1 +
a. Average of 2.7 years (1968-1987)
b. Average of 2.4 years + hurricanes
0 1% 5 1 +
(1988-2005)
c. similar frequency with more coinci-
0 5% 5 1 +
dence 2005-1010
d. similar frequency with greater hu-
0 5%+ 5 1 +
man population under effect (2010…)
e. So many earthquakes consecutively {3,7} 5 1 ∆ ∆
f. So many earthquakes simultaneously {3,7} 5 1 ∆ ∆
Super-volcano
3 {4,7} 5 0.0000014 +
a. Every 60,000 years
b. Yellowstone {4,7} 5 0.00000024 ∆ ∆
Climate Change
4 {2, 7} 10% 4 1 +
a. 1960
b. 1970 {2, 7} 25% 4 0.8 +
c. 1980 {2, 7} 50% 5 0.3 ∆ ∆
d. 1990 {2, 7} 75% 5 0.05 ∆ ∆
e. 2000 {2.7} 90% 5 0.25 ∆ ∆
f. 2005 {2, 7} 100% 5 0.1 ∆ ∆
Human Footprint
5 {4,6,7} 100% 2 1 +
a. 1975
b. 1985 {4,6,7} 110% 3 1 +
c. 1995 {4,6,7} 124% 4 1 +
d. 2000 {4,6,7} 129% 4 1 +
e. 2005 {4,6,7} 145% 5 1 +
f. 2008 {4,6,7} 151% 5 1 +
g. 2012 {4,6,7} 175% 5 1 ∆ ∆
h. 2014 {4,6,7} 200% 5 1 ∆ ∆
i. 2014 +
{4,6,7} 5 1 ∆ ∆
Nuclear Disaster Footprint a. Hi-
6 0 1% 5 1 +
roshima and Nagasaki
b. Chernobyl =400 Hiroshima bombs 0 1% 5 1 +
c. Global Nuclear War =30,000 war-
{2,3,4} 5 0.5 ∆ ∆
heads
d. Instant human annihilation = 1.24
{2,3,4} 5 0.5 ∆ ∆
million warheads
Other probabilities:
7 Multiple large-scale hurricanes, fires, 0 5 1 ∆ ∆
earthquakes, acid rains, pandemic, etc.
Earth’s collapse as a black hole (phys-
8 0 5 0.08 ∆
ics experiments)
Sun’s death or nearby supernovae or
9 {1-to-6, 8} 5 0.5 ∆
black hole
10 Cosmological impacts {1-to-6, 8, 9} 5 0.5 ∆
Table 2. Disaster-related issues with probabilistic impacts, indexed in our real-time surveillance system
Legend:
() = No ; (+)= Yes ; ∆= Not yet or circumstantial ; = Infinite impact or a set of effects indicating a global catastrophe ; 0 =
Yields no other issue or the consequent global impact is minute otherwise infinite
Note: The numbering (No.) is not based on risk priority like Table 1, since Table 1 is the deduction summary of the analysis made in Ta-
ble 2. Therefore, the current table representation is of probability analysis leading to the classification of risks based on priority as well as
acquisition of incoming information inherent to risks for the KOS.
https://doi.org/10.5771/0943-7444-2011-5-438
Generiert durch IP '46.4.80.155', am 19.02.2021, 05:22:23.
Das Erstellen und Weitergeben von Kopien dieses PDFs ist nicht zulässig.446 Knowl. Org. 38(2011)No.5
K. S. Søilen and P. B. Alipour. Semantics, Classifications and Evidence in a Model for Global Catastrophic Risks
whereby, establishing a set notation {2,7} and {3,7} relative to overconsumption impacts on the ecosys-
as an inclusion factor between global events and their tems, according to relations (2) and (3), is not only
relative impacts becomes apparent. The excluded is- the most connected to other disaster-related issues, it
sue, however, is of remote or outside influence, and has also room to be controlled in parallel to issue # 6
could lead to another after impact i.e. yielding events (a “doomsday scenario,” Bostrom and Ćircović 2008)
4, 2, 3 and 7 after the asteroid 1.d surface hit respec- based on a similar scale. It is by all means “circum-
tively, or: stantial” (∆), in Table 2, at the point of infinity ,
however, controllable before reaching that point,
since both issues are conducted within manmade ter-
ritories. According to Bostrom and Ćircović “taxon-
It is obvious that the latter gives a cyclic sum of im- omy and organization” (2008, 2-4), the risk is categor-
pacts as the result of issue # 1.d. So, going back to ized as “imperceptible” on the axis of its intensity,
case (2), a sequence sum of impacts mean gives: while “global” is placed on the axis of its scope
(Bostrom and Ćircović 2008, 3). Therefore, the no-
tion of controllability becomes feasible based on the
metric. The human footprint probability = 1,
shows that it is co-occurring with other hidden and
or uncontrollable or irreversible phenomena by man visible risks with a potential global factor that grows
after a sequence of at least six event occurrences, one and could trigger other risks in a possible future (co-
succeeding after another, such that the probability occurrences of many global events).
mean, in case (3), is derived by averaging the events as Asteroids: The number of deaths in china was es-
they chronologically occur in sequence, or: timated to be 10,000 in 1490. During the founding of
the Ming Dynasty (1368), the population estimate of
that country approaching the 1400’s was 60 million
(Morabia 2009, 1363-1366). Therefore, the risk factor
for the regional human population, generally is dis-
tributed to be 10,000 100% / 60 million = 1.66%,
when this size of asteroid impact occurs after passing
through the atmosphere. This estimate is supported
Therefore, working out the remaining cases from the solely with the assumption that the atmosphere is
table, using the above impact-yield relationships (2) stable. In reality it is currently changing due to hu-
and (3), would depict the short and long term limits mans’ ecological impacts, as discussed later. The other
of a futurology concept (Solberg Søilen 2005) for the deduced statistics, mainly express disaster-related is-
SISAM model. The impact mean = , is compliant sues to be linked to the human footprint area as a
with the “pre-empted existential calculations” based “closely visible event,” in Table 2.
on by Bostrom and Ćircović (2008, 122-123), when Large-scale earthquakes: With reference to the
the variable as the probability of human extinction findings of Grossi et al. (2008), we take the average of
upon the catastrophic event approaches 0, giving = the large-size earthquake disasters coinciding with
, such that (Bostrom and Ćircović 2008, 123): hurricanes between years 1988 and 2005, giving a re-
currence frequency for every 2.4 years. Further com-
very destructive events completely destroy pre- parisons with the previous frequency, displays a trend
dictability! An obvious consequence is that ab- for every 2.7 years, excluding the main hurricanes, be-
solutely destructive events, which humanity has tween years 1968 and 1987. It shows that the recur-
no chance of surviving at all ( = 0), completely rence frequency is more coincidental with other po-
annihilate our confidence in making predictions tential disasters within the period 1988-2005. Thus,
from past occurrences. This almost trivial con- other potentials could trigger off multiple-scale
clusion is not, however, widely appreciated. earthquakes with other disasters across the globe in
the near future. This has been indicated via issues # 3
Despite an absolute annihilation from some probable and 7, or subset {3, 7} in Table 2.
risk, there remain yet other events that co-occur in Super-volcanoes: Despite the level of concern be-
real-time from the same risk. For instance, the notion ing the highest for this disaster, its probability impact
of human survival sustainability on natural resources, for the Yellowstone case is quite low compared to
https://doi.org/10.5771/0943-7444-2011-5-438
Generiert durch IP '46.4.80.155', am 19.02.2021, 05:22:23.
Das Erstellen und Weitergeben von Kopien dieses PDFs ist nicht zulässig.Knowl. Org. 38(2011)No.5 447
K. S. Søilen and P. B. Alipour. Semantics, Classifications and Evidence in a Model for Global Catastrophic Risks
other issues. “The term ‘supervolcano’ implies an ure 2). Humanity’s Ecological Footprint in 2007 con-
eruption of magnitude 8 on the Volcano Explosivity sisted of 22% cropland, 8% grazing land, 11% forest
Index, meaning that more than 1,000 cubic kilome- land, 4% fishing ground, 54% carbon uptake land,
ters (240 cubic miles) of magma (partially molten and 2% built-up land. As these annual deficits accrue
rock) are erupted. The most recent such event on into an ever larger ecological debt, ecological reserves
Earth occurred 74,000 years ago at the Toba Caldera are depleting, and wastes such as CO2 emissions are
in Sumatra, Indonesia” (Lowenstern 2008, Yellow- accumulating in the biosphere and atmosphere.” The
stone Volcano Observatory: our probabilities re- cumulative growth of the footprint is visible in issue
flected in Table 2 are derived from the same observa- # 4 through 5, Table 2, which reflects Figure 2 ac-
tory). While being quite visible, its occurrence is a counts on the growth with respect to world’s bio-
matter of time which is hidden and difficult to pre- capacity i.e. 1.5 Earths. Therefore, relative to this
dict. Based on historical accounts, it will happen but overconsumption growth, the level of concern esca-
when is still unknown or ∆ (Table 2 right columns) lates, as well as probability impact (or less uncertainty
for this variable, and in turn, once occurred could in our surveillance), quite visible in issue # 5.
cause issue # 4, or triggering other possibilities like # Nuclear disasters: Regardless of the nuclear disas-
6 and 7. This risk is significant and after impact deliv- ters experienced back in WWII, and Chernobyl in
ers a global cooling of 3-5oC for several years and re- 1986, the range of environmental impacts has been
gional cooling of up to 15oC. However, prediction limited to certain geographical regions or specifically,
strategists find it difficult to calculate the actual im- in terms of exclusion zones (Ivanov et al., 2009).
pact and rely on incoming flow of massive amounts Meaning that, the spread of an environmental global
of data and observations to make estimates (Bostrom impact presumably is 1% and does not indicate the
and Ćircović 2008, Chapter 10). destruction of the whole planet. Nevertheless, having
Human climate footprint: According to Ewing et said this, a strong chance for a catastrophe destroying
al. (2010, 12), “in 1961, the first year for which the all mankind can be calculated if we would have had
National Footprint Accounts are available, human- 1.24 million warheads of any size and strength,
ity’s Ecological Footprint was approximately half of launched and impacted simultaneously (issue # 6.d).
what the biosphere could supply—humanity was liv- On that scale, there will be no chance of survival for
ing off the planet’s annual ecological interest, not the human race. The probability of that occurring, or
drawing down its principal (Figure 2). According to “co-links” to “nuclear terrorism” is computable based
the ‘national footprint accounts,’ human demand first on the 50% chance of Nation States to launch, or a
exceeded the planet’s biocapacity in mid 1970s. Since 0.5 probability (Bostrom and Ćircović 2008, 383).
1961, overall humanity’s Footprint has more than With the current available number of warheads =
doubled and overshoot has continued to increase, 30,000 (Borger 2011), from a declining average of
reaching 51% in 2007. The various land use types are 10,277, we deduce a 0.8~1% probability for a total
stacked to show the total Ecological Footprint (Fig- annihilation (issues 6.a, b summoned to c). The as-
Figure 2. Information summary from Ewing et al. (world overshoot according to the National Footprint Accounts 2010) human
footprint research, as a sample input or part of historical records, is used for real-time data comparisons in the knowl-
edge base surveillance system (Figure 3).
https://doi.org/10.5771/0943-7444-2011-5-438
Generiert durch IP '46.4.80.155', am 19.02.2021, 05:22:23.
Das Erstellen und Weitergeben von Kopien dieses PDFs ist nicht zulässig.448 Knowl. Org. 38(2011)No.5
K. S. Søilen and P. B. Alipour. Semantics, Classifications and Evidence in a Model for Global Catastrophic Risks
sumption is based on the entire 100% nuclear impact keys as ’s from Equation (1). Each class is classified
potential (issue 6.c or 6.d), and after impact the envi- as a set of issues from low to high levels of concern,
ronmental consequences at a global scale exposing the and specified via the “cause issue” and “disaster-
rest of the human population to an unavoidable and related issue” columns in Table 2. This further struc-
uncontrollable radiation. This biodiversity effect at- tures the model with specific variables mainly as out-
tribute among other species is speculative when it side influences which could trigger off other issues in
comes to statistics for the planet, and thus, for now, catastrophic scenarios. For example, supernovae,
based on present knowledge, is better limited to cer- black holes and cosmological impacts denoting a huge
tain critical zones where a negative trend in man- transformation of our physical world to something
kind’s nature can be imagined, and actually reoccurs else are classed as a strong possibility by e.g., alien
from time-to-time. The biodiversity issue by Bo- experimentations, natural changes of space and time
strom and Ćircović, (2008, 3) is classed endurable on relative to matter-energy states across the universe
a trans-generational scope inclined to a subset of ter- (cosmos).
minal human extension on the axis of its intensity, an
existential risk. 6.0 Related studies with existential risk classifica-
Mass suicides/genocide: A number of individuals tion compared to SISAM classification
will commit mass suicide and/or systematic geno-
cides. The average probability could increase based For surveillance purposes with cost-effective analyses
on reporting the ’s of one or more groups (subsets) for each type of risk per human, our classification dif-
of risks in a surveillance system, which escalates the fer from other classifications which are made as visi-
believability or psychological instability process in a ble risks by e.g., putting physics experiments, climate
human being. Therefore, a global or large scale collec- catastrophe, doomsday war, machine super-
tive suicide/genocide could occur as a risk leading to intelligence, biological or synthetic weapons as inside
human extinction: influence risk # 5, 4, 2, and 1, respectively (Sjöström
et al. 2010, Bostrom and Ćircović 2008). In contrast,
(1000 feared people or believers 194 countries) / 7 the current classification is made specifically to detect
billion people = 2.77142857 × 10⁻⁵ the relatedness and cataclysmic trigger points with
their probability order of occurrence, where co-
This, by itself, gives a = 0.0000277: a summary of relation between factors is tangibly visible. According
findings of the risks in Table 1 as an overall scope of to the four SISAM criteria (section 4), the risks are
Table 2, i.e. “fear from all the issues” # 1-10 triggers not solely classified as being the biggest risk in scale
off this risk, hypothetically speaking. Small scale ex- or impact: the risk is mainly classified by two factors,
amples are given in factual reports like the Jonestown being large and most likely to occur along a dimen-
massacre in Guyana, and elsewhere (Smith 1982). sion of time or immediacy.
Similar events as a partial list of examples might in- In other words, the current risk classification dif-
clude the Nazi genocide, suicidal missions carried out fers from other presentations, based on two main cri-
by Japanese Kamikazes in WWII, and currently, reli- teria: 1- the risk we are classifying is most likely to
gious or ideological extremism as suicide bombers, occur/recur shortly i.e. highly probable, tangible and
triggered by broadcasts in different ways by mass currently visible, and 2- the remaining risks shall be
media or the internet. less concurrent despite of their large scale impact i.e.,
Other possibilities: These possibilities are roughly they have never occurred or might occur with the le-
stated in Table 2, issue # 7-10. They map probable ast probability. So, statistically, the emphasis is on
scenarios as risks with large-scale impacts i.e. global how to detect the most likely risk in order of occur-
or even existential (Figure 1). Escalating instances are rence, with respect to how large the impact and its as-
shown in a documentary program by Sjöström et al. sociation with other risks.
(2010), whereby the specifics of the issue is expanded Fear of some risks happening, like the mass suicide
in issues # 8-10, increasing the depth of concern level case, trigger other risks in parallel, putting them in a
as well as uncertainty (the color spectrum varying sequence as a group, each leading to another in the
from grey to black). Risk # 7, however, is a matter of SISAM classification. This gives us a strong projec-
recurrence of events and could well be triggered by tion for being aware of certain current risks that do
certain predecessors as higher keys from the onto- exist but does not indicate an imminent or instanta-
logical tree, resulting in the same risk class, or lower neous existential human extinction. The focus is on
https://doi.org/10.5771/0943-7444-2011-5-438
Generiert durch IP '46.4.80.155', am 19.02.2021, 05:22:23.
Das Erstellen und Weitergeben von Kopien dieses PDFs ist nicht zulässig.Knowl. Org. 38(2011)No.5 449
K. S. Søilen and P. B. Alipour. Semantics, Classifications and Evidence in a Model for Global Catastrophic Risks
the main current risks that frequently occur as a The incoming data from different geographical lo-
strong indication of an already researched and estab- cations, observatories, central servers, etc., relevant to
lished trend towards human extinction. Yet, hidden classified indices over probable risks are compared to
risks like # 10 for both IIR and OIR columns re- one another via program code. This code, as the sur-
main, and could happen with no preamble to another veillance code, is presented in form of a Visual Basic
event. Script (VBS) to process data, thereby indexing it as
information into a database table (rows by columns).
6.1 SISAM classification and visualization The choice of VBS is well-defined for simulation
in the knowledge organization purposes and its effective analysis delivered from da-
tabases via its modules.
In continuation, the following section shows how The table values, generated by the VBS in the DB
these risks are mathematically identified, and through indices, represent probability results. Then, using a
analysis, classified and co-related one to the other to simulation program like MATLAB, priori distribu-
reach a verdict on the order of degree of risks (which tion curves are generated as well as visualization of
one is the biggest risk in size and probability? Recall data representing surveillance results. The active
Figure 1). Therefore, the surveillance component is script is programmed in VB as an automation tech-
deduced in our table as the system detects one prob- nique to produce ’s, once real-time data and records
lem prior to another. In addition, the compensative are compared with to acquire and process informa-
surveillance cost is calculated on each risk in US dol- tion. This comparison is conducted by decision sup-
lar per human, (or, how much would it take to survey port system (DSS) agents (Turban et al. 2007, 637-
each risk per person?). According to Matheny (2007), 653) in the program.
we base our surveillance cost on $1 per human for a The produced ’s are linked relevant to our surveil-
particular risk, and $2.5+ for compensative means per lance model like the 8-by-8 matrix resulting a curve
year. The rationale to this is that the SISAM classifi- akin to Figure 4. Each is stored and positioned in its
cation focuses on how to practically survey multiple column, in one of the 8 rows for a specific risk as well
risks like e.g., a large asteroid impact, which estimates as its rank (Table 1), denoting where the IIR/OIR is
that “the cost of asteroid detection and deflection is likely to occur, in real-time. The geographical loci of
assumed to be $20 billion, paid in the present” ’s on the map are the , and coordinates, as they
(Matheny 2007, 1341), whilst relative to other co- frequently get updated when the system accesses or-
occurring risks with an $ factor impact. In other ganizations data network (or central servers). There
words, $20 billion + $ to survey all risks based will be two tables in total, one for IIRs and the other
on the incoming flow of information (a real-time for OIRs and the rows of could be further indexed
dataset). The number converges to the interval of to satisfy certain risks in the given rank.
current risks to the population. In this case, = 8 to For example, on a set of geographical locations (or
more risks (Table 1), giving an estimate of $160 bil- a loci of points on Earth’s plane i.e. map), the format
lion dollars excluding the extra $ . This avoidance of {1, 0.5, 0.3, 1, 1} stored/updated in row # 4 of the
$ cost in our survey, is solely possible when we con- database, denotes that is happening in a par-
sider a simulation program installed on the surveil- ticular place, and another location is experienc-
lance system. This program must be able to calculate ing , so forth. Therefore, using Equation (1),
all probabilities coupled with historical records of the computing the average based on rank # 4 (super-
co-occurring risks, as well as trigger points starting volcanoes) gives, .
others. After DSS agent comparisons, simulating a sce-
To do so, the system must access, process and nario for a major (computable by Equation 1) is
maintain this information according to Figure 3. The plausible at the visualization phase from the resultant
database component should contain samples (like curves with extrapolated data. The DSS agent further
Figure 2) as well as real-time updates which form the pinpoints which parts of the planet are most likely to
future curve of the sample in its priori distribution: receive the impact from the specific surveillance ba-
growing negative otherwise positive trend which sed on the 3D coordinates. An example of a 3D
form our predictions (see prediction algorithm, Bo- geographical map points on a sphere, representing
strom and Ćircović 2008, 125). Thus, a predictable planet Earth, is illustrated in Figure 3 for the 8-by-8
pattern is generated to its antecedent data points on risks matrix. For each specific risk in the plurality of
the same curve. ’s from Equation (1), tagged on the map, could be
https://doi.org/10.5771/0943-7444-2011-5-438
Generiert durch IP '46.4.80.155', am 19.02.2021, 05:22:23.
Das Erstellen und Weitergeben von Kopien dieses PDFs ist nicht zulässig.450 Knowl. Org. 38(2011)No.5
K. S. Søilen and P. B. Alipour. Semantics, Classifications and Evidence in a Model for Global Catastrophic Risks
Figure 3. This is a proposal to the SISAM surveillance system, incorporating a simulation program after develop-
ment, for detecting multiple influences, major risks, in real-time. This program is an advancement of Osiń-
ska and Bala’s experiment architecture (2010, 163), with additions of relevant surveillance functions. All
functions are performed by software components, and begin with accessing data from a set of network
domains or www’s, or other forms of IP addresses. These domains supply the program with kernel re-
sources (data collecting) such as real-time private and public surveillance websites to produce intelligence.
This intelligence is acquired by processing data via database components and a program script. From there,
data is compared with current information as well as historical, archived in the system. These comparisons
are made by a DSS agent residing in the system which further visualizes data once indexed in form of
values. Relative to where the is most likely to occur on the planet (the coordinates), the total is
pinpointed for a specific risk on the global map and reported back to the necessary organization operating
on the globe. From there a State Intelligence (SI) decision point is made based on the simulation results.
visualized into Google™ Earth viewpoints with micro scale, its population mean, building a major
zoom-in and out options. Google™ Earth, is a virtual on a macro scale (see criterion #4, section 4) could
globe, map and geographical information tool, and is be displayed like the Google™ Earth virtual environ-
importable as a plug-in to our simulation program. ment. From a macro perspective (quite zoomed out),
Therefore, the specific results for a particular on a in the SISAM program, IIR and OIR tags denoting a
https://doi.org/10.5771/0943-7444-2011-5-438
Generiert durch IP '46.4.80.155', am 19.02.2021, 05:22:23.
Das Erstellen und Weitergeben von Kopien dieses PDFs ist nicht zulässig.Knowl. Org. 38(2011)No.5 451
K. S. Søilen and P. B. Alipour. Semantics, Classifications and Evidence in a Model for Global Catastrophic Risks
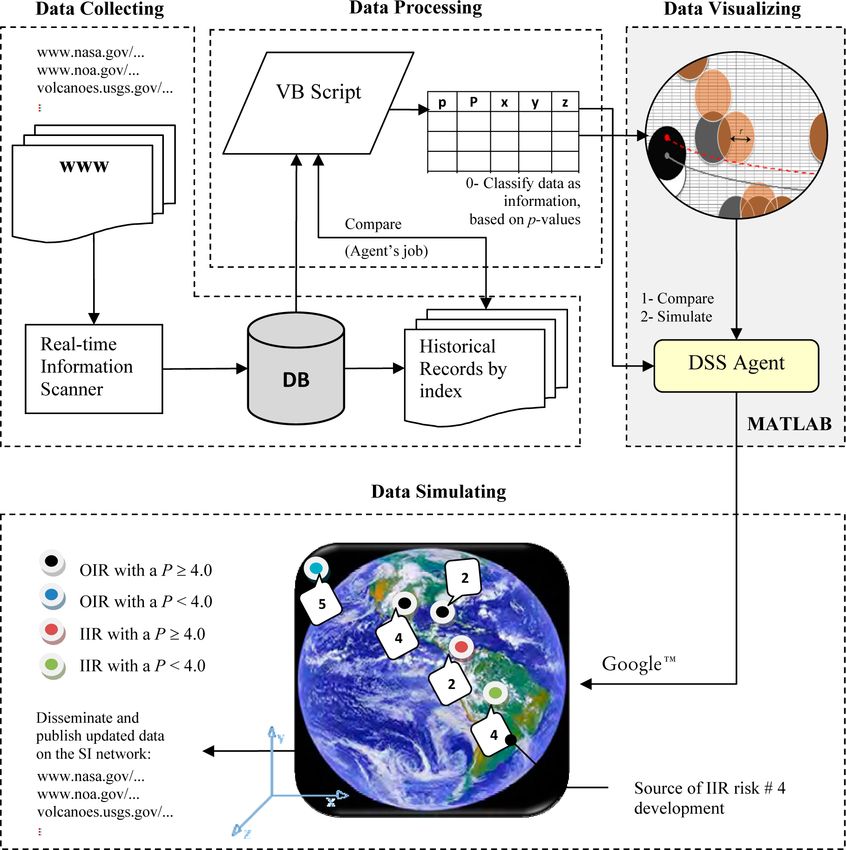
Figure 4. The surveillance model incorporated in a probable simulation program (real-time) is to de-
tect the mostly-linked potential risk as well as other risk associated. The extrapolated data
indicates a future outcome (average curves) as well as visibility, which at the most is de-
tected between 0.4 < 1, and at the least when = 0.
computed , are thereby displayed according to Fig- In Figure 4, we plotted the values from Table 1, the
ure 3. A good example of a specific risk, ‘nuclear ra- average (or ) based on inside influence, IIR, is
diation’, is presented by indicating the spread and ex- greater than the average from outside influence,
posure of it in the recent Tsunami that hit Japan OIR. Furthermore, the extrapolated probability rank
(RDTN.ORG 2011). Any readings coming from the value (risk rank or of the matrix) as new data plot-
risk(s) could also be submitted to such organizational ted into the scope of OIR and IIR cause-and-effect
websites using automated HTML codes in the active relationships, could resize in surveillance output as
script. Furthermore, the possibility of creating cus- one changes the input accordingly. Each rank variable
tom maps based on the SISAM model for final risk could extend/retract between its incremental/decre-
products ( ’s) is evident in terms of environmental ment range in terms of , thus concentrating
conservation, disaster response, socio-political issues, each value as well as the surrounding values of an
wildlife, etc. (Google Earth Outreach 2011), relative in our surveillance outputs, their radius r of impact in
to risks ( ’s). The implementation of lines of code in triggering other ’s expectably. For example, if rank
the SISAM program, explicitly include ‘what-if ’ and with probability , then the odds for other
‘if-then-else’ statements representing issues like those descending ranks of 2 and 3 are between probability 0
incoming ’s sampled by Cases (2) and (3) for a ma- and 1. Therefore, if , crosses with probability less
jor impact from section 5.1. than 1 and greater than 0, hence, for the other de-
scending ranks of 3 and 4, would land between 0 and
7.0 The mostly-linked potential factor 0.85, and so forth. Hence, forming the linear trends
upon the average of all OIR and IIR risks becomes
7.1 Which is the most effective issue from the negative evident. In other words, while all risks are equally im-
trends based on our surveillance? portant to one’s survival plan (ethically speaking), the
less value in probability of occurrence the less the rank
The following chart illustrates our deductive 8-by-8 becomes vital in our surveillance analysis.
relational statistics, a matrix denoting the association Mathematically, for all the summarized risks in Ta-
of ranks and probability estimates from Table 1, ble 1, there exists a possible combination of risks oc-
which are relevant to SISAM risk classification crite- curring in real-time in the surveillance system, from 1
ria (section 1), and analysis (section 5). It maps the to more, in population between the IIR and OIR ta-
spherical points of incoming data (Figure 3) to clas- bles (Figure 3). Let this population be identified as
sify between 0-to-1 from the main program out- for OIR, and for IIR, giving a possible combinations
puts, delivering Figure 4 surface points on the sphere product
(globe).
https://doi.org/10.5771/0943-7444-2011-5-438
Generiert durch IP '46.4.80.155', am 19.02.2021, 05:22:23.
Das Erstellen und Weitergeben von Kopien dieses PDFs ist nicht zulässig.You can also read