TBSAP IS A NOVEL CHROMATIN PROTEIN REPRESSING METACYCLIC VARIANT SURFACE GLYCOPROTEIN EXPRESSION SITES IN BLOODSTREAM FORM TRYPANOSOMABRUCEI
←
→
Page content transcription
If your browser does not render page correctly, please read the page content below
Nucleic Acids Research, 2021 1
                                                                                                                        doi: 10.1093/nar/gkab109

TbSAP is a novel chromatin protein repressing
metacyclic variant surface glycoprotein expression
sites in bloodstream form Trypanosoma brucei
Carys Davies1 , Cher-Pheng Ooi1 , Georgios Sioutas1 , Belinda S. Hall1 , Haneesh Sidhu1 ,
Falk Butter2 , Sam Alsford 3 , Bill Wickstead 4 and Gloria Rudenko 1,*

                                                                                                                                                              Downloaded from https://academic.oup.com/nar/advance-article/doi/10.1093/nar/gkab109/6154463 by guest on 01 April 2021
1
 Sir Alexander Fleming Building, Department of Life Sciences, Imperial College London, South Kensington, London
SW7 2AZ, UK, 2 Institute of Molecular Biology, Ackermannweg 4, 55128 Mainz, Germany, 3 London School of
Hygiene and Tropical Medicine, Keppel Street, London WC1E 7HT, UK and 4 School of Life Sciences, Queens
Medical Centre, University of Nottingham, Nottingham NG7 2UH, UK

Received November 10, 2020; Revised February 02, 2021; Editorial Decision February 06, 2021; Accepted February 11, 2021

ABSTRACT                                                                        marily of extensive polycistronic transcription units con-
                                                                                taining functionally unrelated assortments of genes which
The African trypanosome Trypanosoma brucei is                                   are constitutively transcribed by RNA polymerase II (Pol
a unicellular eukaryote, which relies on a protec-                              II) (2). The T. brucei genome encodes relatively few tran-
tive variant surface glycoprotein (VSG) coat for sur-                           scription factors compared with other eukaryotes (3), which
vival in the mammalian host. A single trypanosome                               is consistent with the observed general lack of Pol II tran-
has >2000 VSG genes and pseudogenes of which                                    scriptional regulation (4,5). Instead, regulation of mRNA
only one is expressed from one of ∼15 telomeric                                 levels during the trypanosome life-cycle or in response to
bloodstream form expression sites (BESs). Infec-                                stress, occurs primarily through post-transcriptional mech-
tious metacyclic trypanosomes present within the                                anisms including RNA stability mediated through sequence
tsetse fly vector also express VSG from a separate                              elements located in mRNA untranslated regions (6).
set of telomeric metacyclic ESs (MESs). All MESs are                               The striking exception to this rule is the transcriptional
                                                                                regulation of the vast number of T. brucei variant surface
silenced in bloodstream form T. brucei. As very little
                                                                                glycoprotein (VSG) genes. T. brucei is an extracellular par-
is known about how this is mediated, we performed                               asite of the mammalian bloodstream and tissue spaces (7,8).
a whole genome RNAi library screen to identify MES                              Within the host, it is covered with a dense protective VSG
repressors. This allowed us to identify a novel SAP                             coat comprised of ∼107 molecules corresponding to ∼10%
domain containing DNA binding protein which we                                  total protein (9). A single trypanosome has a vast reper-
called TbSAP. TbSAP is enriched at the nuclear pe-                              toire of thousands of VSG genes and pseudogenes, but only
riphery and binds both MESs and BESs. Knock-                                    one is transcribed at a time from one of 15 bloodstream
down of TbSAP in bloodstream form trypanosomes                                  form VSG expression sites (BES) (10,11). BESs are telom-
did not result in cells becoming more ‘metacyclic-                              eric transcription units with promoters located 30–60 kb
like’. Instead, there was extensive global upregula-                            upstream of the telomeric VSG, and which include vari-
tion of transcripts including MES VSGs, VSGs within                             ous expression site associated genes (ESAGs) (12). Switch-
                                                                                ing the active VSG entails replacement with another VSG
the silent VSG arrays as well as genes immediately
                                                                                through DNA rearrangements including gene conversion,
downstream of BES promoters. TbSAP therefore ap-                                or a transcriptional switch to a different BES (13–16).
pears to be a novel chromatin protein playing an im-                               A highly unusual feature of BES transcription is that it
portant role in silencing the extensive VSG repertoire                          is mediated by RNA polymerase I (Pol I) (17). This use of
of bloodstream form T. brucei.                                                  Pol I for transcription of protein coding genes is unprece-
                                                                                dented for a eukaryote, as Pol I normally exclusively tran-
INTRODUCTION                                                                    scribes ribosomal DNA (rDNA) (18). Pol I transcription is
                                                                                characterised by extremely high rates of transcription initia-
The African trypanosome Trypanosoma brucei (causative                           tion (19). This feature of Pol I appears to facilitate the ability
agent of African Sleeping sickness) is an early-branching                       of the trypanosome to produce vast amounts of VSG tran-
unicellular eukaryote with highly unusual features to its                       script (about 10% total mRNA) from a single copy VSG
molecular biology (1). The T. brucei genome consists pri-

* To   whom correspondence should be addressed. Tel: +44 207 594 8137; Email: gloria.rudenko@imperial.ac.uk


C The Author(s) 2021. Published by Oxford University Press on behalf of Nucleic Acids Research.
This is an Open Access article distributed under the terms of the Creative Commons Attribution License (http://creativecommons.org/licenses/by/4.0/), which
permits unrestricted reuse, distribution, and reproduction in any medium, provided the original work is properly cited.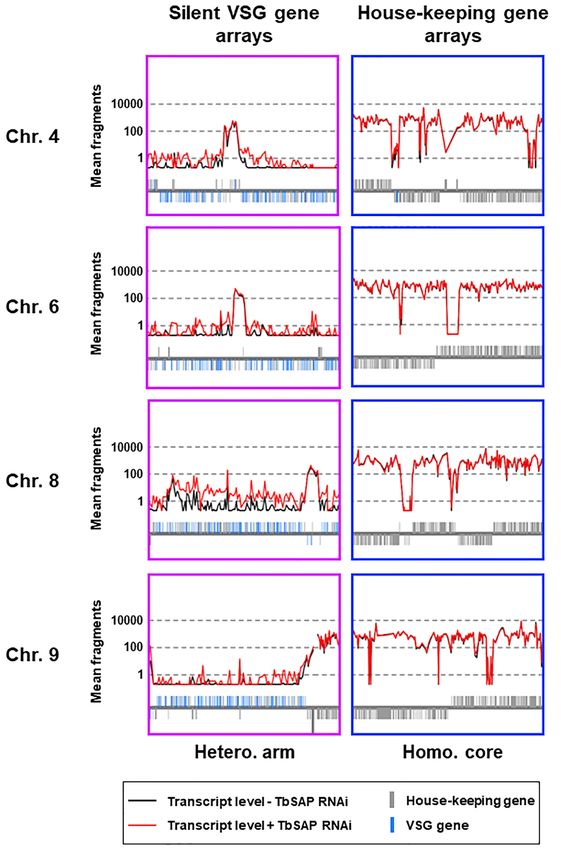
2 Nucleic Acids Research, 2021
gene. Pol I transcription of rDNA in eukaryotes is concen- the BES1 promoter allowing selection for maintenance of
trated within a nuclear body referred to as the nucleolus VSG221 expression (26). All genetically modified cell lines
(20). This is also the case in T. brucei, but bloodstream form were validated using linking PCR.
trypanosomes additionally contain an extra-nucleolar Pol To mark an individual MES in BF T. brucei, constructs
I focus called the expression site body (ESB), where tran- were inserted downstream of the endogenous promoter of
scription of the active BES occurs (21). Here, a highly strin- MES VSG653 (10). The T. brucei SM221 MES-pur cell line
gent mechanism of monoallelic expression operates, with was generated by transfecting the pMES653PurBla plasmid
restricted access of the ESB to a single BES playing a key into SM221 cells resulting in a puromycin resistance gene
role in this control (22). inserted downstream of the endogenous MES VSG653 pro-
However, inactive BESs are not the only ESs which are moter. The T. brucei SM221 MES-GFP cell line was gen-
Downloaded from https://academic.oup.com/nar/advance-article/doi/10.1093/nar/gkab109/6154463 by guest on 01 April 2021
kept silent in bloodstream form trypanosomes. T. brucei erated through the transfection of the pMES653eGFPBla
is transmitted by tsetse flies, and the infectious metacyclic plasmid into T. brucei SM221 cells resulting in an eGFP
stage present in the fly salivary glands is covered with a VSG gene inserted downstream of the endogenous MES VSG653
coat transcribed from one of several metacyclic expression promoter. In both cell lines, construct integration was se-
sites (MESs). MESs differ in architecture to BESs, with lected for using a blasticidin resistance driven by an ectopic
MES promoters normally within 1–2 kb of the telomeric rDNA promoter. Both plasmids were generated by Gibson
VSG, compared with the 30–60 kb found in BESs (10,12). assembly using the primers listed in Supplementary Table
In addition, MES promoters have divergent sequences com- S2.
pared with BES promoters (23). However, both ES pro- T. brucei SM221pur Cas9 cells constitutively express-
moter types are transcribed by Pol I, and are recognised by ing Cas9 endonuclease were generated by transfecting the
the same CITFA Pol I transcription factor (24). pSMOx2 Cas9 plasmid (derived from a plasmid kindly pro-
For antigenic variation to work, it is vital that both BESs vided by Jack Sunter, Oxford Brookes University, UK).
and MESs are kept silent in addition to the vast number This integrates a codon-optimised Cas9 gene upstream of
of VSG genes within the subtelomeric VSG arrays which the first -tubulin gene in the tubulin array, which is ex-
are not thought to be flanked by promoters. Little is known pressed by endogenous Pol II transcription. Cas9 mediated
about how all MESs are kept silent in bloodstream form T. gene tagging and gene knock-out were carried out as de-
brucei. Promoter sequence alone is not sufficient to explain scribed in (27). pPOT plasmids for this purpose were kindly
MES silencing, as MES promoters can function in blood- provided by Sam Dean, (University of Warwick, UK) and
stream form T. brucei when present on episomes, but not primers were designed using the LeishGEedit website (www.
when they are in their native telomeric MES location (23). leishgedit.net). All plasmids and primers used for Cas9-
We set out to identify factors playing a functional role in mediated gene tagging and knock-out are listed in Supple-
silencing telomeric MESs in bloodstream form T. brucei. mentary Table S2.
To this end, we performed a whole genome RNAi library Stem–loop RNAi constructs were generated by cloning a
screen selecting for derepression of a single inactive MES PEX11 stuffer fragment flanked upstream by HindIII/XbaI
marked with a drug resistance gene. and downstream by BamHI/ AscI into pDexv4-mSt-
We did not identify known BES repressors, but discov- KIN17 (from the Bill Wickstead lab). A PEX11 stuffer
ered a novel SAP DNA binding protein (TbSAP), which was cloned downstream of a tetracycline inducible T7 pro-
plays an important role in MES repression. We found moter. Complementary gene sequences were cloned flank-
that TbSAP is enriched at the T. brucei nuclear periph- ing this PEX11 stuffer, and the construct was inserted into
ery, and using ChIP, established that it binds MESs as well the VSGG4 locus (Tb427VSG-31, Tb427 00805900) on a T.
as immediately upstream of BES promoters. Knockdown brucei mini-chromosome (28) after digestion with NotI and
of TbSAP resulted in extensive global upregulation of T. transfection into SM221pur cells.
brucei transcripts arguing that it has a general repressive All RNAi cell lines were generated from SM221pur
function. These derepressed transcripts included transcripts MES-GFP cells, with the exception of the ␣-tubulin RNAi
from MES VSGs, VSGs within the silent VSG arrays, as well cell line which was generated using T. brucei BNII V02+
as genes in the immediate region of BES promoters. TbSAP pSMOx2. This cell line was generated using the BNII V02+
therefore appears to be a novel chromatin protein with a key cell line (29) transfected with a derivative of the pSMOx
functional role in repression of the extensive VSG repertoire plasmid containing codon optimised tetracycline repressor
of bloodstream form T. brucei. and T7 RNA polymerase (30) with alterations allowing con-
struct integration upstream of the first -tubulin gene of the
tubulin array (kind gift of Mark Carrington, University of
MATERIALS AND METHODS Cambridge, UK). PFR2 (Tb927.8.4970) was targeted for
Trypanosome strain generation and culturing RNAi using the first 400 bp of its CDS, TbSAP was tar-
geted for RNAi from position 130 to 634 of its CDS and
Bloodstream form (BF) Trypanosoma brucei strain 427 ex- ␣-tubulin was targeted for RNAi from position 629 to 1340
pressing VSG221 from BES1 (12) was used for all exper- of its CDS.
iments, and cultured in modified HMI-9 medium supple-
mented with 15% foetal calf serum. All cell lines used in
RNAi library generation and selection for repressors of MES
this study are detailed in Supplementary Table S1, and are
transcription
all based on the ‘single marker’ (SM) cell line (25) which
is referred to here as SM221. The SM221pur cell line has The T. brucei SM221MES-pur cell line was transfected with
a puromycin resistance gene inserted immediately behind pRPSce* . This construct was generated following transfer of
Nucleic Acids Research, 2021 3
the Sce* cassette, containing the I-SceI meganuclease and BB2 (kind gift of the Keith Gull lab). The secondary anti-
its recognition site, from pRPaSce* (31) to the pRP construct bodies used were: goat anti-rabbit IgG (H+L) conjugated
via HindIII/ Bsp120I cloning (32). In contrast to pRPaSce* , with Dylight 488, or goat anti-mouse IgG (H+L) conju-
which targets an ectopic rDNA spacer landing pad locus gated to Dylight 594 (both from ThermoFisher Scientific).
in 2T1 T. brucei (32), pRPSce* is able to integrate at any of Cells were then mounted in Vectashield with DAPI (Vec-
the conserved rDNA spacer sequences in the SM221MES- tor Laboratories) and imaged on a Zeiss M1 Imager mi-
pur T. brucei cell line. Transformants were selected with hy- croscope with an AxioCam MRm camera. Post-acquisition
gromycin. analyses were carried out using ImageJ with the BAR plug-
pRPaSce* Hyg transfected cells were pooled for a total in for quantitation of signal intensity (NIH, Bethesda, MD,
number of ∼3 × 10⁷ cells, and incubated for 24 h with- USA). Sample preparation for visualisation of telomeres
Downloaded from https://academic.oup.com/nar/advance-article/doi/10.1093/nar/gkab109/6154463 by guest on 01 April 2021
out hygromycin before transfection of the T. brucei whole using DNA FISH was carried out as detailed above, al-
genome RNAi plasmid library from (33). Transfection of though instead of antibodies, the DAKO Telomere PNA
the plasmid RNAi library was performed after 3 h of tetra- FISH kit/FITC (Agilent) was used according to the manu-
cycline induction to induce I-SceI expression and target site facturer’s instructions.
cleavage, enabling high efficiency integration of the RNAi
library at the I-SceI cleaved rDNA spacer sequence (31).
Chromosome immunoprecipitation (ChIP) experiments
Phleomycin was added 5 h after transfection to select for
RNAi library integration. T. brucei RNAi library cells were ChIP analysis of TbSAP and histone H3 was carried out as
counted daily and expanded continuously until total cell described in (38) and (22) with minor modifications. T. bru-
number exceeded 1 × 10⁸ . Screens for repressors of MES cei TbSAP-eGFP/TbSAP KO or untagged SM221pur cells
expression were initiated directly from expanded RNAi li- were cross-linked with 1% formaldehyde for 1 h at room
brary cells using 2 × 10⁷ cells per screen. The RNAi li- temperature before the reaction was quenched by glycine
brary was induced with tetracycline for 24 h to ensure robust addition to a final concentration of 125 mM. Cross-linked
RNAi target depletion prior to addition of puromycin selec- cells were sonicated (BioRuptor, Diagenode) to obtain an
tion (50, 60 or 70 ng/ml). Genomic DNA for high through- average DNA fragment size of 200 bp. Immunoprecipita-
put RIT-seq analysis was harvested (Blood and Tissue Kit, tion was carried out by incubation at 4◦ C for 18 h with anti-
Qiagen) from the 50 ng or 60 ng/ml puromycin screens fol- GFP (Ab290, Abcam) or anti-histone H3 (Ab1791, Abcam)
lowing ten days under selection, and from the 70 ng/ml antibodies bound to Protein G magnetic Dynabeads (Ther-
screen after 23 days under selection. The genomic DNA moFisher). Dynabeads without bound antibodies were in-
from library cells grown in the absence of tetracycline or cluded as controls for all ChIP experiments. ChIP material
puromycin was harvested after either three or ten days of was analysed by qPCR (Applied Biosystems 7500 real time
growth. PCR machine) using Brilliant II SYBR low ROX master
RIT-seq (RNA interference target sequencing) was car- mix as previously described (38) and (22) using the primers
ried out as previously described (31). Briefly, the remaining listed in Supplementary Table S3. Quantitation of target
RNAi target fragments in each selected RNAi library were sequence enrichment in the ChIP material was calculated
PCR amplified using LIB2f and LIB2r primers as described from the percentage of input chromatin after normalisation
in (34). The amplified products were sequenced on an Il- by subtraction of the value obtained from the no-antibody
lumina MiSeq platform (BGI Genomics). Sequence reads controls.
containing the RNAi construct-specific 14-base barcode
were identified using a custom script (34). Mapping was car-
Flow cytometry analysis
ried out using Bowtie2 (35) set to ‘very sensitive local’ align-
ment, and output SAM files were processed using SAM- In order to quantitate levels of eGFP fluorescence following
tools (36). The resultant BAM files were viewed against TbSAP RNAi, 1–3 × 10⁶ T. brucei cells were washed twice
the reference genome in the Artemis genome browser (37). in cold PSG and fixed with 2% formaldehyde. Fixed cells
RNAi target fragment read numbers were converted to were then washed and resuspended in PBS. In order to de-
RPKM (reads per kilobase per million reads mapped) to ac- termine the percentage of live or dead cells following either
count for interlibrary read depth variations when compar- PFR2 or TbSAP RNAi, 0.5–1.0 × 10⁶ unfixed cells were
ing sequencing outputs from independently selected RNAi washed and resuspended in cold PSG. Propidium iodide
libraries. (PI) was added to samples to an end concentration of 10
g/ ml with cells kept on ice to prevent internalisation of PI
through endocytosis. Flow cytometry data was acquired us-
Immunofluorescence microscopy
ing a BD LSR Fortessa cell analyser operated by BD FACS
In order to visualise target proteins using antibodies, cells Diva software (BD Biosciences) with 10 000 events recorded
were washed twice in cold PSG buffer and fixed in 2% per sample. Post-acquisition analysis of flow cytometry data
formaldehyde for 15 minutes at room temperature. Fixed was with FlowJo v10 software (BD Biosciences).
cells were washed twice in PBS and settled on ColorFrost
Plus microscopy slides (Shandon) for 30 min in a humid-
qPCR analyses of mRNA transcript levels
ity chamber. Cells were then permeabilised using 0.1% NP-
40 and then subsequently incubated with the following pri- Total RNA was extracted using a Qiagen RNeasy Mini
mary antibodies: A rabbit polyclonal anti-GFP antibody kit with genomic DNA depleted using Turbo DNase (Am-
(Abcam, Ab290) and anti-Ty epitope mouse monoclonal bion) according to manufacturer’s instructions. Reverse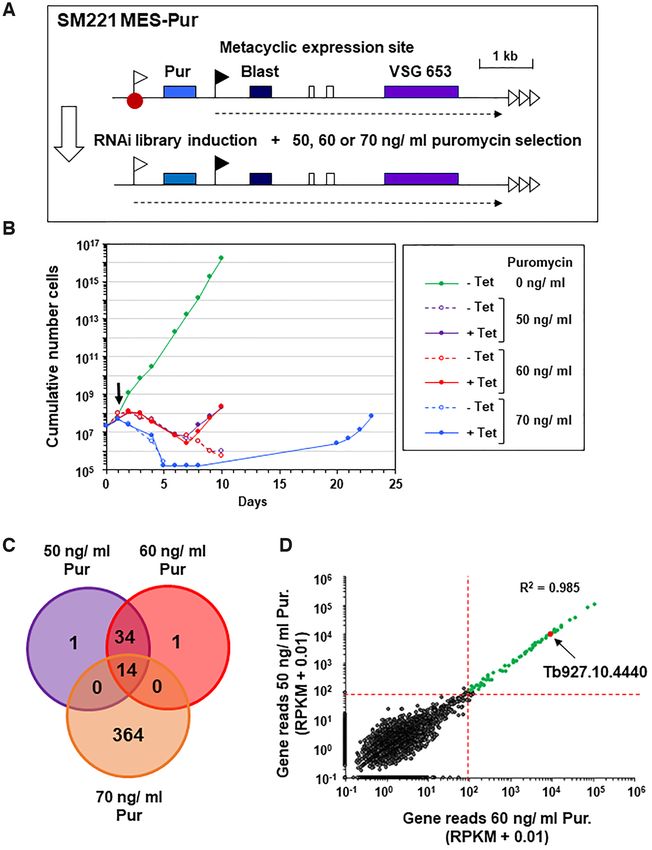
4 Nucleic Acids Research, 2021
transcription with 100 ng of total RNA was carried out To compare transcriptomic changes due to TbSAP RNAi
using a Qiagen Omniscript RT kit with random hexamers to those in the metacyclic transcriptome, databases were
from Promega. Generated cDNA was diluted 10-fold and remapped to the long-read assembly of the T. brucei 427
the equivalent of 0.5 ng of RNA was used as the template genome (v46 based on the work of (45)) as above. Read
for the qPCR reactions. qPCR reactions were carried out depth analysis was performed using bedtools v2.25.0 (46).
using an Applied Biosystems 7500 real time PCR machine Alternatively, the RNA-seq reads were mapped to the T.
using Brilliant II SYBR low ROX master mix (Agilent) with brucei 427 genome and expression comparison was carried
primers listed in Supplementary Table S4. out using DEseq.
RESULTS
Mass spectrometry analysis of cell surface GPI-anchored
Downloaded from https://academic.oup.com/nar/advance-article/doi/10.1093/nar/gkab109/6154463 by guest on 01 April 2021
proteins A genome-scale RNAi library screen identifies a putative
MES repressor protein
Approximately 4 × 10⁷ T. brucei cells per sample were
washed twice at 4◦ C in trypanosome dilution buffer (5 mM In order to identify novel repressors of the silent meta-
KCl, 80 mM NaCl, 1 mM MgSO4 , 20 mM Na2 HPO4 , 2 cyclic VSG expression sites (MES) of bloodstream form T.
mM NaH2 PO4 , 20 mM glucose pH 7.6) and resuspended brucei, we performed genome-scale RNAi library screens.
in 45 l cold 10 mM sodium phosphate buffer (pH 8.0) These have previously successfully elucidated novel regula-
with protease inhibitors. Samples were then incubated for tory pathways in African trypanosomes (47–49). We first
5 min at 37◦ C in order to activate endogenous GPI-specific generated the bloodstream form T. brucei SM221 MES-
phospholipase C (GPI-PLC) which cleaves GPI-anchored Pur reporter strain, which expresses VSG221 from the
proteins on the cell surface (39). Samples were then cooled VSG221 bloodstream form expression site (BES1) (Figure
on ice and the supernatant was harvested and diluted with 1A, Supplementary Figure S1A). We inserted a reporter
NuPAGE LDS sample buffer (ThermoFisher) and dithio- construct containing a puromycin resistance gene immedi-
threitol to a final concentration of 1× sample buffer with ately downstream of the inactive metacyclic VSG expres-
100 mM dithiothreitol. Harvested proteins were denatured sion site (MES) VSG653 promoter (10) (42). As we could
at 70◦ C for 10 min and then frozen before processing for not select for construct integration using the repressed MES
mass spectrometry using the protocol described in (40). VSG653 promoter, we included an ectopic ribosomal DNA
(rDNA) promoter directing expression of a blasticidin resis-
tance gene downstream of the silent puromycin resistance
RNA-seq of bloodstream form T. brucei after induction of Tb-
gene (Figure 1A).
SAP RNAi
The MES repressor RNAi library screen involved intro-
Total RNA was extracted using a Qiagen RNeasy Mini ducing a plasmid library containing fragments of the entire
kit and genomic DNA was depleted using Turbo DNase T. brucei genome cloned between opposing tetracycline in-
(Ambion). Quality of extracted RNA was determined ducible T7 promoters into the T. brucei SM221 MES-Pur
by agarose gel electrophoresis and TapeStation (Agilent) reporter strain (33). Use of the rare cutting homing endonu-
analysis. Generation of Illumina-indexed RNA-seq li- clease I-SceI, allowed high efficiency targeting of the plas-
braries and sequencing (HiSeq 4000, Illumina) was carried mid library to rDNA spacers (50). Knockdown of a putative
out at the BRC Genomics facility (Imperial College MES repressor through the induction of RNAi with tetra-
London). RNA-seq libraries were generated by polyA- cycline would result in derepression of the normally inac-
enrichment for mRNA and strand selection. Paired-end tive MES VSG653 promoter, and increased puromycin re-
sequencing was carried out to a read length of 75 bp at sistance of the selected trypanosomes. Readthrough tran-
each end, resulting in approximately 13 million pairs of scription from the MES located ectopic rDNA promoter
reads for each sample. Reads were processed using Trim in the SM221 MES-Pur strain resulted in increased expres-
Galore v0.4.4 (www.bioinformatics.babraham.ac.uk; sion of MES VSG653 transcript (Supplementary Figure
-q28––illumina––stringency 3––length 50––max S1B). However, introduction of the construct did not result
n10––trim-n––paired–trim1) and aligned to reference in significantly increased transcription from the endoge-
sequence using bowtie2v2.3.4 (41) (–no-mixed––no- nous MES VSG653 promoter, as the relative puromycin re-
discordant-I50-X 500). Alignment was performed against sistance of the T. brucei SM221 MES-Pur strain was ap-
the long-read based assembly of the T. brucei 427 genome proximately equivalent to that of the parental T. brucei
(427 2018; v42). For comparative analysis to a previously SM221 cells (50–100 ng/ml puromycin) (Supplementary
published metacyclic transcriptome (42), reads from study Figure S1C).
SRP103532 (www.ebi.ac.uk/ena/) were remapped to the We therefore performed the MES repressor RNAi library
427 long-read assembly with the parameters above. screen three times using three different concentrations of
Total transcript abundance was assessed using HT- puromycin (50, 60 and 70 ng/ml) in order to select at dif-
Seq v0.5.4 (43) considering only fragments mapping with ferent degrees of stringency and thereby increase chances
MAPQ≥2 (to discriminate between ES copies). Differen- of success (Figure 1B). First, we electroporated the RNAi
tial expression was estimated using edgeR package (44), library into SM221 MES-Pur cells, generating a T. brucei
using the ‘RLE’ method for calculation of normalisation RNAi library with an estimated 6.3x coverage of the hap-
factors, an estimate of dispersion robustified against out- loid T. brucei genome. RNAi was induced with tetracycline
liers, and fitting count data to a quasi-likelihood negative at time point 0, and cells were subsequently placed on se-
binomial generalised log-linear model [glmQLFit method]. lection with puromycin 24 h later. Cells in the absence of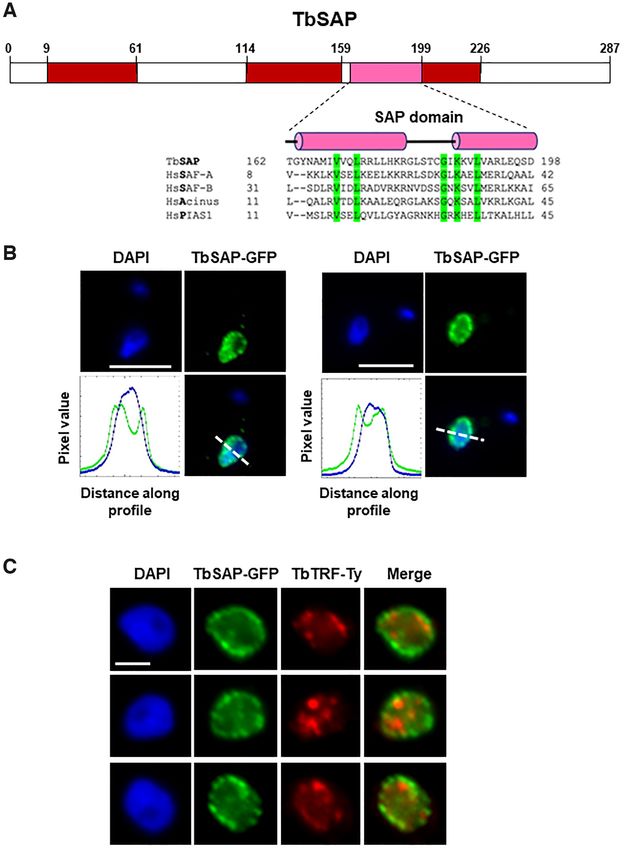
Nucleic Acids Research, 2021 5

                                                                                                                                                              Downloaded from https://academic.oup.com/nar/advance-article/doi/10.1093/nar/gkab109/6154463 by guest on 01 April 2021

Figure 1. A whole genome RNAi library screen designed to identify repressors of metacyclic expression site (MES) transcription in bloodstream form T.
brucei. (A) Schematic of the T. brucei SM221 MES-Pur cell line with a marked MES used for conducting the screen. A puromycin resistance gene (Pur) was
inserted immediately downstream of the endogenous promoter (white flag) of the VSG653 (purple box) MES. A downstream blasticidin resistance gene
(Blast) expressed from an ectopic rDNA promoter (black flag) allowed selection for construct integration. A putative MES repressor protein is indicated
with a red dot, various genes with coloured boxes, telomere repeats with horizontal arrows and transcription with a dashed arrow. After transfection of
a tetracycline inducible whole genome RNAi library, the cell line was placed on different levels of puromycin selection to select for derepression of the
inactive MES promoter after the induction of RNAi with tetracycline. (B) Cumulative growth curve of T. brucei RNAi library cells in the presence (+)
or absence (−) of tetracycline (Tet) to induce RNAi in the presence of different levels of puromycin (Pur) selection. Tetracycline was added at day 0, and
puromycin selection at day 1 (arrow). The growth curve shows the cumulative number of cells through time in the presence (+) or absence (−) of tetracycline
and puromycin. (C) Venn diagram of shared MES repressor candidates identified from high throughput RITseq (100 read equivalent RPKM cutoff) from
the 50, 60 and 70 ng/ml puromycin (Pur) selection screens. (D) Correlation plot of mapped reads from RITseq data from tetracycline induced trypanosome
libraries selected with either 50 ng/ ml or 60 ng/ml puromycin (pur). Each dot represents a single T. brucei gene. The minimum threshold of 100 reads is
marked by red dotted lines, and genes with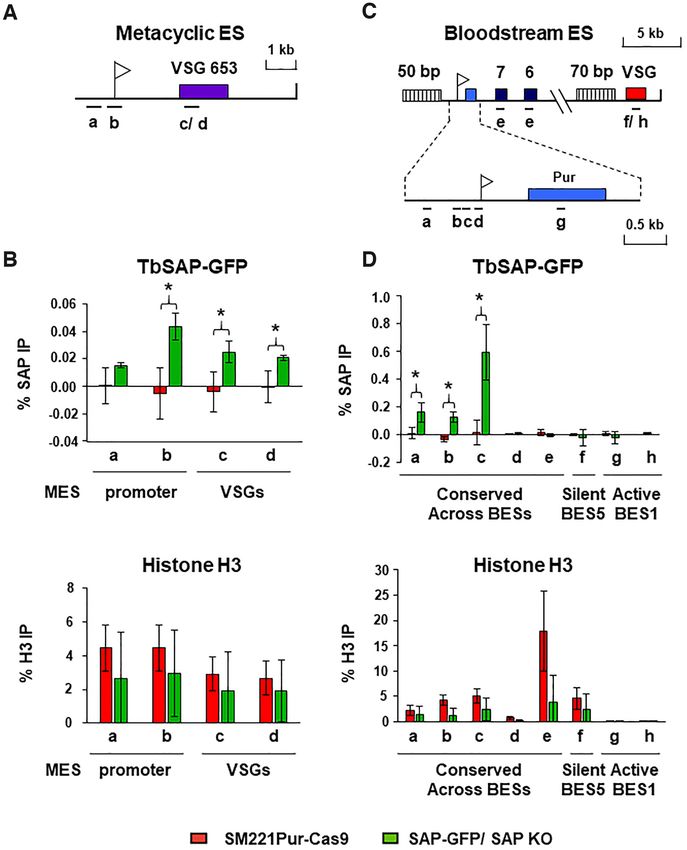
6 Nucleic Acids Research, 2021

tetracycline and puromycin (–Tet, 0 ng/ml Pur) grew at a           Tb927.10.4440 stood out as the only protein with a known
normal rate (Figure 1B). Cells in the presence of puromycin        nuclear localisation (Tryptag.org; (51); (Supplementary File
but no tetracycline to induce RNAi died.                           S1). This protein contains a predicted SAP DNA binding
   RNAi library induction and selection in 50 or 60 ng/ml          domain (InterPro) (Figure 2A), a 35 residue motif consist-
puromycin, led to reduced growth for seven days, followed          ing of two parallel ␣-helices connected by an extended loop
by the emergence of a resistant population. In the presence        (52).
of 70 ng/ml puromycin, growth retardation was more pro-               The SAP motif was first identified on the scaffold at-
nounced, with a resistant population only emerging at day          tachment factors A and B (SAF-A and SAF-B), and was
19. Genomic DNA was harvested when each library had                later found on a range of proteins involved in nucleic acid
achieved a consistent robust growth rate (Figure 1B), and          metabolism (53). It was postulated that this SAP motif

                                                                                                                                    Downloaded from https://academic.oup.com/nar/advance-article/doi/10.1093/nar/gkab109/6154463 by guest on 01 April 2021
the remaining RNAi target fragments were amplified, us-            could target proteins to specific chromosomal locations. In
ing RNAi construct-specific primers (Supplementary Fig-            addition, both SAP as well as the related LEM motif, were
ure S2A).                                                          proposed to be involved in tethering chromatin to the nu-
   RIT-seq (RNA interference target sequencing) was car-           clear periphery, thereby impacting on chromosomal organ-
ried out to identify the RNAi target fragments enriched            isation within the nucleus (52). As this, and Tb10.v4.0034
after puromycin selection. The PCR-amplified RNAi tar-             (which is identical at the amino acid level) are the only pro-
get fragments were deep sequenced, generating >3 mil-              teins in the T. brucei genome matching a SAP domain profile
lion sequence reads per selected RNAi library, of which            (e value < 1e–3 ), we named it TbSAP, and focused on it for
16–24% contained the RNAi construct barcode. Barcode-              further investigation.
containing reads were mapped against the T. brucei 927
reference genome and read values were converted to reads
                                                                   TbSAP is a nuclear protein enriched at ES promoters and
per kilobase per million reads mapped (RPKM) to account
                                                                   MESs
for read depth variations between the sequenced RNAi li-
braries. High confidence hits were identified as those rep-        We first determined the cellular localisation of TbSAP by
resented by RPKM equivalent to >99 reads containing                epitope tagging the N-terminus with eGFP in bloodstream
the RNAi construct barcode. Selection in 50 or 60 ng/ml            form T. brucei using CRISPR-Cas9 (27,54). We validated
puromycin followed a similar growth profile and identified a       correct epitope tagging of an endogenous TbSAP gene us-
highly similar set of genes (Pearson’s correlation coefficient     ing PCR (data not shown). As fluorescence signal from the
of R2 = 0.985) (Figure 1C, D).                                     eGFP tagged TbSAP protein was weak, we performed im-
   In contrast, selection in 70 ng/ml puromycin resulted in        munofluorescence microscopy using anti-GFP antibodies
delayed emergence of a resistant population and a substan-         (Figure 2B). TbSAP had a heterogeneous distribution in
tially greater number of apparent hits, which showed little        the nucleoplasm, but was particularly enriched in foci at the
concordance with those identified following selection in 50        nuclear periphery. These results correspond with the cellu-
or 60 ng/ml puromycin (Pearson’s correlation coefficients of       lar localisation of TbSAP in procyclic form T. brucei docu-
R2 = 0.104 or R2 = 0.102 respectively) (Supplementary Fig-         mented by the TrypTag initiative (TrypTag.org).
ure S2B, C). We initially assumed that selection in 70 ng/ml          Telomeres in bloodstream form T. brucei are particularly
puromycin would enhance the stringency of our screen.              enriched at the nuclear periphery (55,56). Our attempts at
However, the delayed recovery time and the large number            combining TbSAP localisation with DNA fluorescence in
of hits identified, suggests that secondary adaptations oc-        situ hybridisation (FISH) to visualise T. brucei telomeres
curred in a founder population, enabling a proportion of           were unsuccessful. We therefore tested for colocalisation of
cells to survive in the presence of puromycin, independent         TbSAP with the T. brucei TTAGGG-binding factor (TRF).
of specific RNAi library-mediated knockdown, thereby re-           TbTRF protein binds telomeres, and plays an important
ducing the stringency of the screen. Hence, while selection        role in telomere biology, including suppressing VSG switch-
in 70 ng/ml puromycin identified some hits also seen fol-          ing mediated by DNA rearrangements (57–59). We there-
lowing selection in 50 and/or 60 ng/ml puromycin, none             fore epitope tagged TbTRF at the N-terminus with the Ty
of the 364 unique hits were investigated further. Forty eight      epitope in cells containing an allele of TbSAP which was
hits were identified following selection in 50 and 60 ng/ml        endogenously tagged with eGFP. Immunofluorescence mi-
puromycin, of which 14 were also identified following selec-       croscopy experiments visualising both TbTRF and TbSAP
tion in 70 ng/ml puromycin (Figure 1C, Supplementary File          at the same time showed that TbSAP foci were often adja-
S1). Remarkably, no genes were identified that had been pre-       cent to TbTRF foci, but we did not see obvious colocalisa-
viously documented to play a role in the repression of BESs        tion of the two proteins (Figure 2C). We do not think that
(reviewed in (13)), suggesting that in bloodstream form T.         the N-terminal addition of eGFP to TbSAP in bloodstream
brucei MES silencing is mechanistically fundamentally dif-         form T. brucei compromised its function, as knocking out
ferent to the silencing of BESs.                                   the second TbSAP allele in these cells using CRISPR/Cas9
   Most of the proteins identified following puromycin se-         was successful (Supplementary Figure S3A). This did not
lection of our MES Pur RNAi library have no obvious                alter the cellular localisation of the epitope tagged TbSAP,
connection with transcriptional regulation, suggesting that        and as expected, nuclear staining of TbSAP was enriched at
rather than derepressing the MES PUR gene expression,              the nuclear periphery (Supplementary Figure S3B). In addi-
they may influence puromycin action (either directly or in-        tion, even though tagging one allele of SAP with eGFP led
directly), with their depletion reducing T. brucei drug sensi-     to a slight reduction in growth compared with the parental
tivity. However, of the 14 hits identified in all three screens,   cell line, this was not further reduced after the knock-out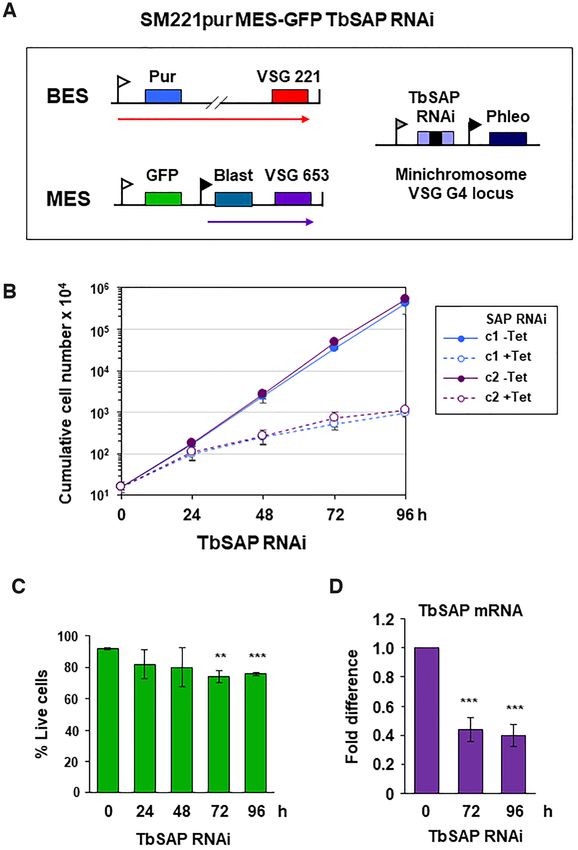
Nucleic Acids Research, 2021 7
Downloaded from https://academic.oup.com/nar/advance-article/doi/10.1093/nar/gkab109/6154463 by guest on 01 April 2021
Figure 2. TbSAP is a protein with a canonical SAP domain which is enriched at the nuclear periphery of bloodstream form T. brucei. (A) Schematic of
TbSAP (Tb927.10.4440) with a canonical SAP domain indicated with a pink box and disordered domains with red boxes as determined using InterPro.
The predicted SAP domain of TbSAP is aligned with SAP motifs from Homo sapiens (Hs) SAF-A, SAF-B, Acinus and PIAS1 proteins using T-coffee
(http://tcoffee.crg.cat/apps/tcoffee/). Conserved amino acid residues are highlighted in green, and helical domains with pink cylinders as predicted using
PSIPRED. (B) Enrichment of TbSAP at the nuclear periphery is shown in representative nuclei of bloodstream form T. brucei expressing a SAP-eGFP
fusion protein from the endogenous TbSAP locus. DNA was visualised with DAPI and GFP using an anti-GFP antibody. Pixel intensity of each colour
along a profile (white dashed line) was calculated using the ImageJ BAR multi-plot analysis tool, with the blue line indicating DAPI stained DNA and the
green line SAP-GFP. The white scale bar indicates 5 m. (C) TbSAP foci do not obviously colocalise with regions enriched for the telomere binding protein
TbTRF. Representative nuclei (1K1N) of a T. brucei cell line containing one allele of TbSAP tagged with eGFP and one allele of TbTRF tagged with a
10X Ty1 epitope are shown. SAP-GFP is visualised with an anti-GFP antibody (green), TbTRF with an anti-Ty1 antibody (red) and DNA is stained with
DAPI. Scale bar represents 2 m.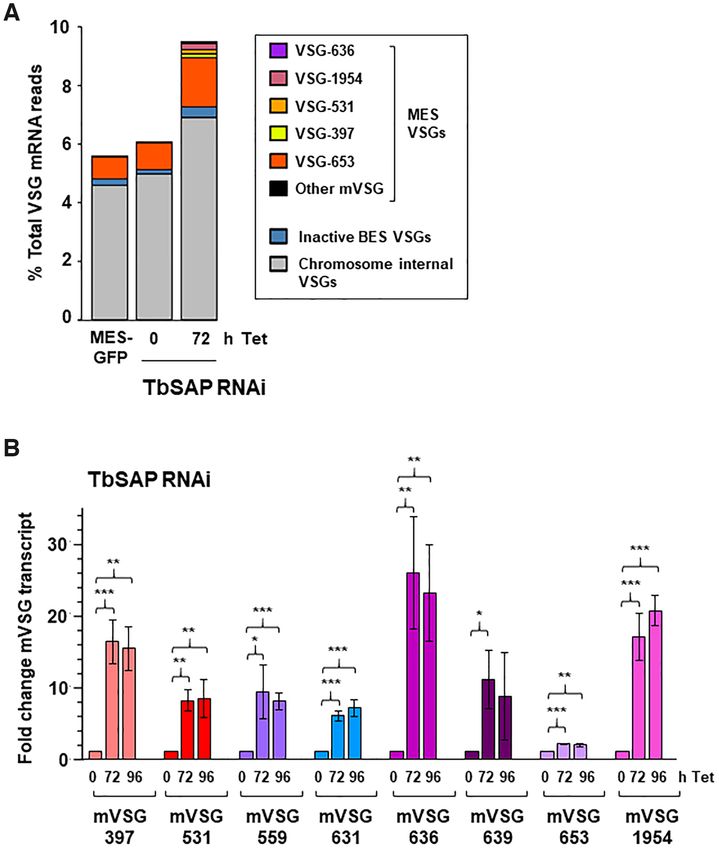
8 Nucleic Acids Research, 2021

of the second SAP allele (Supplementary Figure S3C). This         VSG653 promoter (Figure 4A). Construct integration was
argues that the SAP-GFP protein was not functionally im-          selected for using a downstream blasticidin resistance gene
paired to a very significant extent.                              driven by an ectopic rDNA promoter. Tetracycline in-
   As the SAP motif is a DNA binding domain, we deter-            ducible TbSAP RNAi was expressed from a construct con-
mined the distribution of TbSAP-GFP on T. brucei DNA              taining a stem–loop fragment for TbSAP inserted at a sin-
using chromatin immunoprecipitation (ChIP). As TbSAP-             gle copy VSGG4 (VSG-31) gene present at a T. brucei mini-
GFP was functional, we performed the ChIP experiments             chromosome (28). The induction of TbSAP RNAi with
in the T. brucei TbSAP-GFP/ TbSAP KO cells. The ChIP              tetracycline resulted in a severe reduction in growth after
experiments were also performed in the parental T. brucei         about 24 h, but there was no evidence for a discrete cell cycle
SM221pur-Cas 9 cell line as a negative control (Figure 3).        arrest (Figure 4B). There was a minor amount of cell death,

                                                                                                                                     Downloaded from https://academic.oup.com/nar/advance-article/doi/10.1093/nar/gkab109/6154463 by guest on 01 April 2021
Unfortunately, we were never able to isolate enough anti-         but the majority of cells were alive after 96 h (Figure 4C), in-
GFP-TbSAP ChIP enriched DNA to perform ChIP-seq.                  dicating that the knockdown of TbSAP resulted in reduced
We therefore analysed the TbSAP-ChIP enriched DNA us-             growth rate rather than acute lethality. Quantitation of Tb-
ing qPCR. We first determined the distribution of TbSAP           SAP transcript using qPCR confirmed that the induction
over MES VSG653 (Figure 3A). MES sequences are di-                of TbSAP RNAi resulted in its reduction to ∼40% normal
vergent from each other, and we were not able to use uni-         levels after 72 h (Figure 4D).
versal primer pairs to analyse TbSAP distribution over all           In order to determine the effect of TbSAP knockdown
MESs. However, a low but significant level of TbSAP was           on the bloodstream form T. brucei transcriptome, we per-
detected at the MES VSG653, with higher levels observed at        formed RNA-seq after the induction of TbSAP RNAi for
the MES promoter (primer b) (*P < 0.05) (Figure 3B upper          72 h. As TbSAP was identified in a screen for MES repres-
panel). TbSAP was also detected at the VSG gene in MES            sors, we first investigated if we had induced a global shift
VSG653 (primer c), as well as the VSG in MES VSG397               to a more ‘metacyclic-like’ cell. We compared the blood-
(primer d). Histone H3 was also immunoprecipitated in par-        stream form transcriptome after the induction of TbSAP
allel ChIP experiments as a control, and showed an approx-        RNAi for 72 h with the transcriptome from the parental
imately equivalent distribution in both cell lines (Figure 3B     MES-GFP strain (X-axis of Figure 5). In addition, we
lower panel).                                                     compared the available transcriptome from in vitro derived
   We next determined the distribution of TbSAP over the          metacyclic T. brucei 427 cells with the parental MES-GFP
15 BESs of T. brucei 427, which contain large stretches           strain, which was remapped to the same assembly (Y-axis of
of highly similar DNA sequence (Figure 3C) (12). A sig-           Figure 5) (42). Transcripts which were significantly changed
nificant enrichment of TbSAP was observed in the region           specifically in metacyclic forms are indicated with red dots,
immediately upstream of the BES promoters (*P < 0.05)             and those which have specifically changed after the induc-
(primers a–c in Figure 3D, upper panel), with negligible          tion of TbSAP RNAi are indicated with blue dots. Tran-
binding of TbSAP to BES downstream regions. More Tb-              scripts which are significantly changed in both transcrip-
SAP appeared to be immunoprecipitated on DNA from                 tomes compared with the parental cells are indicated with
the vicinity of BES compared with MES promoters. This             pink dots.
is presumably as the BES promoter primers recognise ∼20              As expected, eight metacyclic VSGs were significantly
highly conserved BES promoters, compared with the MES             upregulated in the metacyclic transcriptome (green circles)
VSG653 primers which identify single copy sequence. Again         (Figure 5A). The induction of TbSAP RNAi resulted in
as a control, the distribution of histone H3 was determined       significant derepression of seven of these different meta-
in both T. brucei cell lines, which as expected, was enriched     cyclic VSGs (green circles). The most significantly upreg-
on silent BES5 sequences and depleted on active BES2 se-          ulated transcripts observed both after the induction of Tb-
quences (Figure 3D, lower panel). The distribution of Tb-         SAP RNAi for 72 h in bloodstream form T. brucei, as well
SAP over the Pol I transcribed rDNA and Pol II tran-              as in the metacyclic transcriptome, were metacyclic VSGs.
scribed actin loci was also determined (Supplementary Fig-        However, we did not find that that knocking down Tb-
ure S4A). There was some TbSAP observed within the 20             SAP with RNAi made the cell generally more ‘metacyclic-
rDNA transcription units, with reduced levels detected in         like’, and both induced and non-induced samples cluster to-
the rDNA spacers presumably reflecting the relative diver-        gether distinct from the metacyclic transcriptome in princi-
gence of these sequences compared with the conserved 18S          pal component analysis (Figure 5B). This argues that Tb-
and 28S rDNA genes. Negligible amounts of TbSAP were              SAP knockdown results in derepression of MES telomeres
found at the constitutively transcribed actin Pol II loci (Sup-   within cells which still fundamentally have a bloodstream
plementary Figure S4B). As a control, the distribution of hi-     form transcriptome.
stone H3 was determined, which is particularly enriched in           When looking at the changes in the transcriptome ob-
nontranscribed regions (Supplementary Figure S4C) (60).           served after the knock-down of TbSAP for 72 h, there is
                                                                  a strong bias towards transcript upregulation rather than
                                                                  downregulation (Figure 6). In total, 397 transcripts were
TbSAP knockdown leads to MES derepression in blood-
                                                                  upregulated using a cut-off value of a 1.4-fold increase and
stream form T. brucei
                                                                  an adjusted P-value of ≤ 0.1 (Supplemental file S2). In
We next determined the essentiality of TbSAP, and repro-          contrast, only 25 transcripts were downregulated using the
ducibility of MES derepression following TbSAP knock-             same threshold. Strikingly, the degree of dysregulation was
down. We constructed a reporter cell line with an eGFP            also much stronger for the genes with increased transcript
gene inserted immediately downstream of the inactive MES          abundance (mean of 6.3-fold changed for genes upregulated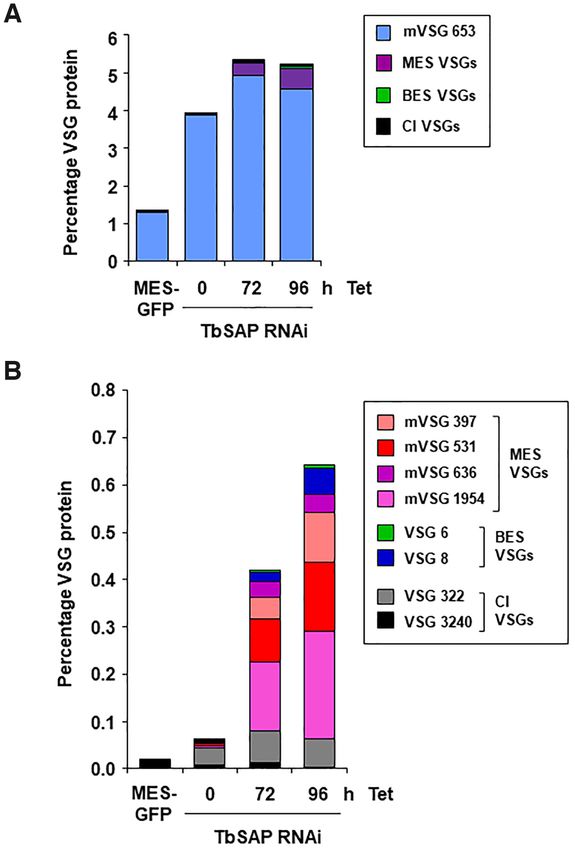
Nucleic Acids Research, 2021 9

                                                                                                                                                                  Downloaded from https://academic.oup.com/nar/advance-article/doi/10.1093/nar/gkab109/6154463 by guest on 01 April 2021
Figure 3. TbSAP is enriched at the promoter regions of metacyclic and bloodstream form ESs. (A) Schematic of a telomeric metacyclic ES (MES) with the
promoter indicated with a white flag and the metacyclic VSG653 gene with a purple box. Primer pairs used for analysis of chromatin immunoprecipitated
(ChIP) material are indicated with lettered bars. Primer pair ‘c’ recognises VSG653 and primer pair ‘d’ recognises VSG397 present within a different MES.
(B) The level of SAP-GFP present at MESs in the SAP-GFP/SAP KO line (green bars), which has one allele of TbSAP epitope tagged with eGFP, and the
other TbSAP allele knocked out. In comparison, the same ChIP was performed with the parental cell line (T. brucei SM221 Pur-Cas9) (red bars) which does
not contain epitope tagged TbSAP. In the top graph the ChIP was performed with an anti-GFP antibody. In the lower graph ChIP was performed using
anti-histone H3 antibodies. Results are presented as the percentage of the total input immunoprecipitated after subtraction of a no antibody control. Data
for the ChIP experiments is the mean of three biological replicates, with the standard deviation indicated with error bars. Statistical significance (pair-wise
t-test against ChIP material from the untagged parental SM221pur cells) is indicated with asterisks (*P < 0.05). (C) Schematic of bloodstream form ES
(BES1) with a puromycin resistance gene (blue box) inserted behind the active BES1 promoter (white flag). Expression site associated genes (ESAG) 7 and
6 are indicated with numbered boxes, and VSG221 with a red box. Simple sequence repeats (50 or 70 bp) are indicated with vertically striped boxes. An
enlargement of the BES promoter region is indicated below. Primer pairs a–e (indicated with bars) are conserved across all BESs, while primer pairs f-h
are specific for sequences present within either the active BES1 (VSG221, primer pair ‘f’ and puromycin, primer pair ‘g’) or the silent BES5 (VSG800 or
VSG-18, primer pair ‘h’) respectively. (D) The ChIP experiments were performed as detailed in panel (B) only the distribution of SAP-GFP or histone H3
was determined across BESs in either the T. brucei SAP-GFP/ SAP KO line, or the untagged parental T. brucei SM221Pur-Cas9 cell line.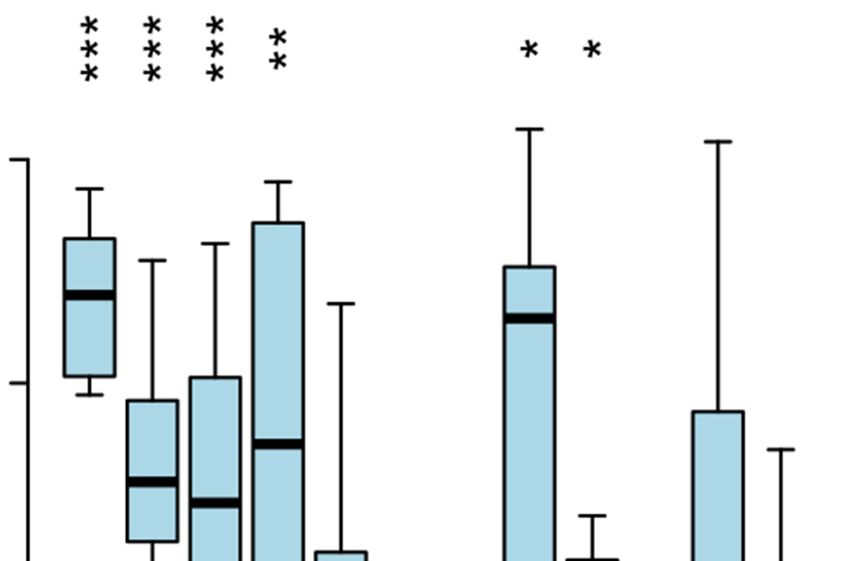
10 Nucleic Acids Research, 2021

                                                                                                                                                               Downloaded from https://academic.oup.com/nar/advance-article/doi/10.1093/nar/gkab109/6154463 by guest on 01 April 2021
Figure 4. RNAi mediated depletion of TbSAP results in a reduction in growth rate with minimal lethality in bloodstream form T. brucei. (A) Schematic
of the SM221pur MES-eGFP reporter cell line which expresses VSG221 from BES1, and which is selected for with a puromycin resistance gene (Pur).
An eGFP gene was inserted immediately downstream of the endogenous MES VSG653 promoter (white flag). The construct was selected for using a
downstream blasticidin gene (Blast) driven by an ectopic rDNA promoter (black flag). Transcription is indicated with arrows. A TbSAP stem-loop RNAi
construct containing a tetracycline inducible T7 promoter (grey flag) was inserted into a locus containing the single copy minichromosomal VSGG4 gene
(28). (B) Cumulative growth curve for two MES-eGFP TbSAP RNAi clones (c1 and c2) in the presence (+) or absence (−) of tetracycline (Tet) to induce
TbSAP RNAi. Time is indicated in hours (h). The mean of three biological replicates is shown with standard deviation indicated with error bars. (C)
Determination of live/ dead bloodstream form T. brucei cells stained with propidium iodide and analysed by flow cytometry after the induction of TbSAP
RNAi for the time indicated. Data for clone c1 are shown with error bars representing the standard deviation from three biological replicates. Tests for
significance (t-test) show slightly increased lethality after induction of TbSAP RNAi compared with time 0, with statistically significant results indicated
with **P < 0.01 and ***P < 0.001. (D) Quantitation of TbSAP transcript with qPCR after induction of TbSAP RNAi for the time indicated in hours
(h). Data from clone c1 are shown with error bars representing the standard deviation from three biological replicates. Statistical significance for the
knock-down was determined using t-tests comparing with time 0 h (***P < 0.001).
Nucleic Acids Research, 2021 11
Downloaded from https://academic.oup.com/nar/advance-article/doi/10.1093/nar/gkab109/6154463 by guest on 01 April 2021
Figure 5. Comparison of the TbSAP RNAi transcriptome with a previously published metacyclic transcriptome reveals that although the induction of
TbSAP RNAi results in the upregulation of metacyclic VSGs, this does not lead to ‘metacyclic-like’ cells. (A) Transcripts are indicated with dots, with
changes in expression level after the induction of TbSAP RNAi for 72 h relative to uninduced parental cells (MES-GFP), shown on the X-axis. This is
plotted against differential expression of transcripts in the metacyclic form (MCF) transcriptome described in (42) compared with parental MES-GFP
cells on the Y-axis. Differentially expressed genes in either comparison (adjusted P-value ≤ 0.05) are highlighted. Transcripts which are only differentially
expressed in the metacyclic form transcriptome are indicated in maroon. Transcripts which are only significantly changed after the induction of TbSAP
RNAi for 72 h are indicated in blue. Transcripts which are significantly changed in both transcriptomes are indicated in pink, with MES VSGs indicated
with green circles. Transcripts which have not significantly changed with respect to the transcriptome of the parental cells are indicated with grey circles. (B)
Principal component analysis of sample to sample distances of the metacyclic form (MCF), parental (MES-GFP) or TbSAP RNAi (MES-GFP TbSAP)
transcriptomes. The first two dimensions covering 96% of the variance are shown. Samples are coloured according to group.12 Nucleic Acids Research, 2021
Downloaded from https://academic.oup.com/nar/advance-article/doi/10.1093/nar/gkab109/6154463 by guest on 01 April 2021
Figure 6. Knock-down of TbSAP leads to striking up-regulation of both VSGs and ESAGs with relatively few downregulated transcripts. (A) Volcano
plot showing differential gene expression after induction of TbSAP RNAi for 72 h compared with the parental T. brucei MES-GFP cell line. Dots indicate
individual transcripts with those corresponding to MES VSGs indicated in light orange. Results are plotted as log2 (fold change) of read count values versus
adjusted P-value. Thresholds at adjusted P-value ≤0.1 and fold change ≥1.4 are shown (dashed lines). Values were calculated from three biological replicates
of each dataset. The other panels are as in (A), only in panel (B) VSGs located in BESs are highlighted with dark orange dots, panel (C), chromosome
internal (CI) VSGs located within the silent VSG arrays are highlighted with purple, panel (D) VSGs located on minichromosomes are indicated with pink
dots, panel (E) ESAGs are indicated in green dots and panel (F) the EP and procyclin transcripts are indicated with blue dots.Nucleic Acids Research, 2021 13 at fdr ≤0.1, compared to 1.2-fold for downregulated genes). down of TbSAP. This SM221pur MES-GFP cell line ex- This is suggestive of a predominant role for TbSAP in si- presses relatively high levels of VSG653 as a consequence of lencing genomic regions in T. brucei. readthrough transcription from the exogenous rDNA pro- A striking number of VSGs in different genomic loca- moter integrated upstream of the telomeric VSG653 (Sup- tions were upregulated, as were transcripts from Expres- plementary Figure S6A, B). These relatively high back- sion Site Associated Genes (ESAGs) found in BESs (Fig- ground levels possibly influence the amount of derepres- ures 6, 7A, Supplemental file S2). Of eight VSGs in T. brucei sion observed. In agreement with the qPCR quantitation 427 genome assemblies sited
14 Nucleic Acids Research, 2021

                                                                                                                                                            Downloaded from https://academic.oup.com/nar/advance-article/doi/10.1093/nar/gkab109/6154463 by guest on 01 April 2021
Figure 7. Knockdown of TbSAP results in significant upregulation of metacyclic VSGs in bloodstream form T. brucei. (A) Relative abundance of VSG
transcripts following RNAi against TbSAP for 72 h. Only transcripts other than VSG221 (VSG-2), present in the active BES1 are shown. The MES with
mVSG-653 is the site of integration of the reporter construct. High levels of MES VSG-653 expression are due to the ectopic rDNA promoter which has
been introduced in the construct. Abundance is shown as a percentage of the total VSG transcript reads. (B) Depletion of TbSAP leads to significant up-
regulation of all eight MES VSGs. RT-qPCR was performed using RNA isolated from cells where TbSAP RNAi had been induced with tetracycline (Tet)
for the time indicated in hours (h). Values were normalised against actin and shown as fold-change relative to the uninduced sample. Values plotted are
the mean of three independent experiments with the standard deviation indicated with error bars. Statistical significance for upregulation was determined
using Student’s t-test (*P < 0.05, **P < 0.01, ***P < 0.001).

VSG arrays after the induction of TbSAP RNAi indicates                         Pur cell line expressing VSG221 from the active BES1, MES
that TbSAP could be playing a role in maintenance of a re-                     VSG653 comprises 1.3% total VSG protein (Figure 10A).
pressed chromatin state in these silenced areas of the T. bru-                 As mentioned earlier, this high expression level of VSG653
cei genome.                                                                    is presumably a consequence of readthrough from the ec-
                                                                               topic rDNA promoter (Supplementary Figure S1). If a Tb-
                                                                               SAP RNAi construct is introduced into this cell line, the
TbSAP RNAi mediated MES derepression produces func-
                                                                               amount of MES VSG653 increases about three fold (pre-
tional mVSG proteins
                                                                               sumably as a consequence of leaky transcription of the
We next investigated if these upregulated VSGs were present                    RNAi fragment), and then further increases after the induc-
on the trypanosome cell surface, indicating functionality.                     tion of TbSAP RNAi (Figure 10A).
Bloodstream form T. brucei expresses an endogenous phos-                          For the other MES VSGs, the proteomic analyses glob-
pholipase C (PLC) which can be activated in trypanosomes                       ally reflect what was observed at the transcript level. Meta-
in vitro, where it cleaves membrane bound VSG at the GPI                       cyclic VSGs with the highest transcript reads (VSG397,
anchor, releasing a soluble form of VSG (39). We performed                     VSG531, VSG636 and VSG1954) were all detected by mass
quantitative proteomics to determine the relative amounts                      spectrometry following phospholipase-C cleavage, indicat-
of different VSGs in soluble VSG fractions following the                       ing localisation on the cell surface (Figure 10B). Although
induction of TbSAP RNAi. In the T. brucei SM221 MES-                           metacyclic VSGs are not detectable on the surface of the
Nucleic Acids Research, 2021 15
Downloaded from https://academic.oup.com/nar/advance-article/doi/10.1093/nar/gkab109/6154463 by guest on 01 April 2021
Figure 8. Differential upregulation of promoter proximal expression site associated genes (ESAGs) in bloodstream form expression sites (BESs) after the
induction of TbSAP RNAi. (A) Schematic of a typical telomeric BES with promoters indicated with white flags and relevant expression site associated
genes (ESAGs) or pseudogenes () with numbered coloured boxes (12). 70 bp repeat arrays are indicated with a vertically hatched box. (B) Differential
regulation of ESAGs in inactive BESs following induction of TbSAP RNAi for 72 h. ESAGs have been arranged according to their common conserved
position in T. brucei 427 BESs (12). A Tukey boxplot is shown with median (bar), interquartile range (box) and inner fences (whiskers) for all transcripts
resulting from individual ESAGs of each family, excluding those of the active BES1. Only transcripts directed with MAPQ ≥2 at ≥1 reads per million
reads are included (one transcript each of inactive ESAG12 and ESAG8 copies pass this threshold). Asterisks indicate Bonferroni-corrected P-values for
individual transcript sets being different from 0 (Student’s t-test; *** P ≤ 0.001, ** P ≤ 0.01, * P ≤ 0.05).
parental VSG221 cells, after the induction of TbSAP RNAi Here, using whole genome RNAi library screens, we iden-
for 72 or 96 h, they comprise 0.35% or 0.54% of the total tified a novel SAP DNA binding domain containing protein
VSG protein respectively. Less protein was detected from (TbSAP) which plays an important role in MES repression
VSGs present in either the chromosome internal VSG ar- in bloodstream form T. brucei. We found that TbSAP is en-
rays or BESs than would be expected from the transcript riched at the nuclear periphery of bloodstream form try-
reads. These results show that if MESs are derepressed, they panosomes, and using ChIP, established that TbSAP binds
can produce functional VSG protein in bloodstream form both MESs and the immediate region upstream of the BES
T. brucei. promoters. Knockdown of TbSAP resulted in significant
upregulation (up to 26-fold) of the silent MESs. However,
these bloodstream form cells depleted of TbSAP retained
DISCUSSION a bloodstream form transcriptome rather than becoming
Recently progress has been made in identifying factors in- ‘metacyclic’-like, indicating that TbSAP was not affecting
volved in BES repression in bloodstream form T. brucei T. brucei differentiation. Strikingly after knockdown of Tb-
including a range of chromatin proteins and remodelers SAP, most of the transcripts with changed levels of expres-
(13). In addition, VEX1 was identified using whole genome sion were upregulated (397 transcripts) rather than down-
RNAi screens, and VEX2/CAF1B through determining the regulated (25 transcripts). The upregulated transcripts in-
VEX1 interactome (65,66). However, it is still not under- cluded VSGs within the inactive chromosome internal sub-
stood how all MESs are kept transcriptionally silent in telomeric VSG arrays, which are not within transcription
bloodstream form T. brucei. units. TbSAP knockdown additionally led to upregulation16 Nucleic Acids Research, 2021
Downloaded from https://academic.oup.com/nar/advance-article/doi/10.1093/nar/gkab109/6154463 by guest on 01 April 2021
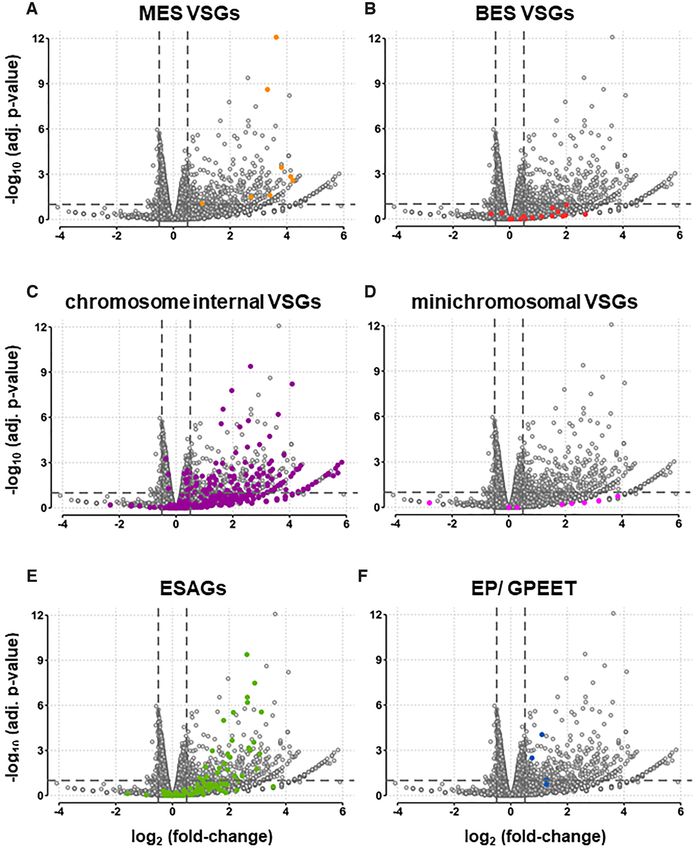
Figure 9. Increased transcription of silent VSGs present within the silent VSG sub-telomeric arrays after the induction of TbSAP RNAi for 72 h in MES-
eGFP TbSAP RNAi cells. Transcript levels (mean fragment count over three replicates) in the presence (+) of TbSAP RNAi (red line) or absence (−) of
TbSAP RNAi (black line) were mapped over the T. brucei megabase chromosomes. Below the traces gene architecture is shown, with housekeeping genes
indicated with grey bars, and silent VSGs with blue bars. Magnified detail is presented from regions within chromosomes (Chr.) 4, 6, 8 and 9. These include
regions within the silent VSG arrays present at the heterozygous transcriptionally silent aneuploid chromosomal arms (Hetero. arm). Alternatively, these
regions are within the homologous transcriptionally active diploid chromosomal cores (Homo.core). In order to display on the log scale, counts of 0 have
been set to 0.2).Nucleic Acids Research, 2021 17
(10,12). However, derepression of BES promoters predom-
inantly resulted in only limited transcription immediately
downstream of the promoters comparable to what was ob-
served after knocking down the ISWI and FACT complexes
(67,68) or the histone chaperones ASF1A/ CAF1B (69).
It is likely that derepressed elongating RNA polymerases
are hindered by a RAP1 mediated silencing gradient ex-
tending upwards from the inactive BES telomeres of blood-
stream form T. brucei preventing fully processive transcrip-
tion (70,71).
Downloaded from https://academic.oup.com/nar/advance-article/doi/10.1093/nar/gkab109/6154463 by guest on 01 April 2021
Although knockdown of TbSAP led to some derepres-
sion of BES promoters, our RNAi library screens selecting
for MES repressors did not identify any of the known BES
repressors (reviewed in (13)). This argues that repression of
MESs is mechanistically different from the repression of in-
active BESs in bloodstream form T. brucei. The immediate
vicinity of the BES telomere (within several kb of the telom-
ere repeats) is more stringently silenced than upstream sub-
telomeric regions in bloodstream form T. brucei (72). As the
MES transcription units are normally within 5 kb of the
telomere end, it is possible that they are all kept repressed
by this localised telomeric silencing gradient in bloodstream
form T. brucei. In contrast, BES promoters, which are nor-
mally 30–60 kb upstream of the telomere repeats, would be
expected to be out of range of this localised telomeric re-
pression. It would be interesting to determine the nature of
the telomeric silencing gradients operating in metacyclic T.
brucei, where MES monoallelic exclusion operates, and only
one MES escapes silencing in any given cell.
TbSAP is the only SAP domain containing protein iden-
tifiable in the T brucei genome. The SAP DNA binding do-
main comprises a two-helical bundle which was first found
on the scaffold attachment proteins SAF-A and SAF-B,
Figure 10. Multiple up-regulated VSGs are present on the cell surface fol- which bind chromosomal nuclear scaffold attachment re-
lowing the induction of TbSAP RNAi (A) Quantitative proteomic analysis gions (SARs) (73,74). SARs are discrete AT-rich DNA ele-
using mass spectrometry of surface VSGs cleaved by release of endogenous
GPI-PLC after hypotonic lysis. Samples are from the parental VSG221 ex- ments, which are thought to allow compartmentalisation of
pressing SM221pur MES-GFP cells (MES-GFP) or cells where TbSAP the eukaryotic genome into different regions of chromatin
RNAi has been induced with tetracycline (Tet) for the time indicated in through chromosomal attachment to the nuclear scaffold.
hours (h). VSG221 expressed from the active BES1 is omitted from the The SAP DNA binding motif was subsequently found on
BES VSGs dataset, as it displayed an abundance of 95–99% in each sample.
In these cell lines MES VSG653 is expressed from readthrough transcrip-
nuclear proteins with diverse roles including transcription,
tion from an ectopic rDNA promoter introduced upstream of the VSG653 DNA repair and RNA processing. The broad range of func-
gene. The different classes of VSGs are indicated with coloured bars, with tions of these SAP domain containing proteins, suggest that
MES VSG653 indicated with a blue bar, other MES VSGs (purple), BES the SAP domain along with other elements present in each
VSGs (green bar) or VSGs in chromosome internal (CI) silent VSG arrays of these proteins may dictate their distinct functionality.
(black). Data are the mean of three biological replicates. (B) As in panel (A)
only both MES VSG653 and VSG221 are omitted from the VSG dataset, Both the SAP domain found in unicellular and multicel-
as together they made up >99% of the sample. Different types of VSGs lular eukaryotes, and the highly related LEM motif found
(present in either MESs or BESs) are indicated with coloured bars, with exclusively in metazoans, are present on proteins tethering
VSGs not located in ESs indicated as CI VSGs (grey and black bars). Data chromatin to the nuclear lamina (52). Compatible with a
are the mean of three biological replicates.
role in silencing telomeres, TbSAP was enriched at the nu-
clear periphery, possibly sequestering genomic areas con-
taining silent VSGs to this region of low transcriptional ac-
of ESAGs within the immediate vicinity of the silent BES tivity. Although the heterogeneous distribution of SAP at
promoters. All of these data argue that in bloodstream form the nuclear periphery was reminiscent of telomeric clusters,
T. brucei, TbSAP could be a repressive chromatin protein, we did not see obvious colocalisation of TbSAP with the T.
which plays a key role in maintaining a transcriptionally in- brucei telomere binding protein TbTRF. In addition, we did
active state at genomic regions containing silent VSGs. not find evidence that knockdown of TbSAP led to redistri-
Knockdown of TbSAP resulted in derepression of both bution of T. brucei telomeres within the nucleus, as inves-
MES and BES promoters, despite the fact that BES pro- tigated using telomere DNA-FISH. However, most of the
moters are 30–60 kb upstream of the chromosome end telomeric signal in these experiments was presumably de-
compared with MES promoters which are normally in rived from the telomeres of the ∼100 mini-chromosomes,
the immediate proximity (1–2 kb) of the telomeric VSG which distribute differently to the 11 diploid megabase chro-You can also read