Medial septal GABAergic neurons reduce seizure duration upon optogenetic closed-loop stimulation
←
→
Page content transcription
If your browser does not render page correctly, please read the page content below
doi:10.1093/brain/awab042                                                                                     BRAIN 2021: 144; 1576–1589             | 1576

Medial septal GABAergic neurons reduce
seizure duration upon optogenetic
closed-loop stimulation

                                                                                                                                                              Downloaded from https://academic.oup.com/brain/article/144/5/1576/6188981 by guest on 11 August 2021
Katerina Hristova,1,2,† Cristina Martinez-Gonzalez,1,2,† Thomas C. Watson,1,2,†
 Neela K. Codadu,1,2 Kevan Hashemi,3 Peter C. Kind,1,2 Matthew F. Nolan1,2 and
 Alfredo Gonzalez-Sulser1,2

†
 These authors contributed equally to this work.
See Magloire and Lignani (doi:10.1093/brain/awab051) for a scientific commentary on this article.

Seizures can emerge from multiple or large foci in temporal lobe epilepsy, complicating focally targeted strategies
such as surgical resection or the modulation of the activity of specific hippocampal neuronal populations through
genetic or optogenetic techniques. Here, we evaluate a strategy in which optogenetic activation of medial septal
GABAergic neurons, which provide extensive projections throughout the hippocampus, is used to control seizures.
We utilized the chronic intrahippocampal kainate mouse model of temporal lobe epilepsy, which results in spon-
taneous seizures and as is often the case in human patients, presents with hippocampal sclerosis. Medial septal
GABAergic neuron populations were immunohistochemically labelled and were not reduced in epileptic condi-
tions. Genetic labelling with mRuby of medial septal GABAergic neuron synaptic puncta and imaging across the
rostral to caudal extent of the hippocampus, also indicated an unchanged number of putative synapses in epi-
lepsy. Furthermore, optogenetic stimulation of medial septal GABAergic neurons consistently modulated oscilla-
tions across multiple hippocampal locations in control and epileptic conditions. Finally, wireless optogenetic
stimulation of medial septal GABAergic neurons, upon electrographic detection of spontaneous hippocampal seiz-
ures, resulted in reduced seizure durations. We propose medial septal GABAergic neurons as a novel target for
optogenetic control of seizures in temporal lobe epilepsy.

    1 Centre for Discovery Brain Sciences, Simons Initiative for the Developing Brain, Patrick Wild Centre, University of
      Edinburgh, Edinburgh, UK
    2 Simons Initiative for the Developing Brain and Patrick Wild Centre, University of Edinburgh, Edinburgh, UK
    3 Open Source Instruments, Watertown MA, USA

Correspondence to: Alfredo Gonzalez-Sulser
Centre for Discovery Brain Sciences, Simons Initiative for the Developing Brain, Patrick Wild
Centre, University of Edinburgh, Edinburgh, UK
E-mail: agonzal2@ed.ac.uk

Keywords: medial septum GABAergic neurons; temporal lobe epilepsy; network stimulation; optogenetics; wireless
closed-loop intervention
Abbreviations: AAV = adeno-associated virus; LFP = local field potential; MSGN = medial septal GABAergic neuron;
PLV = phase locking value; TLE = temporal lobe epilepsy

Received August 11, 2020. Revised November 16, 2020. Accepted December 06, 2020. Advance access publication March 26, 2021
C The Author(s) (2021). Published by Oxford University Press on behalf of the Guarantors of Brain.
V
This is an Open Access article distributed under the terms of the Creative Commons Attribution License (http://creativecommons.org/licenses/by/4.0/), which
permits unrestricted reuse, distribution, and reproduction in any medium, provided the original work is properly cited.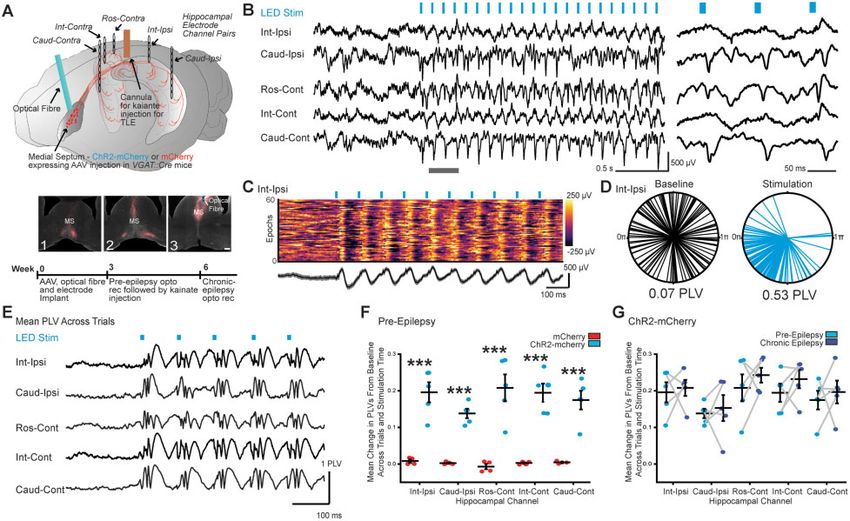
Medial septal GABA neuron stimulation blocks seizures                                             BRAIN 2021: 144; 1576–1589          | 1577

Introduction                                                             Materials and methods
New treatment strategies are needed for temporal lobe epilepsy           Animals
(TLE) as one-third of patients do not achieve seizure control with
anti-epileptic drugs.1–3 Seizures in TLE can originate from              All animal procedures were undertaken in accordance with the
extended or multiple foci and can follow varied propagation pat-         University of Edinburgh animal welfare committee regulations
terns throughout the hippocampal formation.4–6 Surgical resec-           and were performed under a UK Home Office project license. Six to
tion is effective in a majority of patients.7 However, when it fails     18-week-old male and female VGAT-IRES-Cre mice [strain name:
to control seizures, it is hypothesized that insufficient tissue is      Slc32a1tm2(cre)Lowl, Jackson Labs; stock number: 028862] were
removed.8 An alternative option is to modulate the activity of           crossed with C57Bl6J (RRID:IMSR_JAX:000664) mice to maintain the
specific brain areas or neuronal populations to block seizures. For      line heterozygous at the transgene insertion locus.
example, deep brain stimulation has recently been approved for
treating pharmacologically intractable seizures.9 Furthermore,           Viral injection and surgery
techniques that target specific neuronal populations within the
hippocampus through genetic manipulation such as overexpres-             Mice were anaesthetized with isoflurane and mounted on a

                                                                                                                                                  Downloaded from https://academic.oup.com/brain/article/144/5/1576/6188981 by guest on 11 August 2021
sion of potassium channels, chemogenetics and optogenetics               stereotaxic frame (David Kopf Instruments). Adeno-associated
are able to block seizures or reduce their duration in various           virus (AAV) expressing either mRuby conjugated to synaptophy-
TLE animal models and could be translated to the clinic.10–14            sin and membrane-bound green fluorescent protein (GFP) under
However, directly targeting cellular populations across the              the control of the synapsin promotor (AAV-hSyn-Flex-mGFP-2A-
hippocampal formation, with its bilateral organization and large         Synaptophysin-mRuby, Addgene plasmid 71760, serotype 1/2,
volume, may not be the most effective strategy if only a small           packaged into AAV),31 channelrhodopsin-2 (ChR2) conjugated to
component of the seizure foci is controlled. A potential alterna-        mCherry        [AAV-EF1a-DIO-hChR2(H134R)-mCherry-WPRE-pA,
tive approach to treating TLE is to target neuronal populations          serotype 5, Addgene plasmid 20297 purchased from University of
that can powerfully modulate the activity across the larger epi-         North Carolina Vector Core, USA] or mCherry (AAV-EF1a-fDIO-
leptogenic network.                                                      mCherry, serotype 5, Addgene plasmid 114471, purchased from
    Medial septal GABAergic neurons (MSGNs) may be a suitable            University of North Carolina Vector Core, USA) was injected
population for stimulation to block seizures. MSGNs send                 through a craniotomy (0.6 mm rostral, 0.0 mm caudal to bregma).
extensive projections across the hippocampal formation and tar-          Two injections of 450 nl were made (3.4 and 3.2 mm ventral from
get GABAergic cells in structures critical for seizure initiation        the brain surface).
and propagation such as the hilus in the dentate gyrus, the                 A guide cannula (polar fused silica tubing length = 10 mm,
subiculum and the medial entorhinal cortex.11,14–18 MSGNs                Ø = 0.32 mm, Sigma-Aldrich) for later kainate injection was
are necessary for normal oscillatory activity in the hippocampus         implanted over the left hippocampus (1.9 mm caudal, 1.2 mm lat-
and their activation can modulate hippocampal network                    eral from bregma and 1.4 mm ventral from the brain surface).
rhythms.19–23
    The medial septum also receives direct inputs from the hippo-        Surgery for tethered optogenetic stimulation and
campus, it is one of the first structures to which seizures spread to
                                                                         multisite recordings
in TLE models and its activity is correlated with that of the hippo-
campus      in    physiological    and    epileptic   conditions.24–27   After viral injection and cannula placement, an optical fibre
Furthermore, the medial septum itself is a small midline area that       (PlexBright Fibre Stub, length = 13 mm, Ø = 200/230, 0.66NA,
can be easily targeted for modulation with techniques such as            Plexon) was implanted (0.6 mm rostral, 0.2 mm lateral from
deep brain stimulation or gene therapy.                                  bregma and 2.6 mm ventral at a 4.5 angle from the brain surface)
    A recent study suggests that cholinergic medial septal neuron        over the medial septum. Pairs of local LFP electrodes (Ø = 50.8 lm,
stimulation reduces seizure activity via excitation of hippocampal       Teflon insulated stainless steel, A-M systems) were implanted tar-
somatostatin GABAergic neurons, while targeting MSGNs appears            geting the molecular layer of the dentate gyrus in five locations
ineffective in a kindling model where seizures are generated in re-      across the rostral-to-caudal extent of the hippocampus (contralateral
sponse to electrical stimulation.28                                      to implanted cannula: 1.85 mm caudal, 1.25 mm lateral from bregma
    Here, we evaluated the feasibility of optogenetic stimulation of     and 1.40 mm ventral from brain surface; bilaterally: 2.3 mm caudal,
MSGNs to stop seizures in a chronic TLE model which closely              1.8 mm lateral from bregma and 2.0 mm ventral from the brain sur-
approximates the disease, as pathological hippocampal sclerosis          face; bilaterally: 3.3 mm caudal, 3.3 mm lateral from bregma and 2.9
develops, and seizures resistant to several anti-epileptic drugs         mm ventral from the brain surface). Two miniature ground screws
occur spontaneously.29,30 We tested a transient stimulation strat-       (Yahata Neji, M1 Pan Head Stainless Steel Cross, RS Components)
egy where stimulation occurs in response to a computer-detected          were attached over the cerebellum (5.0 mm caudal, 2 mm lateral) to
seizure, that is likely to have less adverse effects than continuous     serve as ground as well as three additional screws for structural sup-
stimulation. We found that MSGNs and their connections are               port. The electrodes were attached to an electronic interface board
maintained in this model. We show that optogenetic stimulation           (EIB-16, Neuralynx). The cannula, optical fibre and electrode assem-
of MSGNs can effectively modulate local field potential (LFP) activ-     blies were fixed to the skull using a combination of UV activated ce-
ity across the hippocampal network in conditions of chronic epi-         ment (3M Relyx Unicem 2 Automix, Henry Schein) and dental
lepsy and does not negatively affect ongoing behaviour. We then          cement (Simplex Rapid, Kemdent).
developed a technique for chronic wireless optogenetics and elec-
trophysiology that allowed us to stimulate MSGNs upon detection
                                                                         Surgery for wireless optogenetic stimulation and
of spontaneous hippocampal seizures. We found that wireless
closed-loop stimulation of MSGNs decreased seizure durations.
                                                                         hippocampal seizure monitoring
Together, our results suggest that optogenetic stimulation of            After viral injection and cannula placement, a wireless optogenetic
MSGNs may be a feasible strategy for suppression of currently in-        device was implanted.32 The main body of the device, consisting of a
tractable seizures.                                                      9.8 mm diameter circular conductive receiver and surface-mounted
1578    | BRAIN 2021: 144; 1576–1589                                                                                       K. Hristova et al.

capacitor and rectifier to power the LED when located in an inductive      (Supplementary Table 2). Finally, sections were rinsed several
field, was placed on the skull. A micro-LED at the injectable needle tip   times in PBS and mounted onto slides.
of the device (470 nm emission wavelength, needle length = 4 mm,                Confocal images for fluorescence were taken with a Nikon A1
LED dimensions in micrometres: 270  220  50, Neurolux) was               or a Zeiss LSM800 confocal. For medial septal analysis, three cor-
implanted lateral to the medial septum (0.6 mm RC, 0.15 mm lateral         onal levels at 0.85, 0.7 and 0.5 mm rostral to bregma were imaged.
to bregma and 3.3 mm ventral from the brain surface). A battery-pow-       Stacks of images (24 mm, 2 mm z-steps) containing the medial sep-
ered single-channel electrophysiology transmitter (A3028B, Open            tum were acquired using a 20 Plan Apo VC DIC N2 objective. For
Source Instruments) was implanted subcutaneously on the back of            hippocampal synaptophysin puncta analysis, four anatomical lev-
the mouse and the signal and ground leads were tunnelled under the         els caudal to bregma were selected at 1.82 mm, 2.3 mm, 2.85 mm
skin to the skull. The signal lead was connected to an LFP electrode       and 3.28 mm and six images (1 mm optical slice) at each level were
(Ø = 127 lm, Teflon insulated platinum-iridium, Science Products) tar-     taken from medial and lateral CA1 in stratum oriens and strata
geting the molecular layer of the dentate gyrus implanted ipsilaterally    radiatum/lacunosum moleculare, CA3 stratum radiatum and the
to the cannula at an intermediate rostral to caudal location (2.3 mm       hilus within the dentate gyrus at each plane (Supplementary Fig.
caudal, 1.8 mm lateral and 2.0 mm ventral from the brain surface).         2). Images were acquired using a Plan Apo 40  oil DIC H objective.
The ground lead was placed on the cortical surface in the contralat-            To evaluate AAV axonal expression and the anatomical

                                                                                                                                                  Downloaded from https://academic.oup.com/brain/article/144/5/1576/6188981 by guest on 11 August 2021
eral hemisphere (3.2 mm caudal, 3.0 mm lateral and 0.1 mm ventral          location of electrodes, optical devices and cannulas in
from the brain surface) and held in place by a miniature screw             electrophysiological experiments, tiled fluorescent images were
(Yahata Neji, M1 Pan Head Stainless Steel Cross, RS Components).           acquired across all brain slices containing the medial septum and
Two additional screws were placed for structural support. The can-         hippocampus using a Zeiss Axio Scan.Z1 microscope and a Plan-
nula, wireless optical device and electrode assemblies were fixed to       Apochromat 10 /0.45 M27 objective. Only mice expressing fluoro-
the skull using a combination of UV activated cement (3M Relyx             phores bilaterally within the medial septum and displaying hippo-
Unicem 2 Automix, Henry Schein) and dental cement (Simplex                 campal sclerosis were included in further analyses.
Rapid, Kemdent).                                                                For histological analysis, researchers were blinded to treat-
                                                                           ment. Quantification of medial septum virus expression and
                                                                           immunolabelled neurons was performed with FIJI-ImageJ (NIH).
Seizure induction                                                          Synaptic puncta were automatically counted with Imaris (Oxford
                                                                           Instruments) with the Spots module by setting an automated
Mice were allowed to recover from surgery for at least 1 week before       threshold at 0.77 mm. Puncta counts were normalized to the
induction of status epilepticus, which leads to hippocampal scler-         number of fluorophore-expressing cells in the medial septum and
osis and chronic spontaneous seizures after 2 weeks.30 Mice were          the area imaged at each level (159.1 mm2 for the hilus and 954.6
anaesthetized with isoflurane and were injected with 1 ml of 5%            mm2 for the hippocampus as a whole).
dextrose saline, to prevent dehydration during status epilepticus.              Contrast and brightness for images in figures was adjusted
Kainate (100 nl, 20 mM in saline, Tocris) was infused into the left        with FIJI-ImageJ (NIH).
dorsal hippocampus targeting the molecular layer of the dentate
gyrus, via an injection cannula (internal cannula with 0.2 mm pro-
jection for a 1.6 mm ventral from the brain surface, PlasticsOne),         Multisite tethered recordings and optogenetic
through the previously implanted guide cannula resulting in status         stimulation
epilepticus. Chronic seizure manifestation was not confirmed in
mice to be utilized solely for anatomical analyses or in experiments       Mice were placed in 50  50 cm square arenas and connected for
to test functionality of MSGN optical stimulation to entrain hippo-        recordings to an RHD 16-channel recording headstage (Intantech)
campal-wide oscillations. However, behavioural manifestations of           through an electrical commutator (Adafruit) and an acquisition
status epilepticus upon kainate injection and hippocampal sclerosis        board (OpenEphys). LFP signals were sampled at 1 kHz and refer-
had to be present for inclusion in the study.                              enced to ground. Mice were connected to a fibre-coupled LED (blue
                                                                           = 465 nm, Plexon) via optical patch cords which directed the light
                                                                           to a 1 mm optical ferrule (Plexon) and the ceramic sleeve of the
                                                                           previously surgically implanted optical fibre. The power of the LED
Immunohistochemistry and imaging                                           was calibrated to emit an irradiance at the implanted fibre stub
Mice were anaesthetized with isoflurane followed by a lethal dose          tips of 12.7 to 31.9 mW/mm2. One hundred and twenty epochs of
of sodium pentobarbital and transcardially perfused with phos-             10-ms long square pulses at 10 Hz were applied for 30 s with an
phate-buffered saline (PBS; Invitrogen) followed by 4% paraformal-         interval of 2 min between epochs in both non-epileptic and epilep-
dehyde (PFA; Sigma Aldrich) in 0.1 M phosphate buffer (Sigma               tic conditions utilizing a Master-8 (AMPI). Mice were video-
Aldrich). Brains were removed and post-fixed overnight in 4% PFA,          recorded during stimulation sessions at 10 frames/s (C270 HD web-
then rinsed in PBS and incubated overnight in 30% sucrose in PBS.          cam, Logitech).
Tissue was then placed in Optimum Cutting Temperature (OCT)                    Quantification of LFP entrainment upon MSGN optical stimula-
embedding matrix and sliced coronally in 60-mm thick sections              tion was performed by calculating phase locking values (PLVs), the
using a freezing vibratome. Free-floating sections of the entire           phase-angle difference clustering in polar space across trials.
medial septum and hippocampus were collected and stored in PBS             Analysis was performed utilizing custom-made Python scripts. As
with sodium azide 0.05% (Sigma Aldrich) at 4 C until used.                wiring failure during surgery occurred in some leads, traces from
    Sections were rinsed in PBS, then permeabilized with 0.3%              all electrodes were checked visually and electrodes with an absent
TritonTM X-100 (Sigma-Aldrich) in PBS (PBST). Selected anatomical          signal were discarded. LFP traces from electrode pairs at individual
levels of the hippocampus were incubated overnight in Neurotrace           hippocampal locations were visually identical. Therefore, when
(1:500; 640/660 or 500/525 or 400/450; Life Technologies) in PBST at       both electrodes were available, the one used for analysis was
4 C. Selected anatomical levels of the medial septum were incu-           picked randomly. To extract phase angle information across 30 s
bated overnight in primary antibodies mixed in PBST at 4 C                stimulation and prestimulation baseline data across all frequency
(Supplementary Table 1), sections were then rinsed and incubated           bands, the Hilbert transform was applied to LED and LFP channel
in secondary antibodies mixed in PBST overnight at 4 C                    voltage traces using the apply_hilbert function from the Python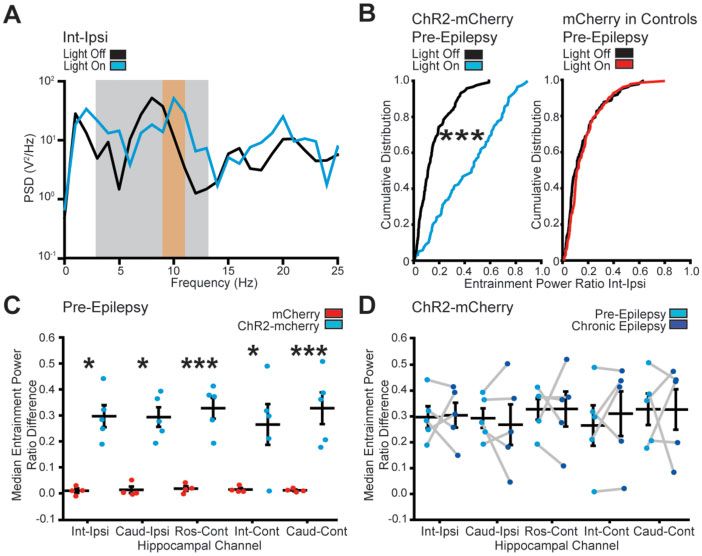
Medial septal GABA neuron stimulation blocks seizures                                            BRAIN 2021: 144; 1576–1589           | 1579

MNE toolbox. Phase angles were then calculated using the SciPy          met, the detection algorithm time-stamped a seizure for later re-
angle function and differences between the LED and individual LFP       view and in 50% of seizures (randomized) triggered the activation
electrodes were calculated using the following equation:                of the wireless LED device implanted in the mouse, via a TTL pulse
                                                                        from the octal data receiver to the power distribution control box,
                           Xn                                           resulting in 30 s of stimulation of 10 ms square pulses at 10 Hz at
                     n1          eið1LEDðtÞ 1ElectrodeðtÞ Þ     (1)
                            t¼1                                         an estimated irradiance of 5 mW/mm2. Electrophysiological seiz-
                                                                        ure durations were analysed off-line by trained experimenters
in which n is the number of time points, t is the trial number and      blinded to LED status and virus injected. Only mice expressing flu-
ØLED and ØElectrode are phase angles from the LED and analysed          orophores bilaterally within the medial septum, hippocampal
electrode.33,34 Phase angle differences were then multiplied by the     sclerosis and detected electrographic seizures were included in the
imaginary operator and averaged per time point across trials. The       analyses.
PLV mean value was obtained by calculating the average absolute             Behavioural seizures were scored utilizing a modified six-point
phase angle difference value across all trial-averaged epoch time       Racine’s scale37: 1 = mouth or facial automatisms; 2 = two or less
points. Mean PLV baseline values were then subtracted from              myoclonic jerks; 3 = three or more myoclonic jerks and/or forelimb
stimulation epochs for statistical comparison.                          clonus; 4 = tonic-clonic forelimb and back extension; 5 = tonic-

                                                                                                                                                   Downloaded from https://academic.oup.com/brain/article/144/5/1576/6188981 by guest on 11 August 2021
    Power spectral density (PSD) was calculated for each 30 s base-     clonic forelimb and back extension with rearing and collapsing;
line and stimulation LFP using the SciPy Python function                and 6 = tonic-clonic forelimb and back extension with wild run-
Periodogram.35 Entrainment of the signal to the 10 Hz stimulation       ning or jumping.
was quantified as the ratio of the cumulative PSD around the op-
tical stimulation frequency (±1 Hz) to the cumulative PSD in the 3
to 13 Hz band.19                                                        Online electrographic seizure identification
    Quantification of behaviour during optical stimulation in multi-
                                                                        Data were recorded and analysed online in 1-s time intervals and
site tethered recordings was performed post hoc through manual
                                                                        compared to a library of previously recorded seizures from an ini-
analysis of videos. Concurrent LFP analysis was used to ascertain
                                                                        tial cohort of mice (n = 4) with spontaneous chronic seizures 2
whether animals were asleep when lack of movement was
                                                                        weeks after intrahippocampal kainate using the following meas-
detected. For trials when animals were not moving, 5 s of LFP pres-
                                                                        urements: (i) coastline: the sum of the absolute changes in voltage
timulation trials were plotted and visually assessed. Animals were
                                                                        values in an interval; (ii) intermittency: the fraction of the coastline
classified as awake if the presence of low amplitude LFP activity
                                                                        generated by the 10% largest steps in an interval; (iii) spikiness: the
was detected, or classed as asleep if high amplitude low-frequency
                                                                        ratio of the maximum voltage range across all 19.6-ms bins in a 1-s
(53 Hz) oscillations (non-REM sleep) or theta frequency (4–12 Hz)
                                                                        time interval to the median range value across the entire interval;
oscillations (REM sleep) were present.36 Behaviour was viewed as
                                                                        and (iv) coherence: the fraction of the voltage area under the curve
the action an animal was engaged in at the start of and throughout
                                                                        occupied by the 10 largest peaks and trough pairs in an interval.
optical stimulation, including grooming, eating, exploring, quiet
                                                                        Measurements were then converted into bounded sigmoidal val-
rest or sleep. When the action of the animal did not change
                                                                        ues and compared in real time with a library of previously
throughout the trial, the continuous action was assessed for
                                                                        recorded seizures. If a threshold of similarity of 0.1 across all met-
changes in speed.
                                                                        rics was crossed, an interval was classified as a seizure. Three con-
    Analyses were performed blinded to virus injected. Only mice
                                                                        secutive seizure intervals resulted in a seizure timestamp
expressing fluorophores bilaterally within the medial septum and
                                                                        resulting in random activation of the optical device in 50% of seiz-
displaying hippocampal sclerosis were included in analyses. The
                                                                        ures. The code and further details about the analysis are available
analysis code is available at: https://github.com/Gonzalez-Sulser-
                                                                        at: http://www.opensourceinstruments.com/Electronics/A3018/Sei
Team/Entrainment-Analysis.
                                                                        zure_Detection.html#Closed%20Loop%20with%20ECP20.

MSGN closed-loop optogenetic stimulation to                             Statistical analysis
modulate seizure duration                                               Pilot experiments were performed on three to four animals to es-
We injected mice with kainate 1 week after the initial surgery and      tablish a rationale for the sample size. All statistical analyses were
we began seizure detection at least 2 weeks after injection, to allow   performed using OriginPro software. Normality of groups was
for the establishment of chronic spontaneous seizures and hippo-        assessed with the Shapiro-Wilk test. The anatomical effects of kai-
campal sclerosis, which we confirmed anatomically post hoc. At          nate compared to saline on medial septal neuronal populations
least 2 weeks after kainate injection, mice were placed in a home       and MSGN projections to the hippocampus were compared using a
cage installed with loop induction antennas connected to a tuner        two-way ANOVA with a Tukey post hoc test. Comparisons of mean
box and a power distribution control box (Neurolux), to inductively     PLVs and median entrainment efficiency of mCherry-ChR2 with
power the previously surgically implanted wireless optogenetic          mCherry control mice in pre-epileptic conditions across electrodes
devices upon seizure detection. The home cage and optical stimu-        were performed with a two-way ANOVA with a Tukey post hoc test.
lation equipment were placed within an FE2F Faraday enclosure           Control and epileptic conditions in mCherry-ChR2 expressing mice
(Open Source Instruments) adjacent to LFP receiver antennas con-        and onset delays across electrodes in control and epileptic condi-
nected externally to an octal data receiver, LWDAQ driver (Open         tions were compared with a repeated measures two-way ANOVA
Source Instruments) and a recording computer. Continuous LFP            with a Tukey post hoc test. The distribution of seizure durations
signals (512 Hz acquisition rate, LWDAQ software, Open Source           and the distribution of stimulation epochs in light off and light on
Instruments) and video at (10 frames/s, C270 HD webcam,                 conditions in individual mice were compared using a Kolmogorov-
Logitech) were recorded for a single mouse at a time for 1–2 weeks      Smirnov test. Median seizure duration distributions across all seiz-
depending on wireless electrophysiology transmitter battery. LFP        ures in mCherry-ChR2 or mCherry control expressing mice in light
signals were analysed in real-time by a PC running a custom-made        off and light on conditions and, median interseizure intervals were
LWDAQ seizure detection algorithm to determine the presence of          compared with a paired Wilcoxon signed-rank test. Comparisons
spontaneous seizures (see below). When the required criteria were       of percent light off and light on epochs with behavioural changes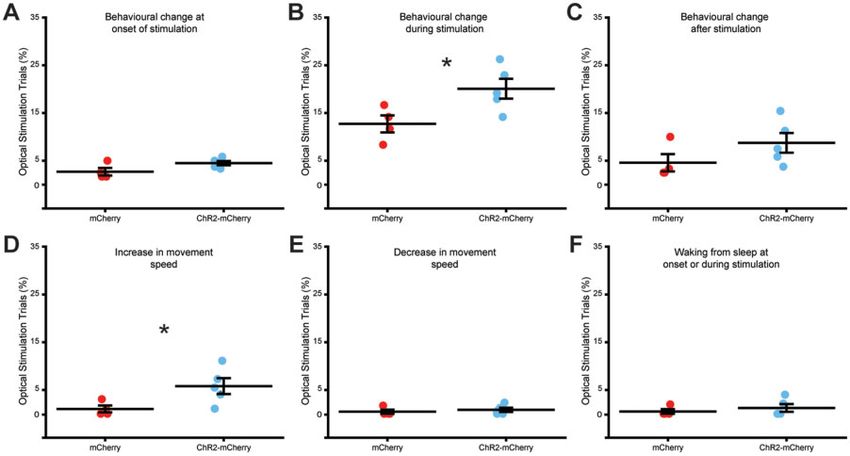
1580    | BRAIN 2021: 144; 1576–1589                                                                                          K. Hristova et al.

and comparison of normalized median seizure duration changes               hippocampi in controls, across the rostral to caudal extent of both
between light off and light on between mCherry-ChR2 and mCherry            the hilus in the dentate gyrus (two-way ANOVA, P = 0.57 F = 0.87, df
control expressing mice, were performed using two-sample t-tests.          = 11, n = 5 saline and 5 kainate treated mice; Fig. 1E and F), an area
Median behavioural seizure severity was compared with a paired             critical for seizure propagation,11,44–46 and the hippocampus as a
t-test.                                                                    whole (two-way ANOVA, P = 0.79, F = 0.63, df = 11, n = 5 saline and 5
                                                                           kainate treated mice) (Fig. 1F and Supplementary Fig. 2B). The overall
                                                                           survival of putative synapses indicates that MSGN stimulation may
Data availability                                                          be capable of influencing hippocampal oscillatory activity in TLE.
All Python and LWDAQ scripts are freely available. The data that
support the findings of this study are available from the corre-
sponding author, upon reasonable request.
                                                                           Hippocampal-wide LFP modulation by MSGN
                                                                           optogenetic stimulation in TLE with hippocampal
Results                                                                    sclerosis
Anatomical assessment of MSGNs and their                                   To test whether MSGN hippocampal projections remain functional

                                                                                                                                                      Downloaded from https://academic.oup.com/brain/article/144/5/1576/6188981 by guest on 11 August 2021
projections in chronic TLE with hippocampal                                in epileptic conditions with hippocampal sclerosis, we determined
sclerosis                                                                  whether MSGN optogenetic stimulation can modulate oscillatory
                                                                           activity bilaterally across the rostral to caudal extent of the hippo-
We first determined if MSGNs can be specifically labelled using            campus. We injected AAV encoding channelrhodopsin-2 fused to
transgenic mice in which Cre expression is controlled by the pro-          mCherry (ChR2-mCherry) or, in controls, encoding only mCherry
moter of the vesicular GABAergic transporter (VGAT::Cre) in com-           in the medial septum of VGAT::Cre mice. We found that over 90%
bination with injected AAVs expressing Cre-dependent                       of cell bodies expressing virally delivered mCherry co-labelled
transgenes. We injected a Cre-dependent AAV encoding mRuby                 with GABA in animals injected with AAV encoding ChR2-mCherry
conjuated to synaptophysin, to allow us to image putative synaptic         or mCherry only (n = 3 mice; Supplementary Fig. 1D).
puncta, and membrane-bound GFP,38 into the medial septum of                    In experimental animals, seizures were induced by delivery of
VGAT::Cre mice (Fig. 1A and B). We found that cell bodies in the           kainate through a cannula targeting the dorsal hippocampus. To
medial septum that express virally delivered mRuby and GFP were            enable activation of ChR2-expressing neurons, we implanted an
also labelled with immunohistochemical markers of MSGN subpo-              optical fibre over the medial septum. To record hippocampal LFP
pulations15,20,39,40 including GABA, parvalbumin (PV) and calbindin        activity we implanted electrodes in five locations in the molecular
(CB) (n = 3 mice; Fig. 1B and Supplementary Fig. 1D). Neurons that         layer of the dentate gyrus, an area critical for gating the spread of
expressed the virally delivered markers were not co-labelled with          seizures11,44–46; one location was contralateral to the cannula at
antibodies against choline acetyl transferase (ChAT), which labels         the same rostral-to-caudal level and two additional locations were
cholinergic neurons in the medial septum (n = 3 mice;                      ipsi- and contralateral to the cannula at progressively more ventral
Supplementary Fig. 1D).                                                    locations (Fig. 2A, see Supplementary Fig. 3 for confirmed optical
    We assessed the susceptibility of MSGNs to hippocampal scler-          fibre and electrode histological locations). Three weeks after sur-
osis in the intrahippocampal kainate TLE model. After viral injec-         gery, to allow for viral expression, mice were connected to tethered
tion into the medial septum, we implanted mice with a cannula              amplifiers and LEDs and were placed in square arenas for
over the hippocampus and injected kainate 1 week after surgery to          recordings.
induce seizures. Three weeks after seizure induction, and consist-             To test whether we could modulate network oscillations across
ent with previous studies,30,41,42 we observed hippocampal scler-          the hippocampal formation in non-epileptic conditions, we stimu-
osis and expansion of the dentate gyrus granule cell layer (Fig. 1D        lated MSGNs prior to seizure induction. We used a stimulation fre-
and E).30,42 We found that there was no reduction in the number of         quency of 10 Hz, which is in the range of normally occurring theta
MSGNs expressing VGAT (mRuby-GFP expressing cells in AAV                   oscillations and LFP spiking activity during seizures. We performed
injected VGAT::Cre mice) or immunohistochemically labelled                 10 Hz optical stimulation for 30 s with a 90-s interval between
GABA, PV and CB, or in the number of ChAT-expressing cells when            epochs. In mice injected with AAV encoding ChR2-mCherry, the
compared to saline injected controls (two-way ANOVA with a                 onset of stimulation produced a shift in LFP oscillations at all record-
Tukey post hoc test, P = 0.58, F = 0.31, df = 1, n of saline and kainate   ing locations that matched the 10 Hz stimulation frequency and was
treated mice per cell type, respectively: mRuby-GFP labelled cells         consistent across epochs (Fig. 2B, C and Supplementary Fig. 4).
in VGAT::Cre mice n = 6, 7 GABA n = 3, 5; PV, CB, ChAT n = 4, 4)               To quantify the effect of rhythmic MSGN stimulation upon hip-
(Fig. 1B, C and Supplementary Fig. 1C). Therefore, MSGNS are struc-        pocampal activity we compared phase locking statistics between
turally resilient to kainate-induced hippocampal sclerosis.                mice expressing ChR2 in MSGNs with control mice expressing
    We tested if putative synaptic connections from MSGNs to the           mCherry. We calculated the PLVs of each LFP trace to LED stimula-
hippocampus are reduced in TLE with hippocampal sclerosis. We              tion at every sampling time point across trials in baseline and
imaged across the rostral to caudal axis of the hippocampus and            stimulation periods; the PLV metric approaches 1 when there is lit-
found that MSGN GFP-labelled axons and mRuby puncta marking                tle phase difference and 0 if the signals are unrelated at each time
putative pre-synapses accumulated in or close to the pyramidal             point across trials (Fig. 2D).33,34 Trial-averaged PLVs increased after
and granule cell layers, lacunosum moleculare and in the hilus of          LED stimulation across all channels (Fig. 2E). The average baseline-
the dentate gyrus, areas where hippocampal GABAergic cell bodies           subtracted PLV across trials and all trial sampling time points was
are located (Fig. 1D, E and Supplementary Fig. 2A and B).43 Mice           significantly higher across all electrode locations in mice express-
received a unilateral injection of kainate to induce chronic seizures      ing ChR2-mCherry when compared to mCherry expressing control
and hippocampal sclerosis, or saline, in controls, and were sacri-         mice (two-way ANOVA, Tukey post hoc test, P = 0.002, 0.002, 0.0006,
ficed 21 days after injection to perform histological analysis             0.009, 0.0004 for intermediate-ipsilateral, caudal-ipsilateral, ros-
(Fig. 1A). We found no significant reduction in the number of puta-        tral-contralateral, intermediate-contralateral, caudal-contralateral
tive synapses from MSGNs when comparing both ipsilateral and               electrode locations, respectively, df = 4, F = 0.18, n = 120 trials per
contralateral hippocampi in kainate-treated animals to ipsilateral         mouse, n = 5 mice, Fig. 2F).
Medial septal GABA neuron stimulation blocks seizures BRAIN 2021: 144; 1576–1589 | 1581
Downloaded from https://academic.oup.com/brain/article/144/5/1576/6188981 by guest on 11 August 2021
Figure 1 MSGNs and their connections across the hippocampus remain despite hippocampal sclerosis. (A) Top: Schematic of viral expression and
cannula placement. Cre-dependent GFP and mRuby conjugated to synaptophsyin were expressed in MSGNs by AAV injection into medial septum of
VGAT::cre mice. A cannula was implanted for kainate or vehicle (saline) unilateral injection over rostral-dorsal hippocampus. Numbers correspond to
approximate hippocampal rostral-caudal levels imaged for puncta analysis. Bottom: Experimental timeline. (B) Representative GFP-mRuby AAV ex-
pression in MSGNs and staining for Neurotrace and GABA in saline and kainate treated mice. Scale bar = 50 mm. Examples of neurons expressing GFP,
mRuby or GABA (arrows) and neurons not expressing GFP, mRuby or GABA (arrowheads). We found 96.16 ± 6.46% of mRuby-GFP expressing cells co-
expressed GABA. (C) Neuronal populations in saline and kainate treated mice. Horizontal lines indicate mean values [mean ± standard error of the
mean (SEM)]. Points correspond to values from individual mice. Populations were not significantly decreased in kainate-treated mice when compared
to saline-treated controls (two-way ANOVA, P = 0.58, F = 0.31, df = 1, n of saline and kainate treated mice per cell type, respectively: mRuby-GFP
labelled cells in VGAT::Cre mice n = 6, 7; GABA n = 3, 5; PV, CB, ChAT n = 4, 4). (D) Representative hippocampal sections of rostral-caudal levels stained
with fluorescent Neurotrace are shown in a saline-injected mouse, and the contralateral and ipsilateral hippocampi of a kainate-injected mouse.
Scale bars = 200 mm. Expression of GFP (green) in MSGN axons across the hippocampus and sclerosis in rostral slices ipsilateral to kainate injection.
(E) Putative synaptic terminals expressing mRuby in the hilus at second rostral-caudal level contralateral and ipsilateral to kainate injection (dashed
white boxes in D). Scale bar = 10 mm. (F) Density of synaptic terminals across rostral-caudal levels in the hilus and the entire hippocampus in saline-
treated mice and contralateral and ipsilateral hippocampi of kainate-treated mice. Bars indicate mean (mean ± SEM). Points correspond to values
from individual mice. Synaptic density did not decrease in kainate-treated mice (two-way ANOVA, P = 0.57, F = 0.87, df = 11, n = 5 mice per treatment).
Puncta counts were reported normalized to the number of virus-labelled cells in medial septum.
To evaluate entrainment of hippocampal LFPs by MSGN stimu- was significantly higher across all electrode locations in mice
lation we calculated the ratio of LFP power at the stimulation fre- expressing ChR2-mCherry when compared to mCherry control
quency (10 ± 1 Hz), to the LFP power across a wide frequency range mice (two-way ANOVA, Tukey post hoc test, P = 0.013, 0.020, 0.008,
(3–13 Hz; Fig. 3A). Similar to previous reports,19,23 in pre-epileptic 0.049, 0.005 for intermediate-ipsilateral, caudal-ipsilateral, rostral-
conditions, we found that all individual mice expressing ChR2- contralateral, intermediate-contralateral, caudal-contralateral
mCherry in MSGNs had a highly significant increase in the en- electrode locations, respectively; df = 4, F = 0.18, n = 120 trials per
trainment power ratio upon optical stimulation when compared to mouse, n = 5 mice) (Fig. 3C). Together, the PLV and entrainment
baseline epochs at the intermediate ipsilateral channel analyses indicate that MSGN rhythmic optogenetic stimulation is
(Kolmogorov-Smirnov test, n = 120 stimulation epochs per mouse, capable of pacing oscillations bilaterally throughout the rostral to
n = 5 mice, P = 9.19 10–14, 3.5 10–25, 2.95 10–11, 3.61 10–21 caudal extent of the hippocampus.
and 3.41 10–43) (Fig. 3B). We did not detect a shift to higher en- We next used PLV analysis to quantify whether MSGN activa-
trainment values in any individual control mice expressing only tion effectively modulates hippocampal activity in conditions of
mCherry in MSGNs (Kolmogorov-Smirnov test, 120 stimulation chronic epilepsy with hippocampal sclerosis. We injected kainate
epochs per mouse, n = 4 mice, P = 0.06, 0.26, 0.62, 0.26) (Fig. 3B). We through the previously implanted cannula and mice were recorded
calculated the efficiency of optogenetic pacing by subtracting the 3 weeks after injection to allow for the establishment of hippocam-
baseline entrainment ratio from the entrainment ratio during pal sclerosis, which we confirmed in post hoc anatomical analysis
stimulation at each epoch. The median entrainment efficiency (Supplementary Fig. 3A). We again stimulated MSGNs with 10 Hz1582 | BRAIN 2021: 144; 1576–1589 K. Hristova et al.
Downloaded from https://academic.oup.com/brain/article/144/5/1576/6188981 by guest on 11 August 2021
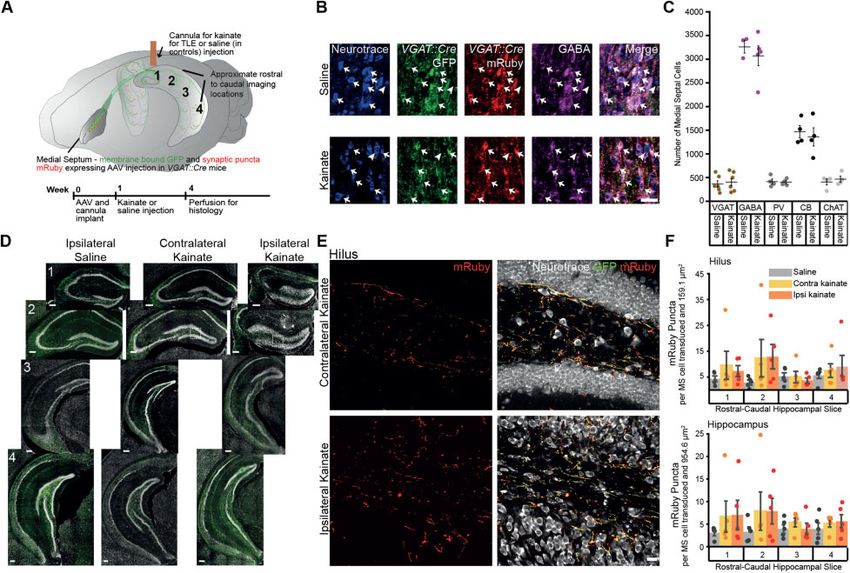
Figure 2 Entrainment of oscillations across the hippocampus by optical stimulation of MSGNs despite hippocampal sclerosis. (A) Top: Schematic of
viral expression and implantation of optical fibre, electrodes and cannula. Cre-dependent ChR2-mCherry or mCherry were expressed in MSGNs by
AAV injection into medial septum of VGAT::cre mice. An optical fibre for MSGN stimulation, a cannula for kainate injection and pairs of electrodes for
tethered recordings rostral contralateral to cannula (Ros-Cont) and bilaterally at intermediate (Int-Ipsi and Int-Cont) and caudal (Caud-Ipsi and Caud-
Cont) locations were implanted. Bottom: ChR2-mCherry expressed in the medial septum in rostral to caudal slices (1–3) with optical fibre track. Scale
bar = 100 mm. (B) Representative LFP traces in a chronically epileptic mouse from hippocampal channels before and after onset of 10 Hz theta optical
MSGN stimulation (left) and expanded time view over grey bar in left panel (right). (C) Top: Colour-coded voltage traces for 60 example consecutive
epochs. Bottom: Average (black line) and standard deviation (grey) of example epochs. (D) Example polar-plot of LED-LFP phase-angle differences
across trials (individual lines) at one sampling time point, 35 ms after start of baseline or stimulation epochs from one mouse. Mean PLVs calculated
from clustering of phase-angle differences across trials are indicated. (E) PLVs over time averaged across trials before and during stimulation for all
electrodes in example mouse. (F) Plot of baseline-subtracted mean PLVs across all stimulation times and epochs in mice expressing mCherry or
ChR2-mCherry in MSGNs. Horizontal lines indicate mean values (mean ± SEM). Points correspond to mean values from individual mice. The PLV was
significantly higher across all electrodes in ChR2-mCherry expressing mice when compared to mCherry controls (***P 5 0.0001; two-way ANOVA,
Tukey post hoc test, n = 5 mice per treatment). (G) Plot of baseline-subtracted mean PLVs across all times and epochs per electrode in conditions pre-
ceding and 21 days after kainate injection in ChR2-mCherry expressing mice. Horizontal lines indicate mean values (mean ± SEM). Points correspond
to mean values from individual mice. Hippocampal sclerosis did not diminish the capacity of MSGN optical stimulation to entrain hippocampal oscil-
lations (two-way ANOVA repeated measures, P 4 0.05, n = 5 mice).
medial septal optical stimulation. We found that hippocampal exploring, quiet rest and sleep, we saw changes in 521% of stimu-
sclerosis had no obvious effect on modulation of hippocampal lation trials (Fig. 4 and Supplementary Fig. 5). There was no signifi-
oscillations by optogenetic stimulation of MSGNs across electrodes cant difference in the percentage of stimulation epochs between
(Supplementary Fig. 4) including at the intermediate-ipsilateral lo- mCherry and ChR2-mCherry expressing animals, counting both
cation, where seizures are frequently recorded in the intrahippo- pre-epileptic and epileptic conditions, in changes in behaviour at
campal kainate TLE model.5,47 We also found no change in PLVs the onset (two-sample t-test two-sided, df = 7, T = –2.09, P = 0.07,
when compared to pre-epileptic conditions (two-way repeated n = 4 mCherry and 5 mCherry-ChR2; Fig. 4A) or at the end of stimu-
measures ANOVA, df = 4, F = 0.40498, P = 0.55912, n = 120 epochs lation (two-sample t-test two-sided, df = 7, T = –1.47, P = 0.19, n = 4
per mouse, n = 5 mice) (Fig. 2G). Furthermore, the entrainment effi- mCherry and 5 mCherry-ChR2; Fig. 4C). There was a 7.4% increase
ciency of MSGN rhythmic optical stimulation over hippocampal in the percentage of trials with a change of ongoing behaviour
oscillations was not significantly reduced in any electrode loca- throughout the duration of stimulation in mCherry-ChR2 express-
tions when comparing epileptic to baseline conditions (two-way ing animals (two-sample t-test two-sided, df = 7, T = –2.61, P = 0.03,
repeated measures ANOVA, df = 4, F = 0.01, P = 0.91 Tukey post hoc n = 4 mCherry and 5 mCherry-ChR2; Fig. 4B), although this was still
test, n = 120 baseline and stimulation epochs per condition, n = 5 in a minority of trials. Similarly, there was an increase in the speed
mice) (Fig. 3D). of the ongoing movement throughout the stimulation in mCherry-
We performed manual video analysis to assess whether MSGN ChR2 expressing mice, albeit only in 5.8% of the trials (two-sample t-
optical stimulation is associated with adverse behavioural effects. test two-sided, df = 7, T = –2.39, P = 0.04, n = 4 mCherry and 5
We did not record instances of spasms or motor seizures upon mCherry-ChR2; Fig. 4D). There was no difference between mCherry
stimulation in mCherry-only or ChR2-mCherry expressing animals and ChR2-mCherry animals in the percentage of stimulations in
in pre-epileptic or chronically epileptic conditions. Across the mul- which a movement’s speed decreased (two-sample t-test two-sided,
tiple behaviours we analysed including grooming, eating, df = 7, T = –0.63, P = 0.55, n = 4 mCherry and 5 mCherry-ChR2; Fig. 4E)Medial septal GABA neuron stimulation blocks seizures BRAIN 2021: 144; 1576–1589 | 1583
Downloaded from https://academic.oup.com/brain/article/144/5/1576/6188981 by guest on 11 August 2021
Figure 3 Entrainment ratio analysis of hippocampal oscillations during MSGN stimulation. (A) Example power spectral density (PSD) plot displaying
LFP power plotted against frequency during a baseline—light off epoch (black line) and a stimulation—light on epoch (blue). Note, entrainment ratio
is calculated by dividing the cumulative power in the stimulation range (orange bar) by the cumulative power at the extended theta range (grey bar).
(B) Example cumulative probability distributions of entrainment power ratio at the intermediate ipsilateral electrode across all epochs in individual
mice expressing ChR2-mCherry (left) or mCherry only (right) in pre-epileptic conditions. The amplitude ratios were significantly increased during
optogenetic stimulation in all mice expressing ChR2-mCherry, but not in mCherry expressing controls (Kolmogorov-Smirnov Test, n = 120 stimula-
tion epochs per mouse, ***P 5 0.0001). (C) Plot of the median entrainment power ratio difference between light on and light off trials per electrode in
mice expressing mCherry or ChR2-mCherry. Horizontal lines indicate mean values (mean ± SEM). Points correspond to median values from individ-
ual mice. The entrainment efficiency was significantly higher across all electrodes in ChR2-mCherry expressing mice when compared to mCherry
expressing mice (two-way ANOVA, Tukey post hoc test, P = 0.013, 0.020, 0.008, 0.049, 0.005 for intermediate-ipsilateral, caudal-ipsilateral, rostral-
contralateral, intermediate-contralateral, caudal-contralateral electrode locations, respectively, df = 4, F = 0.18, n = 120 trials per mouse, n = 5 mice)
*P 5 0.05; ***P 5 0.0001. (D) Plot of the median entrainment power ratio difference between light on and light off trials per electrode in conditions pre-
ceding and 21 days after kainate in ChR2-mCherry expressing mice. Horizontal lines indicate mean values (mean ± SEM). Points correspond
to median values from individual mice. Chronic seizures did not diminish the capacity of MSGN optical stimulation to entrain oscillations in
the hippocampus (two-way repeated measures ANOVA, df = 4, F = 0.01, P = 0.91 Tukey post hoc test, n = 120 baseline and stimulation epochs per
condition, n = 5 mice).
or in the number of times an animal woke from sleep throughout the controls in the medial septum of VGAT::Cre mice (Fig. 5A). To allow
stimulation (two-sample t-test two-sided, df = 7, T = –0.73, P = 0.05, for chronic closed-loop stimulation upon seizure detection to be per-
n = 4 mCherry and 5 mCherry-ChR2; Fig. 4F). There were no signifi- formed in freely moving mice, we implanted a wireless optogenetic
cant differences in any behavioural measures between pre-epilepsy device, equipped with a needle fitted with a micro-LED on the tip, ad-
and chronic epilepsy conditions in ChR2-mCherry expressing ani- jacent to the medial septum. We implanted a cannula for unilateral
mals (paired t-tests two-sided, df = 4, T = 2.44, 2.12, –0.30, 2.53, 1.80 kainate injection over the rostral hippocampus to induce chronic
and –1, P = 0.07, 0.10, 0.78, 0.06, 1.81 and 0.37 for behaviour change at seizures. An LFP electrode targeting the molecular layer of the den-
onset, change during, change at end, speed increase, speed decrease tate gyrus in the hippocampus was placed at an intermediate ros-
and wake from sleep, respectively) (Supplementary Fig. 5). These tral-to-caudal location ipsilateral to the site of kainate injection,
data suggest that the adverse behavioural effects of MSGN optical where electrographic seizures can frequently be detected5,48 (Fig. 5A,
stimulation are minimal. see Supplementary Fig. 6 for confirmed optical device and electrode
Together, these results demonstrate that MSGNs remain func- histological locations). The LFP electrode was connected to a sub-
tional despite hippocampal sclerosis in conditions of chronic TLE cutaneous transmitter in the back of each mouse. We performed on-
and can modulate hippocampal LFP oscillations with minor adverse line electrographic seizure detection using a custom-made algorithm
effects on behaviour. As such, stimulation of MSGNs may be able to that allowed for accurate and rapid closed-loop functionality
disrupt ongoing epileptic seizures. (Supplementary material). The program activated the LED on 50% of
randomly selected seizures, as in previous closed-loop stimulation
studies.5,11,13,49
Decrease in seizure duration upon wireless closed-
We found that optogenetic stimulation of MSGNs for 30 s at 10
loop stimulation of MSGNs Hz effectively reduced electrographic seizure durations when com-
As in hippocampal-wide LFP modulation experiments, we injected pared to no stimulation in five of seven mice injected with AAV
Cre-dependent AAV encoding ChR2-mCherry or mCherry-only in expressing mCherry-ChR2 (Kolmogorov-Smirnov test two-sided,1584 | BRAIN 2021: 144; 1576–1589 K. Hristova et al.
Downloaded from https://academic.oup.com/brain/article/144/5/1576/6188981 by guest on 11 August 2021
Figure 4 Behavioural effects of MSGN optical stimulation. (A) Plot of percentage of optical stimulation trials in which a behavioural change occurs at
stimulation onset in mice expressing mCherry or ChR2-mCherry in MSGNs. Horizontal lines indicate mean values (mean ± SEM). Points correspond
to percentage from individual mice. There was no significant difference between mCherry and ChR2-mCherry expressing mice (two-sample t-test
two-sided, df = 7, T = –2.09, P = 0.07, n = 4 mCherry and 5 mCherry-ChR2). (B) Plot of percentage of optical stimulation trials in which a behavioural
change occurs throughout the trial in mice expressing mCherry or ChR2-mCherry in MSGNs. Horizontal lines indicate mean values (mean ± SEM).
Points correspond to percentage from individual mice. ChR2-mCherry expressing mice had a significantly higher percentage (two-sample t-test two-
sided, df = 7, T = –2.61, P = 0.03, n = 4 mCherry and 5 mCherry-ChR2). (C) Plot of percentage of optical stimulation trials in which a behavioural change
occurs at the end of stimulation in mice expressing mCherry or ChR2-mCherry in MSGNs. Horizontal lines indicate mean values (mean ± SEM). Points
correspond to percentage from individual mice. There was no significant difference between mCherry and ChR2-mCherry expressing mice (two-sam-
ple t-test two-sided, df = 7, T = –1.47, P = 0.19, n = 4 mCherry and 5 mCherry-ChR2). (D) Plot of percentage of optical stimulation trials in which there
is an increase in movement speed throughout the trial in mice expressing mCherry or ChR2-mCherry in MSGNs. Horizontal lines indicate mean val-
ues (mean ± SEM). Points correspond to percentage from individual mice. ChR2-mCherry expressing mice had a significantly higher percentage (two-
sample t-test two-sided, df = 7, T = –2.39, P = 0.04, n = 4 mCherry and 5 mCherry-ChR2). (E) Plot of percentage of optical stimulation trials in which
there is a decrease in movement speed throughout the trial in mice expressing mCherry or ChR2-mCherry in MSGNs. Horizontal lines indicate mean
values (mean ± SEM). Points correspond to percentage from individual mice. There was no significant difference between mCherry and ChR2-
mCherry expressing mice (two-sample t-test two-sided, df = 7, T = –0.63, P = 0.55, n = 4 mCherry and 5 mCherry-ChR2). (F) Plot of percentage of optical
stimulation trials in which there is an increase in behavioural speed throughout the trial in mice expressing mCherry or ChR2-mCherry in MSGNs.
Horizontal lines indicate mean values (mean ± SEM). Points correspond to percentage from individual mice. ChR2-mCherry expressing mice had a
significantly higher percentage (two-sample t-test two-sided, df = 7, T = –0.73, P = 0.05, n = 4 mCherry and 5 mCherry-ChR2).
P = 0.002, 0.02, 0.03, 0.045, 0.005, 0.71 and 0.56 for seizure duration cerebellar PV neurons,13 we analysed the distribution of intervals be-
comparison in each mouse, n = 7 mice with 196, 139, 134, 114, 135, tween seizures. However, we found that there was no significant
61 and 37 seizures recorded in each, respectively) (Fig. 5B and C). change in the median interval following stimulation during a seizure
Furthermore, we found that median seizure durations across the versus when a seizure was not stimulated in ChR2-mCherry
group of mice were significantly shorter upon optical stimulation expressing animals (paired Wilcoxon signed-rank test two-sided,
when compared to no-stimulation (paired Wilcoxon signed-rank W = 17, Z = 0.42, P = 0.67, n = 7 mice; Supplementary Fig. 7A), suggest-
test, two-sided, W = 26, P = 0.047, n = 7 mice; Fig. 5C). In contrast, ing that the effects of stimulation are limited to ongoing seizures.
optical stimulation in control mice expressing only mCherry in Seizures with behavioural effects are also prevalent in this TLE
MSGNs had no effect on electrographic seizure durations in any of model.30,50 There was a non-significant trend towards a reduction
the individual mice tested (Kolmogorov-Smirnov test two-sided, in median seizure severity upon optogenetic stimulation of
P = 0.12, 0.40, 0.39 and 0.57 for seizure duration comparison in each MSGNs when compared to no-stimulation seizures (paired t-test
mouse, n = 4 mice with 18, 51, 78 and 219 seizures recorded in two-sided, T = 2.36, df = 6, P = 0.06, n = 7 mice; Supplementary Fig.
each, respectively) (Fig. 5D). Similarly, there was no effect on the 7B). We attempted to quantify whether optogenetic stimulation
median seizure duration as a group of mice (paired Wilcoxon lead to a change in the frequency of tonic-clonic generalized motor
signed-rank test two-sided, W = 6, Z = 0.18, n = 4 mice, P = 0.86; seizures, as performed in recent studies,5,11 however the occur-
Fig. 5D). Finally, we found that the median change in seizure dur- rence of these events is low and necessitates recordings over a
ation normalized to light off detected seizures was significantly month in duration to record a sufficient number of seizures. We
reduced in ChR2-mCherry expressing mice when compared to were limited by the battery of our current wireless transmitters,
mCherry expressing controls (two-sample t-test two-sided, df = 9, which do not permit more than 3-week recordings and conse-
T = 2.4 P = 0.04, n = 4 mCherry and 7 mCherry-ChR2 expressing quently recorded few tonic-clonic seizures in most animals
mice; Fig 5E). (Supplementary Fig. 7C).
To test whether seizure blockade has a lasting effect on the epi- Together, these results show that MSGN wireless closed-loop
leptic network, as has been reported following activation of optical stimulation can reduce the duration of spontaneousMedial septal GABA neuron stimulation blocks seizures BRAIN 2021: 144; 1576–1589 | 1585
Downloaded from https://academic.oup.com/brain/article/144/5/1576/6188981 by guest on 11 August 2021
Figure 5 Wireless closed-loop rhythmic optical MSGN stimulation reduces spontaneous seizure duration in chronic epilepsy. (A) Top: Schematic of
viral expression and implantation of wireless-LED device and LFP electrode. Cre-dependent ChR2-mCherry or mCherry were expressed in MSGNs by
AAV injection into the medial septum of VGAT::cre transgenic mice. A wireless optogenetic device was implanted lateral to the medial septum. A can-
nula for kainate injection and LFP electrode were implanted in the hippocampus, connected to a wireless electrophysiology transmitter located sub-
cutaneously over the back of the mice. Closed-loop seizure identification began at least 2 weeks after kainate injection and establishment of chronic
seizures. Middle: Neurotrace (grey) labelled sections and ChR2-mCherry (red) expressed in the medial septum (MS) and in MSGN axons in the hippo-
campus (HPC) including locations of the optical fibre (left), the cannula (middle) and the electrode track (right). Scale bars = 100 mm. Bottom:
Experimental timeline. (B) Top: Example LFP trace during detection of electrographic seizures (vertical orange bars), activating the wireless LED (blue
horizontal bar) for 30 s randomly in 50% of detected seizures. Bottom: Expanded time over grey bars in top. (C and D) Light off and light on (10 Hz
stimulation) in individual ChR2-mCherry (C) and control mCherry-only (D) expressing example mice. Cumulative probability distribution (left) and
histogram (middle) for individual mice (n = 196 and 219 seizures in ChR2-mcherry and mCherry expressing mice, respectively) (***P 5 0.002;
Kolmogorov-Smirnov test, two-sided). Plot of light on and light off group median seizure durations (right). Horizontal lines indicate mean values
(mean ± SEM) and points correspond to median values from individual mice (filled points = P 5 0.0001 Kolmogorov-Smirnov test for individually sig-
nificant mice; *P 5 0.05; paired Wilcoxon signed-rank test, two-sided, across all mice). (E) Normalized change in median seizure duration between
light off and light on conditions per mouse in mCherry and ChR2-mCherry expressing mice. Horizontal lines indicate mean values (mean ± SEM) and
points correspond to median values from individual mice. Rhythmic optical stimulation after seizure detection reduced normalized seizure durations
in mice expressing ChR2-mCherry in MSGNs (two-sample t-test, two-sided, n = 4 mCherry and 7 mCherry-ChR2 mice, *P 5 0.05).
electrographic seizures in the intrahippocampal kainate TLE in the chronic intrahippocampal kainate model, which replicates
model with hippocampal sclerosis. unilateral hippocampal sclerosis, a common feature of intractable
TLE,53–55 and spontaneously occurring seizures.30 Similarly, des-
pite a previous report showing a decrease of connective fibres be-
tween the medial septum and hippocampus in patients with TLE
Discussion with hippocampal sclerosis,28 there were no reductions in putative
We show that MSGNs and their projections throughout the rostral- synaptic connections from MSGNs in any hippocampal areas,
to-caudal extent of the hippocampus survive and remain function- including the site of kainate injection where there is most sclerotic
al as they can be optically stimulated to generate oscillations in a damage.42 The decrease in connective fibres between the medial
chronic mouse model of TLE with hippocampal sclerosis. septum and hippocampus, if replicated in the intrahippocampal
Furthermore, we found that wireless closed-loop optogenetic kainate model, may reflect the loss of other neuronal types in the
stimulation of MSGNs reduced the duration of spontaneously medial septum such as glutamatergic cells56,57 or GABAergic neu-
occurring electrographic seizures. These results reveal a novel po- rons that project to the medial septum from the hippocampus.58–60
tential target for therapy for intractable TLE. We found that MSGNs, despite hippocampal sclerosis, retained
In contrast to a previous study, where MSGNs were found to be their functionality and were able to modulate the oscillatory activ-
vulnerable in a systemic model of TLE,51 we found that MSGNs and ity throughout the rostral-to-caudal extent of the hippocampus
their projections throughout the rostral-to-caudal extent of the with electrodes implanted in the molecular layer of the dentate
hippocampus remained despite focal hippocampal sclerosis. In gyrus. Phase analysis of rhythmic activation of MSGNs showed
previous work assessing MSGN susceptibility to TLE, pilocarpine that LFP timing during stimulation was highly consistent across
was administered via intraperitoneal injection.51 Muscarinic trials. MSGNs specifically target inhibitory neurons across the hip-
receptors, which are sensitive to pilocarpine, are expressed by pocampal formation,16,18,40,61 and it is hypothesized that both nor-
MSGNs52 and their activation through systemic administration mally-occurring and optically-entrained hippocampal theta
may result in overexcitability leading to MSGN cell damage. We oscillations are mediated by MSGNs inducing rebound firing in
found that MSGNs and cholinergic populations were not reduced hippocampal GABAergic neurons, which in turn cause rhythmicYou can also read