THE EVOLUTIONARY HISTORY OF COMMON GENETIC VARIANTS INFLUENCING HUMAN CORTICAL SURFACE AREA - MPG.PURE
←
→
Page content transcription
If your browser does not render page correctly, please read the page content below
Cerebral Cortex, April 2021;31: 1873–1887

                                                                             doi: 10.1093/cercor/bhaa327
                                                                             Advance Access Publication Date: 9 December 2020
                                                                             Original Article

ORIGINAL ARTICLE

The Evolutionary History of Common Genetic Variants

                                                                                                                                                        Downloaded from https://academic.oup.com/cercor/article/31/4/1873/6027878 by guest on 08 March 2021
Influencing Human Cortical Surface Area
Amanda K. Tilot 1,2 , Ekaterina A. Khramtsova3,4 , Dan Liang5,6 ,
Katrina L. Grasby7 , Neda Jahanshad2 , Jodie Painter7 , Lucía Colodro-Conde7 ,
Janita Bralten 8 , Derrek P. Hibar9 , Penelope A. Lind7 , Siyao Liu5,6 ,
Sarah M. Brotman5,6 , Paul M. Thompson2 , Sarah E. Medland7 ,
Fabio Macciardi10 , Barbara E. Stranger3,11 , Lea K. Davis12,13,14 ,
Simon E. Fisher 1,15,† and Jason L. Stein 5,6,†
1 Language  and Genetics Department, Max Planck Institute for Psycholinguistics, Nijmegen, 6500 AH,
Netherlands, 2 Mark and Mary Stevens Neuroimaging and Informatics Institute, Keck School of Medicine,
University of Southern California, Marina del Rey, CA 90292, USA, 3 Department of Medicine, Section of Genetic
Medicine & Institute for Genomics and Systems Biology, University of Chicago, Chicago, IL 60637, USA,
4 Computational Sciences, Janssen Pharmaceuticals, Spring House, PA 19477, USA, 5 Department of Genetics,

University of North Carolina, Chapel Hill, NC 27599, USA, 6 UNC Neuroscience Center, University of North
Carolina, Chapel Hill, NC 27599, USA, 7 Psychiatric Genetics, QIMR Berghofer Medical Research Institute,
Brisbane, QLD 4006, Australia, 8 Radboud University Medical Center, 6525 XZ Nijmegen, Netherlands,
9 Genentech, Inc., South San Francisco, CA 94080, USA, 10 Department of Psychiatry and Human Behavior,

University of California, Irvine, CA 92697, USA, 11 Department of Pharmacology, Center for Genetic Medicine,
Northwestern University Feinberg School of Medicine, Chicago, IL 60611, USA, 12 Department of Medicine,
Division of Medical Genetics, Vanderbilt University Medical Center, Nashville, TN 37232, USA, 13 Department of
Psychiatry and Behavioral Sciences, Vanderbilt University Medical Center, Nashville, TN 37232, USA,
14 Vanderbilt University Medical Center, Vanderbilt Genetics Institute, Nashville, TN 37232, USA and 15 Donders

Institute for Brain, Cognition and Behaviour, Radboud University, Nijmegen, 6500 HB, Netherlands
Address correspondence to Jason L. Stein, UNC Neuroscience Center, University of North Carolina, 7202A Mary Ellen Jones Bldg, Chapel Hill, NC
27599-7250, USA. Email: jason_stein@med.unc.edu; Simon E. Fisher, Language and Genetics Department, Max Planck Institute for Psycholinguistics,
P.O. Box 310, Nijmegen, 6500 AH, The Netherlands. Email: simon.fisher@mpi.nl.

† Joint   senior authors

Abstract
Structural brain changes along the lineage leading to modern Homo sapiens contributed to our distinctive cognitive and
social abilities. However, the evolutionarily relevant molecular variants impacting key aspects of neuroanatomy are largely
unknown. Here, we integrate evolutionary annotations of the genome at diverse timescales with common variant
associations from large-scale neuroimaging genetic screens. We find that alleles with evidence of recent positive polygenic
selection over the past 2000–3000 years are associated with increased surface area (SA) of the entire cortex, as well as

© The Author(s) 2020. Published by Oxford University Press. All rights reserved. For permissions, please e-mail: journals.permission@oup.com
This is an Open Access article distributed under the terms of the Creative Commons Attribution License (http://creativecommons.org/licenses/by/4.0/),
which permits unrestricted reuse, distribution, and reproduction in any medium, provided the original work is properly cited.
1874      Cerebral Cortex, 2021, Vol. 31, No. 4

specific regions, including those involved in spoken language and visual processing. Therefore, polygenic selective
pressures impact the structure of specific cortical areas even over relatively recent timescales. Moreover, common sequence
variation within human gained enhancers active in the prenatal cortex is associated with postnatal global SA. We show
that such variation modulates the function of a regulatory element of the developmentally relevant transcription factor
HEY2 in human neural progenitor cells and is associated with structural changes in the inferior frontal cortex. These results
indicate that non-coding genomic regions active during prenatal cortical development are involved in the evolution of
human brain structure and identify novel regulatory elements and genes impacting modern human brain structure.

Key words: cortical surface area, genome-wide association study, human gained enhancers, polygenic selection

Introduction                                                          display stronger histone acetylation or methylation marks of

                                                                                                                                          Downloaded from https://academic.oup.com/cercor/article/31/4/1873/6027878 by guest on 08 March 2021
                                                                      promoters or enhancers in human cortical tissue compared
The size, shape, and neural architecture of the modern human
                                                                      with extant primates or mice (Reilly et al. 2015; Vermunt et al.
brain reflect the cumulative effects of selective pressures over
                                                                      2016), arising after our last common ancestor with Old World
evolutionary history. Analyses of fossilized skulls indicate that
                                                                      monkeys about 30 million years ago (Mya).
endocranial volume has increased dramatically on the lineage
                                                                          By themselves, these indices suggest loci of likely evolu-
that led to Homo sapiens in the over 6 million years since our last
                                                                      tionary significance in the human genome but are not infor-
common ancestor with chimpanzees (Fig. 1; Henneberg 1988;
                                                                      mative for defining which loci (if any) influence the structure
Lee and Wolpoff 2003; Jantz and Jantz 2016; Moorjani et al. 2016;
                                                                      of the human brain. We hypothesize that, for evolutionarily
Du et al. 2018). It is thought that these volumetric increases were
                                                                      relevant genetic variants that have not reached fixation, data
mainly driven by expansions of neocortical surface area (SA)
                                                                      from genome-wide association studies (GWAS) of cortical struc-
(Rakic 2009; Lui et al. 2011; Geschwind and Rakic 2013), although
                                                                      ture can help determine their potential functional impacts on
changes in other brain structures, including the cerebellum, also
                                                                      brain structure. We reason that GWAS data may shed light on
likely played a significant role (Barton and Venditti 2014; Miller
                                                                      the evolution of cortical structure by: 1) determining if alle-
et al. 2019). Beyond overall size differences, skull endocasts of
                                                                      les under selective pressure are associated with variation in
archaic hominins suggest that human-specific refinements to
                                                                      neural anatomy and 2) revealing if interindividual variation in
brain structure occurred during the last 300 000 years, most
                                                                      defined genomic regions of evolutionary significance is asso-
notably the shift toward a more globular shape (Hublin et al.
                                                                      ciated with variation in neural anatomy. Crucially, this novel
2017; Gunz et al. 2019). A commonly held view is that differen-
                                                                      approach for studying human brain evolution depends on the
tial expansion of distinct regions of the neocortex contributed
                                                                      availability of large datasets of many thousands of individuals
to the evolution of the distinctive cognitive and social abili-
                                                                      in which structural neuroimaging measures have been coupled
ties of our species (Rakic 2009; Lui et al. 2011; Geschwind and
                                                                      to genome-wide genotyping. In this regard, we take advantage
Rakic 2013). Neuroanatomical changes in our ancestors were
                                                                      of recent large-scale GWAS work from the Enhancing Neu-
accompanied by increasingly sophisticated tool use, the emer-
                                                                      roImaging Genetics through Meta Analysis (ENIGMA) consor-
gence of proficient spoken language, world-wide migrations,
                                                                      tium (Grasby et al. 2020), including data from the UK Biobank
and the development of agriculture, among other innovations
                                                                      (Elliott et al. 2018), which identified hundreds of genetic loci
(Pääbo 2014).
                                                                      associated with interindividual variability in human cortical
    Several studies have identified fixed genomic differences
                                                                      structure in living populations. Thus, here, we integrate genomic
that may have impacted aspects of brain structure along our
                                                                      annotations spanning 30 million years of our evolutionary his-
lineage (Enard 2016; Sousa et al. 2017; Mitchell and Silver 2018),
                                                                      tory with data from a GWAS meta-analysis of cortical SA in over
but the genetic variation that shaped the cortex across human
                                                                      33 000 modern humans (Grasby et al. 2020) to assess the aggre-
evolution is still largely undetermined. In the present study, we
                                                                      gate impact of each annotation on modern variation in cortical
adopt a novel strategy to uncover genetic variants that have
                                                                      SA and identify genetic variants within these annotations with
contributed to anatomical features of the modern human brain.
                                                                      notable effects on human neural development.
To do so, we identify loci of defined evolutionary relevance in the
genome and assess the effects of those loci on cortical structure
through large-scale neuroimaging genetics. Comparative                Materials and Methods
genomic and population genetic annotations from multiple
                                                                      Genome-Wide Association Summary Statistics
sources have been used to identify evolutionarily relevant loci
in the human genome across diverse time scales (Fig. 1; Pollard,      Summary statistics for 35 cortical SA phenotypes (global SA
Salama, King, et al. 2006a; Vernot and Akey 2014; Reilly et al.       and average bilateral SA for 34 regions) were obtained from a
2015; Field et al. 2016; Simonti et al. 2016; Vermunt et al. 2016;    European ancestry discovery sample of the ENIGMA cortical SA
Nielsen et al. 2017; Peyrégne et al. 2017). Two annotations of        meta-analysis (Grasby et al. 2020) including data from the UK
particular note capture distinct periods in human history. The        Biobank (UKBB) (Elliott et al. 2018). For comparative purposes,
singleton density score (SDS) uses genome sequencing data to          corresponding summary statistics for cortical thickness were
identify haplotypes with a decreased accumulation of singleton        also obtained from the same source. We focused our analyses on
variants in the population being studied, providing evidence          SA given its particular expansion during hominid evolution, well
for polygenic natural selection acting over the past ∼2000–3000       established in prior literature, but as a comparison also show
years (Field et al. 2016). On a deeper time scale, human-gained       results from analyses of thickness in the Supplementary Mate-
enhancers (HGEs) represent gene regulatory elements that              rials. Details of image segmentation, genotyping, imputation,
Common Variant Cortical Evolution                   Tilot et al.       1875

                                                                                                                                                                             Downloaded from https://academic.oup.com/cercor/article/31/4/1873/6027878 by guest on 08 March 2021
Figure 1. Overview of human evolution and timeframes captured by different sets of analyses in this study. Size and shading of circles indicates average endocranial
volume [H. habilis volume from Klein (2009), all other hominin volumes are averaged from Neubauer et al. (2018). P. troglodytes volume from Neubauer et al. (2012) and
M. mulatta volume is an average from Isler et al. (2008)], and their vertical position indicates the age of the specimen [an average in the case of the Neubauer et al.
(2018) hominin endocasts]. Numbers next to the H. sapiens circles indicate the geologic age group from Neubauer et al. (2018). Vertical lines ref lect the approximate
timeframe of the hominin species (right). Evolutionary time is presented in log10 scale (Mya, million years ago; kya, thousand years ago). Different types of evolutionary
annotations are indicated, identifying genomic loci that underwent changes over different time frames (left, blue text). Horizontal spacing between species does not
convey genetic distance, geological time, or any other metric.

association, and meta-analysis are found in the primary GWAS                            release v3 reference panel. When conducting associations of
meta-analysis reference (Grasby et al. 2020). Briefly, magnetic                         gyrally defined regions, the global measure of SA was included
resonance images of the brain were segmented with FreeSurfer                            as a covariate, in order to test for genetic influences that were
(Dale et al. 1999) using a gyrally defined atlas (Desikan et al.                        specific to each region. The original association models also
2006), and visually quality checked based on guidelines provided                        included four multidimensional scaling components to help
at the ENIGMA website (http://enigma.ini.usc.edu/research/gwa                           control for ancestry, as well as linear and nonlinear correc-
sma-of-cortical-measures/). Imputation of genome-wide geno-                             tions for age and sex, diagnostic status, and scanner. Fixed
typing arrays was conducted to the 1000 Genomes phase 1                                 effects meta-analysis was used to combine effects across all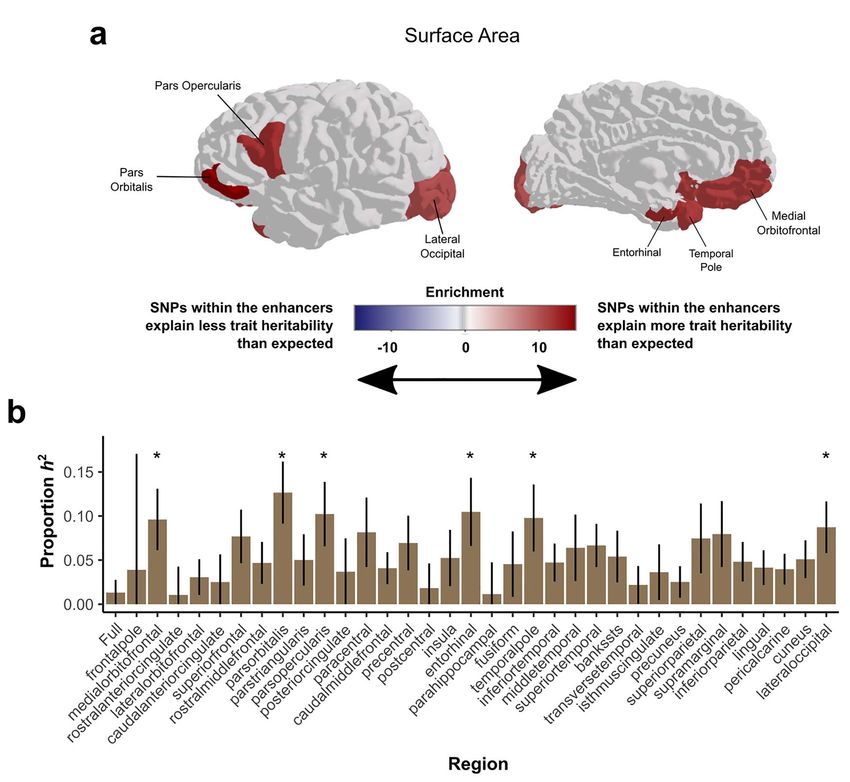
1876      Cerebral Cortex, 2021, Vol. 31, No. 4

sites contributing to the analysis (Willer et al. 2010). All analyses   Genetic Correlations
were performed on summary statistics without genomic control
                                                                        Genetic correlations of ancestry-regressed cortical structure
(Bacanu et al. 2000) correction applied.
                                                                        with height (Supplementary Fig. 6) were calculated using LDSC
                                                                        regression (Bulik-Sullivan, Finucane, et al. 2015a). Summary
Ancestry Regression                                                     statistics for height were acquired from previously published
                                                                        work (Wood et al. 2014).
We first determined the impact of subtle population stratifi-
cation on each GWAS summary statistics dataset, in light of
studies showing that such stratification can confound estimates         SDS Implementation
of selection (Berg et al. 2018; Sohail et al. 2019). First, all unre-   SDSs (Field et al. 2016) for each SNP were downloaded
lated subjects [defined in Gazal et al. (2015)] were selected from      from https://datadryad.org/resource/doi:10.5061/dryad.kd58f.
1000 Genomes Phase 3 data (1000 Genomes Project Consortium              Ancestry-regressed summary statistics (without any signif-
et al. 2015). We then selected single nucleotide polymorphisms          icance thresholding) were merged with SDS scores by rsID
(SNPs) that had a minor allele frequency (MAF) > 5% in 1000             and ensured that the SDS value describes the trait increasing

                                                                                                                                               Downloaded from https://academic.oup.com/cercor/article/31/4/1873/6027878 by guest on 08 March 2021
Genomes and that were not located in the major histocompati-            allele (tSDS). The ancestry-regressed Z-score was calculated as
bility complex (MHC) locus, the chromosome 8 inversion region,          the ancestry-regressed beta divided by the ancestry-regressed
or regions of long linkage disequilibrium (LD). LD-independent          standard error. Merged files were then sorted by chromosomal
SNPs (r2 < 0.2) were selected via pruning using a window size           position, and block jackknife Spearman’s correlation with
500 kb and a slide of 100 kb (PLINK—indep-pairwise 500 100              100 blocks was used to determine the relationship between
0.2). Principal component (PC) analysis was performed in PLINK          ancestry-regressed Z-scores and tSDS values. The Benjamini
(Chang et al. 2015) on the 264 339 remaining SNPs. In order             Hochberg false discovery rate (FDR) correction was used to
to obtain SNP PC loadings for all SNPs in the 1000 genomes              correct for multiple comparisons across each of the 35 GWASs
project (MAF < 0.05, MHC locus, the chromosome 8 inversion              used. Results were plotted on a representative brain surface
region, or regions of long LD removed), we performed linear             using the R/plotly package, where the correlation values were
regressions of the PC scores on the genotype allele count of each       only shown for significant associations after FDR correction
SNP (after controlling for sex) and used the resulting regression       (FDR adjusted P-value < 0.05; see Fig. 3a). These analyses were
coefficients as the SNP PC loading estimates. This procedure            run in two additional ways: 1) without ancestry regression
followed that used in previous work (Sohail et al. 2019). For the       on the full ENIGMA SA GWASs in Figure 3b; and 2) without
first 20 PCs, the weighting of the PCs for each subject was used as     ancestry regression in the UKBB dataset subset to only European
a trait and tested for association with each subject’s genotype in      individuals, which is less susceptible to the impact of population
PLINK. For each SNP, across all 20 PCs, we identified the degree        stratification due to the combination of effects across many
of association of that SNP to population frequency differences          sites, as in the larger ENIGMA analysis (N = 9923; Supplementary
along that principal axis of variation (Beta_PCs). After merging        Fig. 7). The same analyses were also completed for cortical
summary statistics of each SA GWAS without genomic control              thickness in Supplementary Figure 8.
(Bacanu et al. 2000) correction (Beta_strat) with Beta_PC values,
ensuring beta values were with respect to the same effect allele,
and sorting based on chromosomal position, a block jackknife            Partitioned Heritability
correlation with 1000 blocks approach was used to assess the            The contributions of each SNP set to the total SNP heritability
correlation between Beta_strat and Beta_PCs, shown in Figure 2a         of each trait were determined using partitioned heritability
and Supplementary Figure 1.                                             analyses as implemented in the LDSC software package
    We then implemented an ancestry regression procedure fol-           (Finucane et al. 2015). Enrichment of heritability within HARs
lowing previous work (Bhatia et al. 2016). We used a regression         (Capra et al. 2013), selective sweep regions (Peyrégne et al. 2017),
model fitting each set of SA GWAS summary statistics with-              Neanderthal-introgressed SNPs (Vernot and Akey 2014), and
out genomic control correction (Beta_strat) simultaneously to           Neanderthal-depleted regions (Vernot et al. 2016) all controlled
the 20 Beta_PC values calculated as described above using the           for the baselineLD v2 model from the original LDSC study
lm() function in R (v3.2.3). The residuals of this model (Beta_r)       (Finucane et al. 2015). Heritability enrichment in fetal brain
were used as ancestry-corrected effect sizes. Ancestry-corrected        HGEs (Reilly et al. 2015) controlled for both the baseline model
standard errors and P-values were calculated following the same         and a set of fetal brain active regulatory elements (E081) from
prior work (Bhatia et al. 2016). The same block jackknife correla-      the Epigenomics Roadmap resource. Heritability enrichment in
tion method was used to assess the impact of subtle population          adult brain HGEs (Vermunt et al. 2016) controlled for both the
stratification by correlating Beta_r with Beta_PC in Figure 2b and      baseline model and adult brain active regulatory elements (E073)
Supplementary Figure 2. The same analyses were completed for            from the Epigenomics Roadmap resource. Active regulatory
cortical thickness (Supplementary Figs 3 and 4).                        elements were defined using chromHMM (Ernst and Kellis 2012)
    We evaluated an additional measure of population stratifi-          marks from the 15 state models including all the following
cation, the LD-score regression (LDSC) intercept (Bulik-Sullivan,       annotations: 1_TssA, 2_TssAFlnk, and 7_Enh, 6_EnhG.
Finucane, et al. 2015a), before and after ancestry regression
(Fig. 2c, Supplementary Fig. 5). The summary statistics (with or
                                                                        Gene Annotations
without ancestry regression, as above) were first written into a
standard format using munge_sumstats.py. Then, precomputed              Gene sets impacted by genetic variation within any HGE were
LD scores from 1000 Genomes Phase 3 (using only HapMap3                 derived separately for 1) global SA or 2) any of the 34 regional
SNPs, excluding the MHC region) were downloaded from the                SA loci. We first identified all SNPs within 10 000 kb of a
LDSC website (https://github.com/bulik/ldsc) and implemented            nominally significant (P-value < 5 × 10⁻⁸ ) GWAS locus with
according to the guidelines given there.                                r2 > 0.6 in the 1000G EUR population to the index SNP, using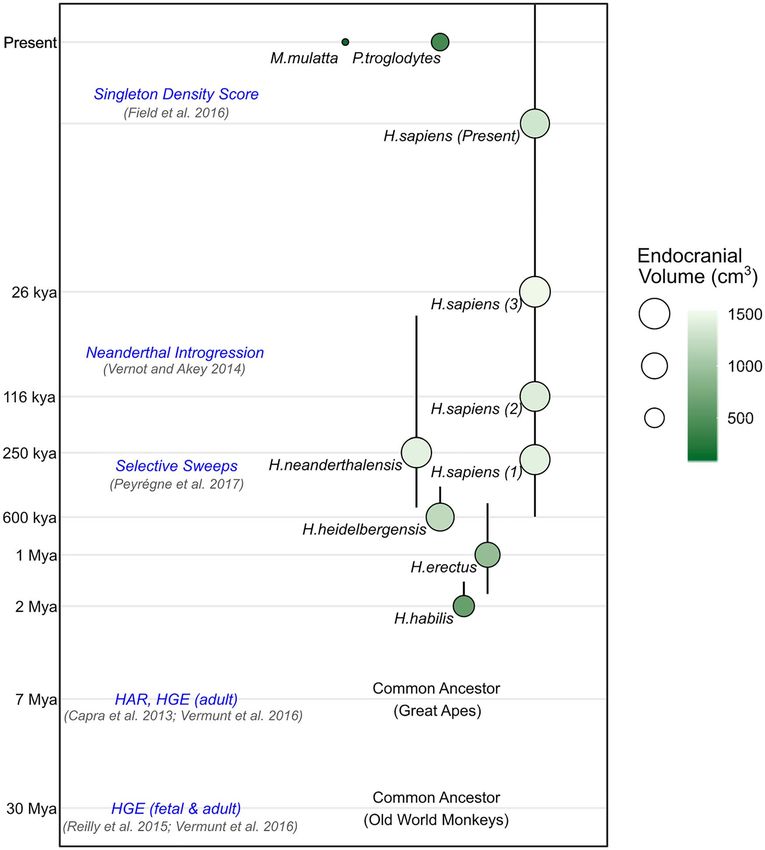
Common Variant Cortical Evolution                    Tilot et al.       1877

                                                                                                                                                                                  Downloaded from https://academic.oup.com/cercor/article/31/4/1873/6027878 by guest on 08 March 2021
Figure 2. Identifying and correcting for the effects of subtle population stratification on GWAS results. (a) Correlations between SNP loadings on ancestry PCs (Beta_PCs)
and GWAS effect sizes for full SA (Beta_Strat) demonstrate evidence for subtle population stratification (∗ indicates Bonferroni corrected significant correlation
P-value < 0.0025, and o indicates a nominally significant correlation, P-value < 0.05). (b) Subtle population stratification is reduced after ancestry regression. (c) LD-score
regression (LDSC) intercepts, standard measures of population stratification, are generally decreased after ancestry regression. An absence of population stratification
and cryptic relatedness would be indicated by an LDSC intercept value of 1. (d) There is an inverse relationship between the degree of subtle population stratification
(LDSC intercept prior to ancestry regression) and the amount of change caused by ancestry regression (cor[Beta_strat, Beta_r]). Error bars represent standard errors.

PLINK 1.9. With this extended list of SNPs in LD with the                                 were excluded, the sources were limited to GO, KEGG, and Reac-
GWAS index SNP, we looked for overlaps with HGEs defined                                  tome pathways, and FDR correction was applied with a signifi-
in any human brain region or developmental time period (Reilly                            cance threshold of 0.05.
et al. 2015). For those genome-wide significant loci that also
overlapped with HGEs, we then recorded known functional
impacts on gene expression using adult brain expression                                   Chromatin Accessibility Quantitative Trait Locus
quantitative trait loci (eQTLs) from the PsychENCODE dataset                              (caQTL) Mapping at the HEY2 Locus
(Wang et al. 2018), downloaded from http://adult.psychencode.                             caQTL data were acquired from our previous work (Liang
org/ selecting the dataset thresholded by the following param-                            et al. 2020). Briefly, we generated chromatin accessibility
eters (FDR < 0.05, expression > 0.1 FPKM in at least 10 samples).                         profiles from primary human neural progenitor cell lines
Gene biotype annotations (e.g., protein coding) were called using                         (Ndonors cultured = 73) and their differentiated neuronal progeny
ENSEMBL via biomaRt.                                                                      (Ndonors cultured = 61) using ATAC-seq (Buenrostro et al. 2013). We
    Pathway enrichment was performed for each gene list using                             genotyped the same cell lines using an Illumina HumanOmni2.5
the gost function from the “gprofiler2” package (version 0.1.3).                          or HumanOmni2.5Exome platform and imputed to 1000
Electronic gene ontology (GO) annotations (evidence code IEA)                             Genomes Phase 3 reference panel. We performed a caQTL
1878 Cerebral Cortex, 2021, Vol. 31, No. 4
Downloaded from https://academic.oup.com/cercor/article/31/4/1873/6027878 by guest on 08 March 2021
Figure 3. Evidence for haplotypes under recent polygenic selection (∼2000–3000 years) impacting cortical structure. (a) A block-jackknife correlation of ancestry
regressed effect sizes from GWAS (Z-scores) with scores of recent selection (tSDS) demonstrates evidence for polygenic alleles under selective pressure also inf luencing
both global and regional SAs (colored regions indicate FDR < 0.05). Colder colors indicate that the trait increasing alleles (associated with increased SA) are generally
associated with negative selection (decreasing allele frequencies in the population), whereas warmer colors indicate that trait increasing alleles are associated with
positive selection. (b) Subtle population stratification, measured via LD-score regression (LDSC) intercept, is associated with stronger evidence of selection prior to
ancestry regression. (c) Ancestry regression reduces the relationship between measures of selection and population stratification.
analysis separately for progenitors and neurons using a mixed given in Data Availability. Brain plots (Figs 3 and 4) were made
effects model including a kinship matrix for SNPs 100kb up- and using the “plotly” package. All other plots were made in R using
downstream from the center of each chromatin accessibility “ggplot2” and related packages.
peak. Allele-specific chromatin accessibility was performed in
DESeq2 (Love et al. 2014) after utilizing WASP to reduce mapping
Data and Code Availability
bias (van de Geijn et al. 2015).
Code used to perform analyses is available at https://bitbu
cket.org/jasonlouisstein/enigmaevolma6/src/master/. Genomic
Data Visualization
regions that underwent rapid change on the human lineage
Genomic loci plots were constructed using the R package “GViz”, (human accelerated regions, HARs) were combined from several
with evolutionary annotation data sourced from the references sources (Pollard, Salama, Lambert, et al. 2006b; Prabhakar et al.Common Variant Cortical Evolution Tilot et al. 1879
Downloaded from https://academic.oup.com/cercor/article/31/4/1873/6027878 by guest on 08 March 2021
Figure 4. SNPs within HGEs active at 7 weeks postconception explain a significant proportion of the heritability of SA for multiple brain regions. (a) Shading indicates
the enrichment values of SNP-heritability explained by HGEs active at 7 weeks postconception for the SA of each region, nonsignificant values are shaded in gray. (b)
Proportion of SNP-heritability explained by 7 PCW HGEs for SA of each cortical region. Asterisks label regions with FDR-corrected P-values < 0.05, error bars represent
standard errors.
2006; Bird et al. 2007; Bush and Lahn 2008; Lindblad-Toh et al. with variability in SA and cortical thickness in European
2011). BED files listing fetal brain enhancer elements not found populations (N = 33 992 individuals from cohorts across the
in macaques or mice were obtained from previous work (Reilly lifespan) (Grasby et al. 2020). Given the massive expansion of
et al. 2015). Adult brain enhancer elements arising since our SA in modern humans and only subtle increases in cortical
last common ancestor with the macaque or chimpanzee were thickness as compared with extant mammalian species (Rakic
obtained from (Vermunt et al. 2016). A refined list of SNPs 2009), we chose SA as the primary focus for the present study.
gained through introgression with Neanderthals was obtained Nevertheless, for comparative purposes, we performed a
from previous work (Simonti et al. 2016). Genomic regions matching set of analyses for thickness associations, and these
depleted of introgressed Neanderthal DNA were obtained from are shown in the Supplementary Materials.
previous work (Vernot et al. 2016). Ancient selective sweep Population stratification is the existence of systematic dif-
regions identified using extended lineage sorting were obtained ferences in allele frequencies between populations. Unbalanced
from previous work (Peyrégne et al. 2017). A summary of all representations of multiple populations in genetic association
annotations is found in Supplementary Table 1. studies can lead to false-positive findings that are driven by
allele frequency differences between populations rather than
true association with a trait (Balding 2006). Moreover, subtle
Results population stratification in GWAS statistics can inflate the
assessment of polygenic selection impacting a trait (Berg et al.
Reducing the Impact of Subtle Population Stratification
2018; Novembre and Barton 2018; Barton et al. 2019; Sohail et al.
The ENIGMA consortium recently conducted a GWAS meta- 2019). We first tested whether subtle population stratification
analysis identifying hundreds of common variants associated was influencing meta-analysis effect sizes in the cortical GWAS1880 Cerebral Cortex, 2021, Vol. 31, No. 4
data, even after applying the accepted standard correction for Specificity of GWAS Results to Brain versus Body Size
multidimensional scaling components of ancestry prior to
To investigate whether GWAS results of cortical structure
meta-analysis (Grasby et al. 2020). PC analysis enabled us to
revealed specific influences on the brain as compared with
identify major axes of variation in allele frequency across
global body size, we performed genetic correlations with a
current human populations using unrelated individuals of all
GWAS of height (Wood et al. 2014). As was noted in previous
ancestries from the 1000 Genomes Phase 3 data. Then, we tested
work, and shown in Supplementary Figure 6, there is a partially
the association of each SNP to the top 20 PCs (each treated as
shared genetic basis between height and global cortical SA
a separate trait) within the 1000 Genomes population, yielding
(rg = 0.21) (Grasby et al. 2020). However, our previous work
an estimate of the degree to which each SNP contributes to
also indicated the genetic correlations between intracranial
population frequency differences along each principal axis of
volume controlling for height and global SA (rg = 0.81) are much
variation (Beta_PCs) (Sohail et al. 2019). Finally, using Pearson’s
stronger than genetic correlations between height and global
correlation, the Beta_PCs were correlated with the effect sizes
cortical SA (rg = 0.21), which demonstrates that the genetic
from the GWAS meta-analysis for each trait, which may be
signal discovered in our global cortical SA GWAS is mostly
impacted by population stratification (Beta_Strat). To assess
brain specific and not driven entirely by body size (Grasby
Downloaded from https://academic.oup.com/cercor/article/31/4/1873/6027878 by guest on 08 March 2021
the significance of the correlation in the context of LD, a block
et al. 2020). In the association model of each of the 34 cortical
jackknife approach was employed to calculate the standard
regions, we control for global SA to identify specific effects on
errors for the correlation (Kunsch 1989; Busing et al. 1999).
that region, so we do not expect to observe a large degree of
Significant correlations between Beta_PCs (consistent allele
shared genetics with body size. Indeed, we did not observe any
frequency differences differentiating human populations) and
significant (FDR < 0.05) genetic correlations between height and
Beta_Strat (effect sizes of variants on human brain structure
the 34 regional SA measurements (Supplementary Fig. 6). We
from GWAS) are indicative of subtle, uncorrected population
performed the same analyses for thickness and only detected
stratification (Berg et al. 2018; Sohail et al. 2019). As shown
one region with a significant (FDR < 0.05) genetic correlation
in Figure 2a, we detected significant relationships between
with height, inferior temporal gyrus, which was not implicated
Beta_Strat and PCs 6, 7, 8, 15, 18, and 19 for global SA, indicating
in any of our subsequent evolutionary analyses. In sum, our
subtle residual population stratification affecting the GWAS
findings are largely brain-specific.
summary statistics. This analysis also showed subtle population
stratification affecting summary statistics for each of the
regional SAs, to varying degrees (Supplementary Fig. 1). We note
Evidence for Polygenic Selection Impacting Human
that another measure of population stratification, the LDSC
Cortical Structure
intercept (Bulik-Sullivan, Loh, et al. 2015b), gave values that
were uniformly less than 1.05 (a commonly used threshold In our evolutionary analyses, we first assessed how alleles that
for ruling out stratification) for global SA and all regional show evidence of recent selective pressure impact cortical SA.
SAs (Fig. 2c). The SDS reveals haplotypes under recent positive/negative
To correct for this subtle population stratification, we imple- selection in the human genome by identifying those that
mented an ancestry regression procedure based on GWAS sum- harbor fewer/greater singleton variants (presumed to have
mary statistics (Bhatia et al. 2016). The residuals (Beta_r) of a arisen recently) near any given SNP (Field et al. 2016). This
model fitting GWAS effect sizes (Beta_Strat) with the first 20 PC metric, together with data from a suitable GWAS, can be used
weightings (Beta_PC) were used as ancestry-corrected estimates to infer whether a trait of interest has been subject to highly
of effect sizes. As expected, these ancestry-corrected estimates polygenic selection on an evolutionarily recent timescale, over
(Beta_r) showed much reduced correlations with PC weights the past ∼2000–3000 years. We found that alleles with evidence
(Fig. 2b, Supplementary Fig. 2). Additionally, LDSC intercepts for of positive selection over this recent timescale have a small
phenotypes after ancestry regression were generally slightly but detectable influence on increasing global SA in the GWAS
decreased, consistent with diminished effects of subtle popula- datasets (block jackknife correlation = 0.0129, FDR adjusted
tion stratification on common variant associations to SA (Fig. 2c). P-value = 0.0038; Fig. 3a). In addition, our results showed that
Furthermore, correlations between effect size measurements alleles undergoing polygenic selection over the past ∼2000–3000
after ancestry regression (Beta_r) and effect size measurements years are associated with variation in cortical SA of individual
prior to ancestry regression (Beta_Strat) were all extremely high, gyrally defined brain regions (Fig. 3a). Notably, based on the
indicating that ancestry regression did not strongly change the cortical region-specific GWASs, there is a detectable relationship
association statistics (correlations all >0.995; Fig. 2d). There were between alleles under positive polygenic selective pressure
343 genome-wide significant loci (P-values < 5 × 10⁻⁸ ; clump- (increasing in allele frequency over time) and increased cortical
ing r2 < 0.2) prior to ancestry regression impacting global SA SA in regions known to be important for speech/language
or any of the regional SAs and 303 genome-wide significant functions (pars opercularis, part of the inferior frontal gyrus) and
loci after ancestry regression. Finally, those brain regions that visual processing (lateral occipital cortex). Conversely, alleles
showed the highest LDSC intercepts prior to ancestry regression, under negative polygenic selective pressure (decreasing allele
indicative of being most affected by subtle residual population frequency over time) are associated with increased cortical
stratification, were also those that showed the largest changes SA in the pre- and postcentral gyrus, regions involved in
in GWAS effect sizes following ancestry regression (r = −0.334; somatosensation and movement.
P-value = 0.0498; Fig. 2d). The ancestry regression procedure was We conducted secondary analyses to investigate the poten-
also carried out for cortical thickness GWAS (Supplementary tial impacts of the subtle population stratification, described
Figs 3–5). For all subsequent analyses, we used the ancestry- above, because it was recently shown that SDS correlations
corrected effect size estimates, standard errors, and P-values, can be highly influenced by this confounder (Berg et al. 2018;
thereby minimizing the impact of population stratification on Sohail et al. 2019). Exploratory analyses of GWAS data that
the results of our evolutionary assessments. were uncorrected for ancestry showed a clear relationshipCommon Variant Cortical Evolution Tilot et al. 1881
between the LDSC intercept (a measure of the degree of evolutionary annotations) contribute to the heritability of the
population stratification) and the level of correlation between trait.
SDS and the GWAS Z-scores (cor = 0.432, P-value = 0.0096; We assessed how common variants within HGEs contribute
Fig. 3b). In contrast, for analyses of GWAS data that had to the SNP-based heritability of cortical SAs, testing for enrich-
undergone ancestry regression, there was no significant ment using LDSC partitioned heritability (Finucane et al. 2015),
relationship between SDS and GWAS Z-scores (cor = 0.257, P- with FDR correction for the 35 traits (34 regions plus global SA).
value = 0.137; Fig. 3c), indicating that the ancestry regression Furthermore, because SNPs within regulatory elements that are
procedure is effective in diminishing confounding effects of active during fetal development are known to make significant
population stratification. We note that although the ancestry impacts on both intracranial volume and cortical SA (de la
regression procedure attenuates the signals of polygenic Torre-Ubieta et al. 2018; Grasby et al. 2020), we controlled for a
selection impacting SA, nevertheless several regions are robust global category of fetal brain active regulatory elements [derived
to such adjustment (FDR < 0.05 are colored and labeled in from the Epigenomics Roadmap (Roadmap Epigenomics Consor-
Fig. 3a). Finally, we show that SDS correlations within the UKBB tium et al. 2015)] in the analysis. This is in addition to the 97
European population alone, which is less susceptible to the categories included in the baselineLD v2 model, which span a
Downloaded from https://academic.oup.com/cercor/article/31/4/1873/6027878 by guest on 08 March 2021
impacts of subtle population stratification than meta-analysis wide range of functional elements. These additional control cat-
of data from consortia (Berg et al. 2018; Sohail et al. 2019), egories make it possible to assess the contribution of evolution-
show a highly consistent SDS relationship with the ancestry- focused annotations with a high degree of specificity. SNPs
corrected meta-analysis results (cor = 0.635, P-value = 4.2 × 10⁻⁵ ; within HGE elements made significantly enriched contributions
Supplementary Fig. 7). to cortical SA heritability for 6 out of 34 gyrally defined regions
After implementing the ancestry regression procedures, after controlling for global SA (Fig. 4a). The enrichment signal
we also performed the evolutionary analyses on cortical was strongest for the pars orbitalis, part of the inferior frontal
thickness. We found no significant correlation between global gyrus (Enrichment = 14.96, FDR corrected P-value = 0.0053). As
thickness and selective pressures over the past 2000–3000 the regional GWAS results were controlled for global SA, the
years. We detected two significant associations between recent heritability enrichment signals detected in each region are inde-
selective pressures and cortical thickness in the precuneus and pendent of global SA. Our findings indicate that SNPs within
superior parietal cortex. In these regions, alleles inferred to these HGEs have effects beyond those of general fetal enhancers.
have increased in frequency over the past 2000–3000 years are Altogether, the data suggest that a key set of neural enhancer
associated with increased cortical thickness (Supplementary regions that became functional since our split from Old World
Fig. 8). These regions have been independently proposed in prior monkeys contribute an unusually large amount to the heritabil-
studies as relevant for human brain evolution (Bruner et al. 2017; ity of regional cortical SA in adult humans. This influence on
Pereira-Pedro et al. 2020). SA in the adult brain may be realized through common genetic
variation within these HGEs impacting gene regulation during
fetal brain development. In order to assess the specificity of
these findings to brain-related phenotypes, we tested heritabil-
Significant Heritability Enrichment within HGEs
ity enrichment of irritable bowel disease (Jostins et al. 2012) for
(30 Mya)
these evolutionary annotations, as it is a non-neural human trait
We went on to assess deeper evolutionary time scales, targeting with a GWAS meta-analysis of comparable sample size to the
human fetal brain enhancer elements that emerged since our cortical structure GWASs. We found no significant enrichments
last common ancestor with macaques, commonly referred to across the same set of evolution-focused annotations, applying
in the literature as HGEs (Reilly et al. 2015). These elements the same controls described above (Supplementary Table 3). The
were detected by comparing post-translational modifications of same partitioned heritability analysis was performed for global
histone tails indicative of enhancers and promoters (H3K27ac and regional cortical thickness, but no significant enrichment
and H3K4me2) across humans, macaques, and mice. Using was identified (Supplementary Fig. 10).
brain tissue from similar developmental time points across
the three species, regulatory elements (peaks in the histone
Other Classes of Evolutionary Annotations are not
modification signals) were identified that were present in
Enriched for Cortical SA or Thickness Heritability
human fetal brain at 7 postconception weeks (PCW), but to a
significantly lesser degree in developing macaque or mouse We examined the contributions of several other evolution-
brain tissue (Reilly et al. 2015). The enhancer activity of HGEs has focused annotations (namely, HGEs active in the adult brain
recently been experimentally tested using a multiplex parallel based on comparison to either macaque or chimpanzee,
reporter assay in human neural progenitor cells (Uebbing et al. human accelerated regions, selective sweeps, and Neanderthal
2019). In this assay, 43% of HGEs were found to be active introgressed or depleted regions) to the heritability of cortical
enhancers, providing important experimental validation that SA, finding no significant positive enrichment (Supplementary
histone post-translational modification marks are functionally Fig. 9). The results suggest that these particular sets of genomic
active. To understand how these HGEs influence cortical SA regions do not contribute more to the heritability of cortical SA
in modern humans, we measured their relative contribution than expected, given their size.
to total SNP heritability. A trait’s SNP-based heritability is the The same partitioned heritability analysis was performed for
total amount of variance in the trait (e.g., global SA) that can be global and regional cortical thickness, with the only positive
attributed to common variation across the genome, and it can enrichment surviving FDR correction being for Neanderthal
be estimated from GWAS summary statistics. This genome- lineage depleted regions in the superior parietal region (Enrich-
wide SNP heritability can be partitioned into categories to ment = 0.20, FDR-corrected P-value = 0.042, Supplementary
measure how specific genomic regions of interest (in this case, Fig. 10).1882 Cerebral Cortex, 2021, Vol. 31, No. 4
Downloaded from https://academic.oup.com/cercor/article/31/4/1873/6027878 by guest on 08 March 2021
Figure 5. Fine mapping and molecular mechanisms underlying genetic variation at HGE associated with SA of pars opercularis in the inferior frontal gyrus. (a)
Regional plots showing associations to pars opercularis SA, associations to the boxed chromatin accessibility peak in human neural progenitors, the average chromatin
accessibility in progenitors, association to the boxed chromatin accessibility peak in differentiated neurons, the average chromatin accessibility in neurons, and an
analysis demonstrating a co-localization through observation that controlling for the pars opercularis SA index SNP abolishes the progenitor caQTL signal. The y-axis on
the nonshaded tracks represents chromatin accessibility as average normalized read density across ATAC-seq libraries for either neurons or progenitors. (b) Boxplots
demonstrating the caQTL association observed in progenitors and neurons for the index caQTL SNP. (c) Allele specific chromatin accessibility is also observed at the
same SNP. (d) Chromatin accessibility separated by genotype at the boxed peak in (a) overlapping the human-gained enhancer peaks. The blue bar represents the
chromatin accessibility peak defined in this dataset and the gray bars represent human gained enhancer peaks. The y-axis again represents chromatin accessibility
as average normalized read density across ATAC-seq libraries. Prior to ancestry regression, the SNP rs7764016 has association to pars opercularis SA with P = 2.1e−09.
However, this SNP is not present in the 1000 Genomes Phase 3 data used for ancestry regression so is not present as a dot in (a).
Linking GWAS Results, Regulatory Elements, Genes, 2017) (marked by rs2490272 index SNP, r2 = 1.0 with rs2802295),
and Evolutionary History with the SA increasing allele also associated with higher scores
on tests of intelligence. The SNP also functions as a cortical
To further understand how gene regulation is impacted by eQTL for FOXO3 [FDR adjusted P-value = 0.0051, derived from
common variation within HGEs, we established which of the the adult brain PsychENCODE dataset (Wang et al. 2018)].
genome-wide significant SA loci (P-value < 5 × 10⁻⁸ including FOXO3 encodes a transcription factor that regulates neuronal
SNPs in LD at r2 > 0.6) fall within HGEs and also modulate gene stem cell homeostasis (Renault et al. 2009), among other
expression in adult cortical tissue (Wang et al. 2018) (expression roles. Considering the 279 genome-wide significant regional
quantitative trait loci—eQTLs—at FDR < 0.05). Seven of twenty- SA loci, there were 46 that overlapped (directly or with an
four genome-wide significant global SA loci overlapped (directly LD-associated SNP) with an HGE. Out of those 46 loci, 30
or with an LD-associated SNP) with an HGE. Four of those also have a significant eQTL, impacting a total of 47 protein-
seven loci also have a significant eQTL impacting 18 protein- coding eGenes. These eGenes include known genes involved
coding genes, eGenes, defined as the genes whose expression is in areal identity including LMO4 (Huang et al. 2009) as well as
associated with the genetic variation. These eGenes included developmentally relevant transcription factors like HEY2 (a full
developmentally relevant genes FOXO3, ERBB3, and WNT3 (a list is found in Supplementary Table 2).
full list is found in Supplementary Table 2). One SNP in LD We focused on understanding potential mechanisms
with rs2802295 (rs9400239, r2 = 0.715), associated with global by which evolutionarily relevant genetic variation may be
SA, maps to a 7 PCW fetal brain HGE and is located within an associated with changes in inferior frontal brain structure, given
intron of the FOXO3 gene on chromosome 6q21. The derived this region’s strong HGE partitioned heritability enrichment and
allele (G) at rs2802295 is associated with increased global involvement in language. For a locus significantly associated
cortical SA. The Human Genome Dating atlas estimates the with pars opercularis SA, 26 SNPs in LD (r2 > 0.6) with index SNP
derived allele to be 26 353 (23 115.3–29 770.7 95% confidence rs1159974 map to fetal brain HGEs, with the locus centered
interval) generations old (Albers and McVean 2020). Assuming on the promoter of the HEY2 gene on chromosome 6q22
25 years per generation, the estimated age of the derived allele (Fig. 5a). The strongest cortical eQTL for HEY2 of a SNP within
is 658 (578–744) kya. rs2802295 has also been associated with an HGE is rs10457469 (FDR adjusted P-value = 7.09 × 10−44
interindividual variation in general intelligence (Sniekers et al. derived from the adult brain PsychENCODE dataset (Wang et al.Common Variant Cortical Evolution Tilot et al. 1883
2018), r2 rs10457469:rs1159974 = 1), which regulates neural progenitor We find evidence of polygenic selection influencing global SA
proliferation during neurogenesis (Sakamoto et al. 2003). over the past 2000–3000 years. Notably, the signals of polygenic
Next, we leveraged our recently generated dataset of selection for increased SA in parts of the inferior frontal gyrus
chromatin accessibility (ca) QTLs in human cortical neural highlight cortical regions known to be important for the pro-
progenitors and their differentiated neuronal progeny (Liang duction of spoken language. These results are interesting in
et al. 2020) to further understand the influence of genetic light of a recent study that used paleoanthropology, speech
variation on gene regulatory elements in the developing brain. biomechanics, ethnography, and historical linguistics to show
Using this dataset, we identified a chromatin accessibility that changes in human bite configuration and speech-sound
peak at the promoter of HEY2 (chr6:125746611–125750660) that inventories occurred after the Neolithic period, potentially due
overlapped with multiple HGEs and had significantly higher to advances in food-processing technologies (Blasi et al. 2019).
accessibility in progenitors than in neurons (logFC = 0.484, FDR Thus, it is plausible that the consequent increases in the diver-
adjusted P-value = 5.98 × 10⁻³¹ ; Fig. 5a–d). A SNP associated with sity of sounds produced may have led to a subtle, but con-
differences in chromatin accessibility (caSNP) within this peak sistent, polygenic selection of alleles increasing cortical SA in
(rs7764016) was in high LD (r2 = 0.823 calculated using the brain regions with relevance for speech. If this hypothesis is
Downloaded from https://academic.oup.com/cercor/article/31/4/1873/6027878 by guest on 08 March 2021
donors of the caQTL dataset; r2 = 0.988 calculated in 1000G confirmed, it would represent a novel example of gene-culture
phase 3 EUR dataset) with the index SNP associated with co-evolution on the human lineage (Laland et al. 2010).
pars opercularis SA (rs1159974). The allele linked to decrease Considering a deeper evolutionary timescale, our analyses
in SA and increased HEY2 gene expression (T) was associated also reveal that common variation found within human-gained
with higher chromatin accessibility of the promoter peak enhancers that are active during fetal development has effects
in progenitors (P-value = 3.99 × 10⁻⁸ ) but not in neurons (P- on cortical SA measured largely in adults. Of note, regions of
value = 0.68; Fig. 5a,b). To provide further support for these the inferior frontal gyrus were again among the most significant
findings, we used an alternative method for inferring allelic cortical areas implicated by our analyses, suggesting that they
effects on chromatin accessibility within heterozygous donors have been subject to evolutionary processes at multiple distinct
(allele specific chromatin accessibility) at rs7764016 and found timepoints on the lineage that led to modern humans. These
that the T allele was associated with higher chromatin acces- findings implicate neural progenitor proliferation and differen-
sibility in both progenitors (P-value = 1.51 × 10⁻¹⁰ ) and neurons tiation as processes critical to evolutionary expansion of cortical
(P-value = 7.45 × 10⁻⁸ ; Fig. 5c). We controlled for the GWAS index SA on the human lineage. Such a relationship is consistent
SNP in the progenitor caQTL analysis which abolished the caQTL with the radial unit hypothesis (Rakic 2009), which posits that
signal, demonstrating that these variants mark the same locus cortical expansion is driven by an increase in the progenitor
(co-localization; Fig. 5a). Overall, we suggest a causal variant pool present during development. In addition, through the inte-
(rs7764016) where the T allele is associated with increased gration of multi-omic QTLs, brain structure GWAS, and evolu-
chromatin accessibility in neural progenitors at an HGE near tionarily relevant genomic annotations, we identify a regulatory
the promoter of HEY2, increased gene expression of HEY2, element near the promoter of HEY2 with activity specific to
and decreased cortical SA of the pars opercularis. Conversely, humans where sequence variation in that locus impacts the
the derived allele (G) of rs7764016 is associated with reduced cortical structure of the inferior frontal gyrus. We note that
HEY2 expression and increased cortical SA for this region. The the decreased expression of HEY2 is associated with increased
Human Genome Dating atlas estimates this derived allele to be cortical SA. Work in mice links this gene to neural progenitor
2993.7 (2660.5–3316.7, 95% confidence interval) generations old proliferation (Sakamoto et al. 2003). The effect of allelic reg-
(Albers and McVean 2020). Assuming 25 years per generation, the ulation of HEY2 expression levels on progenitor proliferation
estimated age of the derived allele is 74 (66–82) kya. These results and cortical areal size will depend on spatiotemporal patterns
indicate that genetically mediated alteration of the function of of HEY2 expression and interactions with other factors that
a regulatory element with specific activity in the developing are co-expressed with it in the different regions. We believe
human brain impacts adult inferior frontal cortical SA. The that this represents a novel approach to identify the functional
findings also suggest a specific gene and regulatory element impact of evolutionarily relevant regulatory elements on brain
involved in shaping inferior frontal gyrus cortical structure in structure. Intriguingly, a rare single gene duplication of HEY2
humans, acting within a polygenic framework. was identified in a child with cardiac and neurodevelopmental
Likely due to the limited number of eGenes identified, no deficits, including disrupted speech development (Jordan et al.
significant (FDR < 0.05) gene ontology terms with greater than 2015). Although this case report requires further support from
5 intersections with HGE regulated genes were identified. Nev- identification and characterization of additional mutation car-
ertheless, this analysis points to specific developmentally inter- riers, it is consistent with our association of HEY2 promoter
esting genes regulated by HGEs which have shaped both the variants with changes in cortical SA of inferior frontal regions,
overall SA of the cortex and specific regions. Plots of all genome- as these brain areas are known to be hubs in distributed circuits
wide significant loci that overlapped with one or more of the involved in speech and language processing.
evolutionary annotations considered in this study are provided Our study should be carefully interpreted in light of some
in Supplementary Figure 11. limitations. First, in this study, we were only able to assess a
subset of genetic variation that is important for human cor-
tical SA expansion and refinement through human evolution.
Discussion Specifically, we assess alleles that are both common and poly-
By integrating genomic annotations of primate evolutionary his- morphic in current human populations, with a bias toward
tory with the largest available genome-wide association analysis European ancestry. It is almost certain that derived alleles that
of neuroanatomy in living populations (Grasby et al. 2020), we are now fixed in modern human populations (and therefore
are able to map genetic variation shaping cortical SA across dif- not detectable in GWAS) also made substantial contributions
ferent time periods on the lineage that led to modern humans. to the shaping of cortical SA during hominid evolution. So far,1884 Cerebral Cortex, 2021, Vol. 31, No. 4
relatively few of these variants are known (Sousa et al. 2017), over the last 30 million years of human evolution appear to have
but future studies, for example introducing fixed chimpanzee shaped different aspects of modern human brain structure, from
or Neanderthal alleles into human neural progenitor cells, will ancient effects on broad growth patterns through to much more
help to assess the impacts of this class of genetic variants recent influences on a number of cortical regions, including
(Ryu et al. 2018). Second, our study is limited to understand- those linked to our capacity for spoken language.
ing selective pressures within defined historical windows from
evolutionarily relevant genomic annotations (Fig. 1). Our SDS
correlations suggest that polygenic selective forces impacted Supplementary Material
human cortical structure but are uninformative about the time-
Supplementary material can be found at Cerebral Cortex online.
point that polygenic selective forces first acted because SDS
does not provide information concerning evolutionary periods
preceding 3000 years ago. Third, subtle population stratification
Notes
can influence the inferences of polygenic selection impacting
a trait (Berg et al. 2018; Sohail et al. 2019). Prior to analyses of We thank Leo Zsembik and Shana Hall for initial work on poly-
Downloaded from https://academic.oup.com/cercor/article/31/4/1873/6027878 by guest on 08 March 2021
GWAS data, we implemented an ancestry regression procedure genic selection analyses. We also thank Dr Philipp Gunz for
to correct for subtle population stratification (Bhatia et al. 2016). many helpful discussions during the development of Figure 1.
We show that this procedure reduces the impact of popula- S.E.F. is a member of the Center for Academic Research and
tion stratification, as evaluated by two independent methods Training in Anthropogeny (CARTA). Conflict of Interest: D.P.H. is
(ancestry PC correlations and LDSC intercept). However, LDSC a full-time employee of Genentech, Inc.
intercepts were not uniformly at 1 (indicative of no population
stratification) suggesting that some residual population stratifi-
cation remains. Allele frequency differences across populations Funding
may not be independent of selective pressures, so our procedure Foundation of Hope (to J.L.S.); the Brain Research Foundation
may also over-correct leading to diminished evidence of selec- (to J.L.S.); the National Institutes of Health (R01 MH118349, R00
tive effects. Even using our conservative ancestry regression MH102357, U54 EB020403 to J.L.S.); the National Science Foun-
approach, robust signals of polygenic selection were detected dation (ACI-16449916 to J.L.S.); the Max Planck Society (to S.E.F.);
for cortical SA, giving us confidence in the results. Nevertheless, APP1173025 (to K.L.G.).
replication of our findings in future genetic association studies
of brain structure in sufficiently large family-based populations
that are less susceptible to impacts of population stratification Author Contributions
(Spielman and Ewens 1996; Hemani et al. 2013) would allow
further verification of the results presented here. Finally, future S.E.F. and J.L.S. originated the project and oversaw the work.
studies focusing on understanding genetic influences on behav- A.K.T., S.E.F., and J.L.S. drafted the manuscript. A.K.T. performed
ioral and cognitive traits (language, motor skills) (Deriziotis and partitioned heritability analyses. A.K.T., D.L., and J.L.S. identi-
Fisher 2017) combined with GWAS of their neurobiological sub- fied specific genes and regulatory elements impacted by HGE.
strates (like this one) may provide a more complete picture of J.L.S. implemented ancestry regression. S.L., S.M.B., and J.L.S.
how shifts in genetic variation across time might yield changes implemented recent polygenic selection analyses. E.A.K., B.E.S.,
in brain structure and behavior. and L.K.D. provided data for performing ancestry regression and
These findings provide new insights into a number of long- independently implemented analyses. K.L.G., N.J., J.P., L.C.C., J.B.,
standing debates about the genetic basis for brain size and D.P.H., P.A.L., P.M.T., S.E.M., and J.L.S. provided the SA GWAS
cortical SA expansion in modern humans. First, consistent with summary statistics. All authors edited the manuscript.
the idea that noncoding genetic variation is a large driver of
human brain evolution (King and Wilson 1975), we note that
genomic annotations of evolutionary history in which cortical
References
SA heritability enrichment was observed are not derived from 1000 Genomes Project Consortium, Auton A, Brooks LD, Durbin
protein-coding variations. Instead, these come largely from non- RM, Garrison EP, Kang HM, Korbel JO, Marchini JL, Mcarthy
coding intergenic or specifically regulatory sequences. Second, S, GA MV et al. 2015. A global reference for human genetic
our work refutes prior claims that an evolutionary change in variation. Nature. 526:68–74.
just one gene (or perhaps a small handful of genes) can fully Albers PK, McVean G. 2020. Dating genomic variants and shared
account for the distinctive nature of the modern human brain. ancestry in population-scale sequencing data. PLoS Biol.
For example, it was previously proposed that a single genetic 18:e3000586.
variant of strong effect was sufficient to cause the expansion of Bacanu SA, Devlin B, Roeder K. 2000. The power of genomic
human brains and cognitive abilities around 50 kya (Klein 2002). control. Am J Hum Genet. 66:1933–1944.
Here, we not only show that variation in multiple human-gained Balding DJ. 2006. A tutorial on statistical methods for population
enhancers influences cortical SA in aggregate, but also find evi- association studies. Nat Rev Genet. 7:781–791.
dence of much more recent polygenic selection acting on these Barton N, Hermisson J, Nordborg M. 2019. Why structure matters.
traits. We clarified molecular mechanisms for one of the genes Elife. 8:e45380. doi: 10.7554/eLife.45380.
contributing to the overall polygenic signal, HEY2, by integration Barton RA, Venditti C. 2014. Rapid evolution of the cerebellum in
of multi-omic datasets. Thus, multiple alleles each of small humans and other great apes. Curr Biol. 24:2440–2444.
effect have contributed to the shaping of modern human cortical Berg JJ, Harpak A, Sinnott-Armstrong N, Joergensen AM,
SA across different evolutionary timescales, even within the last Mostafavi H, Field Y, Boyle EA, Zhang X, Racimo F, Pritchard JK
2000–3000 years, supporting the importance of gene-culture co- et al. 2018. Reduced signal for polygenic adaptation of height
evolution in explaining our biology. In sum, selective pressures in UK Biobank. Elife. 8:e39725. doi: 10.7554/eLife.39725.You can also read