Historic dispersal barriers determine genetic structure and connectivity in a supratidal sandy-beach brooder
←
→
Page content transcription
If your browser does not render page correctly, please read the page content below
Vol. 674: 1–13, 2021 MARINE ECOLOGY PROGRESS SERIES
Published September 16
https://doi.org/10.3354/meps13839 Mar Ecol Prog Ser
OPEN
ACCESS
FEATURE ARTICLE
Historic dispersal barriers determine
genetic structure and connectivity in a
supratidal sandy-beach brooder
Karien Bezuidenhout1,*, Ronel Nel1, David S. Schoeman1, 2, Lorenz Hauser1, 3
1
Zoology Department, Nelson Mandela University, Port Elizabeth 6031, South Africa
2
Global-Change Ecology Research Group, School of Science, Technology and Engineering,
University of the Sunshine Coast, 4556 Sippy Downs, QLD, Australia
3
School of Aquatic and Fishery Sciences, University of Washington, Seattle, WA 98105, USA
ABSTRACT: The supralittoral zones of sandy beaches
are particularly vulnerable to coastal development
and other activities that cause localised habitat de-
struction. Supratidal species, such as peracarid crus-
taceans, which lack a pelagic larval phase and tend
to avoid direct contact with the swash, are therefore
expected to be distributed as isolated populations,
with implications for their long-term survival. Genetic
population structure of one such species, the pill bug
Tylos capensis, was investigated based on mitochon-
drial cytochrome c oxidase subunit I (COI) haplotype
sequences, to assess demographic history and re-
gional population connectivity in the presence of
potential dispersal barriers (an estuary, coastal cliffs)
along the Indian Ocean coast of South Africa. Here,
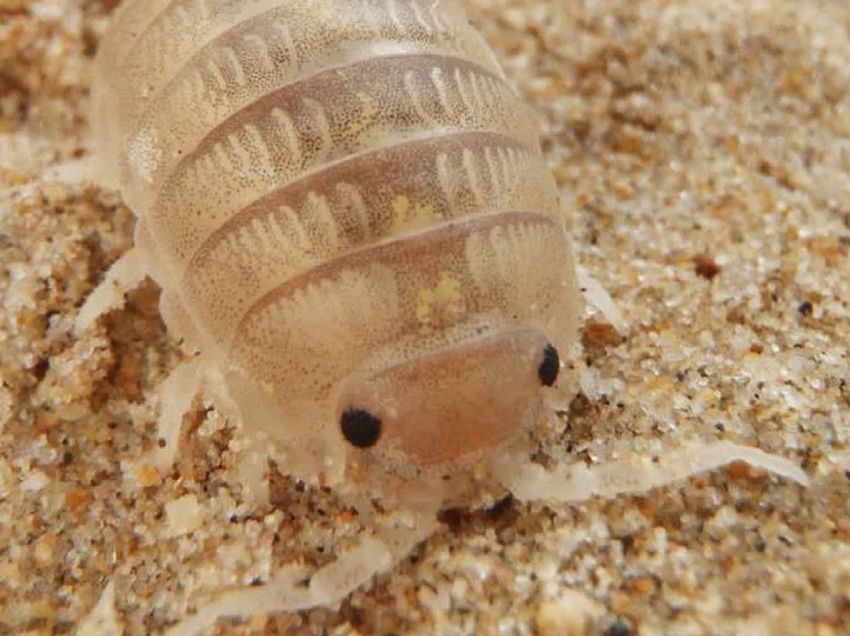
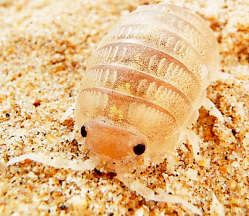
pill bugs demonstrated strong and significant genetic Sandy beach pill bugs (Tylos capensis) are prone to popula-
structure at the regional scale, with 3 distinct clades tion isolation, which will impact their long-term survival
across the species’ geographic distribution. At a lo- without adequate protection.
calised spatial scale, coastal cliffs intersecting the Photo: Karien Bezuidenhout
high shore appeared to be a strong barrier to gene
flow between adjacent populations, while a perma-
nently open estuary did not limit gene flow. Estimates KEY WORDS: Brooder · Dispersal barrier · Genetic
of historic gene flow and patterns of COI differentia- connectivity · Sandy beach · Supratidal habitat
tion coincided with greater habitat continuity during
the Pleistocene glaciations at sea levels between −75
and −120 m, when the African south coast was proba-
bly dominated by sandy beaches. While gene flow
among low-dispersing pill bug populations is unlikely 1. INTRODUCTION
to benefit from a network of closely spaced coastal
protected areas, the isolated nature of this species, Open coastlines are naturally patchy, heteroge-
coupled with the cryptic diversity inherent in this neous habitats punctuated by rocky shores, mixed
taxon, emphasizes the need for their protection. The shores, wave-cut platforms, estuaries, and sea cliffs
importance of protecting the intact littoral active zone (e.g. Harris et al. 2011), in addition to man-made
of beaches is highlighted. interruptions. Beaches and intertidal habitats are
therefore generally disconnected and discontinuous
© The authors 2021. Open Access under Creative Commons by
Attribution Licence. Use, distribution and reproduction are unre-
*Corresponding author: karien@sstafrica.org.za
stricted. Authors and original publication must be credited.
Publisher: Inter-Research · www.int-res.com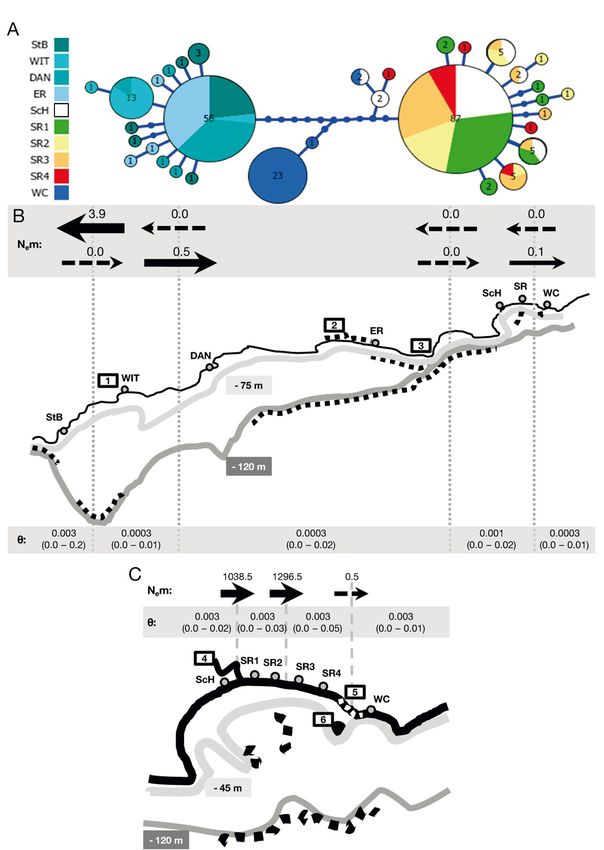
2                                          Mar Ecol Prog Ser 674: 1–13, 2021

at regional scales. Beach habitats show further vari-           Anecdotal as well as empirical evidence already
ability, as sediment properties, wave action, and tidal      indicates that supralittoral fauna are impacted by
amplitude vary at local and regional spatial scales          habitat degradation and subjected to habitat frag-
to form different beach morphodynamic types (Mc-             mentation. For example, Brown (2000) noted the dis-
Lachlan et al. 2018). Locally, tidal elevation and           appearance of Tylos granulatus from several beaches
water-table depth contribute to across-shore habitat         along the South African west coast, while Deidun et
variability, typically resulting in 3 across-shore zones     al. (2011) reported a severe contraction in the distri-
(sublittoral, midlittoral, supralittoral), each with dif-    bution of T. europaeus and T. sardous (= T. ponticus)
ferent microhabitat properties (Brown & McLachlan            populations on Maltese beaches. Hubbard et al.
2006). Beach invertebrate populations are distrib-           (2014) likewise demonstrated the extirpation of
uted across these spatially heterogeneous seascapes,         T. punctatus from 57% of beaches originally occu-
interspersed among regions of unsuitable habitats.           pied in southern California, USA, due to habitat loss,
   The supralittoral (or supratidal) is arguably the         and the loss of another isopod, Alloniscus percon-
harshest of the tidal zones on exposed sandy beaches         vexus, from 64% of these beaches. Ketmaier et al.
(Brown & McLachlan 2006). The supralittoral zone is          (2005) showed a reduction in genetic variation in Tal-
positioned between the drift line and primary dunes.         itrus saltator on beaches subject to human distur-
Aerial exposure, low levels of sand moisture, and ex-        bance. Finally, urbanization and associated impacts
treme variations in air temperature render the supralit-     have also been implicated in the decline of supratidal
toral habitable only to species well adapted to deal         tiger beetles (Nagano 1980 in Hubbard et al. 2014).
with these conditions (Brown & McLachlan 2006). As           With threats such as development, sea-level rise, and
such, the supratidal is dominated by crustaceans in-         erosion projected to increase (Defeo et al. 2009, Pil-
cluding ocypodid crabs, talitrid amphipods, and onis-        key & Cooper 2014), supralittoral populations and
cid isopods, as well as several insect taxa (Brown &         species are likely to become increasingly vulnerable
McLachlan 2006). A large proportion of these species         in the future.
is ovoviviparous (Defeo & Gómez 2005), exhibiting di-           Pill bugs of the genus Tylos are considered good
rect development or brooding. These species are im-          indicators of habitat quality (Gonçalves et al. 2005,
portant processors of beach wrack (e.g. Lowman et al.        Deidun et al. 2011) and could therefore also be in-
2019), and so perform a crucial ecosystem function           dicative of the effects of habitat fragmentation. The
(Coupland et al. 2007). Despite their consistent eco-        genus is globally distributed, although most repre-
logical function, many species have a high degree of         sentatives inhabit tropical and subtropical regions
cryptic diversity and deep divergences among re-             (Brown & Odendaal 1994). Two species inhabit tem-
gional clades, e.g. oniscid ispods (Hurtado et al. 2013,     perate South Africa: T. capensis, an endemic to the
2014, Niikura et al. 2015) and talitrid amphipods            south coast, and T. granulatus, which is limited to
(Pavesi & Ketmaier 2013, Baldanzi et al. 2016). The          the west coast of South Africa and Namibia (Kensley
supratidal zone, although being physically extreme,          1974). Tylos spp. require beaches with a sufficient
therefore harbours unique and often cryptic faunal di-       back (supratidal) beach, and most pill bugs actively
versity of ecological importance.                            avoid contact with the swash (Kensley 1974, Brown &
   The beach supratidal zone is also particularly vul-       Odendaal 1994). Juveniles, in particular, are occa-
nerable to anthropogenically induced habitat loss            sionally trapped in the swash where they can survive
and fragmentation (Ketmaier et al. 2003, Dugan et al.        submersion up to 24 h (Kensley 1974); floating is en-
2008). Impacts are often in the form of coastal devel-       abled by air pockets trapped between the pereiopods
opments (e.g. seawalls, buildings) that are typically        and pleopods (Menzies 1952, Kensley 1974), and pill
concentrated on the high-shore and in the supratidal         bugs might be able to use algae or other allochtho-
(Defeo et al. 2009, Pilkey & Cooper 2014). In addition,      nous inputs on beaches as rafts to facilitate dispersal
beach grooming, trampling, and vehicle use on the            (Brown & Odendaal 1994). Nevertheless, colonization
beach further increase the loss of supralittoral habitat     events appear to be rare (Brown & Odendaal 1994).
(Defeo et al. 2009, Dugan et al. 2010). The lack of a        Pill bugs therefore exhibit characteristics associated
pelagic larval phase in many supratidal species              with an elevated extinction risk (see Roberts &
(Defeo & Gómez 2005, Brown & McLachlan 2006)                 Hawkins 1999 for criteria), including their limited dis-
may limit connectivity among populations, thus               persal capacity, limited geographic distribution, habi-
decreasing rates of (re)colonization (Pechenik 1999)         tat specificity, patchy occurrence across their range,
of beaches and increasing the risk of inbreeding and         and high levels of sensitivity to human impact (Brown
local extirpation (Hubbard et al. 2014).                     & Odendaal 1994, Hubbard et al. 2014).
Bezuidenhout et al.: Connectivity in a supratidal brooder 3
In highly fragmented species such as A B
Tylos spp., genetic results may be im-
portant in directing conservation efforts
and management policy (von der Hey-
den et al. 2014). Genetic tools can be
applied to assess population connectiv-
ity, and so also inform decisions regard-
ing the location of, and distances be-
tween, marine reserves necessary for
East London
the effective protection of species (e.g.
von der Heyden 2009, Wright et al.
ScH WC
2015). Genetic studies may assist in pri- Cape Town Port Elizabeth
WIT DAN ER SR
oritizing species or populations for con- StB
servation by identifying cryptic biodi- Benguela
Current
versity (e.g. Hurtado et al. 2013) and
diversity hotspots (e.g. von der Heyden ATLANTIC OCEAN INDIAN OCEAN
2009).
We used the mitochondrial marker
cytochrome c oxidase subunit I (COI) to 400 km
assess genetic structure in the pill bug
C Cliffs and rocky shore ca.
T. capensis, within a naturally patchy 10 km long
seascape along the south coast of South
Alexandria Coastal Dunefield
Africa. Two hypotheses were tested to
investigate population differentiation in ScH
SR1
SR2
SR3
SR4
T. capensis at a broad spatial scale along
its range, and to assess the role of puta- WC
tive dispersal barriers at a small spatial Bird Island Passage
scale in Algoa Bay. First, congruent to
the findings for other oniscid isopods Sundays Estuary
Bird Island
8 km
mouth ca. 100 m wide
(e.g. Niikura et al. 2015, Mbongwa et al.
2019), we hypothesised that T. capensis
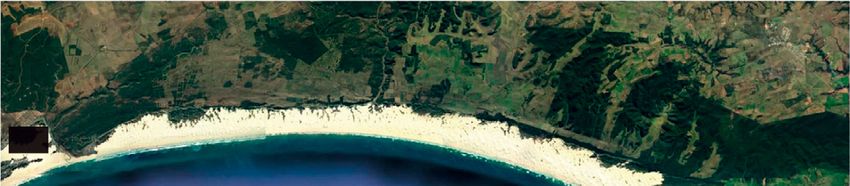
Fig. 1. Sample locations of (A) Tylos capensis along (B) the south coast of
is genetically differentiated across its South Africa. (C) Details of 3 beaches (ScH, SR, WC, representing 6 sam-
range, along a distance of ca. 600 km on ple locations) sampled within Algoa Bay, with the Sundays River Estuary
the southwest Indian Ocean seaboard of and cliffs separating Sundays River Beach and Woody Cape. Sample
South Africa, as expected from very low locations: Struisbaai (StB), Witsand (WIT), Dana Bay (DAN), Eersterivier
(ER), Schelmhoek (ScH), Sundays River Beach (SR, 4 locations), Woody
dispersal rates and connectivity. Second, Cape (WC) (Tylos capensis photo: K Bezuidenhout; Algoa Bay image:
the potential roles of natural coastal fea- Google Earth; 33° 45’ 05“ S, 25° 58’ 26“ E, eye altitude 46 km; accessed on
tures as dispersal barriers were investi- 16 July 2021)
gated in Algoa Bay, which is charac-
terised by several sandy beaches separated by vation and population persistence of Tylos spp., and
estuaries, a sea cliff, and stretches of rocky shore. In- sandy beach supralittoral communities in general,
vestigating population structure within a single bay, were also highlighted.
where study locations are subjected to similar past
and contemporary environmental conditions, may
help in identifying barriers to dispersal and drivers of 2. MATERIALS AND METHODS
genetic structure. Conducting such studies at small
spatial scales could assist in elucidating scales of con- 2.1. Sample collection and processing
nectivity and is hence crucial for conservation pro-
grammes. We hypothesised that a permanently open To assess the regional pattern of population struc-
estuary and a sea cliff represent dispersal barriers be- ture, Tylos capensis were collected from 10 sampling
tween adjacent sampling locations, resulting in sig- locations on 7 beaches along the south coast of South
nificant genetic differentiation in pill bugs at small Africa from Struisbaai in the west to Woody Cape
(ca. 60 km) spatial scales. The implications for conser- towards the east (Fig. 1A,B). Beaches further east of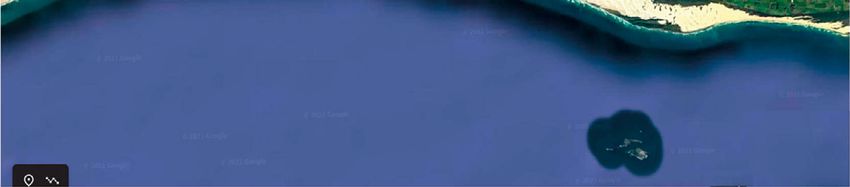
4                                        Mar Ecol Prog Ser 674: 1–13, 2021

Woody Cape to East London were visited but no pill         (Giribet et al. 1996, Merritt et al. 1998), and ND2
bugs were found. The south coast is characterised by       (using a novel primer) failed, and subsequent analy-
log-spiral bays, dominated by sandy beaches of inter-      ses were limited to COI.
mediate to dissipative-intermediate morphodynamic             Amplicons were visualised with ethidium bromide
type (Harris et al. 2011). Beaches are separated by        on 0.7% agarose gels prepared with Tris-acetate-
rocky shores and headlands, and several estuaries.         EDTA buffer. Sequencing was subsequently per-
The longest continuous stretch of rocky coastline          formed by Inqaba Biotechnologies (South Africa),
(~80 km), Tsitsikamma, is situated along the south         and the High Throughput Genomic Centre (Univer-
coast between Dana Bay and Eersterivier (Fig. 1).          sity of Washington, USA). Samples (n = 39) of COI
   Small-scale patterns of population structure and        were sequenced in both directions to determine the
barriers to gene flow were investigated at 6 of the 10     suitability of the primers and to detect inconsisten-
sampling locations located in Algoa Bay (Fig. 1C).         cies between forward and reverse sequences. We
Schelmhoek Dunefield is situated west of the perma-        found no discrepancies between forward and reverse
nently open Sundays River Estuary. The estuarine           sequences, and the remaining samples were there-
mouth, which separates Schelmhoek Beach from               fore sequenced in one direction (LCO1490) only.
Sundays River Beach to the east, is approximately          Sequences were aligned and edited in Geneious
100 m wide. Sundays River Beach is 40 km long and          6.1.8 (Biomatters, USA) and checked to verify the
backed by the Alexandria Coastal Dunefield (ACD).          absence of double peaks indicating heteroplasmy
The ACD, comprising transverse dunes rising to a           (GenBank accession numbers: MZ540108−MZ5401-
height of approximately 150 m, is the largest coastal      40). Codons were translated to amino acids in
dune system in South Africa (Illenberger & Rust            Geneious Ver. 6.1.8 to determine if nucleotide substi-
1988). Net dune movement takes place in a north-           tutions were synonymous or not, and to inspect
easterly direction, as determined by the direction of      sequences for the presence of in-frame stop codons
the prevailing winds (McLachlan 1991). The area is         that could indicate nuclear mitochondrial pseudo-
near-pristine, with no development within the littoral     genes (NUMTs; Song et al. 2008); no evidence of
active zone (the area from the surf zone to the fore-      NUMTs and heteroplasmy was found.
dunes), which allows for unhindered dune move-
ment. The 50 km long dunefield (Illenberger & Rust
1988) backs both the Sundays River Beach and                                 2.2. Data analyses
Woody Cape Beach, although the 2 beaches are
interrupted by a ~10 km continuous, steep calcaren-           2.2.1. Genetic diversity and population structure
ite sea cliff, on the high-water mark (Fig. 1C). Four
locations (SR1−4) were sampled on the Sundays                Unbiased indices of molecular diversity were
River Beach (Fig. 1C).                                     estimated for all sample locations in DNASP 5.10 (Li-
   Pill bugs were collected by means of 30−40 pitfall      brado & Rozas 2009) and Arlequin 3.5 (Excoffier & Lis-
traps (1 l containers, baited with peanut butter) at       cher 2010). Haplotype networks were constructed in
each location, set at dusk in the supratidal and re-       Haploviewer (www.cibiv.at/~greg/haploviewer, (Salz-
trieved the following morning. Specimens were pre-         burger et al. 2011), based on a maximum likelihood
served in absolute (99%) ethanol until further pro-        phylogenetic tree, constructed in Phylip 3.69 (Fel-
cessing. DNA was then extracted from isopod legs, to       senstein 1989). MEGA 6 (Tamura et al. 2013) was
avoid possible contamination by gut contents, using        used to determine the most appropriate nucleotide
a Gentra® Puregene® Tissue Kit (Qiagen), following         substitution model (i.e. the model that scored the
the manufacturer’s protocol for preserved tissues. A       lowest Bayesian information criterion value). Pair-
fragment of ca. 710 bp of COI was amplified with the       wise genetic distances, corrected for Tamura 3-para-
universal primers (LCO1490 and HC02198) of Fol-            meter (Tamura 1992) nucleotide substitution, were
mer et al. (1994) in 20 μl reactions, using Kapa Taq 2×    subsequently determined among haplotypes.
ReadyMix DNA Polymerase (Kapa Biosystems), with              Hierarchical population structure, comparing vari-
0.25 μM of each primer. Thermal cycling was perfor-        ance based on nucleotide differences among all
med at 95°C for 2 min (initial denaturation), 35 cycles    sample locations (‘populations’) (ΦST), among groups
of 95°C for 1 min, annealing at 49.4°C for 30 s, and       (ΦCT), and among sample locations within groups
72°C for 1 min, followed by 72°C for 7 min (final          (ΦSC) was estimated in Arlequin (Excoffier & Lischer
extension). Attempts to amplify and sequence addi-         2010) as an analysis of molecular variance (AMOVA,
tional markers, including 16S, cytochrome b, 18S           Excoffier et al. 1992). Groups were defined a priori
Bezuidenhout et al.: Connectivity in a supratidal brooder                           5

based on the clades identified in the haplotype net-          were again pooled when these were not differen-
work. An AMOVA was implemented with Tamura                    tiated significantly, for reasons stated above:
3-parameter nucleotide substitution model (Tamura             (1) Schelmhoek; (2) SR 1 and 2; (3) SR 3 and 4; and
1992) with 0.05 gamma correction. Significance was            (4) Woody Cape. Each run was performed using
determined with 10 000 permutations (Excoffier et al.         Bayesian inference, and consisted of 3 replicates of
1992). Pairwise ΦST values based on nucleotide dif-           2 000 000 steps each, with 10 000 burn-in steps. Analy-
ferences between sequences were estimated for pill            ses were implemented with Metropolis-Hastings
bugs among all study locations and tested for signifi-        sampling, exponential priors (which in initial test
cant deviation from zero with 10 000 permutations.            runs yielded better convergence of posterior distri-
Differences in haplotype frequency among popula-              butions than did uniform priors), and 4 heated chains
tions were assessed with an Exact test, with 100 000          (i.e. 1.0, 1.5, 3.0, 1 000 000). Other migration models
Markov chain steps and 10 000 dememorization steps            (e.g. bidirectional migration in Algoa Bay) were
(Raymond & Rousset 1995), performed in Arlequin.              tested in Migrate-N, but these did not converge and
Critical p-values for multiple pairwise tests were cor-       were not pursued further.
rected to account for false discovery rates by apply-
ing the B-Y correction described by Benjamini &
Yekutieli (2001) and Narum (2006). Pairwise genetic                        2.2.3. Marker neutrality and
distances among individual pill bugs were deter-                             population demographics
mined in MEGA 6 (Tamura et al. 2013) based on the
Tamura 3-parameter model.                                        Departures from neutrality in T. capensis COI and
                                                              signatures of past population expansion were exam-
                                                              ined by determining the D (Tajima 1989) and Fs (Fu
                   2.2.2. Gene flow                           1997) statistics in Arlequin (with 1000 simulations),
                                                              and R2 (Ramos-Onsins & Rozas 2002) in DNASP 5.10
   Gene flow (M = m/μ, mutation-scaled migration              (Librado & Rozas 2009). The demographic histories
rates) and effective population size (θ = Ne μ, muta-         were further assessed by means of pairwise mis-
tion-scaled effective population size) were estimated         match distributions under both the population and
from Bayesian coalescence modelling in Migrate-N              range-expansion models (Rogers & Harpending
3.4.6 (Beerli & Felsenstein 2001, Beerli 2009). Nem,          1992, Rogers 1995) for 3 separate groups (i.e. south-
the number of immigrants per generation independ-             western, south-eastern, Woody Cape). Harpending’s
ent of mutation rate, was calculated by multiplying θ         raggedness index (Hri, Harpending 1994) and the
and M estimated in Migrate-N. Nem estimated from              sum of squared deviations (SSD), time since expan-
coalescence approaches (such as those implemented             sion (τ), initial and final population sizes (θ) were
in Migrate-N) is an average of immigration over the           estimated in Arlequin (Excoffier & Lischer 2010),
past Ne generations for mitochondrial markers (al-            with 95% confidence intervals for 1000 bootstrapped
though biased towards estimates in more recent                iterations.
time; Beerli 2009) and as such reflects contemporary
as well as historic gene flow.
   Gene flow was estimated first for sample locations                               3. RESULTS
across the range of T. capensis, assuming a bidirec-
tional stepwise migration model between study loca-             3.1. Genetic diversity and population structure
tions. Due to the constraints associated with estimat-
ing many parameters, adjacent study locations not                The final sequence assembly consisted of 581 bp
significantly differentiated from each other (in terms        and 227 individuals, which yielded 33 haplotypes
of pairwise ΦST values) were pooled to form 5 assem-          with 34 substitutions and 32 segregating sites (S,
blages (i.e. not the same groups as implemented in            Table 1). Haplotype (h) and nucleotide (π) diversity
the AMOVA), viz. (1) Struisbaai; (2) Witsand; (3) Da-         ranged from to 0.157 to 0.618, and from 0.0007 to
na Bay and Eersterivier; (4) Schelmhoek and Sun-              0.002, respectively (Table 1). Nucleotide substitu-
days River Beach locations (SR 1 to SR 4); and                tions were predominantly transitions and almost ex-
(5) Woody Cape. Second, gene flow was estimated               clusively synonymous, with the exception of one
for pill bugs in Algoa Bay, across the 2 putative barri-      non-synonymous substitution recorded from Struis-
ers and along the continuous beach, assuming a step-          baai (Table 1). Woody Cape pill bugs had the lowest
wise eastwards migration model. Study locations               haplotype diversity, but average nucleotide diversity.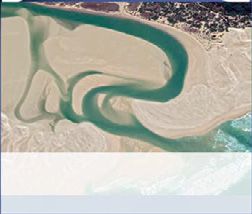
6                                             Mar Ecol Prog Ser 674: 1–13, 2021

Table 1. Diversity indices for Tylos capensis, collected from 10 sites on 7 beaches: H: number of haplotypes; h: haplotype diver-
sity; π: nucleotide diversity; S: number of segregating sites on sequences; Subst.: number of substitutions; Ks: number of syn-
onymous substitutions; Ka: number of non-synonymous substitutions; TS : number of transitions; TV : number of transversions;
      Priv. subst.: number of private substitution sites; Priv. haps: private haplotypes. Site names abbreviated as in Fig. 1

               StB     WIT    DAN       ER      ScH      SR1      SR2     SR3      SR4       WC      Total      Mean ± SD

    n             20     14     25       24     28     34         19     27         11        25      227       22.7 ± 6.83
    H             5.7    2.8    4.8      3.8    5.8    5.8        4.7    5.8        4.5       2.9     32.9       4.8 ± 1.14
    h           0.550 0.360 0.350      0.240 0.470    0.400      0.440 0.430       0.560     0.150   0.780    0.401 ± 0.1211
    π           0.0014 0.0007 0.0007   0.0005 0.0016 0.0010     0.0013 0.0010     0.0020    0.0012   0.011   0.0011 ± 0.00046
    S             4.8    1.9    3.8      2.9    5.8    4.9        5.7    5.8        6.4       7.7     31.9       4.9 ± 1.81
    Subst.        4.8    1.9    3.8      2.9    5.8    4.9        5.7    5.8        6.4       7.7     33.9       4.9 ± 1.72
    Ks            3.8    1.9    3.8       3     5.8    4.9        5.7    5.8        6.4       7.7      33        5.1 ± 1.85
    Ka             1      0      0        0      0      0          0      0          0         0        1        0.1 ± 0.32
    TS            2.9    1.9    3.8      1.9    5.8    4.9        4.7    5.8        6.4       6.7     28.9       4.5 ± 1.79
    TV            1.9     0      0        1      0      0          1      0          0         1        5        0.5 ± 0.67
    Priv. subst. 3.8     0.9     1       2.9     0      1         1.9     1         2.7       3.8     19.9       1.9 ± 1.34
    Priv. haps. 3.8      0.9    2.9      2.9    0.0    1.9        1.9    1.0        2.7       1.0     19.9       1.9 ± 1.18

  Patterns of population differentiation were domi-                                      3.2. Gene flow
nated by a sharp west−east divide between Eerste-
rivier and Schelmhoek. The haplotype network                         The estimated number of effective migrants (Nem)
showed no shared haplotypes between the western                    was generally low between groups; from Witsand to
(Struisbaai, Witsand, Dana Bay, Eersterivier) and                  neighbouring groups, dispersal was relatively high,
eastern groups (Schelmhoek, SR 1−SR 4), which                      while dispersal into Witsand was very low (Fig. 2B;
were separated by 10 substitutions. Woody Cape                     Table S2). Dispersal rates in Algoa Bay were high
Tylos represented a third group (Fig. 2A). Only one                between Schelmhoek and SR1 and 2, and between
haplotype was shared between Woody Cape and                        SR 1 and 2, and SR 3 and 4 (Fig. 2C; Table S2).
south-eastern pill bugs. Genetic distances between                 Mutation-scaled effective population sizes (θ) for
pairs of haplotypes ranged from 0.17 to 2.83% for                  the 5 groups were low, although estimates for the
Tamura 3-parameter correction (Table S1 in the                     populations of Struisbaai and Schelmhoek/Sundays
Supplement at www.int-res.com/articles/suppl/m674                  River were an order of magnitude larger than those
p001_supp.pdf).                                                    of the other study locations (Fig. 2B,C; Table S2).
  Strong, significant population structure was esti-               Corresponding to the geographic pattern of the
mated for T. capensis across all study locations                   haplotype network, migration between the 2 main
(AMOVA without group assignment: ΦST = 0.90,                       regions (south-west and south-east) was estimated
p < 0.0001). An AMOVA, using the same 3 groups                     to be zero.
identified in the haplotype network, again revealed
strong, significant, population structure, based on
nucleotide differences, across all study locations                               3.3. Marker neutrality and
(ΦST = 0.93, p < 0.0001), as well as among the 3                                  population demographics
groups (ΦCT = 0.92, p < 0.0001), but showed much
less, yet significant, variation among sites within                  Tests for marker neutrality (Tajima’s D, FS) for
groups (ΦSC = 0.15, p < 0.0001). Pairwise population               the 3 groups were significantly negative in most
differentiation based on nucleotide differences                    instances, thus rejecting the null hypothesis of
(ΦST) revealed strong significant differentiation                  neutrality (i.e. no selection and constant population
among most study locations, except among Sundays                   size; Fig. 3; Table S3). FS estimated for the Woody
River Beach sites (SR1−SR4) and Schelmhoek, and                    Cape population (group), however, did not reject
between Dana Bay and Eersterivier (Table 2). The                   neutrality (Fig. 3, Table S3). At the level of indi-
Exact test yielded results similar to that of the pair-            vidual populations (beaches), estimates of Tajima’s
wise ΦST estimates (Table 2; global p-value <                      D and FS were negative in all cases, supportive of
0.0001), strongly rejecting the null hypothesis of                 purifying selection or recent expansion (Table S3).
equal haplotype frequencies.                                       Tajima’s D was significant for Dana Bay, SR 2−
Bezuidenhout et al.: Connectivity in a supratidal brooder 7
SR 4, and Woody Cape, while
marker neutrality was similarly
rejected for Struisbaai, Dana Bay,
Eersterivier, and Sundays River 1
and 3, based on Fu’s FS (Table S3).
Estimates of R2 were significant p <
0.05) in all cases. Mismatch distribu-
tions and estimates for Hri and SSD,
for the 3 groups, did not reject the
population or the range-expansion
models (p > 0.05 in all cases; Fig. 3,
Table S4). Similarly, neither the
demographic expansion nor the
range-expansion model was rejected
for individual populations, except
Schelmhoek and SR 2 (demographic
expansion model rejected: SSD 0.3,
p < 0.05, Table S3).
4. DISCUSSION
This study aimed to assess genetic
structure and population connectivity
in the high-shore crustacean Tylos
capensis across (1) its range along
~600 km of the South African south
coast and (2) at a small spatial scale
(~60 km) to assess the roles of a per-
manently open estuary (Sundays Ri-
ver) and a sea cliff (Woody Cape) as
potential barriers to gene flow. The
results broadly supported the expec-
tations for this supralittoral, direct
developer. First, pill bugs generally
Fig. 2. Haplotype network and migration rates for Tylos capensis along the displayed strong population structure
south coast. (A) Haplotype network. Each circle represents a unique haplo- across their range, showing 3 groups
type, and numbers in, and size of, circles indicate the frequency of that haplo-
type. Each branch indicates 1 mutational step; small, solid circles on branches
with distinct regional distributions
denote unsampled mutations. Sampling locations are shown in different (Fig. 2A). Second, at a small spatial
colours and abbreviated as in Fig. 1. (B,C) Estimates of gene flow among, and scale, the virtual absence of pairwise
effective population size for (B) 5 pooled sampling locations along the South (ΦST) genetic differentiation, coupled
African south coast, and (C) 4 pooled sampling locations in Algoa Bay, super-
with the large number of migrants
imposed on a schematic of palaeocoastlines (individual sampling locations
also shown). Grey dashed lines indicate the boundaries of pooled populations (Nem) supported the notion of high
implemented in Migrate-N. Estimates of the modal number of effective population connectivity along the
migrants (Nem) between adjacent locations are indicated with black arrows, continuous Sundays River Beach
where the arrows represent the relative magnitude and direction of gene flow; (Fig. 2C). Patterns of differentiation
dashed arrows indicate a modal Nem = 0.0 (see Table S2 for confidence inter-
vals). Population sizes are given as modal θ-values, with 2.5−97.5 percentiles, also indicated that the sea cliff be-
for each group of sampling locations. Palaeo-sea levels at −75 m/–45 m (inter- tween Woody Cape and Sunday
glacial period) and −120 m (Last Glacial Maximum) are visualised in light and River Beach acted as a barrier to
dark grey lines, respectively, as per Dingle & Rogers (1972) and Toms et al. gene flow, whereas the Sundays
(2014); black dashed lines indicate predominantly rocky shore areas. Coastal
River Estuary did not. The results
features: 1: Breede River adjacent to Witsand; 2: Tsitsikamma rocky shore; 3:
Plettenberg Bay Portal (sensu Compton et al. 2011); 4: Sundays River Estuary; generally support the hypothesis that
5: sea cliff at 'The Krans' (white dashed line); 6: Bird Island pill bugs are distributed predomi-8 Mar Ecol Prog Ser 674: 1–13, 2021
Table 2. Pairwise ΦST values (below the diagonal), and significance of exact tests (above the diagonal) for COI sequences
of Tylos capensis collected from 10 locations. *p < 0.012 (critical p-value after B-Y correction for multiple comparisons);
**p < 0.0001; NS: not-significant. Site names abbreviated as in Fig. 1
StB WIT DAN ER ScH SR1 SR2 SR3 SR4 WC
StB ** NS NS ** ** ** ** ** **
WIT 0.53** ** ** ** ** ** ** ** **
DAN 0.06* 0.60** NS ** ** ** ** ** **
ER 0.06* 0.64** 0.02 ** ** ** ** ** **
ScH 0.92** 0.92** 0.94** 0.94** NS NS NS NS **
SR1 0.94** 0.95** 0.96** 0.96** 0.04 NS NS NS **
SR2 0.93** 0.94** 0.95** 0.95** 0.00 0.02 NS NS **
SR3 0.94** 0.95** 0.96** 0.96** 0.04 0.02 0.00 NS **
SR4 0.91** 0.93** 0.94** 0.94** −0.02 0.04 −0.01 0.00 **
WC 0.89** 0.93** 0.93** 0.92** 0.89** 0.92** 0.91** 0.92** 0.89**
nantly as isolated populations across their range, 4.1. Genetic differentiation at a regional scale
particularly where populations are separated by
dispersal barriers, but also indicate the effects of Supralittoral communities are thought to harbour
demographic history. considerable cryptic diversity (Hurtado et al. 2013,
2014, Greenan et al. 2018), so the distinct genetic and
spatial separation of groups demonstrated here for
2500
South-western group: T. capensis might suggest the existence of unique spe-
τ: 0.7 (0.31–1.16)
2000 θ: 0.01 (0.001–0.46) cies or subspecies. However, while genetic distances
M: 99999.0 (2.29–99999.00) among the haplotypes of T. capensis (0.17−2.83%)
SSD: 0.001 (NS)
1500 Hri: 0.09 (NS) were more pronounced than those among populations
Tajima’s D: –2.04** of T. punctatus (Clade A in Hurtado et al. 2013), they
FS : –13.4***
1000 were well below the pairwise COI differences reported
between known species of Tylos (11.5−42%, Hurtado
500 et al. 2014; see also Mbongwa et al. 2019) and between
A species of Ligia, another oniscid isopod (13.2−26.7%;
0
Markow & Pfeiler 2010). Furthermore, only one (pri-
400
Observed Woody Cape group: vate) nucleotide substitution was non-synonymous in
350 Simulated τ: 8.7 (0.00–86.70)
θ: 0.1 (0.001–0.67)
T. capensis. Therefore, T. capensis occupying the
300 M: 0.1 (0.00–99999.00) South African south coast should be considered a sin-
Frequency
250 SSD: 0.005 (NS)
Hri: 0.61 (NS)
gle species based on the COI marker.
200 Tajima’s D: –2.1* There was, nonetheless, strong genetic differentia-
FS : 0.7
150 tion among the 3 groups (ΦCT), and among (ΦST) and
100 between (pairwise ΦST) most populations of T. capen-
50 sis, with only some exceptions. COI differentiation in
B
0
7000 Fig. 3. Mismatch distributions for Tylos capensis, according
Schelmhoek/Sundays River group: to the spatial-expansion models for (A) the south-western, (B)
6000 τ: 0.2 (0.1–3.14)
θ: 0.50 (0.001–0.60) the Woody Cape, and (C) the Schelmhoek/Sundays River
5000 M: 656.2 (0.41–99999.00) (south-eastern) groups. Solid black circles indicate the ob-
SSD: 0.001 (NS) served trend, and dark grey lines show the simulated trends.
4000 Hri: 0.09 (NS) Light grey-shaded areas delineate the 95% confidence inter-
Tajima’s D: –2.09**
3000 FS : –16.3***
val. Note the different scales on the y-axes. Mutation-scaled
effective population size (θ), mutation-scaled immigration
2000 rates (M ), with 95% confidence intervals in parentheses,
and estimates for the sum of squared deviation (SSD) and
1000
C Harpending’s raggedness index (Hri) are also shown for
0 each clade. Estimates for population and range expansion
0 1 2 3 4 5 6 7 8 9 models were very similar in all cases. *p < 0.05; **p < 0.01;
Pairwise difference ***p < 0.001; NS: not significantBezuidenhout et al.: Connectivity in a supratidal brooder 9
T. capensis was comparable to that of other supra- nently open for at least the past 80 yr (S. Taljaard
tidal direct developers, including isopods (Niikura et unpubl. data), but past climatic variability, including
al. 2015, Mattos et al. 2019, Mbongwa et al. 2019) a warmer and drier period relative to the present (the
and talitrid amphipods from beaches lacking large Holocene Maximum; Partridge et al. 1999), could
wrack inputs (De Matthaeis et al. 2000, Pavesi & Ket- have resulted in periodic mouth closures. Homoge-
maier 2013). Strong, significant estimates of popula- neous genetic structure across the Sundays Estuary
tion structure were also demonstrated for peracarids might therefore reflect historic connectivity, because
occupying lower tidal levels on the beach with ready very recent divergence or range and population ex-
access to water (e.g. Varela & Haye 2012, Takada et pansion events could produce the same lack of popu-
al. 2018), although there are exceptions (e.g. Tourinho lation differentiation (Whitlock & McCauley 1999,
et al. 2016). The generally strong genetic differentia- Hart & Marko 2010). Mismatch analyses and a star-
tion and low gene flow (Nem) in T. capensis suggest shaped phylogeny confirmed that range and/or pop-
low connectivity, which is consistent with expecta- ulation expansion events took place (Slatkin & Hud-
tions for species with very low vagility living in frag- son 1991) in T. capensis. In contrast, the sea cliffs at
mented habitats. Woody Cape probably formed with rising sea levels
during the Pleistocene. The earlier relative time since
expansion (τ) estimated for pill bugs from Woody
4.2. Genetic differentiation and dispersal barriers Cape Beach is consistent with an early range expan-
at a small spatial scale sion into Woody Cape followed by a vicariance event
(formation of the sea cliff) which separated this pop-
Patterns of gene flow within Algoa Bay indicated ulation relatively early from that of Schelmhoek/
that some coastal features could represent dispersal Sundays River (unfortunately, time of divergence
barriers to pill bugs. Significant population structure between the Woody Cape and Sundays River Beach
and low Nem values between Sundays River Beach pill bugs is unknown). Although infrequent stochas-
and Woody Cape coincided with the presence of the tic water dispersal and subsequent gene flow from
sea cliffs separating these 2 beaches. In contrast, the Schelmhoek/Sundays River Beach to Woody Cape
permanently open estuary appeared not to have lim- Beach is possible, the shared haplotype between
ited gene flow, as indicated by non-significant ge- these study locations and very low estimated Nem
netic differentiation and large Nem values between likely reflects ancestral polymorphism. Low rates of
Schelmhoek and Sundays River Beach. These 2 coas- gene flow into and from Woody Cape is therefore
tal features differ in their spatial scales. The estuary likely due to an ancient divergence and is presently
mouth is approximately 100 m wide, perhaps allow- maintained by the sea cliff.
ing short stochastic dispersal events via the swash,
while the ~10 km long coastal cliffs are more exten-
sive. Spatial extent might hence account for differ- 4.3. Other drivers of genetic differentiation
ences in the effectiveness of the features as dispersal
barriers. The large Nem values estimated along the Although not explicitly tested here, palaeo-
continuous Sundays River Beach are supported by coastlines could explain the observed genetic struc-
previous observations of T. granulatus that colonized ture in pill bugs at different geographic scales. The
a newly formed sandy berm across the Orange River palaeo-sea level along the southern African coast
mouth (west coast, South Africa) from the adjacent, retreated after the Last Glacial Maximum (at sea lev-
continuous, sandy beach, over a period of 2 yr (Brown els between −120 and −45 m), exposing more, largely
& Odendaal 1994). Elsewhere, Odendaal et al. (1999) continuous, sandy beach habitat particularly over the
estimated a theoretical maximum travel distance, Agulhas Bank (Van Andel 1989, Toms et al. 2014).
alongshore, of 936 m per 2 h activity window for Dispersal facilitated by the increased habitat connec-
T. granulatus without feeding (or 80 m over 2 h with tivity among Dana Bay and Eersterivier (as historic
frequent stops). The results presented for T. capensis population connectivity) or the recent divergence fol-
therefore provide tentative support that migration lowing a range expansion from a single ancestral
and hence gene flow in pill bugs is influenced by the population during this time, might explain the lack of
degree of contemporary habitat continuity. genetic differentiation between these 2 sites. Unfor-
The sea cliffs and estuary also differ in their tempo- tunately, these scenarios could not be distinguished
ral persistence. Aerial photographic evidence sug- because divergence times are not known. The rapid
gests the Sundays River Estuary has been perma- narrowing of the continental shelf in the vicinity of10 Mar Ecol Prog Ser 674: 1–13, 2021
Cape St Francis, i.e. the Plettenberg Bay Portal erosion is a serious risk (Bird 2000). Other impacts,
(sensu Compton 2011; Fig. 2B), was characterised by such as artificial light, which has been shown to
rocky substrate at most palaeo-sea levels (Dingle & affect animal behaviour and physiology, also extends
Rogers 1972). Estimates of effective dispersal along beyond the boundaries of coastal cities (Gaston et al.
the south coast, as well as the spatial distribution of 2015), with potentially severe consequences for the
haplotypes, provides evidence for Plettenberg Bay survival of sandy beach supratidal fauna (Luarte et
Portal as an historic barrier to dispersal in T. capensis. al. 2016), including T. capensis. Furthermore, sandy
Genetic structure in T. capensis is likely also driven beaches represent several different types of habitats,
by small effective population sizes, further main- commonly described as different morphodynamic
tained by low rates of migration. Female pill bug states (McLachlan et al. 2018). Not all beach types
population sizes, here estimated as θ, were generally are suitable to all beach species, with some species
small. Coupled with Nem values estimated here as showing greater habitat specificity than others
0.0−3.9 immigrants per generation, it is conceivable (Brown & McLachlan 2006, Defeo & McLachlan
that at least some populations of T. capensis would 2011). Consequently, beach habitats are likely more
be subjected to inbreeding and genetic drift, as ex- fragmented than typically perceived, particularly at
pected for small populations (see Lowe & Allendorf contemporary timescales.
2010). Furthermore, pill bug sex ratios are male- Marine reserves of sufficient size, spaced at appro-
biased (Gonçalves et al. 2005, K. Bezuidenhout pers. priate distances to facilitate stepwise dispersal, are
obs.), which may also reduce female effective popu- recognized as an effective means to protect marine
lation size. Population differentiation in T. capensis fauna (Wright et al. 2015). Considering, however, the
may therefore be further enhanced and maintained low dispersal ability of T. capensis and potentially of
by small female population sizes, in addition to low other supratidal taxa, it is unlikely that these species
vagility. would benefit from a network of closely spaced re-
Other processes not considered here may con- serves to facilitate movement among beaches, at
tribute to the observed patterns of COI differentia- least on ecological time scales (although this might
tion in T. capensis. These include the possibility of benefit connectivity in rafting talitrid amphipods;
male-biased dispersal, which cannot be detected Pavesi & Ketmaier 2013). Rather, the full protection
with mitochondrial DNA (Hübner et al. 2015), or sex- of a number of extensive sandy beaches with intact
based survival of migrants (Baker & Rao 2004). Finally, littoral active zones to allow the natural retreat of the
Wolbachia, a maternally inherited bacterium, is wide- beach with sea-level rise, which also accommodate
spread among arthropods and can have a marked large populations of supralittoral invertebrates, would
effect on host population genetic structure (Hurst & be more efficient than a series of many smaller or
Jiggins 2005). Nonetheless, geographic patterns of partially protected beaches. Adequate protection of
differentiation in T. capensis are congruent with his- species such as T. capensis should include at least a
toric sea levels and low concomitant gene flow, and representative of each of the dominant groups (von
broadly resemble the findings of previous studies der Heyden et al. 2014).
(e.g. Hurtado et al. 2013), giving credence to the In conclusion, the pill bug T. capensis shows strong
interpretation here. population differentiation across its range, as was
shown for congeners elsewhere as well as for other
supratidal taxa. The patterns of gene flow and popu-
4.4. Implications and concluding remarks lation structure estimated here were consistent with
reconstructed palaeo-shorelines and beach habitat
The genetic patterns in T. capensis, i.e. the small connectivity, suggesting that dispersal took place
effective female population sizes and low connectiv- mainly over land, and that gene flow among beaches
ity, resemble those of populations at risk of habitat was predominantly historic. Extensive breaks in ha-
fragmentation and extinction (Frankham 1996, Key- bitat continuity, such as sea cliffs, appear to be effec-
ghobadi 2007). As such, our results support previous tive dispersal barriers to maintain contemporary sep-
assertions of high extirpation vulnerability of pill aration between diverged populations. Conversely,
bugs because of their limited colonization capacity in continuous beaches facilitate dispersal and connec-
fragmented habitats (Brown 2000, Hubbard et al. tivity among habitat patches. Pill bugs occur as natu-
2014). Large-scale coastal development along the rally fragmented populations, thus increasing their
South African coast is still reasonably limited (Harris risk of extirpation, but anthropogenically driven ha-
et al. 2014) and confined to a few coastal nodes, but bitat fragmentation superimposed on sea-level riseBezuidenhout et al.: Connectivity in a supratidal brooder 11
would further increase the risk of extinction in this Dingle R, Rogers J (1972) Effects of sea-level changes on
species. Representative protection of the entire lit- the Pleistocene palaeoecology of the Agulhas Bank.
Palaeoecol Afr 6:55−58
toral active zone is imperative for the survival of this, Dugan JE, Hubbard DM, Rodil IF, Revell DL, Schroeter S
and other, supralittoral species. (2008) Ecological effects of coastal armoring on sandy
beaches. Mar Ecol 29:160−170
Dugan JE, Defeo O, Jaramillo E, Jones AR and others (2010)
Acknowledgements. This study was funded by the National Give beach ecosystems their day in the sun. Science 329:
Research Foundation (NRF), the Applied Centre for Climate 1146
and Earth System Sciences (ACCESS). Staff of the South Excoffier L, Lischer HE (2010) Arlequin suite ver 3.5: a new
African National Parks, Woody Cape Section, are also grate- series of programs to perform population genetics analy-
fully acknowledged for logistical support. ses under Linux and Windows. Mol Ecol Resour 10:
564−567
Excoffier L, Smouse PE, Quattro JM (1992) Analysis of mo-
LITERATURE CITED lecular variance inferred from metric distances among
DNA haplotypes: application to human mitochondrial
Baker MB, Rao S (2004) Incremental costs and benefits DNA restriction data. Genetics 131:479−491
shape natal dispersal: theory and example with Hemi- Felsenstein J (1989) PHYLIP 3.2 manual. University of Cali-
lepistus reaumuri. Ecology 85:1039−1051 fornia Herbarium, Berkeley, CA
Baldanzi S, Gouws G, Barker NP, Fratini S (2016) Molecular Folmer O, Black M, Hoech W, Lutz R, Vrijenhoek R (1994)
evidence of distinct evolutionary units in the sandhopper DNA primers for amplification of mitochondrial cyto-
Talorchestia capensis (Amphipoda, Talitridae) along chrome c oxidase subunit I from diverse metazoan inver-
South African coasts. Hydrobiologia 779:35−46 tebrates. Mol Mar Biol Biotechnol 3:294−299
Beerli P (2009) How to use MIGRATE or Why are Markov Frankham R (1996) Relationship of genetic variation to pop-
chain Monte Carlo programs difficult to use? In: ulation size in wildlife. Conserv Biol 10:1500−1508
Bertorelle G, Bruford MW, Hauffe HC, Rizzoli A, Vernesi Fu YX (1997) Statistical tests of neutrality of mutations
C (eds) Population genetics for animal conservation. against population growth, hitchhiking and background
Cambridge University Press, Cambridge, p 42−79 selection. Genetics 147:915−925
Beerli P, Felsenstein J (2001) Maximum likelihood estima- Gaston KJ, Duffy JP, Bennie J (2015) Quantifying the ero-
tion of a migration matrix and effective population sizes sion of natural darkness in the global protected area sys-
in n subpopulations by using a coalescent approach. Proc tem. Conserv Biol 29:1132−1141
Natl Acad Sci USA 98:4563−4568 Giribet G, Carranza S, Baguna J, Riutort M, Ribera C (1996)
Benjamini Y, Yekutieli D (2001) The control of the false dis- First molecular evidence for the existence of a Tardi-
covery rate in multiple testing under dependency. Ann grada + Arthropoda clade. Mol Biol Evol 13:76−84
Stat 29:1165−1188 Gonçalves SC, Pardal MA, Cardoso PG, Ferreira SM,
Bird E (2000) Coastal geomorphology: an introduction. John Marques JC (2005) Biology, population dynamics and
Wiley, Chichester secondary production of Tylos europaeus (Isopoda, Tyli-
Brown A (2000) Is the sandy-beach isopod Tylos granulatus dae) on the western coast of Portugal. Mar Biol 147:
an endangered species? S Afr J Sci 96:466 631−641
Brown AC, McLachlan A (2006) The ecology of sandy Greenan TM, Griffiths CL, Santamaria CA (2018) Molecular
shores, 2nd edn. Academic Press, London approaches uncover cryptic diversity in intertidal Ligia
Brown A, Odendaal F (1994) The biology of oniscid Isopoda isopods (Crustacea, Isopoda, Ligiidae) across the south-
of the genus Tylos. Adv Mar Biol 30:89−153 ern Africa coastline. PeerJ 6:e4658
Compton JS (2011) Pleistocene sea-level fluctuations and Harpending HC (1994) Signature of ancient population
human evolution on the southern coastal plain of South growth in a low-resolution mitochondrial DNA mismatch
Africa. Quat Sci Rev 30:506−527 distribution. Hum Biol 66:591−600
Coupland GT, Duarte CM, Walker DI (2007) High meta- Harris L, Nel R, Schoeman D (2011) Mapping beach morpho-
bolic rates in beach cast communities. Ecosystems 10: dynamics remotely: a novel application tested on South
1341−1350 African sandy shores. Estuar Coast Shelf Sci 92:78−89
De Matthaeis E, Ketmaier V, Davolos D, Schembri P (2000) Harris L, Campbell EE, Nel R, Schoeman D, Beaumont L
Patterns of genetic diversity in Mediterranean supra- (2014) Rich diversity, strong endemism, but poor protec-
littoral amphipods (Crustacea, Amphipoda). Pol Arch tion: addressing the neglect of sandy beach ecosystems
Hydrobiol 47:473−487 in coastal conservation planning. Divers Distrib 20:
Defeo O, Gómez J (2005) Morphodynamics and habitat 1120−1135
safety in sandy beaches: life-history adaptations in a Hart MW, Marko PB (2010) It’s about time: divergence,
supralittoral amphipod. Mar Ecol Prog Ser 293:143−153 demography, and the evolution of developmental modes
Defeo O, McLachlan A (2011) Coupling between macro- in marine invertebrates. Integr Comp Biol 50:643−661
fauna community structure and beach type: a decon- Hubbard DM, Dugan JE, Schooler NK, Viola SM (2014)
structive meta-analysis. Mar Ecol Prog Ser 433:29−41 Local extirpations and regional declines of endemic
Defeo O, McLachlan A, Schoeman DS, Schlacher TA and upper beach invertebrates in southern California. Estuar
others (2009) Threats to sandy beach ecosystems: a Coast Shelf Sci 150:67−75
review. Estuar Coast Shelf Sci 81:1−12 Hübner L, Pennings SC, Zimmer M (2015) Sex-and habitat-
Deidun A, Bonavia FG, Schembri PJ (2011) Distribution of specific movement of an omnivorous semi-terrestrial
Tylos spp. in the Maltese Islands and population dynam- crab controls habitat connectivity and subsidies: a multi-
ics of Tylos europaeus. J Coast Res 64:369−372 parameter approach. Oecologia 178:999−101512 Mar Ecol Prog Ser 674: 1–13, 2021
Hurst GDD, Jiggins FM (2005) Problems with mitochondrial specific studies in molluscan taxa. Mol Mar Biol Biotech-
DNA as a marker in population, phylogeographic and nol 7:7−11
phylogenetic studies: the effects of inherited symbionts. Narum SR (2006) Beyond Bonferroni: less conservative analy-
Proc R Soc B 272:1525−1534 ses for conservation genetics. Conserv Genet 7:783−787
Hurtado LA, Lee EJ, Mateos M (2013) Contrasting phylo- Niikura M, Honda M, Yahata K (2015) Phylogeography of
geography of sandy vs. rocky supralittoral isopods in the semiterrestrial isopod, Tylos granuliferus, on East Asian
megadiverse and geologically dynamic Gulf of Califor- coasts. Zool Sci 32:105−113
nia and adjacent areas. PLOS ONE 8:e67827 Odendaal F, Eekhout S, Brown A, Branch G (1999) Aggre-
Hurtado LA, Lee EJ, Mateos M, Taiti S (2014) Global diver- gations of the sandy-beach isopod, Tylos granulatus:
sification at the harsh sea−land interface: mitochondrial adaptation or incidental-effect? Afr Zool 34:180−189
phylogeny of the supralittoral isopod genus Tylos (Tyli- Partridge T, Scott L, Hamilton J (1999) Synthetic reconstruc-
dae, Oniscidea). PLOS ONE 9:e94081 tions of southern African environments during the Last
Illenberger WK, Rust IC (1988) A sand budget for the Glacial Maximum (21−18 kyr) and the Holocene Altither-
Alexandria coastal dunefield, South Africa. Sedimen- mal (8−6 kyr). Quat Int 57-58:207−214
tology 35:513−521 Pavesi L, Ketmaier V (2013) Patterns of genetic structuring
Kensley BF (1974) Aspects of the biology and ecology of the and levels of differentiation in supralittoral talitrid am-
genus Tylos Latreille. Ann S Afr Mus 65:401−471 phipods: an overview. Crustaceana 86:890−907
Ketmaier V, Scapini F, De Matthaeis E (2003) Exploratory Pechenik JA (1999) On the advantages and disadvantages
analysis of talitrid population genetics as an indicator of of larval stages in benthic marine invertebrate life cycles.
the quality of sandy beaches. Estuar Coast Shelf Sci 58: Mar Ecol Prog Ser 177:269−297
159−167 Pilkey OH, Cooper JAG (2014) Are natural beaches facing
Ketmaier V, Iuri V, De Matthaeis E (2005) Genetic resources extinction? J Coast Res 70:431−436
and molecular markers in Talitrus saltator (Amphipsoda, Ramos-Onsins SE, Rozas J (2002) Statistical properties of
Talitridae) from the beach of Smir. In: Bayed A, Scapini F new neutrality tests against population growth. Mol Biol
(eds) Ecosystèmes côtiers sensibles de la Méditerranée: Evol 19:2092−2100
cas du littoral de Smir. Travaux de l’Institut Scientifique, Raymond M, Rousset F (1995) An exact test for population
Rabat, série générale 4:55−59 differentiation. Evolution 49:1280−1283
Keyghobadi N (2007) The genetic implications of habitat Roberts CM, Hawkins JP (1999) Extinction risk in the sea.
fragmentation for animals. Can J Zool 85:1049−1064 Trends Ecol Evol 14:241−246
Librado P, Rozas J (2009) DnaSP v5: a software for compre- Rogers AR (1995) Genetic evidence for a Pleistocene popu-
hensive analysis of DNA polymorphism data. Bioinfor- lation explosion. Evolution 49:608−615
matics 25:1451−1452 Rogers AR, Harpending H (1992) Population growth makes
Lowe WH, Allendorf FW (2010) What can genetics tell us waves in the distribution of pairwise genetic differences.
about population connectivity? Mol Ecol 19:3038−3051 Mol Biol Evol 9:552−569
Lowman HE, Emery KA, Kubler-Dudgeon L, Dugan JE, Salzburger W, Ewing GB, Von Haeseler A (2011) The per-
Melack JM (2019) Contribution of macroalgal wrack formance of phylogenetic algorithms in estimating haplo-
consumers to dissolved inorganic nitrogen concentra- type genealogies with migration. Mol Ecol 20:1952−1963
tions in intertidal pore waters of sandy beaches. Estuar Slatkin M, Hudson RR (1991) Pairwise comparisons of mito-
Coast Shelf Sci 219:363−371 chondrial DNA sequences in stable and exponentially
Luarte T, Bonta C, Silva-Rodriguez E, Quijón P, Miranda C, growing populations. Genetics 129:555−562
Farias A, Duarte C (2016) Light pollution reduces activ- Song H, Buhay JE, Whiting MF, Crandall KA (2008) Many
ity, food consumption and growth rates in a sandy beach species in one: DNA barcoding overestimates the number
invertebrate. Environ Pollut 218:1147−1153 of species when nuclear mitochondrial pseudogenes are
Markow TA, Pfeiler E (2010) Mitochondrial DNA evidence coamplified. Proc Natl Acad Sci USA 105:13486−13491
for deep genetic divergences in allopatric populations of Tajima F (1989) Statistical method for testing the neutral
the rocky intertidal isopod Ligia occidentalis from the mutation hypothesis by DNA polymorphism. Genetics
eastern Pacific. Mol Phylogenet Evol 56:468−473 123:585−595
Mattos G, Seixas VC, Paiva PC (2019) Comparative phylo- Takada Y, Sakuma K, Fujii T, Kojima S (2018) Phylogeogra-
geography and genetic connectivity of two crustacean phy of the sandy beach amphipod Haustorioides japoni-
species with contrasting life histories on South Atlantic cus along the sea of Japan: paleogeographical signatures
sandy beaches. Hydrobiologia 826:319−330 of cryptic regional divergences. Estuar Coast Shelf Sci
Mbongwa NA, Hui C, Pulfrich A, von der Heyden S (2019) 200:19−30
Every beach an island — deep population divergence Tamura K (1992) Estimation of the number of nucleotide sub-
and possible loss of genetic diversity in Tylos granulatus, stitutions when there are strong transition-transversion
a sandy shore isopod. Mar Ecol Prog Ser 614:111−123 and G+ C-content biases. Mol Biol Evol 9:678−687
McLachlan A (1991) Ecology of coastal dune fauna. J Arid Tamura K, Stecher G, Peterson D, Filipski A, Kumar S (2013)
Environ 21:229−243 MEGA6: Molecular Evolutionary Genetics Analysis ver-
McLachlan A, Defeo O, Short AD (2018) Characterising sion 6.0. Mol Biol Evol 30:2725−2729
sandy beaches into major types and states: implications Toms JA, Compton JS, Smale M, von der Heyden S (2014)
for ecologists and managers. Estuar Coast Shelf Sci 215: Variation in palaeo-shorelines explains contemporary
152−160 population genetic patterns of rocky shore species. Biol
Menzies RJ (1952) The occurrence of a terrestrial isopod in Lett 10:20140330
plankton. Ecology 33:303 Tourinho JL, Márquez A, Celentano E, Defeo O (2016) A
Merritt TJS, Shi L, Chase MC, Rex MA, Etter RJ, Quattro JM new evolutionary unit in the Excirolana braziliensis spe-
(1998) Universal cytochrome b primers facilitate intra- cies complex. Braz J Oceanogr 64:197−202You can also read