Empowerment of smallholder female
←
→
Page content transcription
If your browser does not render page correctly, please read the page content below
AIMS Agriculture and Food, 6(2): 603–630.
                                                            DOI: 10.3934/agrfood.2021036
                                                            Received: 16 January 2021
                                                            Accepted: 12 May 2021
                                                            Published: 21 May 2021
http://www.aimspress.com/journal/agriculture

Research article

Empowerment of smallholder female livestock farmers and its
potential impacts to their resilience to agricultural drought

Lindie V. Maltitz and Yonas T. Bahta*

University of the Free State, Department of Agricultural Economics, P.O. Box 339, Internal box 58,
Bloemfontein 9300, South Africa

* Correspondence: Email: Bahtay@ufs.ac.za; Yonas204@yahoo.com; Tel: +27514019050;
  +27735591859; Fax: +27514013473.

Abstract: Studies have determined the factors influencing agricultural drought resilience of
smallholder farmers and implications for empowerment. Other than the Abbreviated Women’s
Empowerment in Agriculture Index (A-WEAI), studies do not provide an analysis of cultural or
traditional beliefs and reflective dialogues on challenges of smallholder female livestock farmers.
This study uses a mixed approach that includes a survey, A-WEAI, Pearson’s chi-square coefficient,
and reflective dialogue to analyze these challenges. The ability to adapt to agricultural drought is
influenced by factors such as access to information, credit, productive resources, and available time,
all of which are different for men and women. Our study found that 61.3% and 16.4% of the female
and male farmers were disempowered. Domains that contributed the most to the
disempowerment of the women and men were respectively time/workload (52.97% and 31.89%),
access to and decisions on credit (17.7% and 21.4%), ownership of assets (11.3% and 8.5%), input
into productive decisions (10% and 9.1%) and group membership (8% and 19.13%). No significant
correlation for age, marital status, or level of education versus empowerment status of women was
found. A significant correlation was observed between farming experience and the empowerment
status of women. Reflective dialogue during interviews revealed that women struggled with access to
finance, grazing, water, stock theft, lack of training and knowledge, and intimidation by male
neighbors. Such findings help inform agricultural development strategies to develop or modify
existing policies to enhance the resilience of farmers to agricultural drought and empowerment.
Gender-specific agricultural projects should be encouraged to empower female farmers to improve
their resilience to agricultural drought. The government should assist female livestock farmers in
accessing credit and developing clear policies on land tenure issues. Mentorship programs should be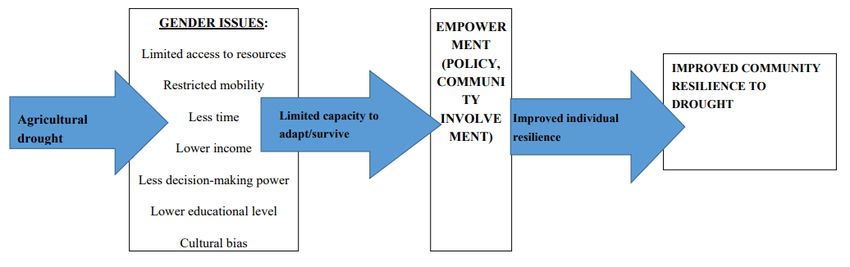
604

encouraged to educate and support female smallholder farmers to enhance their agricultural drought
resilience and empowerment.

Keywords: agricultural drought resilience; smallholder female livestock farmers; empowerment; A-
WEAI; Pearson’s chi-square; reflective dialogue

1.   Introduction

      Many regions of the world are currently experiencing some of the worst drought conditions for
a number of generations [1]. In the last few decades, the increasing frequency and severity of drought
events all over the world have led to in-depth investigations into their economic consequences,
making use of a wide variety of theoretical approaches and methodologies to identify and estimate
the economic effects [2]. Globally, agricultural drought is the costliest natural disaster compared to
other natural disasters such as floods, hurricanes, tornadoes, and earthquakes. A loss caused by
agricultural drought is estimated to from 6 to 8 U.S. dollars (USD) annually [3]. The impact of
agricultural drought put pressure on the already scarce resources and their sustainability.
      Studies have focused, in particular, on sectors such as agriculture [4,5]. Ferrari et al. [4]
highlighted that water availability in Egypt is highly variable and is considered one of the biggest
obstacles to socio-economic development. Agriculture is assumed to be one of the most vulnerable
sectors to drought, affecting significantly through many direct and indirect mechanisms [6].
Mendelsohn and Dinar [6] highlighted that non-climatic factors such as socio-economic conditions
have an inevitable impact on agriculture and further, they argue that the adaptation would be
effective in response to the threats posed by climate change and that econometric models can capture
the full range of economic adaptations of farmers.
      Studies on the impacts of drought usually make the implicit assumption that there will always
be a negative effect on the environment, the economy, and society. However, other approaches,
based, for example, on the framework provided by the consumer surplus theory, try to focus on the
distributive effects of drought. Musolino et al. [7] address the distributive effects of drought on
agriculture, exploring and studying the characteristics, the signs, and the magnitude of the socio-
economic impacts of droughts on agriculture. Further, Musolino et al. [7], based on the analysis of
trends and changes in production and prices they found that drought events can create not only
“losers” but also “winners”. Some social groups (for example, some categories of farmers) can even
“win”, while others “lose” (for example, final consumers).
      The challenge of coping with agricultural drought is under global scrutiny, and its implications
for food security are not underestimated. It is necessary to enhance farmers’ adaptive capacity and
resilience [8–10]. In responding to drought, policy-makers with different stakeholders need a deeper
understanding of the trade-offs involved with varying management options regarding costs and the
potential impacts on economic systems. This, in turn, increases the importance of developing an
appropriate framework for understanding the impacts of drought and the costs associated with
different policy measures [1].
      Sub-Saharan Africa experiences climate variability and has high levels of rain dependency [11].
Rising temperatures and unpredictable rainfall increase the occurrence of drought and disaster.

AIMS Agriculture and Food                                                    Volume 6, Issue 2, 603–630.
605
Agricultural drought1 is the most damaging natural disaster due to the persistent social, economic,
and environmental impact [13]. The consequent challenges are severe, especially in developing
countries that rely on the agricultural sector for economic growth and food security. Vulnerability to
climate change differs according to several factors and includes gender [14]. In poor households,
women and children are often left exposed and deserted due to different circumstances such as male
work migration and higher death rates [15]. Poverty is exacerbated by climate change because
vulnerable people in society lack the necessary resources to recover once they have suffered from
agricultural drought or other climate extremes [16].
Building resilience2 against agricultural drought is a challenge in itself. This is especially true
for smallholder livestock farmers who have constraints such as lack of funding, lack of transport
leading to problematic access to markets, lack of market information, and limited access to the latest
technology [18]. The challenges are often escalated in female farmers or female-headed households
who are involved in general and livestock farming in particular. Drought affects men and women
differently because gender influences power, responsibility, and roles in households and
communities in general. Cultural and religious gender norms, the difference in economic
opportunities, and limited access to resources contribute to the gender divide [19]. The resilience to
the agricultural drought of female smallholder farmers would therefore be different from male
farmers3.
Smallholder farmers4 in South Africa in general and in the Northern Cape Province of South
Africa in particular have increased levels of vulnerability towards drought. They find themselves in a
permanent state of drought and are trapped in a vicious cycle [22]. In a recent study, gender was
identified to play an important role in resilience to agricultural drought in the Northern Cape
Province of South Africa [22]. In the Northern Cape Province of South Africa, the percentage of
female-headed households was a staggering 38.9% in 2016. This could be attributed to several factors
such as male migration to find employment, widowhood, unemployment, and personal choice [23].
Many of them are involved in some form of agricultural activity to supplement their household
income or improve nutrition for their families. In the recent census, it was reported that nationally
464 611 of a total of 990 210 or 46.9% households involved in livestock farming were female-
headed [24].
The dynamics of agricultural drought resilience are dramatically influenced by social and
gender inequalities [25]. Whether people can survive or adapt during and after a drought is affected
by their access to information, social capital, credit, productive resources, savings, available time,
and mobility—all of which are different for men and women [26]. Women often do not have the
same access to resources as men do. Female-headed farm households have the added responsibility
1
Agricultural drought is a water shortage on agriculture focusing on rain shortages, deficient soil water, and reduced
groundwater or water reservoir levels [12].
2
Resilience is defined as the process of adapting well in the face of adversity, trauma, tragedy, threats or even significant
sources of stress [17].
3
This manuscript is part of MSc dissertation by von Maltitz, L. [20]. The resilience of female smallholder livestock
farmers to agricultural drought in the Northern Cape, South Africa. MSc dissertation, University of the Free State,
South Africa.
4
Smallholder farmers are farmers who grow subsistence livestock, completely relying on family labor and have limited
resource endowment as compared to commercial farmers [21].
AIMS Agriculture and Food Volume 6, Issue 2, 603–630.606
of managing the household, caring for the frail and sick and caring for their children. Their available
time to spend farming is less than that of their male counterparts [27].
Access to and ownership of land is not equally distributed between men and women in South
Africa. The latest Land Audit Report of the Department of Rural Development and Land Reform [28]
revealed that in the Northern Cape Province of South Africa, 73% of the available agricultural land is
owned by men. The ownership of household plots is even more skewed, with 98% of plots owned by
men. This statistic is relevant because 61.9% of the agricultural activity in the Northern Cape
Province of South Africa occurs in the so-called backyards of households [24]. This directly impacts
women’s access to finance due to their lack of available collateral for loans to finance productive
inputs [29,30].
Studies have focused on the importance of gender to agricultural drought resilience; exclusion
of women from financial and institutional support; the significance of women in building resilience;
perceptions between women and men on their resilience in times of drought; the influence of
resources on women livestock farmers’ empowerment; the correlation between empowerment and
resilience; and a need to recognize gender in resilience [14,22,25,29,31–38]. None of these studies
determined the factors, which influenced drought resilience of smallholder female livestock farmers
and the implications thereof on empowerment.
Except for the Abbreviated Women’s Empowerment in Agriculture Index (A-WEAI), the
studies did not consider cultural or traditional beliefs and reflective dialogues related to accessing
finance, training, scarcity of resources, grazing, and stock theft in assessing the challenges faced by
smallholder female livestock farmers. The study's objectives were to determine the factors that
influence the drought resilience of smallholder female livestock farmers in the Northern Cape
Province of South Africa and the implications on empowerment.
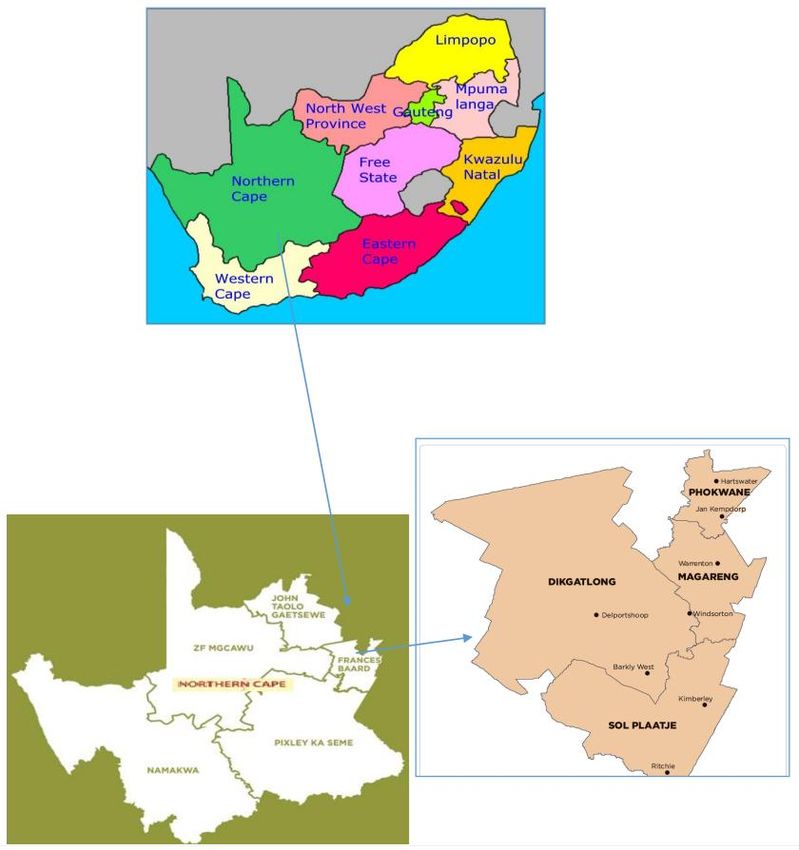
1.1. Theoretical/Conceptual framework
The conceptual framework for the resilience of women headed farm households to agricultural
drought, and the implications for empowerment is depicted in Figure 1. Figure 1 illustrates how
issues related to gender are linked to resilience and empowerment. Women have limited time
available to them because they are responsible for household chores (cooking and cleaning) and
caring for elderly family members and their children. Women’s lower average income because of
time constraints have a direct impact on income levels, which place further restraint on productivity.
Lower income limits access to productive resources, restricted access to land and other assets (the
lower average income has a spillover effect on land ownership). Due to the lack of income, it
becomes very difficult for female-headed households to buy or lease land to produce and generate
revenue. Limited access to and ownership of productive assets and lower educational levels can be
attributed to cultural norms and diminished decision-making power. In dual-gender households,
women have decision-making powers over household chores, childcare, and nutrition, whereas men
control decisions relating to finance and agricultural production. Women have restricted access to
finance, and rural women do not have the same access to credit as their male counterparts living in
the same conditions. This is attributed to a lack of ownership of assets to offer as collateral or lack of
formal employment to offer assurance for repayment. Female-headed households have limited access
to labor to assist in their agricultural production. This could be attributed to a lack of financial
resources to afford labor. Due to limited decision-making power and limited funds, women are often
AIMS Agriculture and Food Volume 6, Issue 2, 603–630.607
not allowed or able to market their own product. Women are sometimes excluded from membership
to cooperatives and access to extension services if they do not own land. This is made worse by a
lack of support through extension services to rural farmers and cultural or traditional beliefs.
Many women still find themselves trapped by cultural beliefs such as being confined to
domestic chores, unable to own land and that they must be married in order to provide for their
families. Successful empowerment policies have a positive influence on the individual resilience of
female farmers to agricultural drought, resulting in improved resilience of the household unit and
eventually improved resilience of the community as a whole.
Further Figure 1 illustrated the relationship between empowerment and resilience. Communities,
including farmers, are more vulnerable to agricultural drought when they are disempowered,
marginalized, with limited access to resources, limited income, restricted mobility, low level of
education, cultural biased and unable to participate in decision making, in turn, they are less
resilience to agricultural drought. There are different definitions for resilience with shared
characteristics [39–41]. Nearly all definitions stress the common elements of resilience: ability,
mitigation, adaptation, coping, recovery, withstanding shocks, resistance, and bouncing back against
shocks. Communities to make informed choices to manage shocks require access to information, the
realization of rights; the ability to participate in decision making; and an asset base to act as a buffer
against shock and enhance their resilience due to empowerment.
2. Materials and methods
A mixed-method (quantitative and qualitative research) was utilized in this study. Lieber [42]
highlighted that qualitative methods have the advantage of providing researchers with the context of
the research environment and the human aspect involved, ensuring comprehensive information that
cannot be determined using quantitative methods. Quantitative methods, on the other hand, focus on
the collection of data and measuring the relationship between variables. Combining the two provides
more inclusive, thorough research results that can help make meaningful conclusions and
recommendations. Mason [43] emphasizes the use of multiple methods to measure empowerment to
be the best approach.
2.1. Study area
The Northern Cape Province of South Africa has five different district municipalities, namely
Frances Baard, John Taolo Gaetsewe, Namakwa, Pixley ka Seme and ZF Mgcawu district
municipalities [44]. This study focused on the Frances Baard District Municipality, which is divided
into four local municipalities of Dikgatlong, Magareng, Phokwane, and Sol Plaatje [20] (Figure 2).
The Northern Cape climate is characterized by hot summers (between 30 and 40 ℃) and cold
winters (below zero nightfall temperatures and frost). Coupled with low rainfall (mean annual
precipitation of 200 mm), the climate is dry and relentless. The Frances Baard district has an average
annual rainfall of approximately 350 mm [45].
A variety of agricultural production occurs in the Northern Cape Province of South Africa due
to the vast difference in climate between the district municipalities. Livestock production remains the
leading enterprise, with ±75% of agricultural households farming with animals only [24]. In South
AIMS Agriculture and Food Volume 6, Issue 2, 603–630.608
Africa, the Northern Cape produces approximately 4% of the country’s cattle, 24% of the sheep, 7%
of the goats, and 1.4% of the chickens (Department of Agriculture, Forestry and Fisheries (DAFF) [45].
Figure 1. Conceptual framework of the impact of empowerment on drought resilience.
Source: Author’s compilation (2020).
Although the Northern Cape province is used to dry periods, the recent drought has crippled the
agricultural sector, and recovery has been slow or non-existent. A lack of fodder and water for
livestock production has placed the industry under enormous stress [45]. The suffering of
smallholder farmers has been escalated due to numerous factors such as poor grazing, lack of water,
lack of resources, land issue, and others. Maltou and Bahta [18] highlighted that most smallholder
farmers are not resilient to agricultural drought. Factors such as lack of access to credit, lack of
assistance from the government (such as training and feed) during drought, lack of social network,
and not being part of co-operative contributed to their non- resilience to agricultural drought. Bahta
[12] highlighted the majority of the farmers used selling their livestock as a coping and adaption
strategy during drought.
2.2. Sample design and data collection
In this study, multi-stage sampling was used. In the first stage, the Northern Cape Province of
South Africa was selected because the province is one of the main livestock-producing provinces and
was declared a drought disaster area in 2019 by the South African Government. In the second stage
of sampling, the four district municipalities of the Frances Baard District of the Northern Cape were
chosen randomly. The district municipalities were Phokwane, Sol Plaatje, Magareng, and Dikgatlong.
The respondents were selected from a list of female smallholder livestock farmers provided by
the Northern Cape Department of Agriculture, Forestry, and Fisheries (DAFF). The list contained
127 female livestock farmers (Table 2). A questionnaire was constructed according to the
instructional guide on the A-WEAI [46]. The respondents had to be female smallholder livestock
farmers residing in the Frances Baard District Municipality of the Northern Cape and willing to
participate in the research.
To calculate the Gender Parity Index (GPI), the focus was on married women or women in a
permanent relationship with men who were also actively involved in the farming operation.
Additionally, data were collected from single, divorced, and widowed women to determine whether
AIMS Agriculture and Food Volume 6, Issue 2, 603–630.609
there was any relationship between marital status and resilience to drought. Using the simple random
sampling formula of Cochran [47] and Bartlett et al. [48], 93 female smallholder livestock farmers
were interviewed from May to August 2019. The study was conducted in a drought year and
coincided with the South African Government's declaration of a drought disaster area. Most of the
data were collected by the authors with some assistance from other researchers and extension officers
of the province. Table 1 provides a summary of women and men farmers interviewed per
municipality.
Figure 2. Frances Baard District Municipality Map. Source: Frances Baard District
Municipality [44].
AIMS Agriculture and Food Volume 6, Issue 2, 603–630.610
Table 1. Number of respondents.
Local Number of female farmers on Interviewed Interviewed Total
Municipality the list women men interviewed
Dikgatlong 45 22 17 39
Magareng 21 18 13 31
Phokwane 54 37 20 57
Sol Plaatje 7 16 11 27
Total 127 93 61 154
Source: Northern Cape Department of Agriculture [49], and Author’s compilations (2020).
2.3. Empirical specification of the model
To determine the empowerment status of the female livestock farmers who participated in the
study, the A-WEAI was applied [46]. The Pearson’s chi-coefficient was used to determine any
possible correlation between other factors not included in the A-WEAI and empowerment. To place
results in the context of the Northern Cape Province of South Africa, the reflective dialogue was
utilized on challenges faced by respondents and to gather information on specific challenges such as
stock theft, access to finance, scarcity of resources, and traditional beliefs, reflective dialogue was
used.
2.3.1. The Abbreviated Women’s Empowerment in Agriculture Index (A-WEAI)
The A-WEAI comprises two sub-indexes, namely the five domains of empowerment (5DE) and
the gender parity index in empowerment within dual-adult households (GPI). Improvements in either
one of these sub-indexes will increase the empowerment level in the survey area [50].
The 5DE is used to indicate both a level of general empowerment and the specific indicators
that contribute the most to disempowerment. The five domains are production, resources, income,
leadership, and time. At first, a disempowerment index (M0) is calculated starting with processing
the data according to the inadequacy indicators listed in Table 2. Coding was done by allocating the
number 1 if the individual lacked adequacy and 0 if the individual achieved adequacy in the specific
indicator. The domains, indicator names, typical survey questions, aggregation method, inadequacy
cut-off, and weight of each indicator are summarized in Table 2.
Regarding input into the use of generated income, the following questions were asked:
Who normally makes decisions with regards to the specific farming activity? Self, spouse,
together, another household member, or another non-household member?
How much input did you have in the decisions making? No input, some input, or sufficient input?
Do you feel that you can make your own personal decisions with regard to activities? No, a little
bit, mostly, always?
Regarding control over use of income, participants were asked to indicate to what extent they
had input into the use of the income generated by livestock farming and other activities. Questions
that were asked included decision and level of freedom to make decisions regarding income and
expenditures generated in the household. The achievement was allocated if the women participated
in any decisions apart from the minor household expenditure. Empowerment was considered
AIMS Agriculture and Food Volume 6, Issue 2, 603–630.611
inadequate if the women participated in the activity but have no or very little input in decisions
regarding the income generated.
Table 2. The five domains of empowerment (5DE).
Dimension Indicator name Survey question examples Aggregation Inadequacy cut-off Weight
method
Production Input in How much input did you have in making Achievement in Inadequate if the 1/5
productive decisions about livestock? Do you feel two individual participates but
decisions that you can make your own decisions does not have at least
regarding this activity? some input into decisions,
does not make the
decisions or feel that she
could make the decisions
if she wanted to
Resources Ownership of Does anyone in the household have any Achievement in Inadequate if the 2/15
assets assets? Do you own any of them? any if not only household does not own
(Livestock, equipment, etc.) small assets any asset or if the
(chickens, non- household owns the type
mechanized of asset BUT she/he does
equipment and not own most of it alone
small consumer
durables)
Access to and Has anyone in your household taken any Achievement in Inadequate if the 1/15
decisions on loans or borrowed any cash from any household has no credit or
credit anywhere in the past 12 months (before used a source but she/he
August 2019)? Who made the decision did not participate in any
to borrow? How much input do you decisions about it
have in deciding how to use the funds?
Income Control over the How much input did you have in Achievement in Inadequate if participated 1/5
use of income decisions on the use of income any if not only in activity but has no input
generated in the household? Do you feel minor household or little input in decisions
that you can make your own decisions expenditures about the income
regarding income? generated
Leadership Group Are you a member of any Achievement in Inadequate if not part of at 1/5
membership agricultural/religious/business groups? any least one group
Time Workload Worked more than 10.5 hours in the Not applicable Inadequate if works more 1/5
previous 24 hours than 10.5 hours a day
Note: Group membership is an indicator of leadership—because, based on A-WEAI- leadership in the community is measured by
membership in economic or social groups and comfort speaking in public. Recognizing the value of social capital as a resource, membership
shows whether the person is a member of at least one social or economic groups such as agriculture producers’ or marketing groups, water
users’ groups, forest users’ groups, credit or microfinance groups; informal and formal social network groups; trade and business
associations; civic or charitable groups, local government groups, and other women’s groups. Group membership is deliberately not
restricted to formal agriculture-related groups because other types of civic or social groups provide important sources of networks and social
capital that empower themselves and may also be an essential source of agricultural information or inputs.
Source: Author has and adapted from Malapit et al. [46].
AIMS Agriculture and Food Volume 6, Issue 2, 603–630.612
In order to examine the prevalence of disempowerment of women and to provide more
information on the social and cultural sphere of the research area, three questions were included in
the survey:
1. Do you think the cultural view of society of a woman’s role in her household influences her
access to resources such as land? If no, do you think it was influenced in the past?
2. Do you think the cultural view of society of a woman’s role in her household influences her
access to funding? If no, do you think it was influenced in the past?
3. Do you think the cultural view of society of a woman’s role in her household influences her
ability to make decisions? If no, do you think it was influenced in the past?
The total inadequacy score bi of each individual is determined by adding the weighted
inadequacies of all the indicators together (equation 1):
bi = W1I1 + W2I2 + W3I3 + … WaIai (1)
Where Iai = 1 if the individual has adequate achievements in a specific indicator a and 0 if
he/she does not have adequate achievements in specific indicator a. Wa = the weight allocated to
each indicator i with . When bi for each individual is calculated, the inadequacy score is
censored. This is done to ensure that the individual scores of the empowered do not influence the
overall empowerment score. A certain cut-off value is used and the score of an individual who scores
below the cut-off (g) is replaced by 0 [50]. Therefore if bi>g, then bi(g) = bi, but if bi ≤ g, then bi(g) =
0. The determining value of g (the disempowerment cut-off value) is 20%. This is based on the
assumption that an individual is considered empowered when he/she has sufficient achievement in
four of the five domains; in other words, has an adequacy score of 80% or greater [40]. The 5DE
calculated as a disempowered headcount ratio (Hp) is indicated in equation 2:
Hp = (2)
Where d = the number of individuals who are disempowered calculated based on equation 1 and
n = the total population involved in the research study.
Secondly, the intensity of disempowerment (Ap) is calculated using equation 3:
Ap = ( )/d) (3)
Where: bi(g) = the censored inadequacy score of individual i and d = the number of individuals
that are disempowered. The 5DE is then calculated as (equations 4 and 5):
M0 = Hp x Ap (4)
5DE = 1 − M0 (5)
Once the value of M0 is determined it can be segregated to determine the contribution of each
indicator to the disempowerment of the research population. This is done using equations 6 and 7:
Percentage contribution of indicator k to M0 = (6)
Where:
M0population = w1CH1 + w2CH2 + …… + w5CH5 (7)
AIMS Agriculture and Food Volume 6, Issue 2, 603–630.613
The censored headcount ratio for each indicator is calculated by taking the number of
disempowered individuals who do not have achievement in a certain indicator, divided by the total
population. They are then added together to determine the contribution that each indicator has to the
disempowerment of the group. When all the contributions are added together, the total will be 100%.
2.3.2. The Gender Parity Index (GPI)
The second part of the A-WEAI is the GPI, which can only be calculated for dual-adult
households. In this research, women involved in livestock farming with their husbands or partners
were used for this purpose. Sixty-one dual adult households were interviewed. The GPI identifies the
ratio of women who lack gender parity compared to the men in their household and the magnitude of
the inequality that exists.
The purpose of the GPI is to indicate inequality between men and women of a dual-adult
household. Once again, the inadequacy scores are censored to distinguish the empowered from the
disempowered. A cut-off of 20% is used, but in this instance differs from the 5DE calculation. The
censored inadequacy score is referred to as bxi(g) with bi > (g) then bxi(g) = bi,, but if bi ≤ (g), then bi
≤ (g) = g. This is done to ensure that the already empowered individual’s score does not influence
the gap between the empowered and the disempowered.
The household is then identified to have gender parity or to lack gender parity. A household
does not have gender parity if the woman is disempowered and her censored inadequacy score is
higher than the censored inadequacy score of the man in the household. Gender parity exists if she is
empowered or when she is not empowered, her inadequacy score is greater or equal to that of the
man in the household. To determine the ratio of women who lack gender parity, equation 8 is applied:
HGPI = (8)
Where h = number of households without gender parity and c = total of dual-adult households
involved in the research study. The next procedure is to calculate the average empowerment gap
using equation 9:
(9)
Where: bxp(g)W = the censored inadequacy score of the women living in household p, bxp(g)M =
the censored inadequacy score of the men living in household p, and h = the number of households
lacking gender parity. Finally, GPI was calculated using equation (10):
GPI = 1 – (HGPI x IGPI) (10)
Increasing HGPI or decreasing IGPI will improve the GPI score of the respondents. Then, A-
WEAI is compiled by adding the two sub-indexes together according to the allocated weights of the
index (equation 11):
A-WEAI = 0.9(5DE) + 0.1(GPI) (11)
AIMS Agriculture and Food Volume 6, Issue 2, 603–630.614
2.3.3. Correlation of variables
To determine whether correlations exist between empowerment and other measures that were
included in the questionnaire, but not in the A-WEAI index, the Pearson chi-square statistic and p-
value were used to calculate any significant correlations. The measures that were tested in relation to
empowerment, included age, level of education, marital status, and farming experience and included
the hypothesis:
H0 = there is no relationship between variables z and empowerment; in other words, the relationship
is insignificant;
Ha = there is a significant relation between variables z and empowerment.
The formula for chi-square (2) is: (equation 12)
(12)
Where Oi = observed value of variable i and j and Ei = expected value of variable i and j. The
degree of freedom was determined by the formula in equation 13:
df = (r − 1)(c − 1) (13)
Where r = the number of rows or factors used for comparison and c = the number of columns in
the table. Once a relationship is determined, and the H0 hypotheses is rejected, the significance of
the relationship can be calculated by using Cramer’s V measure calculated by the following formula
(equation 14):
(14)
If V >= 0.25, the relationship is significant, if V615
3. Results and discussion
3.1. Socio-economic characteristics of the farmers
One hundred and fifty-four smallholder livestock farmers were interviewed. Sixty-one (61)
couples were married or in a permanent relationship, and both the men (61) and the women (61)
were interviewed. Thirty-two female respondents were single, divorced, or widowed. The socio-
economic characteristics of the respondents are summarized in Table 3. The average age of female
and male respondents was 50 and 51 years, respectively. The advanced age of the respondents
implied that farming was not an attractive option for many youths. These findings are in line with
Meterlerkamp et al. [55], who found that factors such as negative stigmas surrounding agriculture
and lack of support by relevant institutions were the main reasons youth found agriculture an
unattractive career choice. The average educational level of the female and male respondents was in
grades 9 and grade 10, respectively. A few individuals had post-matric qualifications but could not
find employment and therefore concentrated on farming. Most male and female respondents relied
on farming and social grants (child grants or pensions) for their livelihoods. The male respondents
had on average 13 years (range 2 – 32 years) of farming experience and the women 12 years (range 1
– 40 years) (Table 3). The average household size of the respondents was five.
Table 3. Socio-economic characteristics of the respondents.
Variable N Min Max Mean
Age (women) 93 23 82 50.11
Age (men) 61 32 81 51.28
Education (women) 93 0 12 8.58
Education (men) 61 0 12 9.93
Farming experience (women) 93 1 40 12
Farming experience (men) 61 2 32 13
Household members (women) 61 2 10 5
Household members (men) 93 1 12 5
Number of cattle (women) 93 0 200 20
Number of cattle (men) 61 0 200 24
Number of sheep (women) 93 0 102 9
Number of sheep (men) 61 0 102 11
Number of goats (women) 93 0 80 12
Number of goats (men) 61 0 80 12
Time spent working/providing (women)* 93 5 14.5 11
Time spent working/providing (men)*Includes time 61 6 12 9
caring for children, travelling, shopping, farming, other
employment done in last 24 hours
*Note: Includes time caring for children, travelling, shopping, farming, other employment done in last 24 hours.
AIMS Agriculture and Food Volume 6, Issue 2, 603–630.616
3.2. The Abbreviated Women’s Empowerment in Agriculture Index (A-WEAI)
Table 4 summarizes the A-WEAI index findings. The A-WEAI for the area was 0.7949, and
that 38.7% of the women and 83.6% of the men were empowered in the five domains of
empowerment. On average, the women had 35.6% inadequate achievements in the different
dimensions of the five domains. A GPI index value of 0.9118 indicated that, in general, the area had
relatively high gender parity in households. The A-WEAI value of 0.7949 indicated that women’s
empowerment in Frances Baard District Municipality was relatively good.
Table 4. A-WEAI index.
Indicator Women Men
Disempowered headcount ratio (Hp) 61,3% 16,4%
Average inadequacy score (Ap) 35.6% 31.3%
Disempowerment index (M0) 0.218 0.051
5DE index (1-M0) 0.782 0.949
Number of observations 93 61
Percentage of women lacking gender parity (HGPI) 50.82
Average empowerment gap (IGPI) 17.35
Gender parity index (GPI) 0.9118
Number of women in dual households 61
A-WEAI ((0.9x5DE) + (0.1xGPI)) 0.7949
The individual values of the 5DE are depicted in Table 5. The dimensions contributing the most
to the disempowerment of female smallholder livestock farmers are workload (52.97%) and access to
and credit decisions (17.7%). Women have control or at least some form of input into the use of their
family’s income, but lack of ownership of assets (11.3%), lack of input into productive decisions
(10%), and lack of group membership (8%) also contribute to their disempowerment. A study
conducted in Tanzania on rice farmers found similar results [56]. The authors indicated that the
domains contributing to the disempowerment of the women in order of importance were workload
(38.19%), ownership of assets (20.18%), input into productive decisions (18.89%), access to and
credit decisions (12.39%), group membership (8.73%) and control over the use of income (1.62%).
The main contributors to the disempowerment of men were workload (31.89%) and access to
and credit decisions (21.4%), while lack of group membership (19.13%) and lack of input into
productive decisions (19.1%) also played a role. The findings in Tanzania was similar for the
workload (39.96%) but was followed by input into productive decisions (28%), access to and credit
decisions (14.23%), ownership of assets (12.87%), leadership (4.7%), and then control of overuse of
income (0.29%) [56].
AIMS Agriculture and Food Volume 6, Issue 2, 603–630.617
Table 5. The 5DE decomposed by dimension and indicator calculated using the A-WEAI index.
Indicators Production Resources Income Leadership Time
Input into Ownership Access to and Control Group Workload
productive of assets decisions on over use of membership
decisions credit income
Indicator 0.2 0.13 0.067 0.2 0.2 0.2
weight
Women
Censored 0.108 0.18 0.570 0 0.086 0.570
headcount
% 10 11.3 17.7 0 8 52.97
contribution
Absolute 0.022 0.024 0.038 0 0.017 0.114
contribution
Men
Censored 0.049 0.033 0.164 0 0.049 0.082
headcount
% 19.1 8.5 21.4 0 19.13 31.89
contribution
Absolute 0.010 0.004 0.011 0 0.010 0.016
contribution
3.2.1. The 5DE and agricultural drought resilience
The empowerment cut-off for individuals is 20%; this implies that women who have a total
inadequacy score of more than 20% are considered disempowered. The inadequacy scores were
censored when calculating A-WEAI to distinguish empowered individuals from disempowered
individuals based on the weights allocated to the different indicators and prohibiting empowered
women from influencing the result.
3.2.1.1. Time/workload
Time/workload was the domain that contributed the most to the disempowerment of the women
(52.97%) and men (31.89%) (Table 5). In time/workload related to farming, outside employment,
caring for family members, caring for the household, and traveling were included. The average
results for time allocation in a typical 24 hour day are depicted in Table 6.
When the respondents asked how satisfied they were with the amount of leisure time to their
disposal on a scale of 1 to 10, they indicated on average 4 and 5.5 for women and men, respectively.
More than half (57.3%) the married women lacked achievement in time adequacy compared to 8.1%
of married men. This finding in line with Achandi et al. [56], who found that women spend on
average 60% of their working time in activities that do not generate any income compared to men
who spend only 23% completing the same tasks. Besides, men had outside employment (taxi drivers
and shop owners), which placed a further burden on the women in the households. They had to cope
with farming operations without support from their husbands. The restriction on time has spillover
AIMS Agriculture and Food Volume 6, Issue 2, 603–630.618
effects such as lack of information (less time to access information) that in turn has a negative effect
on knowledge (such as new technologies etc.), which can be used to adapt to drought and improve
resilience [57].
Table 6. Average time spent on different activities in a 24-hour day.
Activity Average time/day spent Average time/day spent
Women Men
Sleeping 8 h 06 min 8 h 30 min
Eating 1 h 36 min 2 h 12 min
Personal care 54 min 1 hour
Assisting with schoolwork 48 min 36 min
Work as employed 1 h 12 min 42 min
Farming 4 h 36 min 5 h 54 min
Shopping 18 min 12 min
Cooking 2 h 36 min 12 min
Childcare 48 min 18 min
Travelling 30 min 54 min
Watching TV/listening to a radio 1 h 48 min 2 h 24 min
Exercising 6 min 0
Social activities 6 min 18 min
Religious activities 36 min 36 min
Time constraints, therefore, had a negative impact on the agricultural drought resilience of
female smallholder livestock farmers. It is important to note that availability of time or workload
cannot be seen from the context with other influencing factors because women who have more time
than others are not necessarily empowered or more resilient to agricultural drought [58]. This is
encompassed in the A-WEAI, which considers the collective impact of different domains according
to allocated weights.
3.2.1.2. Access to and decisions on credit
The second most crucial factor was access to and decisions on credit that influenced the
disempowerment of 17.7% of women and 21.4% of men (Table 5). Most women (86%) did not have
access to credit, of which 83.6% were married. Additionally, most (77%) of the married men did not
have access to credit. This could be attributed to a lack of land deeds and other job opportunities to
use as collateral to obtain loans. Isaga [59] highlighted that for smallholder farmers to increase their
resilience to agricultural drought and improve efficiency; they have to access new technologies that
are often expensive and require access to credit. Two of the married women who did have access to
credit made the decision to use credit by themselves, whilst the rest decided together with their
spouses/partners, or the spouse/partner decided on his own. In terms of grants received in the 12
months preceding August 2019, 51.6% of the women reported receiving childcare or pension grants,
and 2% indicated they received grants from the Department of Rural Development and Land Reform
during the drought period in the form of fodder.
AIMS Agriculture and Food Volume 6, Issue 2, 603–630.619
3.2.1.3. Ownership of assets
Ownership of assets contributed to 11.3% and 8.5% empowerment of smallholder female and
men farmers respectively (Table 5). This corresponds with Johnson et al. [60], who found that
ownership of assets improved the women’s ability to buffer shocks, such as agricultural drought
because it allowed control in which an asset could sold or converted to income.
In terms of married female livestock farmers, 16.4% achieved adequacy in terms of land
ownership, and 26.2% achieved adequacy in both large and small livestock ownership. In contrast,
23% of male livestock farmers owned land, 50.8% owned large livestock, and 29.5% owned small
livestock (Table 7). This has a negative impact on the agricultural drought resilience of women as
they had less control over assets.
Table 7. Ownership and control of assets.
Asset Adequacy married Adequacy men
women
Land ownership 16.4% 23%
Large livestock ownership 26.2% 50.8%
Small livestock ownership 26.2% 29.5%
Mechanized farm equipment ownership 3.2% 8.2%
Ownership of non-farm business equipment 13.1% 34.4%
Ownership of house 32.7% 36%
Ownership of large consumables 16.4% 13.1%
Ownership of non-farm land 4.9% 6.6%
Ownership of transport (car/bakkie) 14.7% 40.9%
3.2.1.4. Input into productive decisions
An achievement was allocated when the individual had sufficient achievement in at least two of
the three questions. A woman was considered disempowered if she participated in the activity, but
did not have at least some input into the decision-making process. The results indicated that decision-
making occurred as a team (40%), with 29% of the women having the freedom to make decisions
independently. Fewer (16%) women reported that they had no input and their spouses/partners made
the decisions, 6% reported that other household members such as a father or a son made the
decisions, and 2% indicated that decisions were made by a non-household member such as a relative
who owned the livestock, but lived somewhere else. A study conducted by Anderson et al. [61] in
rural Tanzania concluded that the answer on decision-making power in the household depended on
who was asked. Women and men interviewed separately in the same household often indicated that
decision-making belonged to them individually.
Teamwork was practiced in this study. It improves the collective resilience to agricultural
drought. CARE [29] highlighted that limitation on decision-making power has a negative impact on
resilience against climate extremes such as agricultural drought. In their study, decision-making
power is not confined to household-level, but extends to governmental influence. This plays a
significant role in South Africa, where decisions are often forced onto beneficiaries by government
and municipal departments, because assets (such as land and water) are in many cases controlled by
AIMS Agriculture and Food Volume 6, Issue 2, 603–630.620
the government. Further, scholars such as Opondo et al. [25], Le Masson [27], Anderson et al. [61],
Huyer [62], Fischer and Carr [63], and Shean and Alnouri [64] proved the negative influence of
decision-making power has on resilience to climate shocks such as agricultural drought. The less
decision-making power a woman has in her household or community, the less resilience she has to
agricultural drought, because she cannot make the necessary decisions to mitigate risks.
3.2.1.5. Group membership
Of the 93 women interviewed, 84 belonged to some form of community group such as
church/religion-based, AFASA (African Farmers Association of South Africa), or a producers group.
A lack of group membership contributed 8% and 19.13% to the disempowerment of the women and
men, respectively (Table 5). Tambo [65] confirmed that group membership positively influences
resilience to climatic shocks such as agricultural drought.
To be a group member, either formal or informal, to enhance women’s resilience. Social
networks such as farmer's associations and church groups help the farmers meet and train each other
on drought mitigation strategies and support each other when drought occurs. Members of social
networks share mutual assistance and support when the need arises, such as providing farming
knowledge and food in inadequate food supplies. Further, Hassen [66] and Bahta et al. [67]
highlighted that members of the group could call on each other for help and have rights and access to
some resources because of their group membership status. Further, Iglesias et al. [68] established that
when farmers participate in local institutions, their vulnerability to drought significantly reduces and
enhances their resilience. Their involvement in planning and other activities influences the social
networks in such a way that they will develop social capital to mitigate drought risk.
3.2.1.6. Control over use of income
In this category, respondents indicated that they had sufficient input into decisions with regard
to income generated in their households. The different income-generating activities were listed as
livestock production, outside the business (non-farm economic activities), and income from non-
farm employment. Based on the criteria, all of the women in the study achieved adequacy as well as
the men. It, therefore, had no impact on the disempowerment of respondents. The impact that
controls over the use of income has on empowerment and resilience to agricultural drought is clear.
A woman who has control or at least sufficient input in household or individual income is more
resilient to agricultural drought as she can make the necessary decisions to mitigate risk when needed.
This is also highlighted by numerous authors such as Khapung [32], Galiéet al. [69], and Akter et al. [70].
3.2.2. Gender parity index (GPI)
The GPI was calculated to indicate levels of inequality in a household in terms of the five
domains of empowerment (5DE). The first component of the GPI, as shown in equation 8, was
0.508197 and implied that 50.8% of the women involved in dual-adult households did not experience
gender parity relative to the men in their household. The second component of GPI, the average
empowerment gap calculated in equations 9 and 10, was 0.9118. A gender parity value of 1 indicated
complete gender parity whilst a value below 1 indicated the relative gender parity between men and
AIMS Agriculture and Food Volume 6, Issue 2, 603–630.621
women in the same household [50]. The value of 0.9118, therefore, indicated that the gender parity
in the survey area be relatively high. Similar studies in Bangladesh, Guatemala, and Uganda by
Alkire et al. [50] resulted in GPI values of 0.899, 0.813, and 0.898, respectively. This indicates that
gender parity in these three countries is also relatively high, with Guatemala the lowest of the three.
3.3. Components not included in the A-WEAI
The information included in the questionnaire that did not form part of the A-WEAI Index was
the influence of cultural norms on the empowerment of women in society as well as age, educational
level, marital status, and years of farming experience of female farmers. Social or cultural norms
regarding certain aspects pertaining to gender, such as land and other important asset ownership have
a definitive influence on empowerment, as demonstrated in a study by [71]. If a woman does not
own assets, she does not have control over the associated income generation. Except for one
divorced woman, all the respondents answered that they did not think the current cultural view of a
woman’s role in her household affects her access to resources, access to funding, or role in the
household. They all agreed that it had improved drastically from the past. However, when observing
the results, some cultural norms were visible when comparing the difference in time spent per
activity between men and women. Women spent more time on childcare, cooking, and assisting
children with schoolwork than men (Figure 3). In the comparison provided in Table 7, it is clear that
men dominate in ownership of assets, which negatively impacts women's empowerment.
Religious activities
Social activities
Exercising
Watching TV/listening to radio
Travelling
Childcare
Activity
Cooking
Shopping
Farming
Work as employed
Assisting with schoolwork
Personal care
Eating
Sleeping
0 1 2 3 4 5 6 7 8 9
Hours
Average time/day spent Average time/day spent
Figure 3. Comparison between the average amounts of time spent per activity amongst
men and women.
AIMS Agriculture and Food Volume 6, Issue 2, 603–630.622
3.4. Correlation of variables
The Pearson chi and Cramer’s V test were conducted using equations 12 to 14. Using the chi-
Square distribution, the p-value of 0.7644 and 2 value of 1.8438 indicated that the H0 is accepted,
which implied that there was no significant relationship between the age of the women and their
empowerment status in the study area. The result was confirmed by the Cramer’s V of 0.0704 which
was very small (Table 8). Alkire et al. [40] found mixed results on research conducted in Bangladesh,
Guatemala, and Uganda. In Bangladesh and Guatemala, age had a significant correlation with female
empowerment. This was attributed to the fact that many women younger than 26 years were typically
daughters or daughters-in-law of older women in the household and the majority of women older
than 55 years were less active in farming enterprises and more reliant on their sons/family members.
The Uganda results were similar to our findings, where age did not significantly correlate with
empowerment status.
Regarding the correlation between marital status and empowerment status, the p-value of
0.6046 and 2 value of 1.8475 indicated that the H0 was accepted. In other words, there was no
significant relationship between the marital status of the women and their empowerment status. This
is further confirmed by the Cramer’s V of 0.0813, which was very small. A study by Opiyo et al. [72]
in Kenya, however, observed a positive correlation between empowerment and marital status. This
implies that single, divorced, or widowed women were more vulnerable to climate-induced stresses
such as agricultural drought than married women.
There was no significant relationship between the level of education and empowerment status,
confirmed by the p-value of 0.4079, 2 value of 3.9856 and the very small Cramer’s V of 0.1035. A
study by Achandi et al. [56] highlighted a significantly positive correlation between empowerment
and level of education. This was attributed to the fact that more educated women had more input in
decisions.
Last but not least, there was a significant relationship between the farming experience of the
women and their empowerment status, which implied that experience added to knowledge and
resilience. This result was confirmed by p-value of 0.01957 and 2 value of 9.8841. There were
mixed results from other studies. In Indonesia, both significant and insignificant correlations between
empowerment status and years of farming experience were found in different agricultural projects
across the country, highlighting that women’s empowerment has to be viewed in the context of the
area it relates to [73].
3.5. Context-specific dialogue/reflective dialogue
The challenges faced by female smallholder livestock farmers in the Northern Cape Province of
South Africa were in many ways similar, but also different from female smallholder livestock
farmers in other parts of the world. The relationship between gender and resilience is not simple and
must be viewed objectively considering the influence of and relationship between gender and
knowledge, power, and decision-making within the specific social, political and environmental
setting [74]. To put this into context and provide an all-encompassing view on the topic, important
dialogue discussing specific challenges were included to provide more information in terms of
problems. It involved sharing dialogue and experiences, which positively influences change in
AIMS Agriculture and Food Volume 6, Issue 2, 603–630.623
communities. During dialogues, engaged female farmers voiced their challenges and concerns, which
are summarized in Table 9.
Table 8. Correlation between variables.
Correlation between age and empowerment
Age group Women empowered
No Yes Total
23–32 years 8 (61.5%) 5 (38.5%) 13
33–42 years 13 (72.2%) 5 (27.8%) 18
43–52 years 13 (65%) 7 (35%) 20
53–62 years 13 (56.5%) 10 (43.5%) 23
>62 years 10 (52.6%) 9 (47.4%) 19
Total 57 (61.3%) 36 (38.7%) 93
Cramer’s V 0.07040 Pearson chi2 statistic 1.8438
p-value 0.7644 df 4
Correlation between marital status and empowerment
Marital status Women empowered Total
Single 10 (66.7%) 5 (33.3%) 15
Married 39 (63.9%) 22 (36.1%) 61
Widowed 5 (45.5%) 6 (54.5%) 11
Divorced 3 (50%) 3 (50%) 6
Total 57 (61.3%) 36 (38.7%) 93
Cramer’s V 0.0813 Pearson chi2 statistic 1.8475
p-value 0.6046 df 3
Correlation between educational level and empowerment
Education level Women empowered Total
Below primary 5 (83.3%) 1 (16.7%) 6
Grade 1–4 5 (71.4%) 2 (28.6%) 7
Grade 5–7 12 (70.6%) 5 (29.4%) 17
Grade 8–10 18 (62.1%) 11 (37.9%) 29
Grade 11–12 17 (50%) 17 (50%) 34
Total 57 (61.3%) 36 (38.7%) 93
Cramer’s V 0.1035 Pearson chi2 statistic 3.9856
p-value 0.4079 df 4
Correlation between farming experience and empowerment
Farming experience Women empowered Total
1–5 years 20 (80%) 5 (20%) 25
6–10 years 11 (64.7%) 6 (35.3%) 17
11–15 years 13 (44.8%) 16 (55.2%) 29
More than 15 years 9 (41%) 13 (59%) 22
Total 53 (56.9%) 40 (43.01%) 93
Cramer’s V 0.1882 Pearson chi2 statistic 9.8841
p-value 0.01957 df 3
AIMS Agriculture and Food Volume 6, Issue 2, 603–630.624
The results indicated that female smallholder livestock farmers struggled with stock theft,
finding enough clean water for their animals, and funding to purchase the necessary infrastructure
(such as fencing). Their lack of any form of collateral to secure a loan prohibited them from farming
efficiently. Some of the women were intimidated by neighboring male farmers. A need exists for
continuous training on cattle health and herd management. An efficient gender-specific funding
mechanism must be constructed to assist female smallholder livestock farmers. Training remains in
high demand and should be prioritized on a more regular basis.
Table 9. Reflective dialogue.
Dialogue relating to Challenges
Access to finance 86% of the women said that they did not have access to finance to ensure farming
efficiency.
“Our hands are tied. Our animals are subjected to lack of water close to the grazing
area and we can’t extend a pipeline for water because we can’t secure a loan to
enable us to do so.”
“Our fences next to the road is old and rusted. Our goats break them, looking for
extra grazing and endangering motorists. We can’t afford new fencing and the bank
does not want to offer us a loan because we do not have a job or own any land.”
“We struggle to find enough water for our livestock. We do not have money to
afford fencing and tools and to pay a herder to see that the livestock does not run into
the road.”
Training, sufficient 62% of women said that they needed training and struggled to feed their animals in
water and grazing times of drought.
“The communal grazing areas are overcrowded. Our lambs die of disease because of
the overexposure in the communal area. We need the training to increase our
knowledge of livestock farming and practical assistance so that we understand how
to do things.”
“During drought is it very expensive to feed the animals. The grazing is not enough
and we struggle to afford feed. Medicine also expensive and when the available
water dries up, the animals must walk far distances each day to get to the water.”
Stock theft 98% of the women indicating that stock theft was a big challenge
“The theft of our animals is out of hand. We need land so that there is more space
available for our animals.”
Intimidated by male 15% of the women indicated that they were intimidated by male farmers who
farmers threatened to poison their animals
“Most of us have a 30-year lease from the government. The male neighbors,
however, uses the land unlawfully and is threatening to poison our cattle if we try to
chase their animals away. This forces us to buy extra feed for our cattle because we
do not have enough grazing.”
4. Conclusions and recommendations
Female smallholder livestock farmers in the Northern Cape Province of South Africa face many
challenges influencing their vulnerability to agricultural drought. The majority of women livestock
farmers were disempowered and less resilient to agricultural drought compared to men livestock
AIMS Agriculture and Food Volume 6, Issue 2, 603–630.You can also read