Design and analysis of a large-scale COVID-19 tweets dataset
←
→
Page content transcription
If your browser does not render page correctly, please read the page content below

Applied Intelligence
https://doi.org/10.1007/s10489-020-02029-z

Design and analysis of a large-scale COVID-19 tweets dataset
Rabindra Lamsal1

Accepted: 16 October 2020
© Springer Science+Business Media, LLC, part of Springer Nature 2020

Abstract
As of July 17, 2020, more than thirteen million people have been diagnosed with the Novel Coronavirus (COVID-19),
and half a million people have already lost their lives due to this infectious disease. The World Health Organization
declared the COVID-19 outbreak as a pandemic on March 11, 2020. Since then, social media platforms have experienced
an exponential rise in the content related to the pandemic. In the past, Twitter data have been observed to be indispensable
in the extraction of situational awareness information relating to any crisis. This paper presents COV19Tweets Dataset
(Lamsal 2020a), a large-scale Twitter dataset with more than 310 million COVID-19 specific English language tweets and
their sentiment scores. The dataset’s geo version, the GeoCOV19Tweets Dataset (Lamsal 2020b), is also presented.
The paper discusses the datasets’ design in detail, and the tweets in both the datasets are analyzed. The datasets are released
publicly, anticipating that they would contribute to a better understanding of spatial and temporal dimensions of the public
discourse related to the ongoing pandemic. As per the stats, the datasets (Lamsal 2020a, 2020b) have been accessed over
74.5k times, collectively.

Keywords Social computing · Crisis computing · Sentiment analysis · Network analysis · Twitter data

1 Introduction                                                         of thousands to millions [25]. With proper planning and
                                                                       implementation, social media data can be analyzed and
1.1 Social media and crisis events                                     processed to extract situational information that can be
                                                                       further used to derive actionable intelligence for an effective
During a crisis, whether natural or man-made, people tend              response to the crisis. The situational information can be
to spend relatively more time on social media than the                 extremely beneficial for the first responders and decision-
normal. As crisis unfolds, social media platforms such                 makers to develop strategies that would provide a more
as Facebook and Twitter become an active source of                     efficient response to the crisis.
information [20] because these platforms break the news                   In recent times, the most used social media platforms
faster than official news channels and emergency response              for informal communications have been Facebook, Twitter,
agencies [23]. During such events, people usually make                 Reddit, etc. Amongst these, Twitter, the microblogging
informal conversations by sharing their safety status,                 platform, has a well-documented Application Programming
querying about their loved ones’ safety status, and reporting          Interface (API) for accessing the data (tweets) available on
ground level scenarios of the event [11, 20]. This process             its platform. Therefore, it has become a primary source
of continuous creation of conversations on such public                 of information for researchers working on the Social
platforms leads to accumulating a large amount of socially             Computing domain. Earlier works [10, 12, 14, 16, 21, 32,
generated data. The amount of data can range from hundreds             43, 51, 53, 54] have shown that the tweets related to a
                                                                       specific crisis can provide better insights about the event.
This article belongs to the Topical Collection: Artificial Intelli-    In the past, millions of tweets specific to crisis events such
gence Applications for COVID-19, Detection, Control, Prediction,       as the Nepal Earthquake, India Floods, Pakistan Floods,
and Diagnosis
                                                                       Palestine Conflict, Flight MH370, etc., have been collected
 Rabindra Lamsal                                                      and made available [22]. Such Twitter data have been
    rabindralamsal@outlook.com                                         used in designing machine learning models [21, 31, 35]
                                                                       for classifying unseen tweets to various categories such as
1   School of Computer and Systems Sciences, Jawaharlal Nehru          community needs, volunteering efforts, loss of lives, and
    University, New Delhi 110067, India                                infrastructure damages. The classified tweets corpora can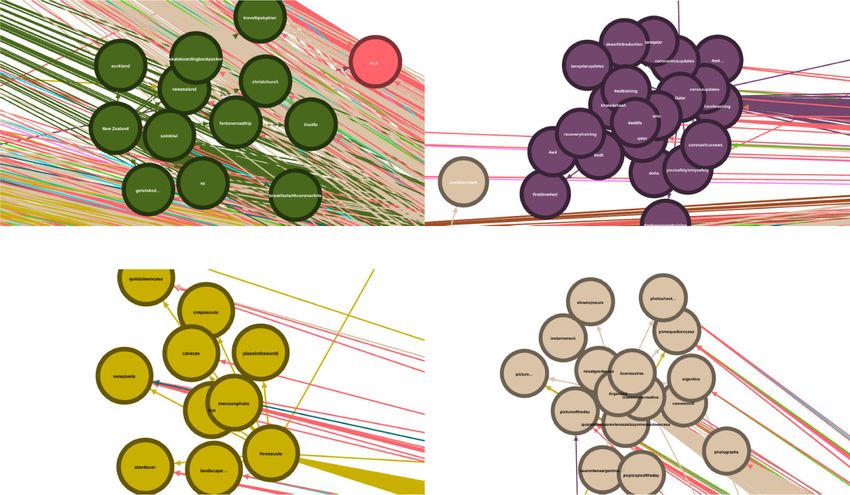
R. Lamsal

be (i) trimmed [38] or summarized [36, 40, 41, 50] and            version. Section 4 focuses on the hydration of tweets ID for
sent to the relevant department for further analysis, (ii) used   obtaining full tweet objects. Section 5 presents the analysis
for sketching alert-level heat maps based on the location         and discussions, and Section 6 concludes the paper.
information contained within the tweet metadata or the
tweet body.
   Similarly, Twitter data can also be used for identifying       2 Related work
the flow of fake news [7, 8, 24, 49]. If miss-information
and unverified rumors are identified before they spread out       2.1 COVID-19 tweets dataset
on everyone’s news feed, they can be flagged as spam or
taken down. Further, in-depth textual analyses of Twitter         Multiple other studies have also been collecting and sharing
data can help (i) discover how positively or negatively           large-scale datasets to enable research in understanding
a geographical region is being textually-verbal towards           the public discourse regarding COVID-19. Some of those
a crisis, (ii) understand the dissemination processes of          publicly available datasets are multi-lingual [4, 13, 26,
information throughout a crisis.                                  39], and some are language-specific [3, 18]. Among those
                                                                  datasets, [4, 13, 39] have significantly large numbers of
1.2 Novel Coronavirus (COVID-19)                                  tweets in their collection. [39] provides more than 524
                                                                  million multi-lingual tweets and also an English version as a
As of July 17, 2020, the number of Novel coronavirus              secondary dataset. However, with the last update released on
(COVID-19) cases across the world had reached more                May 01, 2020, the dataset [39] does not seem to be getting
than thirteen million, and the death toll had crossed half        frequent releases. [4] shares around 490 million multi-
a million [52]. States and countries worldwide are trying         lingual tweets alongside the most frequently used terms.
their best to contain the spread of the virus by initiating       [13] provides 302 million multi-lingual tweets, with around
lockdown and even curfew in some regions. As people are           200 million tweets in the English language. However,
bound to work from home, social distancing has become             neither of them [4, 13] have English version releases.
a new normal. With the increase in the number of cases,
the pandemic’s seriousness has made people more active            2.1.1 Issues with multi-lingual datasets
in social media expression. Multiple terms specific to the
pandemic have been trending on social media for months            First, the volume of English tweets in multi-lingual datasets
now. Therefore, Twitter data can prove to be a valuable           can become an issue. Twitter sets limits on the number of
resource for researchers working in the thematic areas of         requests that can be made to its API. Its filtered stream
Social Computing, including but not limited to sentiment          endpoint has a rate limit of 450 requests/15-minutes per
analysis, topic modeling, behavioral analysis, fact-checking      app., which is why the maximum number of tweets that
and analytical visualization.                                     can be fetched in 24 hours is just above 4 million. The
   Large-scale datasets are required to train machine learn-      language breakdown of multi-lingual datasets shows a
ing models or perform any kind of analysis. The knowl-            higher prevalence of English, Spanish, Portuguese, French,
edge extracted from small datasets and region-specific            and Indonesian languages [4, 13]. Therefore, multi-lingual
datasets cannot be generalized because of limitations in          datasets contain relatively fewer English tweets, unless
the number of tweets and geographical coverage. There-            multiple language-dedicated collections are run and merged
fore, this paper introduces a large-scale COVID-19 specific       later. Second, the size and multi-lingual nature of large-scale
English language tweets dataset, hereinafter, termed as           datasets can become a concern for researchers who need
the COV19Tweets Dataset. As of July 17, 2020, the                 only the English tweets. For that purpose, the entire dataset
dataset has more than 310 million tweets and is available at      must be hydrated and then filtered, which can take multiple
IEEE DataPort [30]. The dataset gets a new release every          weeks.
day. The dataset’s geo version, the GeoCOV19Tweets
Dataset, is also made available [29]. As per the stats            2.2 Sentiment analysis
reported by the IEEE platform, the datasets [29, 30] have
been accessed over 74.5k times, collectively, worldwide.          Recent studies have done sentiment analysis on different
                                                                  samples of COVID-19 specific Twitter data. A study [1]
1.3 Organization of the paper                                     analyzed 2.8 million COVID-19 specific tweets collected
                                                                  between February 2, 2020, and March 15, 2020, using
The paper is organized as follows: Section 2 reviews              frequencies of unigrams and bigrams, and performed senti-
related research works. Section 3 discusses the design            ment analysis and topic modeling to identify Twitter users’
methodology of the COV19Tweets Dataset and its geo                interaction rate per topic. Another study [34] examined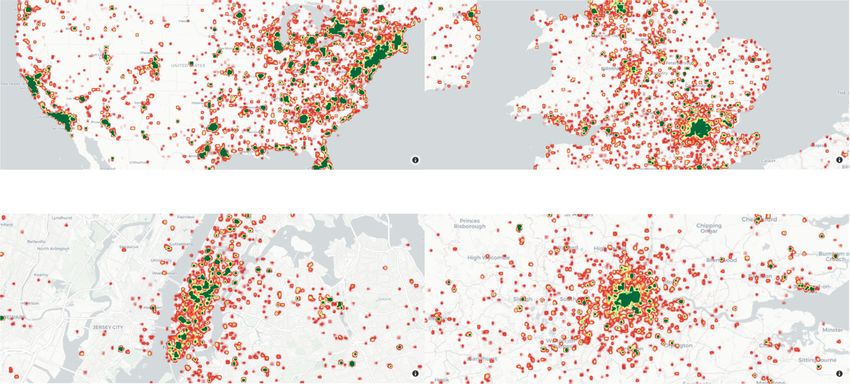
Design and analysis of a large-scale COVID-19 tweets dataset

tweets collected between January 28, 202, and April 9,             project to investigate how much social media data volume
2020, to understand the worldwide trends of emotions (fear,        can be analyzed using minimal computing resources. Twit-
anger, sadness, and joy) and the narratives underlying those       ter’s content redistribution policy restricts researchers from
emotions during the pandemic. A regional study [33] in             sharing tweets data other than tweet IDs, Direct Message
Spain performed sentiment analysis on 106,261 conversa-            IDs and/or User IDs. The original collection did not have
tions collected from various digital platforms, including          tweet IDs. Therefore, tweets collected between January 27,
Twitter and Instagram, during March and April 2020, to             2020, and March 20, 2020, could not be released to the
examine the impact of risk communications on emotions in           public. Hence, a fresh collection was started on March 20,
Spanish society during the pandemic. In a similar regional         2020.
study [42] concerning China and Italy, the effect of COVID-           Figure 1 shows the daily distribution of the tweets in
19 lockdown on individuals’ psychological states was stud-         the COV19Tweets Dataset. Between March 20, 2020,
ied using the conversations available on Weibo (for China)         and April 17, 2020, four keywords, “corona,” “#corona,”
and Twitter (for Italy) by analyzing the posts published two       “coronavirus,” and “#coronavirus,” were used for filtering
weeks before and after the lockdown.                               the Twitter stream. Therefore, the number of tweets captured
                                                                   in that period per day, on average, is around 893k. However,
2.3 Network analysis                                               a dedicated collection was started on a Linux-based high-
                                                                   performance CPU-Optimized virtual machine (VM), with
Multiple studies have performed social network analysis on         additional filtering keywords, after April 18, 2020.
Twitter data related to the COVID-19 pandemic. A case
study [17] examined the propagation of the #FilmYourHos-           3.1.1 Keywords
pital hashtag using social network analysis techniques to
understand whether the hashtag virality was aided by bots          As of July 17, 2020, 46 keywords are being tracked for
or coordination among Twitter users. Another study [2]             streaming the tweets. The number of keywords has been
collected tweets containing the #5GCoronavirus hashtag             evolving continuously since the inception of this study.
between March 27, 2020, and April 4, 2020, and per-                Table 1 gives an overview of the filtering keywords currently
formed network analysis to understand the drivers of the           in use. As the pandemic grew, a lot of new keywords
5G COVID-19 conspiracy theory and strategies to deal               emerged. In this study, n-grams are analyzed every 2 hours
with such misinformation. A regional study [37] concerning         using the recent most 0.5 million tweets to keep track of
South Korea used network analysis to investigate the infor-        emerging keywords. Twitter’s “worldwide trends” section
mation transmission networks and news-sharing behaviors            is also monitored for the same purpose. On May 13, 2020,
regarding COVID-19 on Twitter. A similar study [27] inves-         Twitter also published a list of 564 multi-lingual filtering
tigated the relationship between social network size and           keywords used in its COVID-19 stream endpoint [44].
incivility using the tweets originating from South Korea              The streaming API allows developers to use up to 400
between February 10, 2020, and February 14, 2020, when             keywords, 5,000 user IDs, and 25 location boxes for filtering
the Korean government planned to bring its citizens back           the Twitter stream. The keywords are matched against the
from Wuhan.                                                        tokenized text of the body of the tweet. 46 keywords have
                                                                   been identified as filtering rules for extracting COVID-19
                                                                   specific tweets. User ID filtering was not used. Also, the
3 Dataset design                                                   location box filtering was avoided as the intention was to
                                                                   create a global dataset. Twitter adds a BCP 471 language
3.1 Data collection                                                identifier based on the machine-detected language of the
                                                                   tweet body. Since the aim was to pull only the English
Twitter provides two API types: search API [47] and stream-        tweets, the “en” condition was assigned to the language
ing API [45]. The Standard version of search API can be            request parameter.
used to search against the sample of tweets created in the
last seven days, while the Premium and Enterprise versions         3.2 Infrastructure
allow developers to access tweets posted in the previous
30 days (30-day endpoint) or from as early as 2006 (Full-          The collection of tweets is a small portion of the dataset
archive endpoint) [47]. The streaming API is used for access-      design. The other tasks include filtration of geo-tagged
ing tweets from the real-time Twitter feed [45]. For this study,   tweets and computation of sentiment score for each captured
the streaming API is being used since March 20, 2020.              tweet, all that in real-time. A dashboard is also required
   The original collection of tweets was started on January
                                                                   1 https://tools.ietf.org/html/bcp47
27, 2020. The study commenced as an optimization design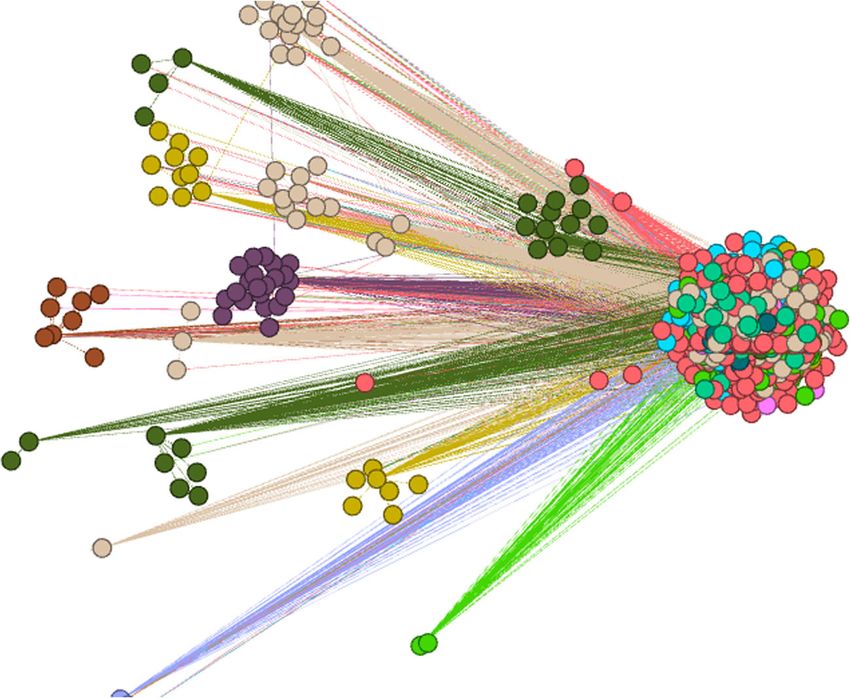
R. Lamsal

Fig. 1 Daily distribution of tweets in the COV19Tweets Dataset

to visualize the information extracted from the collected                 35%. Few Python scripts and libraries, and a web server
tweets. A stable internet connection is needed to download                is actively running in the back-end. The majority of the
the continuously incoming JSON. The computation of                        tasks are CPU intensive; therefore, memory usage does not
sentiment score for each captured tweet requires the VM                   seem to exceed 35%, as shown in Fig. 2b. Past data show
to constitute powerful enough CPUs to avoid a bottleneck                  that memory usage exceeds 35% only when the web traffic
scenario. Every information gathered to this point needs                  on the visualization dashboard increases; otherwise, it is
to be stored on a database, which necessitates a disk with                usually constant.
excellent performance. Summing up, a cloud-based VM is                       The Load average graph, in Fig. 2c, shows that the
required to automate all these tasks.                                     processors do not operate overcapacity. The three colored
   In this study, the VM has to process thousands of tweets               lines, magenta, green and purple, represent 1-minute, 5-
every minute. Also, the information extracted from the                    minute, and 15-minute load average. The Disk I/O graph,
captured data is to be visualized on an active front-end                  in Fig. 2d, interprets the read and write activity of the
server that requires plotting of hundreds of thousands of                 VM. Saving thousands of tweets information every minute
data points. Therefore, a Linux-based compute-optimized                   triggers continuous writing activity on the disk. The Disk
hyper-threading VM is used for this study. Table 2 gives                  I/O graph shows that the write speed is around 3.5 MB/s,
an overview of the VM considered in the dataset design.                   and the read speed is insignificant. The Bandwidth usage
Figure 2a-e shows the resource utilization graphs for various             graph, in Fig. 2e, reveals the public bandwidth usage
performance parameters of the VM.                                         pattern. On average, the VM is receiving a continuous data
   A new collection starts between 1000-1100hrs GMT+5:45,                 stream at 3 Mb/s. The VM connects with the backup server’s
every day. Therefore, the CPU usage and average load                      database to download the recent half a million tweets for
increase gradually as more and more tweets get captured.                  extracting a list of unigrams and bigrams. A new list is
The CPU usage graph, in Fig. 2a, shows that the highest                   created every 2 hours; therefore, 12 peaks in the Bandwidth
percentage of CPU usage at any given time does not exceed                 usage graph.

Table 1 Overview of the filtering keywords as of July 17, 2020

In use since                 Keywordsa

March 20, 2020               corona, #corona, coronavirus, #coronavirus
April 18, 2020               covid, #covid, covid19, #covid19, covid-19, #covid-19, sarscov2, #sarscov2, sars cov2, sars cov 2, covid 19,
                             #covid 19, #ncov, ncov, #ncov2019, ncov2019, 2019-ncov, #2019-ncov, #2019ncov, 2019ncov
May 16, 2020                 pandemic, #pandemic, quarantine, #quarantine, flatten the curve, flattening the curve, #flatteningthecurve,
                             #flattenthecurve, hand sanitizer, #handsanitizer, #lockdown, lockdown, social distancing, #socialdistancing, work
                             from home, #workfromhome, working from home, #workingfromhome, ppe, n95, #ppe, #n95

a   keyword preceded by a hash sign (#) is a hashtag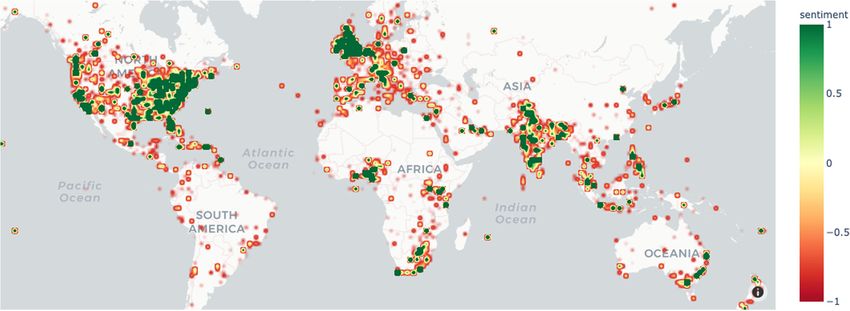
Design and analysis of a large-scale COVID-19 tweets dataset

Table 2 Overview of the VM

Resource                                                          Description

CPU                                                               Intel(R) Xeon(R) Gold 6140 CPU @ 2.30GHz, Width: 64 bits, 2 vCPUs
Memory                                                            Size: 4GiB
Disk type                                                         Solid State Drive
Bandwidth (based on Speedtest CLI)                                Download avg.: 2658.182 Mb/s Upload avg.: 2149.294 Mb/s

3.3 The sentiment scores                                            range [-1,+1] represent strongly Negative sentiment and
                                                                    strongly Positive sentiment, respectively.
The dataset has two columns: Tweet ID and Sentiment                     Tweets are preprocessed before computing sentiment
score. During the project’s inception, a Long Short-Term            scores. Hash symbol (#), mention symbol (@), URLs, extra
Memory (LSTM) deep network was used for computing                   spaces, and paragraph breaks are cleaned. Punctuations,
the sentiment scores. When a new collection was started on          emojis, and numbers are included. Advance-level prepro-
March 20, 2020, the LSTM model, which was still in its              cessing, such as (i) correction of incorrectly spelt words,
pre-alpha stage, was replaced by the TextBlob’s Sentiment           (ii) conversion of abbreviations to their original forms, are
Analysis module. TextBlob is considered among similar               bypassed to avoid analysis bottleneck.
libraries since its sentiment analysis model computes the
sentiment polarity as a continuous value rather than a              3.4 Filtering geo-tagged tweets
category. The sentiment scores are defined in the range [-
1,+1]. If a score falls between (0,+1], the tweet is considered     Geotagging is the process of placing location information in
to have a Positive sentiment. Similarly, a score in the range       a tweet. When a user permits Twitter to access his/her loca-
[-1, 0) represents a Negative sentiment. And the score “0”          tion via an embedded Global Positioning System (GPS),
denotes a Neutral sentiment. Scores in the extremes of the          the geo-coordinates data is added to the tweet location

Fig. 2 Resource utilization graphs for the VM (24 hours)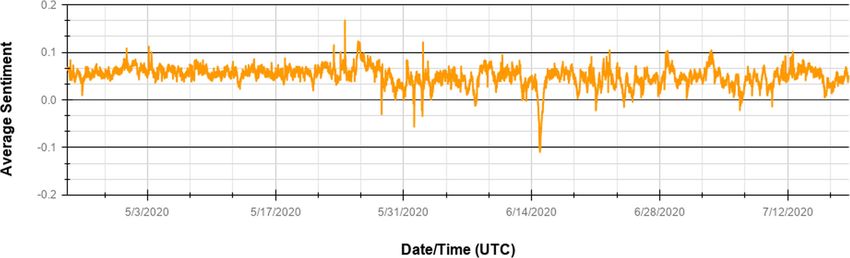
R. Lamsal
metadata. This metadata gives access to various Geo Objects 3.5 Dataset releases
[46] such as "place type": "city", "name":
"Manhattan", "full name": "Manhattan, NY", Twitter’s content redistribution policy restricts the sharing
"country code": "US", "country": "United of tweet information other than tweet IDs, Direct Message
States" and the bounding box (polygon) of coordinates IDs and/or User IDs. Twitter wants researchers to pull fresh
that encloses the place. data from its platform. It is because users might delete their
Previous studies have shown that significantly less num- tweets or make their profile private. Therefore, complying
ber of tweets are geo-tagged. A study [5], conducted between with Twitter’s content redistribution policy, only the tweet
2016-17 in Southampton city, used local and spatial data to IDs are released. The dataset is updated every day with the
show that around 36k tweets out of 5 million had “point” addition of newly collected tweet IDs.
geolocation data. Similarly, in another work [9] done in
online health information, it was evident that only 2.02% of 3.5.1 Dataset limitations
tweets were geo-tagged. Further, a multilingual COVID-19
global tweets dataset from CrisisNLP [39] reported having First, Twitter allows developers to stream around 1% of all
around 0.072% geo-tagged tweets. In this study, the tweets the new public tweets as they happen, via its Streaming
received from the Twitter stream are filtered by applying API. Therefore, the dataset is a sample of the comprehensive
a condition on the ["coordinates"] Twitter Object to COVID-19 tweets collection Twitter has on its servers.
design the GeoCOV19Tweets Dataset. Second, there is a known gap in the dataset. Due to some
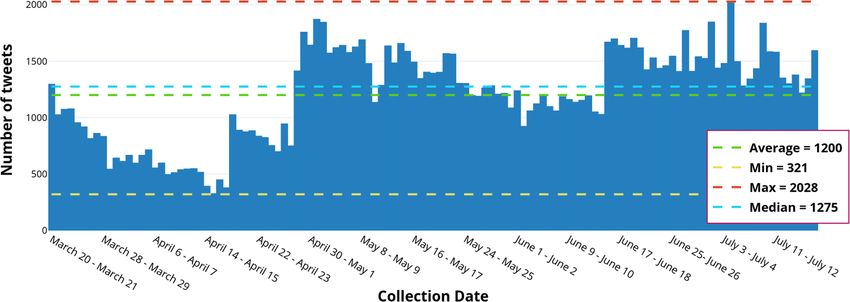
Algorithm 1 shows the pseudo-code for filtering the geo- technical reasons, the tweets collected between March 29,
tagged tweets. Figure 3 shows the daily distribution of 2020, 1605hrs GMT+5:45, and March 30, 2020, 1400hrs
tweets present in the GeoCOV19Tweets Dataset. Out GMT+5:45 could not be retrieved. Third, tweets analysis
of 310 million tweets, 141k tweets (0.045%) were found in a single language increases the risks of missing essential
to be geo-tagged. If the collection after April 18, 2020, is information available in tweets created in other languages
considered, 118k (0.043%) tweets are geo-tagged. [15]. Therefore, the dataset is primarily applicable for
understanding the COVID-19 public discourse originating
from native English-speaking nations.
4 Using the COV19Tweets dataset
Twitter does not allow JSON of the tweets to be shared with
third parties; the tweet IDs provided in the COV19Tweets
Dataset must be hydrated to get the original JSON. This
process of extracting the original JSON from the tweet IDs
is known as the hydration of tweets IDs. There
are multiple libraries/applications such as twarc (Python
Fig. 3 Daily distribution of tweets in the GeoCOV19Tweets Dataset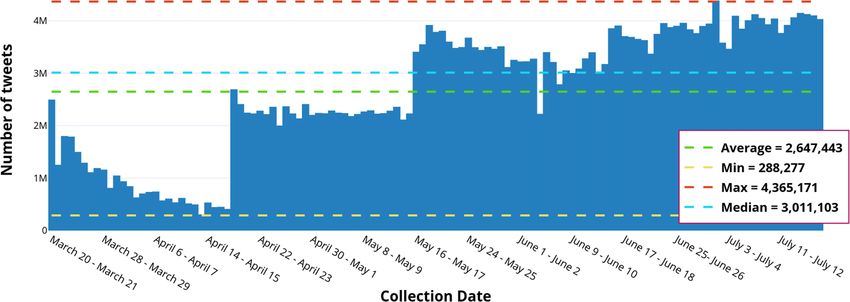
Design and analysis of a large-scale COVID-19 tweets dataset

library) and Hydrator (Desktop application) developed
for this purpose. Using the Hydrator application is
relatively straightforward; however, working with the
twarc library requires basic programming knowledge.
Algorithm 2 is the pseudo-code for using twarc to hydrate
a list of tweet IDs.

   The tweet data dictionary provides access to a long list
of root-level attributes. The root-level attributes, such as user,
coordinates, place, entities, etc., further provide multiple
child-level attributes. When hydrated, the tweet IDs
produce JSON that contains all the root-level and child-
level attributes with their values. Twitter’s documentation
[48] can be referred for more information on the tweet data
dictionary.

4.0.2 Filtering tweets originating from a region

The COV19Tweets Dataset has global coverage, and
it can also be used to extract tweets originating from
a particular region. An implementable solution for this
will be to check if a tweet is geo-tagged or has place
boundary defined in its data dictionary. If none of these
fields are available, the address given on the user’s profile
can be used. However, Twitter does not validate the profile
address field for authentic geo-information. Even addresses
such as “Milky Way Galaxy,” “Earth,” “Land,” “My
Dream,” etc. are accepted entries. A user can also create
a tweet from a particular place while having an address
of a different one. Therefore, considering user’s profile
address might not be an effective solution while dealing
with location information. Algorithm 3 is the pseudo-
code for extracting tweets originating from a region of
interest.
R. Lamsal

5 Analysis & discussions                                                 unique relations when weighted. Finally, the resulting
                                                                         relations were used for generating a network graph, as
Tweets received from the Twitter stream can be analyzed                  shown in Fig. 5. The graph shows interesting facts about
for making multiple inferences regarding an event. The                   dataset. The network has a dense block of nodes forming a
tweets collected between April 24, 2020, and July 17, 2020,              sphere and multiple sparsely populated nodes connected to
were considered to generate an overall COVID-19 sentiment                the nodes inside the sphere through some relations.
trend graph. The sampling time is 10 minutes, which                         The nodes that are outside the sphere are country-specific
means a combined sentiment score is computed for tweets                  hashtags. For illustration, Fig. 6a-d shows the country-
captured in every 10 minutes. Figure 4 shows the COVID-                  specific hashtags for New Zealand, Qatar, Venezuela, and
19 sentiment trend based on public discourse related to the              Argentina. The nodes of these countries are outside the
pandemic.                                                                sphere because of outliers in their respective sets of
   In Fig. 4, there are multiple drops in the average                    hashtags. However, these countries do have connections
sentiment over the analysis period. In particular, there                 with the popular hashtags present inside the sphere. The
are fourteen drops where the scores are negative. Among                  majority of the hashtags in Fig. 6a-d do not relate directly to
those fourteen drops, seven of the significant drops were                the pandemic. Therefore, these hashtags can be considered
studied. The tweets collected in those dates were analyzed               as outliers while designing a set of hashtags for the
to see what particular terms (unigrams and bigrams) were                 pandemic.
trending. Table 3 lists the most commonly used terms during
those seven drops.                                                       5.1.1 Communities
   The tweets are pre-processed before extracting the
unigrams and bigrams. The pre-processing steps include                   The network graph, shown in Fig. 5, is further expanded
transforming the texts to their lowercases and removing                  by a scale factor, as shown in Fig. 7a and b. The network
noisy data such as retweet information, URLs, special                    graphs are colored based on the communities detected by
characters, and stop words [15]. It should be noted that                 a modularity algorithm [6, 28]. The algorithm detected 12
the removal of stop words from the tweet body results in                 communities in the GeoCOV19Tweets Dataset. The
a different set of bigrams. Therefore, the bigrams listed in             weight=‘weight’ and resolution=1.0 parameters
Table 3 should not be considered the sole representative of              were used for the experimentation.
the context in which the terms might have been used.                        Table 4 gives an overview of the 12 communities
                                                                         identified in the GeoCOV19Tweets Dataset. Country
5.1 Network analysis                                                     names are represented by their ISO codes. Community 0
                                                                         constitutes 55.56% of the nodes in the network. The number
Next, the GeoCOV19Tweets Dataset was used for                            of members in Community 0 was relatively high; therefore,
performing network analysis to extract the underlying                    the ISO column for that community lists only the countries
relationship between countries and hashtags. Only the                    that have associations with at least 25 different hashtags. For
hashtags that appear more than ten times in the entire dataset           the remaining communities, all the members are listed.
were considered. The dataset resulted in 303,488 number                     Communities are formed based on the usage of similar
of [country, hashtag] relations from 190 countries and                   hashtags. The United States has associations with the
territories, and 5055 unique hashtags. There were 32,474                 highest number of different hashtags, it is therefore justified

Fig. 4 COVID-19 sentiment trend, since April 24, 2020 to July 17, 2020
Design and analysis of a large-scale COVID-19 tweets dataset

Table 3 Trending unigrams and bigrams

Date               scorea     Unigramsb                                              Bigrams

May 28, 2020       −0.03      deaths, people, trump, pandemic, cases, world,         nursing homes, covid deaths, bad gift, tested positive,
                              US, virus, health, UK, death, government, china,       gift china, death rate, supreme court, new york,
                              police                                                 real virus, covid racism
June 01, 2020      −0.05      people, US, health, protests, care, cases, pan-        covid testing, stay home, testing centers, impose curfew,
                              demic, home, testing, trump, black, virus, please,     eight pm, curfue impose, fighting covid, peaceful protests,
                              masks, curfew, tests                                   health care, enough masks, masks ppe
June 14, 2020      −0.11      pandemic, people, children, cases, virus, staff, US,   covid blacks, latinx children, unbelievable asians, sys-
                              deaths, killed, worst, disease, beat, unbelievable     tematically killed,     exposed corona,     going missing,
                                                                                     staff sitting, recovered covid, worst disease
June 21, 2020      −0.02      trump, people, pandemic, masks, rally, tulsa,          wearing masks, social distancing, wake call, mother died,
                              cases, social, distancing, lockdown, died, hospital,   still arguing, tested positive, trump campaign, tulsa rally,
                              mask, call,                                            trump rally
June 24, 2020      −0.01      pandemic, people, trump, cases, US, testing,           covid cases, social distancing, last year, drunk driving,
                              lockdown, positive, lindsay, world, social, masks,     lindsay richardson, tested positive, wear mask, amer-
                              president                                              ica recovering
July 06, 2020      −0.02      pandemic, people, trump, cases, lockdown, posi-        social distancing, got covid, severe respiratory, respira-
                              tive, US, virus, wear, social, distancing, mask        tory cardiovascular, wear mask, kimberly guilfoyle, don-
                                                                                     ald trump
July 10, 2020      −0.01      andemic, coronavirus, people, cases, trump, con-       control covid, covid cases, covid schools, social distancing,
                              trol, lockdown, US, schools, students, deaths,         shake hands, kneel bow, hands hug, vs right, left vs
                              masks, virus, home, government

a the lowest average sentiment reached on the particular date, b excluding the significantly dominating unigrams: COVID, corona, coronavirus and
other terms, such as SARS, nCoV, SARS-CoV-2, etc

to find most countries in the same group with the United                     example, the United Kingdom appears to be mostly using
States. However, other native English-speaking nations such                  “lockdown,” “lockdown2020,” “isolation,” “selfisolation,”
as the United Kingdom and Canada seem to be forming their                    etc. as hashtags, but the presence of these hashtags in the
own communities. This formation of separate communities                      hashtag set of the United States is limited. The ISO codes for
is because of the differences in their sets of hashtags. For                 each community in Table 4 are sorted in descending order;

Fig. 5 Network Analysis:
Overview of the
GeoCOV19Tweets
Dataset
R. Lamsal
Fig. 6 Country specific outlier
hashtags detected using
Network Analysis
the country associated with the highest number of unique reason, there is an unusual increase in the usage of “lock-
hashtags is mentioned first. down” related hashtags during that period in those countries.
Next, a set of popular hashtags and their communities are It should be noted that a thorough tracing back of hash-
identified. Table 5 lists the top 40 commonly used hashtags, tag usage would require analysis of tweets collected since
their weighted in-degree, and their respective communities. December 2019, when the “first case” of COVID-19 was
The community for a hashtag in Table 5 means that the identified [19].
hashtag has appeared the most in that particular community.
The [country, hashtag] relations can also be used to trace 5.2 Sentiment Map
back a hashtag’s usage pattern. The hashtags “flattenthe-
curve,” “itsbetteroutside,” “quarantine,” “socialdistancing,” As of July 17, 2020, the number of tweets in the
etc. seem to be first used in the tweets originating from GeoCOV19Tweets Dataset is 141,260. The dataset is
the United States. In the fourth week of March 2020, coun- hydrated to create a country-level distribution of the geo-
tries such as the United Kingdom, India, and South Africa tagged tweets, as shown in Table 6. The United States
experienced their first phase of lockdown. For the same dominates the distribution with the highest number of
Fig. 7 Network diagram in
Fig. 5 expanded by a scale factorDesign and analysis of a large-scale COVID-19 tweets dataset
Table 4 Communities in the GeoCOV19Tweets dataset
S No. Ca Color Nb Countries (ISO)c
1 0 Medium Red 55.56% US, AU, NG, ZA, AE, ES, ID, IE, MX, PK, SG, FR, BE, GH, KE, TH, SE,
AT, SA, PT, LB, UG, EG, CO, MA, LK, EC, HK, KW, RO, PE, FI, HR, NO,
ZW, PA, TZ, VN, BS, PG, HU, BH, CR, BB, OM, SX, RS, TW, BG, DO,
ZM, AW, KH, GU, BT, BW, CM, CG, CD, FJ, AQ, SV, AL, ET, JO, UY
2 4 Cyan 17.12% GB, MV, MK, MU, SK, SC, SY, IM, CU, MO, SR, GL, CK, LS
3 3 Yellow Green 11.55% IN, TT, BJ, LY, TO
4 2 Blush Pink 4.79% CA
5 1 Cameo 4.52% PH, MY, BR, TR, AR, IL, DK, RU, DX, GT, CY, IQ, AG, HN, BY, TC, AI
6 6 Buddha Gold 2.25% IT, SI, VE, MC
7 5 Caribbean Green 2.21% DE, NL, CZ, UA, AO, GN
8 9 Pine Green 0.74% JP, PL
9 8 Fern Frond 0.55% NZ, NP, MT, IR
10 7 Eggplant 0.42% QA
11 10 Paarl 0.19% BM
12 11 Melrose 0.1% KR
a community, b percentage of total nodes, c italicized ISO codes suggest that those countries have associations with less than 25 different hashtags
geo-tagged tweets followed by the United Kingdom, 0.23% of tweets have geo-coordinates information but still
Canada, and India. During hydration, it was observed that produce NoneType ["place"] attribute. Such tweets
2.80% of the tweets were either deleted or made private. cannot be hydrated to extract place information unless
The GeoCOV19Tweets Dataset has tweets origi- the coordinates are reverse geo-coded. Therefore, the first
nating from 204 different countries and territories. Around if-else block of Algorithm 3 checks if there is a
Table 5 Top 40 hashtags and their communities
Hashtag Weighted in-degree Ca Hashtag Weighted in-degree Ca
covid19 31,414 0 isolation 799 4
coronavirus 15,709 0 india 716 3
corona 11,338 0 savetheworld 708 0
lockdown 5,300 4 facemask 704 0
quarantine 5,242 0 workfromhome 655 3
socialdistancing 4,438 0 stayhealthy 634 0
stayhome 4,198 0 savetheworldthanksdoc 617 3
covid 4,074 0 london 568 4
staysafe 3,393 0 health 533 2
pandemic 2,206 0 italy 471 6
billionshieldschallenge 2,129 0 wearamask 459 0
billionshields 1,957 0 fitness 450 4
stayathome 1,675 1 exoworldnow 437 0
faceshield 1,524 0 besafe 435 0
love 1,442 0 newnormal 410 1
quarantinelife 1,323 0 stayhomestaysafe 393 3
mask 1,212 0 selfisolation 391 4
2020 1,192 0 washyourhands 390 0
virus 1,148 0 coronamemes 383 3
lockdown2020 853 4 workingfromhome 364 4
a communityR. Lamsal
Table 6 Distribution of tweets in the GeoCOV18Tweets Dataset view for the authorities to create first-hand sketches of
(top 7) tentative locations to start for responding to a crisis.
S No. Country # of tweetsa (n=137,302) For example, the location information extracted from the
tweets classified to the “Infrastructure and utilities damage”
1 United States 60,016 (43.71%) category can help generate near real-time convex closures
2 United Kingdom 20,847 (15.18%) of the crisis-hit area. Such convex closures can prove to
3 Canada 10,688 (7.78%) be beneficial for the first responders (army, police, rescue
4 India 10,082 (7.34%) teams, first-aid volunteers, etc.) to come up with actionable
5 Nigeria 4,246 (3.09%) plans. In general, the inferences made from geo-specific
6 Australia 2,893 (2.11%) data can help (i) understand knowledge gaps, (ii) perform
7 South Africa 2,824 (2.06%) surveillance for prioritizing regions, and (iii) recognize the
urgent needs of a population [39].
a as of July 17, 2020, 1010hrs GMT+5:45 Understanding the knowledge gaps involves identifying
the crisis event-related queries posted by the public on
requirement for converting geo-coordinates to a human- social media. The queries can be anything, a rumor, or
readable address. even some casual inquiry. Machine learning models can
be trained on large-scale tweets corpus for classifying the
5.2.1 Visualizing the tweets tweets into multiple informational categories, including
a separate class for “queries.” Even after the automatic
Next, the geo-tagged tweets were visualized on a map classification, each category still contains hundreds of
based on their sentiment scores. Figures 8 and 9 are the thousands of tweets conversations, which require further in-
sentiment maps generated based on the location information depth analysis. Those classified tweets can be summarized
extracted from the tweets collected between March 20, to extract concise and important set of conversations.
2020, and July 17, 2020. The world view of the COVID- Recent studies have used extractive summarization [41, 50],
19 sentiment map, in Fig. 8, shows that the majority of abstractive summarization [36], and the hybrid approach
the tweets are originating from North America, Europe, [40] for summarizing microblogging streams. If the queries
and the Indian subcontinent. Interestingly, some tweets are identified and duly answered, the public’s tendency to
are also seen to be originating from countries where the panicking can be settled to some extent.
government has banned Twitter. Around 0.26% of the geo- Further, geo-specific data can assist in surveillance
tagged tweets have come from the People’s Republic of purposes. The social media messages can be monitored
China, while North Korea does appear on the list, the actively to identify the messages that report a disease’s
number is insignificant. signs and symptoms. If such messages are detected quite
When a region-specific sentiment map, as shown in early, an efficient response can be targeted to that particular
Fig. 9, is generated, numerous clusters of geo-location region. The authorities and decision-makers can come up
points are observed. Such clusters can be a bird’s-eye with effective and actionable plans to minimize possible
Fig. 8 World view of COVID-19 SentimentDesign and analysis of a large-scale COVID-19 tweets dataset
Fig. 9 Region-specific view of
COVID-19 Sentiment (color
scale for this figure is same as of
Fig. 8)
future severity. Furthermore, social media messages can The United States dominates the country-level distribution
also be analyzed to understand the urgent needs of of the geo-tagged tweets and is followed by the United
a population. The requirements might include anything Kingdom, Canada, and India. Designing a large-scale
related to everyday essentials (shelter, food, water) and Twitter dataset requires a reliable VM to fully automate
health services (medicines, checkups). the associated tasks. Five performance metrics (specific
The above-discussed research implications fall under the to CPU, memory, average load, disk i/o, bandwidth) were
crisis response phase of the disaster management cycle. analyzed to see how the VM was performing over a period
However, other sub-areas in the Social Computing domain (24 hour). The paper then discussed techniques to hydrate
enforce the computational systems to also understand the tweet IDs and filter tweets originating from a region of
psychology, and sociology of the affected population/region interest.
as part of the crisis recovery phase. The design of such Next, the COV19Tweets Dataset and its geo ver-
computational systems requires a humongous amount of sion were used for sentiment analysis and network anal-
data for modeling intelligence within them to track the ysis. The tweets collected between April 24, 2020, and
public discourse relating to any event. Therefore, a large- July 17, 2020, were considered to generate an overall
scale Twitter dataset for the COVID-19 pandemic was COVID-19 sentiment trend graph. Based on the trend
presented in this paper, hoping that the dataset and its graph, seven significant drops in the average sentiment
geo version would help researchers working in the Social over the analysis period were studied. Trending unigrams
Computing domain to better understand the COVID-19 and bigrams on those particular dates were identified. Fur-
discourse. ther, a detailed social network analysis was done on the
GeoCOV19Tweets Dataset using [country, hashtag]
relations. The analysis confirmed the presence of 12 differ-
6 Conclusion ent communities within the dataset. The formation of com-
munities was based on the usage of similar hashtags. Also, a
In this paper, a large-scale global Twitter dataset, set of popular hashtags and their communities were identi-
COV19Tweets Dataset, is presented. The dataset con- fied. Furthermore, the GeoCOV19Tweets Dataset was
tains more than 310 million English language tweets, used for generating world and region-specific sentiment-
originating from 204 different countries and territories based maps, and the research implications of using geo-
worldwide, collected over March 20, 2020, and July 17, specific data were briefly outlined.
2020. Earlier studies have shown that geo-specific social
media conversations aid in extracting situational informa- Acknowledgments The author is grateful to DigitalOcean and Google
tion related to an ongoing crisis event. Therefore, the Cloud for funding the computing resources required for this study.
geo-tagged tweets in the COV19Tweets Dataset is fil-
tered to create its geo version, the GeoCOV19Tweets Compliance with Ethical Standards
Dataset.
Out of 310 million tweets, it was observed that only 141k Conflict of interests The author declares that there is no conflict of
tweets (0.045%) had “point” location in their metadata. interest.R. Lamsal
References 21. Imran M, Castillo C, Lucas J, Meier P, Vieweg S (2014) Aidr:
Artificial intelligence for disaster response. In: Proceedings of the
23rd International Conference on World Wide Web, pp 159–162
1. Abd-Alrazaq A, Alhuwail D, Househ M, Hamdi M, Shah Z
22. Imran M, Mitra P, Castillo C (2016) Twitter as a lifeline: Human-
(2020) Top concerns of tweeters during the covid-19 pandemic:
annotated twitter corpora for nlp of crisis-related messages. In:
infoveillance study. J Med Internet Res 22(4):e19016
Proceedings of the Tenth International Conference on Language
2. Ahmed W, Vidal-Alaball J, Downing J, Seguı́ F. L (2020) Covid-
Resources and Evaluation (LREC 2016). European Language
19 and the 5g conspiracy theory: social network analysis of twitter
Resources Association (ELRA):Paris, France
data. J Med Internet Res 22(5):e19458
23. Imran M, Ofli F, Caragea D, Torralba A (2020) Using ai and social
3. Alqurashi S, Alhindi A, Alanazi E (2020) Large arabic twitter
media multimodal content for disaster response and management:
dataset on covid-19. arXiv:2004.04315
Opportunities, challenges, and future directions. Inf Process
4. Banda JM, Tekumalla R, Wang G, Yu J, Liu T, Ding
Manag 57(5):102261. https://doi.org/10.1016/j.ipm.2020.102261
Y, Chowell G (2020) A large-scale covid-19 twitter chatter
dataset for open scientific research–an international collaboration. 24. Inuwa-Dutse I, Liptrott M, Korkontzelos I (2018) Detection of
arXiv:2004.03688 spam-posting accounts on twitter. Neurocomputing 315:496–511
5. Bennett NC, Millard DE, Martin D (2018) Assessing twitter 25. Kalyanam J, Quezada M, Poblete B, Lanckriet G (2016)
geocoding resolution. In: Proceedings of the 10th ACM Confer- Prediction and characterization of high-activity events in social
ence on Web Science, pp 239–243 media triggered by real-world news. PloS one 11(12):e0166694
6. Blondel VD, Guillaume JL, Lambiotte R, Lefebvre E (2008) Fast 26. Kerchner D, Wrubel L Coronavirus tweet ids. harvard dataverse
unfolding of communities in large networks. J Stat Mech: Theory 27. Kim B (2020) Effects of social grooming on incivility in covid-19.
Exper 2008(10):P10008 Cyberpsychology, Behavior, and Social Networking
7. Bondielli A, Marcelloni F (2019) A survey on fake news and 28. Lambiotte R, Delvenne JC, Barahona M (2008) Laplacian dynam-
rumour detection techniques. Inf Sci 497:38–55 ics and multiscale modular structure in networks. arXiv:0812.1770
8. Bovet A, Makse HA (2019) Influence of fake news in twitter 29. Lamsal R (2020b) Coronavirus (covid-19) geo-tagged tweets
during the 2016 us presidential election. Nat Commun 10(1):1–14 dataset. https://doi.org/10.21227/fpsb-jz61
9. Burton SH, Tanner KW, Giraud-Carrier CG, West JH, Barnes MD 30. Lamsal R (2020a) Coronavirus (covid-19) tweets dataset.
(2012) ”right time, right place” health communication on twitter: https://doi.org/10.21227/781w-ef42
value and accuracy of location information. J Med Internet Res 31. Lamsal R, Kumar TV (2021) Twitter based disaster response using
14(6):e156 recurrent nets. Int J Sociotechnol Knowl Dev (IJSKD) 14(4)
10. Carley KM, Malik M, Landwehr PM, Pfeffer J, Kowalchuck M 32. Landwehr PM, Wei W, Kowalchuck M, Carley KM (2016) Using
(2016) Crowd sourcing disaster management: The complex nature tweets to support disaster planning, warning and response. Saf Sci
of twitter usage in padang indonesia. Saf Sci 90, 48–61 90:33–47
11. Castillo C (2016) Big crisis data: social media in disasters and 33. de Las Heras-Pedrosa C, Sánchez-Núñez P, Peláez J. I (2020)
time-critical situations. Cambridge University Press Sentiment analysis and emotion understanding during the covid-
12. Chatfield AT, Scholl HJJ, Brajawidagda U (2013) Tsunami early 19 pandemic in spain and its impact on digital ecosystems. Int J
warnings via twitter in government: Net-savvy citizens’ co- Environ Res Publ Health 17(15):5542
production of time-critical public information services. Govern Inf 34. Lwin MO, Lu J, Sheldenkar A, Schulz PJ, Shin W, Gupta R, Yang
Quart 30(4):377–386 Y (2020) Global sentiments surrounding the covid-19 pandemic
13. Chen E, Lerman K, Ferrara E (2020) Tracking social media on twitter: analysis of twitter trends. JMIR Publ Health Surveill
discourse about the covid-19 pandemic: Development of a 6(2):e19447
public coronavirus twitter data set. JMIR Publ Health Surveill 35. Nguyen DT, Al Mannai KA, Joty S, Sajjad H, Imran M,
6(2):e19273 Mitra P (2017) Robust classification of crisis-related data on
14. Cheong M, Lee VC (2011) A microblogging-based approach social networks using convolutional neural networks. In: Eleventh
to terrorism informatics: Exploration and chronicling civilian International AAAI Conference on Web and Social Media
sentiment and response to terrorism events via twitter. Inf Syst 36. Olariu A (2014) Efficient online summarization of microblogging
Front 13(1):45–59 streams. In: Proceedings of the 14th Conference of the European
15. Dashtipour K, Poria S, Hussain A, Cambria E, Hawalah AY, Chapter of the Association for Computational Linguistics, Volume
Gelbukh A, Zhou Q (2016) Multilingual sentiment analysis: 2: Short Papers, pp 236–240
state of the art and independent comparison of techniques. Cogn 37. Park HW, Park S, Chong M (2020) Conversations and medical
Comput 8(4):757–771 news frames on twitter: Infodemiological study on covid-19 in
16. Earle P, Guy M, Buckmaster R, Ostrum C, Horvath S, Vaughan south korea. J Med Internet Res 22(5):e18897
A (2010) Omg earthquake! can twitter improve earthquake 38. Purohit H, Hampton A, Shalin VL, Sheth AP, Flach J, Bhatt
response? Seismol Res Lett 81(2):246–251 S (2013) What kind of# conversation is twitter? mining#
17. Gruzd A, Mai P (2020) Going viral: How a single tweet psycholinguistic cues for emergency coordination. Comput Hum
spawned a covid-19 conspiracy theory on twitter. Big Data Soc Behav 29(6):2438–2447
7(2):2053951720938405 39. Qazi U, Imran M, Ofli F (2020) Geocov19: a dataset of
18. Haouari F, Hasanain M, Suwaileh R, Elsayed T (2020) Arcov- hundreds of millions of multilingual covid-19 tweets with location
19: The first arabic covid-19 twitter dataset with propagation information. SIGSPATIAL Spec 12(1):6–15
networks. arXiv:2004.05861 40. Rudra K, Goyal P, Ganguly N, Imran M, Mitra P (2019)
19. Huang C, Wang Y, Li X, Ren L, Zhao J, Hu Y, Zhang L, Fan G, Xu Summarizing situational tweets in crisis scenarios: An extractive-
J, Gu X et al (2020) Clinical features of patients infected with 2019 abstractive approach. IEEE Trans Comput Soc Syst 6(5):981–993
novel coronavirus in wuhan, china. lancet 395(10223):497–506 41. Shou L, Wang Z, Chen K, Chen G (2013) Sumblr: continuous
20. Imran M, Castillo C, Diaz F, Vieweg S (2015) Processing social summarization of evolving tweet streams. In: Proceedings of
media messages in mass emergency: A survey. ACM Comput Surv the 36th international ACM SIGIR conference on Research and
(CSUR) 47(4):1–38 development in information retrieval, pp 533–542Design and analysis of a large-scale COVID-19 tweets dataset
42. Su Y, Xue J, Liu X, Wu P, Chen J, Chen C, Liu T, Gong W, Zhu T 53. Zahra K, Imran M, Ostermann FO (2020) Automatic identification
(2020) Examining the impact of covid-19 lockdown in wuhan and of eyewitness messages on twitter during disasters. Inf Process
lombardy: a psycholinguistic analysis on weibo and twitter. Int J Manag 57(1):102107
Environ Res Publ Health 17(12):4552 54. Zou L, Lam NS, Cai H, Qiang Y (2018) Mining twitter data for
43. Takahashi B, Tandoc Jr EC, Carmichael C (2015) Communicating improved understanding of disaster resilience. Ann Amer Assoc
on twitter during a disaster: An analysis of tweets during typhoon Geogr 108(5): 1422–1441
haiyan in the philippines. Comput Hum Behav 50:392–398
44. Twitter: Covid-19 stream (2020). https://developer.twitter.com/en/
docs/labs/covid19-stream/filtering-rules Publisher’s note Springer Nature remains neutral with regard to
45. Twitter: Filter realtime tweets (2020). https://developer.twitter. jurisdictional claims in published maps and institutional affiliations.
com/en/docs/tweets/filter-realtime/overview
46. Twitter: Geo objects (2020). https://developer.twitter.com/en/
docs/tweets/data-dictionary/overview/geo-objects
47. Twitter: Standard search api (2020). https://developer.twitter.com/ Rabindra Lamsal received his
en/docs/tweets/search/overview BE in Computer Engineer-
48. Twitter: Twitter object (2020). https://developer.twitter.com/en/ ing from Kathmandu Univer-
docs/tweets/data-dictionary/overview/tweet-object sity and M.Tech in Computer
49. Wang B, Zhuang J (2018) Rumor response, debunking response, Science and Technology from
and decision makings of misinformed twitter users during Jawaharlal Nehru University
disasters. Nat Hazards 93(3):1145–1162 (JNU). He was also associ-
50. Wang Z, Shou L, Chen K, Chen G, Mehrotra S (2014) On ated with the Special Centre
summarization and timeline generation for evolutionary tweet for Disaster Research, JNU,
streams. IEEE Trans Knowl Data Eng 27(5):1301–1315 as a Project associate from
51. Wang Z, Ye X, Tsou MH (2016) Spatial, temporal, and content 2018-19. His areas of research
analysis of twitter for wildfire hazards. Nat Hazards 83(1):523– interest are Machine Learning,
540 Natural Language Processing,
52. Worldometer: Covid-19 coronavirus pandemic (2020 (accessed Social Media Analytics and
July 13, 2020)). https://www.worldometers.info/coronavirus/ Social Computing.You can also read