Transcriptome analysis of sinensetin-treated liver cancer cells guided by biological network analysis
←
→
Page content transcription
If your browser does not render page correctly, please read the page content below
ONCOLOGY LETTERS 21: 355, 2021

                   Transcriptome analysis of sinensetin-treated liver
                   cancer cells guided by biological network analysis
           SEONG MIN KIM1, SHAILIMA RAMPOGU2, PREETHI VETRIVEL1, APOORVA M. KULKARNI2,
                  SANG EUN HA1, HUN HWAN KIM1, KEUN WOO LEE2 and GON SUP KIM1

               1
              Research Institute of Life Science and College of Veterinary Medicine; 2Division of Life Science,
       Division of Applied Life Science (BK21 Plus), Plant Molecular Biology and Biotechnology Research Center,
  Research Institute of Natural Science, Gyeongsang National University, Jinju, Gyeongsangnam 52828, Republic of Korea

                                       Received July 28, 2020; Accepted February 15, 2021

                                                     DOI: 10.3892/ol.2021.12616

Abstract. Hepatocellular carcinoma is recognized as one              involved in cancer after SIN treatment in HepG2 cells and may
of the most frequently occurring malignant types of liver            help to develop strategies targeting these genes for treating
cancer globally, making the identification of biomarkers criti‑      liver cancer.
cally important. The aim of the present study was to identify
the genes involved in the anticancer effects of flavonoid            Introduction
compounds so that they may be used as targets for cancer
treatment. Sinensetin (SIN), an isolated polymethoxyflavone          Liver cancer is one of the most common cancers with an
monomer compound, possesses broad antitumor activi‑                  increasing death rate. Approximately 0.56 million new cases
ties in vitro. Therefore, the identification of a transcriptome      are reported annually (1). Approximately 50% of patients
profile on the condition of cells treated with SIN may aid to        during treatment with chemotherapy develop metastasis, thus
better understand the genes involved and its mechanism of            reducing their survival rate (2). Difficulties in chemothera‑
action. Genomic profiling studies of cancer are increasing           peutic techniques have led to other treatment options such as
rapidly in order to provide gene expression data that can            the use of nutraceuticals and natural therapies for combating
reveal prognostic biomarkers to combat liver cancer. In the          this diseased with prior knowledge about their mechanisms
present study, high‑throughput RNA sequencing (RNA‑seq)              of action (3). Thus, an emerging theme in cancer biology is
was performed to reveal differential gene expression patterns        targeting genes and/or proteins that can link to the progres‑
between SIN‑treated and SIN‑untreated human liver cancer             sion of cancer and factors that directly or indirectly affect the
HepG2 cells. A total of 43 genes were identified to be differ‑       proliferation and metastasis (4).
entially expressed (39 downregulated and 4 upregulated in the            Natural herbs have gained attraction in the current era due
SIN‑treated group compared with the SIN‑untreated group).            to their roles in controlling cancer growth by targeting onco‑
An extensive network analysis for these 43 genes resulted in         genes and proteins that are altered in cancers. Isolated monomer
the identification of 10 upregulated highly interconnected hub       polymethoxyflavones (PMFs) have shown a broad spectrum of
genes that contributed to the progression of cancer. Functional      anti‑cancer activities by inhibiting cell proliferation and cancer
enrichment analysis of these 10 hub genes revealed their             prevention (5). Sinensetin (SIN) is one such polymethoxyfla‑
involvement in the regulation of apoptotic processes, immune         vone present in citrus fruits that has notable anti‑inflammatory
response and tumor necrosis factor production. Additionally,         and anti‑tumor activities (6). Although the anti‑cancer effect
the mRNA expression levels of these 10 genes were evaluated          of SIN in cancer cells has been studied recently, gene expres‑
using reverse transcription‑quantitative PCR, and the results        sion changes and molecular mechanisms associated with its
were consistent with the RNA‑seq data. Overall, the results          anti‑cancer activities remain largely unknown. Transcription
of the present study revealed differentially expressed genes         profile using RNA‑sequencing (RNA‑seq) technology can
                                                                     help us understand its mechanism of action (7). Transcriptome
                                                                     analysis is a technology using bioinformatics and data‑mining
                                                                     tools to analyze changed target genes and understand the
                                                                     mechanism of action of a drug after treatment with an in vitro
Correspondence to: Professor Gon Sup Kim, Research Institute
                                                                     model (8). The major way to explore the molecular mecha‑
of Life Science and College of Veterinary Medicine, Gyeongsang
National University, 501 Jinju-dearo, Jinju, Gyeongsangnam 52828,    nism involved in the anti‑cancer effect of flavonoids is by
Republic of Korea                                                    determining gene activities and functions using transcriptome
E-mail: gonskim@gnu.ac.kr                                            analysis (9). Genomic findings through a sequencing approach
                                                                     provide features of genomes due to external influences such as
Key words: liver cancer, sinensetin, RNA sequencing, transcriptome   a drug treatment. Differential gene expression under treated
                                                                     conditions of a disease can provide us a better understanding of
                                                                     factors in a particular state modified by a candidate drug (10).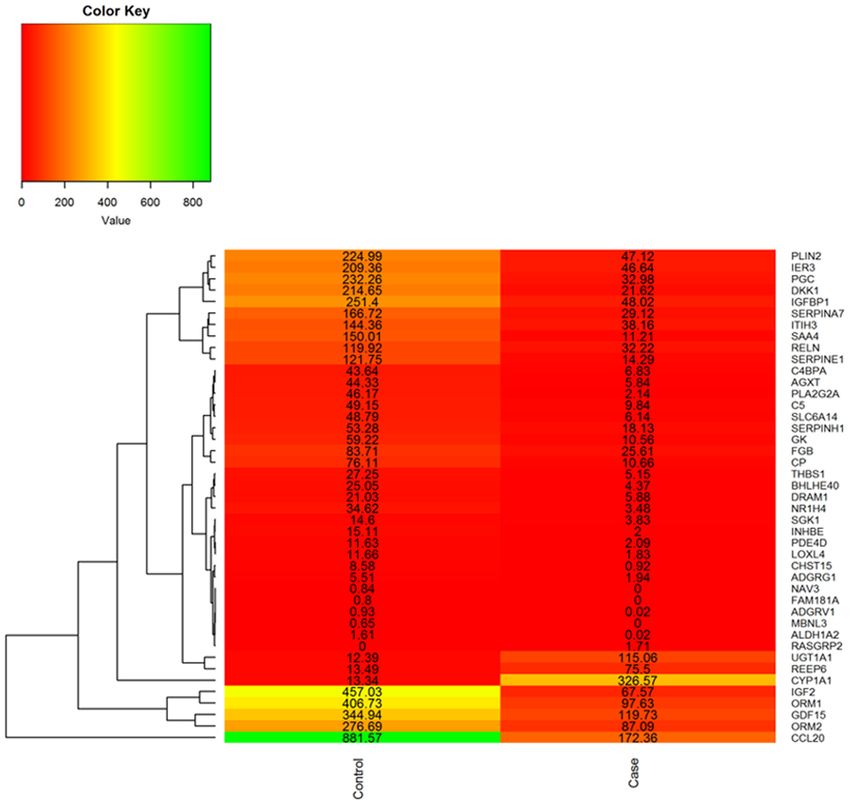
2                          KIM et al: TRANSCRIPTOME ANALYSIS OF SINENSETIN-TREATED HEPG2 CELLS

Furthermore, gene expression obtained from transcriptome            single‑stranded cDNAs as templates, second strand cDNA
data can lead to the discovery of novel key genes associated        synthesis was carried out to prepare double‑stranded cDNAs.
with the related pathway (11). The advent of next‑generation        These cDNAs were then amplified with a sequential process of
sequencing (NGS) data provides a detailed cancer profile            end‑pair repair, addition of A‑tail, and adapter ligation using
that can explain the relationship and connection of genes           polymerase chain reaction (PCR). The quality of constructed
involved in a disease. In addition, the analysis of differential    cDNA libraries wase evaluated with an Agilent 2100
patterns of genes can help us understand biological processes,      BioAnalyzer (Agilent Technologies, Inc.) and quantified
cellular components, and interacting pathway network related        with a KAPA library quantification kit (Kapa Biosystems)
to cancer pathogenesis for each one (12). Furthermore, bioin‑       according to each manufacturer's protocol. These products
formatics analysis of differential gene profiles is an attractive   were then purified and enriched with cluster amplification
strategy to identify novel therapeutic biomarkers for treating      using PCR to obtain the final complementary DNA library
a disease (13). In this regard, taking an integrated approach to    for high‑throughput paired‑end (2x150 bp) DNA sequencing
identify mRNA targets using next‑generation sequencing data         using an Illumina NovaSeq6000 (Illumina, Inc.).
can reveal specific biomarkers for cancer types.
    Developed almost a decade ago, RNA‑seq is a potent              Transcript data analysis. After filtering out low quality reads,
tool for understanding genomic functions. Differentially            TopHat was used to map quality‑filtered reads to a reference
expressed genes (DEG) remains the primary application of            genome (hg38) (16). We measured gene expression levels with
RNA‑seq (14). DEGs are genes whose expression levels are            Cufflinks v2.1.1 using the Ensembl human gene annotation
significantly altered between two or more conditions such           database. We performed differential expression analysis using
as before and after treatment with a drug. In this regard, the      cuffdiff (17). To improve the accuracy of measurement, we
concept of hub genes is gaining interest. Hub genes are highly      applied frag bias and multi‑read correct options for both cuff‑
interconnected genes in a protein‑protein interaction (PPI)         links and cuffdiff. All other options were set to default values.
network. Their associated biological process gene ontology          DEGs were identified and filtered with the following criteria:
terms and pathways might improve our understanding of their         false discovery rate 1 (18).
roles in carcinogenicity (15).
    In the current study, we performed Illumina NovaSeq6000         Identification of hub genes and their analysis. To identify hub
sequencing for SIN‑treated and ‑untreated HepG2 liver cancer        genes among DEGs, a PPI network of 43 DEGs was constructed
cells and studied differential gene expression patterns. Highly     using STRING (https://string‑db.org/) with a ‘minimum
interconnected genes (hub) genes among these were studied           required interaction score’ set to medium confidence (0.400)
extensively for their roles in cancer. The expression of these      and ‘maximum number of interactors to show’ set to query
hub genes was further validated by qRT‑PCR.                         proteins for both 1st and 2nd shells (19). The PPI network was
                                                                    imported in cytoscape using CytoHubba's Maximal Clique
Materials and methods                                               Centrality (MCC) scoring method to identify top ten hub genes
                                                                    incorporated in STRING and to discover significantly enriched
Cell culture. A human liver cancer cell line (HepG2) authenti‑      biological process gene ontology (GO) terms and KEGG
cated using short tandem repeat (STR) profiling was obtained        pathways (20). Top ten biological process GO terms with the
from the Korean Cell Line Bank (Seoul, Korea). HepG2 cells          lowest false discovery rate were analyzed using REVIGO (21).
were cultured in DMEM (Gibco; Thermo Fisher Scientific,             Additionally, we performed an extensive literature survey for
Inc.) supplemented with 10% fetal bovine serum (Gibco;              these genes to uncover their roles in cancer.
Thermo Fisher Scientific, Inc.), 100 U/ml penicillin, and
100 µg/ml streptomycin (Gibco; Thermo Fisher Scientific,            qRT‑PCR and data analysis. To validate hub genes differen‑
Inc.) at 37˚C with 5% CO2.                                          tially expressed based on transcriptome analysis, we studied
                                                                    mRNA expression levels of these hub genes by quantitative
Isolation of RNA for sequencing. HepG2 cells were seeded            real‑time polymerase chain reaction (qRT‑PCR). HepG2 cells
into 6‑well plates and treated with 100 µM of SIN for 48 h at       were seeded into 6‑well plates and treated with 100 µM of SIN
37˚C. After 48 h treatment, total RNAs were extracted using         for 48 h at 37˚C. Total RNA was isolated and its concentration
TRIzol. The concentration of RNA was determined using a             was determined using a spectrophotometer. Total RNA (1 µg)
spectrophotometer. Isolated total RNA was then subjected to         was converted to cDNA using an iScript™ cDNA synthesis kit
sequencing to obtain expression data.                               (Bio‑Rad Laboratories, Inc.). qRT‑PCR was then performed
                                                                    using cDNA and AccuPower® 2X Greenstar™ qPCR Master
Library preparation and sequencing. Sequencing was                  (Bioneer). qPCR primers used in this study are listed in Table I.
performed by TheragenEtex (Gyeonggi‑do) with the following          All data were analyzed using Bio‑Rad CFX Manager
described protocol. RNA‑seq libraries were constructed using        Version 3.1. We measured relative quantification using the
a TruSeq Stranded mRNA Sample Prep Kit (Illumina, Inc.)             2‑ΔΔCq method. mRNA expression levels of target genes were
for 150‑bp paired‑end sequencing. Poly‑A‑containing                 normalized against those of β‑actin.
mRNA molecules were purified and fragmented from
2 µg of DNase‑treated total RNA using oligo(dT) magnetic            Statistical analysis. All data were analyzed using GraphPad
beads. Following the purification step, mRNAs were frag‑            Prism version 5.0 (GraphPad Software). Results are expressed
mented and used for synthesis of single‑stranded cDNAs by           as means ± SEM. They were evaluated using the Student's t‑test.
means of random hexamer priming. With the constructed               P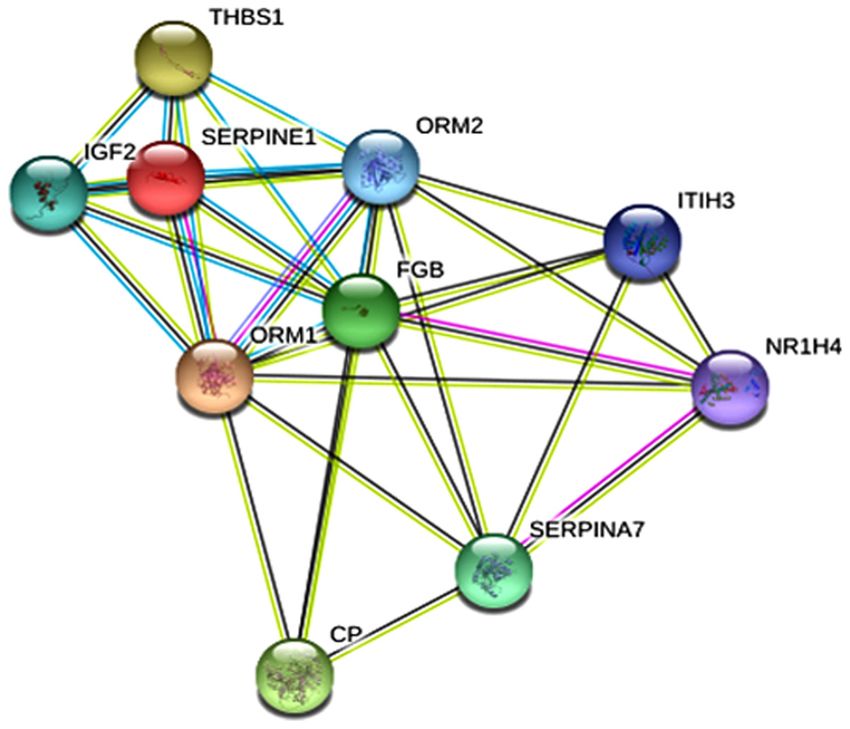
ONCOLOGY LETTERS 21: 355, 2021                                               3

Table I. Forward and reverse primers used for reverse tran‑           Table II. Upregulated and downregulated genes in SIN-treated
scription-quantitative PCR of hub genes.                              HepG2 cells compared with SIN-untreated HepG2 cells.

Gene name                      Primer sequence (5'-3')                A, Upregulated genes

Ceruloplasmin        F:   TGCAAATGGGAGACAGAAAGA                       No.                                               Genes
                     R:   TCAGGTGCAGTTGTAAACATTC
                                                                       1                                               REEP6
FGB                  F:   CAGGACCATGACCATTCACA
                                                                       2                                               CYP1A1
                     R:   CATCCACCACCGTCTTCTTTA
                                                                       3                                               RASGRP2
IGF2                 F:   CGGCTTCTACTTCAGCAGG                          4                                               UGT1A1
                     R:   GTAGCACAGTACGTCTCCAG
ITIH3                F:   CAGTTGCAGGGCTTCTATGA
                                                                      B, Downregulated genes
                     R:   GCTGGTAAGTGTTCTGGGTG
NR1H4                F:   TACCAGGATTTCAGACTTTGGAC                     No.                                               Genes
                     R:   CCCAGACGGAAGTTTCTTATTGA
ORM1                 F:   ACCAGTGCATCTATAACACCAC                       1                                              PLA2G2A
                     R:   AGCAAGCATGTAGGTCTTGG                         2                                              C4BPA
                                                                       3                                              CCL20
ORM2                 F:   ACCAGTGCTTCTATAACTCCAG
                                                                       4                                              AGXT
                     R:   ATCGTCCAGGTAGGAACCAA
                                                                       5                                              BHLHE40
SERPINA7             F:   ATATGACCTTGGAGCCACAC                         6                                              ITIH3
                     R:   CCTTATGGGCAGCATTGGAA                         7                                              CP
SERPINE1             F:   GACCCATGACCTGCAGAAAC                         8                                              FGB
                     R:   TACAGGTCCTTCTTGCCTGA                         9                                              PDE4D
THBS1                F:   CCTGGACTCGCTGTAGGTTA                        10                                              ADGRV1
                     R:   CTGGACTGGTAGCCAAAGAC                        11                                              IER3
β-actin              F:   TTCTACAATGAGCTGCGTGTGG                      12                                              PGC
                                                                      13                                              SGK1
                     R:   GTGTTGAAGGTCTCAAACATGAT
                                                                      14                                              IGFBP1
F, forward; R, reverse; FGB, fibrinogen β chain; IGF2, insulin-like   15                                              SERPINE1
growth factor 2; ITIH3, inter-α-trypsin inhibitor heavy chain 3;      16                                              RELN
NRIH4, nuclear receptor subfamily 1 group H member 4; ORM1/2,         17                                              GK
orosomucoid 1/2; SERPINE1, serpin family E member 1; SERPINA7,        18                                              SERPINA7
serpin family A member 7; THBS1, thrombospondin 1.
                                                                      19                                              SLC6A14
                                                                      20                                              MBNL3
                                                                      21                                              PLIN2
                                                                      22                                              ORM1
Results                                                               23                                              ORM2
                                                                      24                                              C5
Identification of DEGs. In our previous study on SIN treat‑
                                                                      25                                              IGF2
ment in HepG2 cells, we found that SIN could induce HCC
                                                                      26                                              SAA4
cell death in vitro (22). RNA‑seq and Cuffdiff identified
                                                                      27                                              SERPINH1
43 DEGs (Table II) between SIN‑untreated and SIN‑treated
HepG2 cells based on the selection criteria (a false discovery        28                                              DKK1
rate 1). Out of these 43 DEG's, 39 were          29                                              LOXL4
downregulated and 4 were upregulated. These DEGs were                 30                                              CHST15
plotted using the heatmap.2 function from R's gplot package.          31                                              INHBE
Fragments per kilobase of transcript per million (FPKM)               32                                              NAV3
values per genes in SIN‑untreated (control) and SIN‑treated           33                                              NR1H4
(case) HepG2 cells were used for heatmap generation (Fig. 1).         34                                              DRAM1
                                                                      35                                              FAM181A
Hub genes and their enrichment analysis. Hub genes are                36                                              THBS1
highly interconnected genes that might be involved in impor‑          37                                              ALDH1A2
tant cancer‑related biological processes and functions. Fig. 2        38                                              ADGRG1
shows the protein-protein interaction network of the ten hub          39                                              GDF15
genes identified by Cytohubba’s MCC tool.
    When these hub genes were subjected to STRING and                 SIN, sinensetin.
enrichment analysis to identify significant GO terms and
4 KIM et al: TRANSCRIPTOME ANALYSIS OF SINENSETIN-TREATED HEPG2 CELLS
Figure 1. Heatmap of differentially expressed genes. Each row represents a gene and each column represents a control (SIN‑untreated HepG2 cells) or
case (SIN‑treated HepG2 cells) sample. Numbers indicate fragments per kilobase per million mapped reads values. The analysis revealed 43 differentially
expressed genes (4 upregulated and 39 downregulated). SIN, sinensetin.
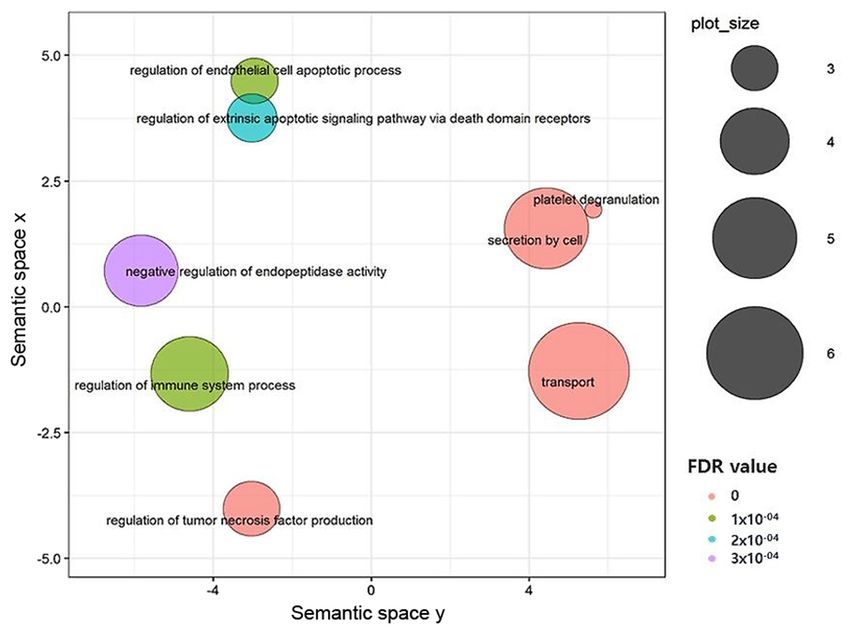
for top ten biological process GO terms showing the lowest
FDR values (23). REVIGO indicated that these genes were
mainly involved in immune‑system responses, regulation of
tumor necrosis factor production, regulation of the apoptotic
process, regulation of protein metabolism, and transport
and secretion processes as shown in the REVIGO scatter
plot (Fig. 3). Additionally, KEGG pathway analysis revealed
that SERPINE1 and THBS1 modified wild‑type human
p53 (TP53), complement, coagulation cascade, and proteogly‑
cans in cancer pathways.
Roles of expression of hub genes in cancer. All our hub genes
were downregulated. Therefore, we did a comprehensive
literature search to figure out roles of these upregulated hub
genes in cancer.
Insulin‑like growth factor‑2 (IGF2). IGF2 is a
67‑amino‑acid mitogenic peptide hormone involved in the
Figure 2. Protein‑protein interaction network of hub genes from STRING. regulation of cell growth, differentiation, and metabolism. It
Interactions from curated databases, experimentally measured, text‑mining is mainly expressed by the liver, although it can be expressed
and co‑expression are shown in blue, pink, green and black, respectively. in many other tissues (24). IGF2 is overexpressed in a variety
of cancers. Cancer cells that overexpress IGF2 have a strong
tendency to metastasize (25,26). One study has shown that
KEGG pathways, a list of 101 biological process GO terms there is a five‑fold increase in the expression of IGF2 in
and three significant pathways were retrieved. For the ease HepG2 cells (27). The use of antisense oligodeoxynucleo‑
of analysis and visualization, we did a REVIGO analysis tides (ATON) to halt the translation of IGF2 mRNA has shownONCOLOGY LETTERS 21: 355, 2021 5
Figure 3. REVIGO scatter plot showing top 10 biological process GO terms with least FDR values. Color indicates the FDR value. Size indicates the frequency
of the GO terms in the underlying GO annotation database. GO, Gene Ontology; FDR, false discovery rate.
that a decrease of IGF2 can inhibit the growth of HepG2 cells. respectively. Increased fibrinogen activity can affect tumor cell
Another study has also observed an overexpression of IGF2 growth, progression, and metastasis (40). Moreover, colorectal
in hepatocellular carcinoma cells. Similarly, there is a notable cancer growth is reduced in fibrinogen‑deficient mice (41).
decrease in tumor growth and an increase in mice survival The FGB gene is also upregulated in lung carcinomas and
when antibodies against IGF1 and IGF2 are administered (28). breast cancer (42,43). Although we could not find a direct link
SERPINE1 and SERPINA7. SERPINE1 and SERPINA7 between upregulation of FGB and HCC, in vitro studies have
belong to the human SERPIN gene family, which gets shown that FGG (another gene involved in fibrinogen forma‑
its name from its originally identified function of serine tion) upregulation can promote the migration and invasion of
proteinase inhibition. However, many of its members also HCC whereas knockdown of FGG can significantly inhibit
act as chaperones involved in storage, transport, and other phenotypes (44).
roles (29‑31). SERPINE1 encodes for a serine proteinase Orosomucoid 1 (ORM1) and orosomucoid 2 (ORM2). The
inhibitor. It can inhibit tissue plasminogen activator (tPA) and orosomucoid gene family contains two polymorphic genes
urokinase (uPA). High levels of SERPINE1 have been associ‑ (ORM1 and ORM2) primarily secreted by the liver, although
ated with low prognosis rate and survival of lung, breast, oral, they are also abundant in the plasma. They encode for
stomach, and ovarian carcinoma patients (32‑34). In addition, acute‑phase proteins that are expressed during stressful condi‑
reducing the level of SERPINE1 can decrease cell migration tions such as tissue injury, infections, and inflammations (45).
in thyroid cancer (35). In relation to HCC, higher levels of It has been reported that ORM genes are over‑expressed in
SERPINE1 and increased SERPINE1 proteins associated breast cancer, bladder cancer, lung cancer, cholangiocarci‑
with invasiveness, metastasis, and prognosis in patients with noma (bile duct cancer), colorectal cancer, and HCC (46‑50).
liver cancer have been observed (36,37). SERPINA7 encodes However, the mechanism of how orosomucoid genes affect
thyroxine‑binding globulin (TBG), a human thyroid hormone cancer cells remains unclear. Of particular interest, knock‑
protein. SERPINA7 has been found to be upregulated in down of ORM1 can result in decreased proliferation of HCC
colorectal cancer patients (38). One study on 30 patients with cells (46).
primary liver cancer has found that 22 of them have higher Nuclear receptor subfamily 1 group H member 4 (NR1H4).
TBG concentrations. Additionally, in 28 out of 31 patients with NR1H4, also known as farnesoid X receptor (FXR), is
liver metastasis, TBG concentration is higher than normal (39). mainly expressed in the liver, kidney, intestine, and adrenal
gland. It is a member of the nuclear receptor superfamily.
Fibrinogen beta chain (FGB). Fibrinogen is a glycopeptide It is activated upon binding to bile acid for regulating bile
synthesized by hepatocytes. It is formed by connection of two acid homeostasis (51‑53). In vitro studies have revealed
trimers with each trimer containing a fibrinogen alpha chain that the expression of FXR is significantly increased in
that is encoded by the FGA gene, along with the fibrinogen non‑small‑cell lung carcinoma (NSCLC), resulting in
beta chain or gamma chains encoded by FGB or FGG gene, cell proliferation. Knockdown of NR1H4 can inhibit cell6 KIM et al: TRANSCRIPTOME ANALYSIS OF SINENSETIN-TREATED HEPG2 CELLS Figure 4. Quantification of genes using RT‑qPCR. Hub genes were quantified by RT‑qPCR analysis. The expression levels of each gene were suppressed when treated with SIN compared with those in the control group. ***P
ONCOLOGY LETTERS 21: 355, 2021                                                           7

integrated whole‑transcriptome profiling of genes in HCT‑116         Funding
cancer cells by quercetin treatment has revealed pathways that
can regulate cancer progression (79).                                The present study was supported by grants from the National
    Sinensetin (SIN), a polymethoxyflavone present in the            Research Foundation funded by the Ministry of Science and
citrus family, can inhibit several cancers by regulating oxida‑      ICT, Republic of Korea (grant nos. 2012M3A9B8019303 and
tive stress of cells (80). Our previous study has displayed an       2020R1A2B5B01001807).
autophagy‑mediated anti‑cancer potential of SIN in liver
cancer cells. In the current research, we performed RNA‑seq          Availability of data and materials
analysis for SIN‑treated and SIN‑untreated liver cancer
cells (HepG2) to identify critical genes associated with the         The datasets used and/or analyzed during the current study
anti‑cancer potential of SIN.                                        are available from the corresponding author on reasonable
    In vitro and in silico techniques have been widely used          request.
to study anti‑cancer effects of natural compounds and their
mechanisms of action. In vivo animal models have also                Authors' contributions
demonstrated different mechanism involved in their abilities
to prevent diseases such as cancer, neurodegenerative diseases,      GSK and KWL conceived, designed and performed the experi‑
and cardiovascular disorders (81). Such studies can help us          ments. SMK, SR and AMK organized focus group discussion,
understand effects of chemotherapeutics on different enzymes,        collected and analyzed all study data, and prepared the final
cell signaling protein cascades, and gene expression.                manuscript. SMK, PV, SEH and HHK performed some
    In the current study, a total of 43 differentially expressed     experiments and revised the final manuscript. GSK and SMK
genes were identified between SIN‑treated and untreated samples      confirm the authenticity of all the raw data. All authors read
in HepG2 cells. Interestingly, most (39/43) of these genes were      and approved the final manuscript.
downregulated while only four were upregulated by treatment
with SIN. With the help of STRING and Cytohubba, we identified       Ethics approval and consent to participate
ten hub genes from the DEG list. Enrichment analysis indicated
that these hub genes were mainly involved in immune‑system           Not applicable.
responses and regulation of tumor necrosis factor production,
apoptosis, and protein metabolism. As presented in detail in the     Patient consent for publication
results section, we did an extensive literature survey on these
identified hub genes, highlighting their roles in tumor growth,      Not applicable.
tumor invasiveness, poor prognosis, and recurrence in various
cancers upon upregulation of their expression. RNA‑seq analysis      Competing interests
of HepG2 cells treated with SIN showed downregulation of these
hub genes. Literature analysis sheds light on how downregula‑        The authors declare that they have no competing interests.
tion of these hub genes might mediate anti‑cancer processes.
qRT‑PCR data confirmed that expression levels of these hub genes     References
were consistent with RNA‑seq data. Hub genes CP, FGB, IGF2,
ITIH3, NRIH4, ORM1, ORM2, SERPINE1, SERPINA7 and                      1. Li J, Fu Y, Hu X and Xiong Y: Psoralidin inhibits the prolif‑
THBS1 are highly expressed in several cancers, including liver,          eration of human liver cancer cells by triggering cell cycle arrest,
lung, pancreatic, and cervical cancers. Significant downregulation       apoptosis and autophagy and inhibits tumor growth in vivo.
                                                                         J BUON 24: 1950‑1955, 2019.
of these genes upon SIN treatment showed its prominent capacity       2. Sakin A, Sahin S, Atci MM, Yasar N, Geredeli C, Aribal S,
in suppressing these genes in HepG2 cells. The confirmation              Alemdar A, Karataş F and Cihan S: Factors affecting survival in
of expression data revealed that these genes could emerge as             patients with isolated liver‑metastatic colorectal cancer treated
                                                                         with local ablative or surgical treatments for liver metastasis.
attractive therapeutic targets in the treatment of liver cancer.         J BUON 24: 1801‑1808, 2019.
Furthermore, RNA‑seq and relative expression data strengthened        3. Zhang X, Lv J, Luo H, Liu Z, Xu C, Zhou D, Tang L, Zhang Z,
the argument that SIN is a strong anti‑cancer agent in HCC.              Liu J, Xiao M, et al: Nucleostemin promotes hepatocellular
    In conclusion, ιn the current study, transcriptome analysis          carcinoma by regulating the function of STAT3. Exp Cell
                                                                         Res 387: 111748, 2020.
of SIN‑treated HepG2 cells by next generation sequencing              4. Xu L, Wang R, Ziegelbauer J, Wu WW, Shen RF, Juhl H,
supported its anti‑cancer effect. Analysis of DEGs provided              Zhang Y, Pelosof L and Rosenberg AS: Transcriptome analysis
a strong insight on the involvement of hub genes related to              of human colorectal cancer biopsies reveals extensive expression
                                                                         correlations among genes related to cell proliferation, lipid
cancer progression. Results of this study indicate that SIN              metabolism, immune response and collagen catabolism.
might induce HCC cell death by regulating the expression of              Oncotarget 8: 74703‑74719, 2017.
these genes. The objective of this study was to identify the          5. Xu Y, Lv X, Yang G, Zhan J, Li M, Long T, Ho CT and Li S:
                                                                         Simultaneous separation of six pure polymethoxyflavones from
related gene on SIN anti‑cancer effect using transcriptome               sweet orange peel extract by high performance counter current
analysis. This paper highlights the necessity for further studies        chromatography. Food Chem 292: 160‑165, 2019.
to support anti‑cancer effect of those genes.                         6. Kang SI, Shin HS and Kim SJ: Sinensetin enhances adipogenesis
                                                                         and lipolysis by increasing cyclic adenosine monophosphate
                                                                         levels in 3T3‑L1 adipocytes. Biol Pharm Bull 38: 552‑558, 2015.
Acknowledgements                                                      7. Yu T, Zhang H and Qi H: Transcriptome profiling analysis reveals
                                                                         biomarkers in colon cancer samples of various differentiation.
Not applicable.                                                          Oncol Lett 16: 48‑54, 2018.
8 KIM et al: TRANSCRIPTOME ANALYSIS OF SINENSETIN-TREATED HEPG2 CELLS
8. Luo J, Dai X, Hu H, Chen J, Zhao L, Yang C, Sun J, Zhang L, 29. Andreasen PA, Kjøller L, Christensen L and Duffy MJ:
Wang Q, Xu S, et al: Fluzoparib increases radiation sensitivity The urokinase‑type plasminogen activator system in cancer
of non‑small cell lung cancer (NSCLC) cells without BRCA1/2 metastasis: A review. Int J Cancer 72: 1‑22, 1997.
mutation, a novel PARP1 inhibitor undergoing clinical trials. 30. Hundsdorfer B, Zeilhofer HF, Bock KP, Dettmar P, Schmitt M
J Cancer Res Clin Oncol 146: 721‑737, 2020. and Horch HH: The prognostic importance of urinase type plas‑
9. Lin KH, Huang MY, Cheng WC, Wang SC, Fang SH, Tu HP, minogen activators (uPA) and plasminogen activator inhibitors
Su CC, Hung YL, Liu PL, Chen CS, et al: RNA‑seq transcriptome (PAI‑1) in the primary resection of oral squamous cell carcinoma.
analysis of breast cancer cell lines under shikonin treatment. Sci Mund Kiefer Gesichtschir 8: 173‑179, 2004 (In German).
Rep 8: 2672, 2018. 31. Annecke K, Schmitt M, Euler U, Zerm M, Paepke D, Paepke S,
10. Wang D, Zhao L, Wang D, Liu J, Yu X, Wei Y and Ouyang Z: von Minckwitz G, Thomssen C and Harbeck N: uPA and PAI‑1 in
Transcriptome analysis and identification of key genes involved breast cancer: Review of their clinical utility and current validation
in 1‑deoxynojirimycin biosynthesis of mulberry (Morus alba L.). in the prospective NNBC‑3 trial. Adv Clin Chem 45: 31‑45, 2008.
PeerJ 6: e5443, 2018. 32. Harbeck N, Schmitt M, Paepke S, Allgayer H and Kates RE:
11. Zhang Y, Kang Z, Lv D, Zhang X, Liao Y, Li Y, Liu R, Li P, Tumor‑associated proteolytic factors uPA and PAI‑1: Critical
Tong M, Tian J, et al: Longitudinal whole‑genome sequencing appraisal of their clinical relevance in breast cancer and their
reveals the evolution of MPAL. Cancer Genet 240: 59‑65, 2020. integration into decision‑support algorithms. Crit Rev Clin Lab
12. Niemira M, Collin F, Szalkowska A, Bielska A, Chwialkowska K, Sci 44: 179‑201, 2007.
Reszec J, Niklinski J, Kwasniewski M and Kretowski A: 33. Vairaktaris E, Yapijakis C, Psyrri A, Spyridonidou S,
Molecular signature of subtypes of non‑small‑cell lung cancer Yannopoulos A, Lazaris A, Vassiliou S, Ferekidis E, Vylliotis A,
by large‑scale transcriptional profiling: Identification of key Nkenke E, et al: Loss of tumour suppressor p16 expression in initial
modules and genes by Weighted Gene Co‑Expression Network stages of oral oncogenesis. Anticancer Res 27: 979‑984, 2007.
Analysis (WGCNA). Cancers (Basel) 12: E37, 2019. 34. Li L, Zhu Z, Zhao Y, Zhang Q, Wu X, Miao B, Cao J and Fei S:
13. Wang Z, Zhang Z, Zhang C and Xu Y: Identification of potential FN1, SPARC, and SERPINE1 are highly expressed and signifi‑
pathogenic biomarkers in clear cell renal cell carcinoma. Oncol cantly related to a poor prognosis of gastric adenocarcinoma
Lett 15: 8491‑8499, 2018. revealed by microarray and bioinformatics. Sci Rep 9: 7827,
14. Stark R, Grzelak M and Hadfield J: RNA sequencing: The 2019.
teenage years. Nat Rev Genet 20: 631‑656, 2019. 35. Yu XM, Jaskula‑Sztul R, Georgen MR, Aburjania Z, Somnay YR,
15. Liu Y, Gu HY, Zhu J, Niu YM, Zhang C and Guo GL: Identification Leverson G, Sippel RS, Lloyd RV, Johnson BP and Chen H:
of hub genes and key pathways associated with bipolar disorder Notch1 signaling regulates the aggressiveness of differentiated
based on weighted gene co‑expression Network Analysis. Front thyroid cancer and inhibits SERPINE1 expression. Clin Cancer
Physiol 10: 1081, 2019. Res 22: 3582‑3592, 2016.
16. Trapnell C, Pachter L and Salzberg SL: TopHat: Discovering splice 36. Zheng Q, Tang ZY, Xue Q, Shi DR, Song HY and Tang HB:
junctions with RNA‑Seq. Bioinformatics 25: 1105‑1111, 2009. Invasion and metastasis of hepatocellular carcinoma in relation to
17. Trapnell C, Williams BA, Pertea G, Mortazavi A, Kwan G, urokinase‑type plasminogen activator, its receptor and inhibitor.
van Baren MJ, Salzberg SL, Wold BJ and Pachter L: Transcript J Cancer Res Clin Oncol 126: 641‑646, 2000.
assembly and quantification by RNA‑Seq reveals unannotated 37. Divella R, Mazzocca A, Gadaleta C, Simone G, Paradiso A,
transcripts and isoform switching during cell differentiation. Nat Quaranta M and Daniele A: Influence of plasminogen activator
Biotechnol 28: 511‑515, 2010. inhibitor‑1 (SERPINE1) 4G/5G polymorphism on circulating
18. Benjamini Y, Drai D, Elmer G, Kafkafi N and Golani I: Controlling SERPINE‑1 antigen expression in HCC associated with viral
the false discovery rate in behavior genetics research. Behav Brain infection. Cancer Genomics Proteomics 9: 193‑198, 2012.
Res 125: 279‑284, 2001. 38. Holm M, Saraswat M, Joenväärä S, Ristimäki A, Haglund C and
19. Szklarczyk D, Gable AL, Lyon D, Junge A, Wyder S, Renkonen R: Colorectal cancer patients with different C‑reactive
Huerta‑Cepas J, Simonovic M, Doncheva NT, Morris JH, protein levels and 5‑year survival times can be differentiated with
Bork P, et al: STRING v11: Protein‑protein association networks quantitative serum proteomics. PLoS One 13: e0195354, 2018.
with increased coverage, supporting functional discovery in 39. Berger HR, Creech MK, Hannoush Z, Watanabe Y, Kargi A and
genome‑wide experimental datasets. Nucleic Acids Res 47: Weiss RE: A novel mutation causing complete thyroid binding
D607‑D613, 2019. globulin deficiency (Tbg‑Cd Mia) in a male with coexisting
20. Shannon P, Markiel A, Ozier O, Baliga NS, Wang JT, Ramage D, graves disease. AACE Clin Case Rep 3: e134‑e139, 2017.
Amin N, Schwikowski B and Ideker T: Cytoscape: A software 40. Falanga A, Marchetti M and Vignoli A: Coagulation and cancer:
environment for integrated models of biomolecular interaction Biological and clinical aspects. J Thromb Haemost 11: 223‑233, 2013.
networks. Genome Res 13: 2498‑2504, 2003. 41. Adams GN, Rosenfeldt L, Frederick M, Miller W, Waltz D,
21. Supek F, Bošnjak M, Škunca N and Šmuc T: REVIGO Kombrinck K, McElhinney KE, Flick MJ, Monia BP,
summarizes and visualizes long lists of gene ontology terms. Revenko AS, et al: Colon cancer growth and dissemination relies
PLoS One 6: e21800, 2011. upon thrombin, stromal PAR‑1, and fibrinogen. Cancer Res 75:
22. Kim SM, Ha SE, Ho JL, Rampogu S, Vetrivel P, Kim HH, Saralamma 4235‑4243, 2015.
VVG, Lee KW and Kim GS: Sinensetin Induces Autophagic 42. Ciereszko A, Dietrich MA, Słowińska M, Nynca J, Ciborowski M,
Cell Death through p53-Related AMPK/mTOR Signaling in Kisluk J, Michalska‑Falkowska A, Reszec J, Sierko E and
Hepatocellular Carcinoma HepG2 Cells. Nutrients 12: 2462, 2020. Nikliński J: Identification of protein changes in the blood plasma
23. Xiong H, Guo H, Xie Y, Zhao L, Gu J, Zhao S, Li J and Liu L: of lung cancer patients subjected to chemotherapy using a
RNAseq analysis reveals pathways and candidate genes asso‑ 2D‑DIGE approach. PLoS One 14: e0223840, 2019.
ciated with salinity tolerance in a spaceflight‑induced wheat 43. Dowling P, Palmerini V, Henry M, Meleady P, Lynch V, Ballot J,
mutant. Sci Rep 7: 2731, 2017. Gullo G, Crown J, Moriarty M and Clynes M: Transferrin‑bound
24. Livingstone C: IGF2 and cancer. Endocr Relat Cancer 20: proteins as potential biomarkers for advanced breast cancer
R321‑R339, 2013. patients. BBA Clin 2: 24‑30, 2014.
25. Macaulay VM: Insulin‑like growth factors and cancer. Br J 44. Zhang X, Wang F, Huang Y, Ke K, Zhao B, Chen L, Liao N,
Cancer 65: 311‑320, 1992. Wang L, Li Q, Liu X, et al: FGG promotes migration and invasion
26. Guerra FK, Eijan AM, Puricelli L, Alonso DF, Bal de Kier in hepatocellular carcinoma cells through activating epithelial to
Joffé E, Kornblihgtt AR, Charreau EH and Elizalde PV: Varying mesenchymal transition. Cancer Manag Res 11: 1653‑1665, 2019.
patterns of expression of insulin‑like growth factors I and II 45. Lee YS, Choi JW, Hwang I, Lee JW, Lee JH, Kim AY, Huh JY,
and their receptors in murine mammary adenocarcinomas of Koh YJ, Koh GY, Son HJ, et al: Adipocytokine orosomucoid
different metastasizing ability. Int J Cancer 65: 812‑820, 1996. integrates inflammatory and metabolic signals to preserve
27. Lin SB, Hsieh SH, Hsu HL, Lai MY, Kan LS and Au LC: energy homeostasis by resolving immoderate inflammation.
Antisense oligodeoxynucleotides of IGF‑II selectively inhibit J Biol Chem 285: 22174‑22185, 2010.
growth of human hepatoma cells overproducing IGF‑II. 46. Li F, Yu Z, Chen P, Lin G, Li T, Hou L, Du Y and Tan W:
J Biochem 122: 717‑722, 1997. The increased excretion of urinary orosomucoid 1 as a useful
28. Martinez‑Quetglas I, Pinyol R, Dauch D, Torrecilla S, Tovar V, biomarker for bladder cancer. Am J Cancer Res 6: 331‑340, 2016.
Moeini A, Alsinet C, Portela A, Rodriguez‑Carunchio L, 47. Ayyub A, Saleem M, Fatima I, Tariq A, Hashmi N and
Solé M, et al: IGF2 Is up‑regulated by epigenetic mechanisms in Musharraf SG: Glycosylated alpha‑1‑acid glycoprotein 1 as
hepatocellular carcinomas and is an actionable oncogene product a potential lung cancer serum biomarker. Int J Biochem Cell
in experimental models. Gastroenterology 151: 1192‑1205, 2016. Biol 70: 68‑75, 2016.ONCOLOGY LETTERS 21: 355, 2021 9
48. Rucksaken R, Charoensuk L, Pinlaor P, Pairojkul C, Khuntikeo N 66. Tórsdóttir G, Gudmundsson G, Kristinsson J, Snaedal J and
and Pinlaor S: Plasma orosomucoid 2 as a potential risk marker Jóhannesson T: Ceruloplasmin and superoxide dismutase
of cholangiocarcinoma. Cancer Biomark 18: 27‑34, 2017. (SOD1) in heterozygotes for Wilson disease: A case control
49. Falleti E, Pirisi M, Fabris C, Bortolotti N, Soardo G, Toniutto P, study. Neuropsychiatr Dis Treat 5: 55‑59, 2009.
Gonano F and Bartoli E: Increase of serum alpha 1‑acid glyco‑ 67. Schapira DV and Schapira M: Use of ceruloplasmin levels to
protein despite the decline of liver synthetic function in cirrhotics monitor response to therapy and predict recurrence of breast
with hepatocellular carcinoma. Eur J Clin Chem Clin Biochem 31: cancer. Breast Cancer Res Treat 3: 221‑224, 1983.
407‑411, 1993. 68. Brandi J, Dalla Pozza E, Dando I, Biondani G, Robotti E,
50. Alexander H, Stegner AL, Wagner‑Mann C, Du Bois GC, Jenkins R, Elliott V, Park K, Marengo E, Costello E, et al:
Alexander S and Sauter ER: Proteomic analysis to identify breast Secretome protein signature of human pancreatic cancer
cancer biomarkers in nipple aspirate fluid. Clin Cancer Res 10: stem‑like cells. J Proteomics 136: 1‑12, 2016.
7500‑7510, 2004. 69. Han IW, Jang JY, Kwon W, Park T, Kim Y, Lee KB and Kim SW:
51. Forman BM, Goode E, Chen J, Oro AE, Bradley DJ, Perlmann T, Ceruloplasmin as a prognostic marker in patients with bile duct
Noonan DJ, Burka LT, McMorris T, Lamph WW, et al: cancer. Oncotarget 8: 29028‑29037, 2017.
Identification of a nuclear receptor that is activated by farnesol 70. Upadhya S, Upadhya S and Prabhu KS: Serum glycoconjugates
metabolites. Cell 81: 687‑693, 1995. and ceruloplasmin in cancer of uterine cervix. Indian J Clin
52. Sinal CJ, Tohkin M, Miyata M, Ward JM, Lambert G and Biochem 17: 20‑24, 2002.
Gonzalez FJ: Targeted disruption of the nuclear receptor 71. Arumanayagam M, Wong FW, Rogers M and Swaminathan R:
FXR/BAR impairs bile acid and lipid homeostasis. Cell 102: Serum ceruloplasmin, plasma copper concentration and copper
731‑744, 2000. to ceruloplasmin ratio in cervical carcinoma. Gynecol Obstet
53. Lu TT, Makishima M, Repa JJ, Schoonjans K, Kerr TA, Auwerx J Invest 35: 175‑178, 1993.
and Mangelsdorf DJ: Molecular basis for feedback regulation of 72. Huang L, Yoneda M and Kimata K: A serum‑derived hyal‑
bile acid synthesis by nuclear receptors. Mol Cell 6: 507‑515, uronan‑associated protein (SHAP) is the heavy chain of the inter
2000. alpha‑trypsin inhibitor. J Biol Chem 268: 26725‑26730, 1993.
54. You W, Chen B, Liu X, Xue S, Qin H and Jiang H: Farnesoid X 73. Chatterji B and Borlak J: A 2‑DE MALDI‑TOF study to identify
receptor, a novel proto‑oncogene in non‑small cell lung cancer, disease regulated serum proteins in lung cancer of c‑myc
promotes tumor growth via directly transactivating CCND1. Sci transgenic mice. Proteomics 9: 1044‑1056, 2009.
Rep 7: 591, 2017. 74. Heo SH, Lee SJ, Ryoo HM, Park JY and Cho JY: Identification
55. Guan B, Li H, Yang Z, Hoque A and Xu X: Inhibition of of putative serum glycoprotein biomarkers for human lung
farnesoid X receptor controls esophageal cancer cell growth in adenocarcinoma by multilectin affinity chromatography and
vitro and in nude mouse xenografts. Cancer 119: 1321‑1329, 2013. LC‑MS/MS. Proteomics 7: 4292‑4302, 2007.
56. Guo F, Xu Z, Zhang Y, Jiang P, Huang G, Chen S, Lyu X, Zheng P, 75. Chong PK, Lee H, Zhou J, Liu SC, Loh MC, Wang TT, Chan SP,
Zhao X, Zeng Y, et al: FXR induces SOCS3 and suppresses Smoot DT, Ashktorab H, So JB, et al: ITIH3 is a potential
hepatocellular carcinoma. Oncotarget 6: 34606‑34616, 2015. biomarker for early detection of gastric cancer. J Proteome Res 9:
57. Adams JC and Lawler J: The thrombospondins. Int J Biochem 3671‑3679, 2010.
Cell Biol 36: 961‑968, 2004. 76. Pertea M: The human transcriptome: An unfinished story. Genes
58. Huang T, Wang L, Liu D, Li P, Xiong H, Zhuang L, Sun L, (Basel) 3: 344‑360, 2012.
Yuan X and Qiu H: FGF7/FGFR2 signal promotes invasion 77. Cajigas‑Du Ross CK, Martinez SR, Woods‑Burnham L,
and migration in human gastric cancer through upregulation of Durán AM, Roy S, Basu A, Ramirez JA, Ortiz‑Hernández GL,
thrombospondin‑1. Int J Oncol 50: 1501‑1512, 2017. Ríos‑Colón L, Chirshev E, et al: RNA sequencing reveals upreg‑
59. Firlej V, Mathieu JR, Gilbert C, Lemonnier L, Nakhlé J, ulation of a transcriptomic program associated with stemness in
Gallou‑Kabani C, Guarmit B, Morin A, Prevarskaya N, metastatic prostate cancer cells selected for taxane resistance.
Delongchamps NB, et al: Thrombospondin‑1 triggers cell Oncotarget 9: 30363‑30384, 2018.
migration and development of advanced prostate tumors. Cancer 78. Zhao S, Fung‑Leung WP, Bittner A, Ngo K and Liu X:
Res 71: 7649‑7658, 2011. Comparison of RNA‑Seq and microarray in transcriptome
60. Perez‑Janices N, Blanco‑Luquin I, Tuñón MT, Barba‑Ramos E, profiling of activated T cells. PLoS One 9: e78644, 2014.
Ibáñez B, Zazpe‑Cenoz I, Martinez‑Aguillo M, Hernandez B, 79. Zhang Z, Li B, Xu P and Yang B: Integrated whole transcriptome
Martínez‑Lopez E, Fernández AF, et al: EPB41L3, TSP‑1 and profiling and bioinformatics analysis for revealing regulatory
RASSF2 as new clinically relevant prognostic biomarkers in pathways associated with quercetin‑induced apoptosis in
diffuse gliomas. Oncotarget 6: 368‑380, 2015. HCT‑116 cells. Front Pharmacol 10: 798, 2019.
61. Nie S, Lo A, Wu J, Zhu J, Tan Z, Simeone DM, Anderson MA, 80. Xiong YJ, Deng ZB, Liu JN, Qiu JJ, Guo L, Feng PP, Sui JR,
Shedden KA, Ruffin MT and Lubman DM: Glycoprotein Chen DP and Guo HS: Enhancement of epithelial cell autophagy
biomarker panel for pancreatic cancer discovered by quantitative induced by sinensetin alleviates epithelial barrier dysfunction in
proteomics analysis. J Proteome Res 13: 1873‑1884, 2014. colitis. Pharmacol Res 148: 104461, 2019.
62. Lyu T, Jia N, Wang J, Yan X, Yu Y, Lu Z, Bast RC Jr, Hua K 81. Forni C, Facchiano F, Bartoli M, Pieretti S, Facchiano A,
and Feng W: Expression and epigenetic regulation of angio‑ D’Arcangelo D, Norelli S, Valle G, Nisini R, Beninati S, et al:
genesis‑related factors during dormancy and recurrent growth of Beneficial role of phytochemicals on oxidative stress and
ovarian carcinoma. Epigenetics 8: 1330‑1346, 2013. age‑related diseases. BioMed Res Int 2019: 8748253, 2019.
63. Poon RT, Chung KK, Cheung ST, Lau CP, Tong SW, Leung KL,
Yu WC, Tuszynski GP and Fan ST: Clinical significance of This work is licensed under a Creative Commons
thrombospondin 1 expression in hepatocellular carcinoma. Clin Attribution-NonCommercial-NoDerivatives 4.0
Cancer Res 10: 4150-4157, 2004. International (CC BY-NC-ND 4.0) License.
64. Hayashi K, Kurohiji T and Shirouzu K: Localization of thrombos‑
pondin in hepatocellular carcinoma. Hepatology 25: 569‑574, 1997.
65. Lee TK, Cheung VC, Lu P, Lau EY, Ma S, Tang KH, Tong M,
Lo J and Ng IO: Blockade of CD47‑mediated cathepsin
S/protease‑activated receptor 2 signaling provides a therapeutic
target for hepatocellular carcinoma. Hepatology 60: 179‑191, 2014.You can also read