Land-use intensity and the effects of organic farming on biodiversity: a hierarchical meta-analysis
←
→
Page content transcription
If your browser does not render page correctly, please read the page content below
Journal of Applied Ecology 2014, 51, 746–755                                                          doi: 10.1111/1365-2664.12219

REVIEW

Land-use intensity and the effects of organic farming
on biodiversity: a hierarchical meta-analysis
                                     via Mota3, Johan Ahnstro
Sean L. Tuck1*, Camilla Winqvist2, Fla                       € m2,
Lindsay A. Turnbull1,3† and Janne Bengtsson2†
1
 Department of Plant Sciences, University of Oxford, Oxford OX1 3RB, UK; 2Section for Landscape and Soil Ecology,
Department of Ecology, SLU, Box 7044, Uppsala S-750 07, Sweden; and 3Institute of Evolutionary Biology and
Environmental Studies, University of Zurich, Zurich 8057, Switzerland

         Summary
         1. The benefits of organic farming to biodiversity in agricultural landscapes continue to be
         hotly debated, emphasizing the importance of precisely quantifying the effect of organic vs.
         conventional farming.
         2. We conducted an updated hierarchical meta-analysis of studies that compared biodiversity
         under organic and conventional farming methods, measured as species richness. We calcu-
         lated effect sizes for 184 observations garnered from 94 studies, and for each study, we
         obtained three standardized measures reflecting land-use intensity. We investigated the stabil-
         ity of effect sizes through time, publication bias due to the ‘file drawer’ problem, and consider
         whether the current literature is representative of global organic farming patterns.
         3. On average, organic farming increased species richness by about 30%. This result has been
         robust over the last 30 years of published studies and shows no sign of diminishing.
         4. Organic farming had a greater effect on biodiversity as the percentage of the landscape
         consisting of arable fields increased, that is, it is higher in intensively farmed regions. The
         average effect size and the response to agricultural intensification depend on taxonomic
         group, functional group and crop type.
         5. There is some evidence for publication bias in the literature; however, our results are
         robust to its impact. Current studies are heavily biased towards northern and western Europe
         and North America, while other regions with large areas of organic farming remain poorly
         investigated.
         6. Synthesis and applications. Our analysis affirms that organic farming has large positive
         effects on biodiversity compared with conventional farming, but that the effect size varies
         with the organism group and crop studied, and is greater in landscapes with higher land-use
         intensity. Decisions about where to site organic farms to maximize biodiversity will, however,
         depend on the costs as well as the potential benefits. Current studies have been heavily biased
         towards agricultural systems in the developed world. We recommend that future studies pay
         greater attention to other regions, in particular, areas with tropical, subtropical and Mediter-
         ranean climates, in which very few studies have been conducted.
         Key-words: agricultural management, diversity, farming systems, landscape complexity, spe-
         cies richness

                                                                     erally thought to be more environmentally benign than its
Introduction
                                                                     conventional farming cousin. However, the overall bene-
Organic farming, in which insecticides, herbicides and               fits of organic farming for biodiversity, the environment
inorganic fertilizers are entirely or largely avoided, is gen-       in general, human health and food security have been
                                                                     intensely debated in recent years (Bengtsson, Ahnstr€om &
*Correspondence author. E-mail: sean.tuck@plants.ox.ac.uk            Weibull 2005; Hole et al. 2005; Badgley et al. 2007; Mon-
†
  These authors equally contributed to this work.                    delaers, Aertsens & Huylenbroeck 2009; Dobermann

            © 2013 The Authors. Journal of Applied Ecology published by John Wiley & Sons Ltd on behalf of British Ecological Society.
This is an open access article under the terms of the Creative Commons Attribution License, which permits use, distribution and
reproduction in any medium, provided the original work is properly cited.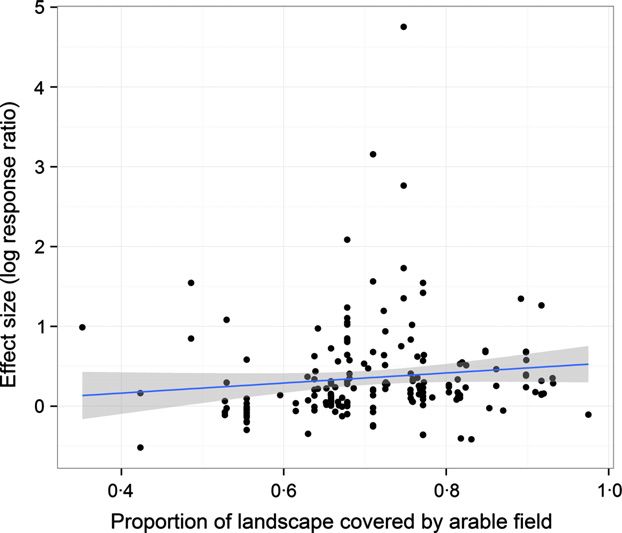
Hierarchical meta-analysis of organic farming        747

2012; Reganold 2012; Tuomisto et al. 2012; Winqvist,                 borne out by individual studies (Rundl€     of & Smith 2006;
Ahnstr€ om & Bengtsson 2012; Gabriel et al. 2013). The               Rundl€  of, Bengtsson & Smith 2008; Brittain et al. 2010;
debate turns on whether or not the decreased yields from             Diek€ otter et al. 2010; Bat  ary et al. 2011; Fischer et al.
organic farms negate any local benefits, for example, to             2011; Flohre et al. 2011; Winqvist, Ahnstr€     om & Bengts-
biodiversity, that such methods deliver (Seufert, Rama-              son 2012) and by meta-analysis in which landscapes were
nkutty & Foley 2012; but see Badgley et al. 2007). The               classified as either simple or complex (Bat  ary et al. 2011).
logic of this argument runs as follows: lower yields push            However, different studies have defined ‘simple’ and ‘com-
up food prices, and as a consequence, more wild or mar-              plex’ in different ways, whereas it would be preferable to
ginal land is brought into agricultural production. This             have some more objective, continuous measurement of
wild land is likely to have supported even higher biodiver-          land-use intensity with which to test these ideas more
sity than the organic farm; hence, begging the question, is          fully.
there an overall cost of organic farming to biodiversity?               While there have been previous meta-analyses compar-
   Organic farming provides shared benefits to both                  ing conventional vs. organic farming and their biodiver-
humans and wildlife, while conventional farming, at least            sity and environmental impacts (Bengtsson, Ahnstr€       om &
in the short term, maximizes yields – thus potentially               Weibull 2005; Bat   ary et al. 2011; Seufert, Ramankutty &
sparing wild lands elsewhere – therefore this argument is            Foley 2012; Tuomisto et al. 2012), we believe that a new
often naively framed as ‘land sharing’ vs. ‘land sparing’            analysis is still timely. First, previous meta-analyses have
(Green et al. 2005; Vandermeer & Perfecto 2007; Fischer              not taken account of the hierarchical structure of the
et al. 2008; Phalan et al. 2011; Tscharntke et al. 2012;             data; secondly, a large number of new studies have been
Gabriel et al. 2013) although recently the debate has                published in recent years; and thirdly, we include here
moved away from such overly simplistic dichotomies. For              three objective and standardized measures of land-use
example, it has been argued that decisions about land                intensity and landscape complexity measured on a contin-
sparing vs. sharing are contingent on the landscape and              uous scale, newly obtained for each of the studies. Using
potential yields (Hodgson et al. 2010; Tscharntke et al.             an extended data set compared with Bengtsson, Ahnstr€      om
2012; Gabriel et al. 2013). It is also clear that some               and Weibull (2005), we can therefore ask the following
organisms are necessary on the farm to support essential             questions: (i) By how much does organic farming increase
ecosystem services, for example, pollination and pest con-           biodiversity compared with conventional agriculture? (ii)
trol, which contribute to yield. Therefore, species in farm-         Do the effects of organic farming depend on the organism
land cannot be entirely sacrificed in order to preserve              or functional group, land-use intensity and structure, and
biodiversity elsewhere. In addition, some species, particu-          crop type? (iii) Has the reported effect size of organic
larly in Europe where farming has been an integral part              farming on biodiversity decreased or remained stable over
of the landscape for thousands of years, thrive in exten-            time? (iv) Is there evidence for publication bias in the lit-
sively managed farmland and are clearly threatened by                erature, either because studies with negligible or negative
agricultural intensification (Chamberlain et al. 2000).              effects of organic farming remain unpublished or because
These species are an integral part of the European cul-              the present studies of organic farming, which are often
tural landscape, and their loss has provoked both public             performed in Europe or the US (Bat     ary et al. 2011; Winq-
and political outcry, leading the British Government, for            vist, Ahnstr€ om & Bengtsson 2012), are unrepresentative
example, to pledge to reverse such declines by 2020. Thus,           of the crops and regions in which organic farming is con-
organic farming, which generally increases both crop and             ducted globally?
landscape heterogeneity, may be one component of a
land-sharing strategy, delivering wider ecosystem services
                                                                     Materials and methods
including amenity and conservation of culturally impor-
tant species (Vandermeer & Perfecto 2007; Gabriel et al.
                                                                     DATA COLLECTION
2013). In this light, quantifying the precise benefits deliv-
ered by organic farming is essential.                                We started with the species richness data set published in 2005 by
   While there is a general consensus that organic farming           Bengtsson, Ahnstr€   om and Weibull, which included 27 studies
increases biodiversity when compared to conventional                 published before December 2002. We expanded this data set to
agriculture, the magnitude of this effect seems to vary              include an additional 68 studies published between 2003 and
                                                                     2011. Some of the additional data (2003–2009) were gathered for
greatly, particularly among organism groups and across
                                                                     an unpublished Master’s thesis (Mota 2010). Further studies from
landscapes (Bengtsson, Ahnstr€  om & Weibull 2005; Bat  ary
                                                                     2010 to 2011 were added by co-authors Ahnstr€   om and Winqvist,
et al. 2011; Winqvist, Ahnstr€ om & Bengtsson 2012). Ben-
                                                                     finishing the literature search by the end of 2011. The full data
gtsson, Ahnstr€ om and Weibull (2005) suggested that the             set consists of 94 publications (see Appendix S1 in Supporting
effects of organic farming on biodiversity were likely to            information). When updating the data set of Bengtsson,
be greatest in intensively managed agricultural landscapes,          Ahnstr€ om and Weibull (2005), we used the same keywords in ISI
while Tscharntke et al. (2005) argued that agrienviron-              web of knowledge: biodiversity, biological diversity, conventional
ment schemes would have larger effects in simple than in             farming (agriculture) and organic farming (agriculture). We
complex landscapes. Some of these predictions have been              searched for additional studies by scanning the bibliographies in

© 2013 The Authors. Journal of Applied Ecology published by John Wiley & Sons Ltd on behalf of British Ecological Society., Journal of
Applied Ecology, 51, 746–755
748 S. L. Tuck et al.
publications identified from our search. We followed the relevant pastures), mixed crops (comparison made across several different
literature and discussed with colleagues throughout. Our data set crops), orchards, vegetable crops and miscellaneous (i.e. not spec-
contains results from technical reports as well as peer-reviewed ified precisely in the original study). Many studies include multi-
journals. Although it is unlikely that the data we present are ple records for different organism groups or crop types on the
complete, we believe these studies are an extensive and represen- same farm. These were treated as distinct within-study observa-
tative sample. tions and used to calculate separate effect sizes for subgroups. As
For a publication to be included in the analysis, it had to pro- a result, our data set of 94 studies was subdivided into 184 obser-
vide species richness data (n > 1) in both organic and conven- vations (see Statistical analysis for more details).
tional systems. This could be in the form of raw data or the
mean species richness, standard deviation and sample size in both
LAND-USE INTENSITY METRICS
farming systems. In some cases, we used other richness data pro-
vided in the publications – for example, Shannon H’ (M€ader Three metrics of land-use intensity were collected using Google
et al. 2002; Martınez-Sanchez 2008) or richness of taxa higher Earth (2013). We conducted new landscape analyses for all
than species level (e.g. Galvan et al. 2009; Crowder et al. 2010). included studies in order to provide continuous standardized
Unfortunately, many of the published studies do not meet these measures of land-use intensity and complexity. We distinguished
criteria and therefore did not provide sufficient data to be useful between different land-use types: field (annual and perennial
in a meta-analysis (see Appendix S2, Table S3 Supporting infor- crops, ley, grazed ley), pasture (perennial grassland used for graz-
mation). ing), forest (including clear-cuts), wetland, water, rural, urban
Organic agriculture is normally defined as any farming system and permanent line elements (e.g. ditches, hedge rows, roads
where the use of pesticides, herbicides and synthetic fertilizers is etc.). Using these land cover classifications, we calculated (i) %
prohibited or strictly limited. Organic farms often have other dif- arable fields – the proportion of the landscape covered by arable
ferences, for example they tend to use more complex crop rota- fields; (ii) number of habitats – the number of distinguishable
tions as a weed- and pest-control strategy and use animal habitats found in the landscape; and (iii) average field size – the
manure, green manure or compost in place of synthetic fertilizers. average size of arable fields in the landscape. The percentage of
Conventional systems, however, use pesticides and inorganic fer- arable fields is a measure of land-use intensity, while the number
tilizers to various degrees and often use simplified crop rotations of habitats represents landscape complexity. However, an inten-
and fewer crops. Due to the broad range of farming systems that sively farmed region is likely to include fewer habitats than a
can be grouped within organic and conventional definitions, the more extensively farmed area. The average field size may reflect
two farming systems are likely to differ between and within stud- the overall extent of farming on the landscape but, depending on
ies. However, despite these potential differences, we did not fur- local farming practices, not necessarily farming intensity.
ther subdivide farming systems to avoid using more than two To calculate the three metrics, we first identified a standardized
treatments in the meta-analysis. sampling space at each location based on descriptions in the ori-
For each effect size, we extracted taxonomic and functional ginal publications. Where coordinates were not provided, we
data on the study organism(s). We also recorded (i) the sampling identified an area that we were confident, included the study area
unit of the species richness data (e.g. numbers per trap or tran- based on descriptions in the text. We then identified a central
sect), (ii) the sampling scale (plot, field or farm) and (iii) the crop measuring point, making sure it was placed in a landscape with
type. Data on species richness were extracted from the text, tables agricultural fields, and the radius (in metres) defining the appro-
or figures in publications using the program GETDATA GRAPH DIGI- priate area for sampling around this point. If no information
TIZER 2.25 (Fedorov 2013) when necessary. Other measures of about the area of the study region was available, we visually
variation presented in publications were converted to standard examined the Google Map image and set the radius so that the
deviations. included landscape was representative of its complexity (and simi-
The information on taxonomic groups was used to create cate- lar to the landscape closest to the central point). We then ran-
gorical covariates for different higher taxonomic units and eco- domly placed five 1-km transects within this study region. The
logical functions. For taxonomic groups, we classified species as: positions of the five transects were defined by sets of three ran-
arthropods, birds, microbes and plants. Data on earthworms, domly generated numbers. The first number, randomly selected
mammals, nematodes and protozoa were excluded from this between 0 (central measuring point) and the radius of the study
analysis due to small sample sizes (n < 5). For functional groups, region, denoted how many metres from the central point the
we classified species as producers (plants), herbivores, pollinators starting point of each transect would be situated. The second
(as adults), predators, soil-living decomposers and others (includ- number specified the angle (degrees), defining the direction rela-
ing omnivores and organisms with variable or unknown func- tive to the central point for which the start point of the transect
tional characteristics). The functional classification is based on should be placed. Combined, these two random numbers created
the idea that different organism groups may contribute to differ- a bearing, from the centre of the study region, that defined the
ent ecosystem services. We acknowledge that considerable uncer- transect location. The final number would randomly select
tainty about ecological function exists for several groups: carabid between 0, 45, 90, and 180 degrees to specify the angle at which
beetles, for example, are often considered to provide pest control the transect should be drawn, 500 m to each side of the start
€
(Ostman, Ekbom & Bengtsson 2001, 2003), but many species are point. Transects were not allowed to cross. Our measures of land-
known to be at least partly herbivorous seed eaters (Jonason scape complexity and land-use intensity were calculated for each
et al. 2013). transect, extracted directly from Google Earth and input to our
We also separated the data according to crop type. Given the data base and averaged to give mean values of each metric for
data, we were able to identify the following crop types: cereals, each study or substudy region. The transects sampled were line
grassland (usually permanent or semi-permanent leys or transects with no surrounding buffer.
© 2013 The Authors. Journal of Applied Ecology published by John Wiley & Sons Ltd on behalf of British Ecological Society., Journal of
Applied Ecology, 51, 746–755Hierarchical meta-analysis of organic farming 749
In some cases, several studies had been conducted in the same study-specific random deviations, as parameterized by s2 (Stevens
area, in which case the same landscape data were used. When & Taylor 2009). Defining dependence groups meant that a large
publications that garnered multiple observations had been con- group of within-study effect sizes with extreme effect sizes was
ducted in multiple regions, and data specified per region, we col- down-weighted, preventing them from having a dominant effect
lected landscape data per region. If the study region was not on the overall result. By incorporating this hierarchical variance
specified at all – but only the country – we used the mean values structure, we could disentangle important differences between
of all other studies in that country. The Google Maps analysed organisms and crop types without assuming independence of
were always the most recent images available. This represents one observations.
caveat in our landscape analysis: for older studies, there is a time The potential for bias in published results in the literature to
lag between the date the study was conducted and the date our skew synthesized results is seen as a common limitation for meta-
landscape data were collected. Many of the early studies were analyses (Borenstein et al. 2009; Gillman & Wright 2010). There
conducted in Europe, a region that we would expect to show the are two ways that bias could be introduced: (i) a tendency for
least landscape change (in agricultural areas) over the relevant only ‘significantly positive’ results to be published – the ‘file
time span. drawer problem’ or (ii) studies are not representative of the popu-
lation – that is, there are evidence gaps in the literature, where
the question has not been investigated in certain contexts. A sim-
STATISTICAL ANALYSIS ple ecological example would be a lack of studies representing a
Our effect size is the log response ratio, which quantifies the pro- system relative to its global importance; this is a bias produced
portional difference between mean species richness in conven- by consensus in the literature that is not founded on a representa-
tional and organic farming (Hedges, Gurevitch & Curtis 1999). tive sample of reality. Meta-analysis can provide a general quan-
On the log scale, an effect size of 0 means no difference and a titative synthesis. It should also describe bias in the literature and
positive value means that the organic farm has higher species indicate where that bias may lie. We investigated bias in both the
richness than the conventional farm. The log response ratio dis- forms described above.
plays bias at small sample sizes, when the normal approximation To investigate bias in the ‘file drawer’ context, we characterized
to the distribution of the effect size deviates from the exact distri- funnel plot asymmetry in the data. The funnel plot is based on
bution. To assess the appropriateness of this approximation, the assumption that studies with smaller sample sizes (and hence
√n∙l/r for both mean values within each effect size should be higher sampling variance) are more likely to be skewed, because
generally >3 (Hedges, Gurevitch & Curtis 1999). In our data set, they have lower statistical power; hence, negative and low-effect
only 10% of effect sizes fall below 3, while ~71% of scores exceed results from small-sample studies are missing from the literature.
6, and hence, the log response ratio is appropriate. To produce a funnel plot from our hierarchical model, we plotted
Our analysis was carried out using R 3.0.1 (R Development the residuals against precision (inverse sampling standard error;
Core Team 2013) with the R package metahdep (Stevens & Taylor Nakagawa & Santos 2012). In combination with this funnel plot,
2009). The models were fitted to the data using the function we conducted a trim and fill assessment, whereby it is assumed
metahdep.HBLM. We analysed 184 separate observations for sub- that skew is due to publication bias and compensates for this by
groups within studies – that is, different taxonomic groups or ‘filling in’ new effect sizes until the skew in the residuals is cor-
crop types. A random effect was used to account for differences rected for. To investigate this further, we conducted a cumulative
across studies, for example, among farming systems included meta-analysis – in which studies are progressively added to the
within organic and conventional groups. A grand mean effect data set in the order of increasing sampling variance – which
size, across subgroups, was calculated using an intercept model qualitatively shows how quickly the overall mean stabilizes and
(Borenstein et al. 2009). Variables of interest, selected a priori, whether the final estimate is strongly affected by the less reliable
were included in a metaregression to see whether they explained studies. We also estimated the slope of the relationship between
any differences in biodiversity on organic vs. conventional farms. sampling variance and effect size. Combining these diagnostics
These variables were functional groups, taxonomic groups, the allowed us to explore asymmetry in the data and then, under the
three landscape measures (see Land-use intensity metrics), crop assumption that this is due to publication bias, assess its impact
types and scale of sampling (plot, field, or farm). Uncertainty in on our result. The cumulative meta-analysis approach was used
the regression coefficients was quantified using 95% credible to assess change in the overall effect size over time by progres-
intervals. Credible intervals were calculated by multiplying the sively adding studies in order of publication year, and again by
posterior standard error of the coefficients by the 95% point of a estimating the slope of the relationship between publication year
t-distribution with N–p degrees of freedom. We estimated hetero- and effect size. To investigate ‘evidence gap’ bias, we compared
geneity between effect sizes, s2. This estimates the proportion of our data set with global data on the area of organic farming
between-studies variance that is true variance, as opposed to across the globe and for different crop types, collected from the
within-study sampling error. This heterogeneity measure was used FAO website [Food & Agriculture Organization of the United
to estimate I2, the proportion of total variance that is due to true Nations (FAOSTAT) 2013]. We used this comparison to discuss
heterogeneity among effect sizes (Higgins & Thompson 2002). how representative the current literature is of global organic
farming trends.
There is hierarchical dependence between multiple observations
within studies. Having several effect sizes obtained from the same
publication violates the assumption that effect sizes are indepen- Results
dent. A publication-level random effect allowed us to account for
the dependency of multiple within-study observations. The non- The overall mean log response ratio was 0296 (95% CI:
independence among effect sizes gathered from the same publica- 0231–0361); this indicates that species richness on
tion was defined by specifying a covariance structure in the organic farms is on average 34% (95% CI: 26–43) higher
© 2013 The Authors. Journal of Applied Ecology published by John Wiley & Sons Ltd on behalf of British Ecological Society., Journal of
Applied Ecology, 51, 746–755750 S. L. Tuck et al.
than conventional. The estimated standard deviation of microbes also showed a substantial positive effect. Disag-
the true effect sizes, s, was 0304 (variance for gregating organisms into functional groups showed a vari-
s = 00004). This true variance among effect sizes com- ety of responses: among functional groups, the largest
prised an overwhelming proportion of total variance effect size was found for pollinators while decomposers
(I2 = 974%). These results reveal substantial heterogene- showed little effect (Fig. 1a). The crop types showed vary-
ity among effect sizes, although many studies showed a ing responses, with large positive effect sizes in cereals
large positive effect of organic farming on biodiversity rel- and mixed farming, and moderate positive effect sizes for
ative to conventional farming. The estimate for hierarchi- all others (Fig. 1c).
cal dependence was positive, meaning that the covariance The percentage arable fields had a positive effect on
among within-publication effect sizes will downweight the magnitude of the effect size (slope log(RR) = 0442,
large groups of effect sizes that would otherwise have an 95% CI: 0089 to 0973; Fig. 2). To assess the sensitiv-
excessive effect on the overall result. ity of this slope estimate to the largest (‘outlying’) effect
We found large differences in the effect of organic sizes, we removed the four data points with log(RR) >2
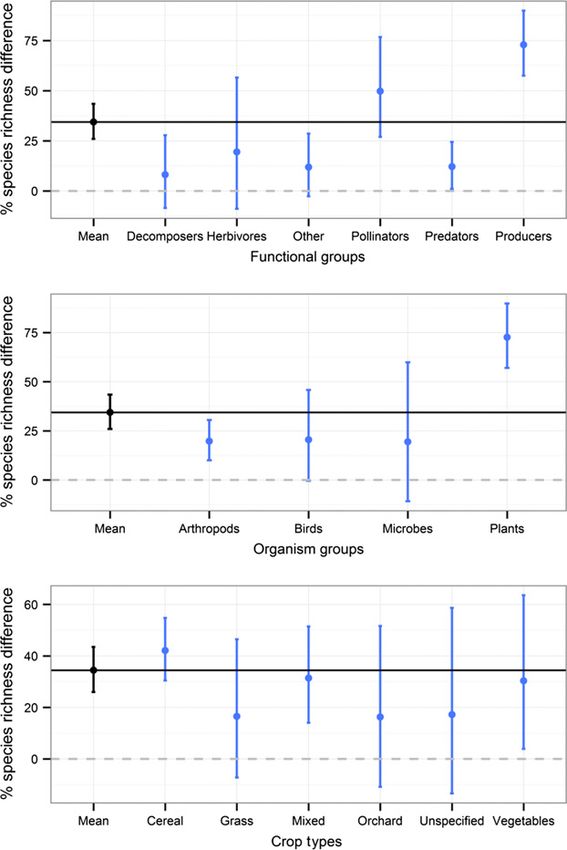
farming on different taxonomic and functional groups and reperformed the analysis; there was a small reduc-
(Fig. 1a,b; Table S2, Supporting information). For exam- tion in the slope estimate (0396). Other landscape met-
ple, among taxonomic groups, plants benefited the most rics had slope estimates close to zero (number of habitats:
from organic farming (Fig. 1b). Arthropods, birds and log(RR) = 0006, 95% CI: 0019 to 0031; average field
size: log(RR) = 0001, 95% CI: 0001 to 0002). When
the percentage of arable fields was fitted as an interac-
(a) tion with functional group, there was substantial hetero-
geneity in the resulting slopes. However, there was
significant uncertainty in these estimates, possibly due to
small sample sizes within some functional groups; thus,
we choose to report this result qualitatively: increasing
landscape intensity affected the magnitude of the effect
size in the order: herbivores > ‘other’ > predators > pro-
ducers > decomposers > pollinators. The sampling scale
of species richness observation did not appreciably
(b)
change the effect size (farm = 0249, 95% CI: 0161 –
0338; treatment contrasts with farm scale: field = 0139,
95% CI: 0002 to 0279; plot = 0017, 95% CI:
0222 to 0187).
The representation of different crop types in the meta-
analysis was comparable with the global FAO statistics;
there were similar proportions of cereals, vegetables and
(c)
Fig. 1. The difference in species richness (%) on organic farms,
relative to conventional, classified: (a) by functional group (n:
decomposers = 19, herbivores = 6, other = 27, pollinators = 21,
predators = 49, producers = 62), (b) by organism group (n: ar-
thropods = 89, birds = 17, microbes = 6, plants = 62) and (c) by
crop types (n: cereals = 100, grasses = 13, mixed = 40,
orchard = 9, unspecified = 6, vegetables = 16). The grand mean is
shown in black, accompanied by the black line. The dashed lines Fig. 2. The relationship between the effect size and the propor-
show the zero line. 95% credible intervals are calculated from tion of the landscape covered by arable fields showing a regres-
posterior standard errors. sion slope with 95% confidence intervals.
© 2013 The Authors. Journal of Applied Ecology published by John Wiley & Sons Ltd on behalf of British Ecological Society., Journal of
Applied Ecology, 51, 746–755Hierarchical meta-analysis of organic farming 751
orchards (fruit; Fig. 3a), although fibre and oil crops were time was supported by a slope estimate close to zero
underrepresented. The geographical representation in our (0003, 95% CI: 0007 to 0013).
data set, however, showed much less congruence
(Fig. 3b): Western and Northern Europe, and to some
Discussion
degree North America, were highly overrepresented, while
studies were largely lacking from most other geographical Our updated meta-analysis shows that organic farming on
regions, especially Asia, Africa and Australia. average increases biodiversity (measured as species rich-
The funnel plot (Fig. 4a) showed some positive bias. A ness) by about one-third relative to conventional farming.
trim and fill assessment of how publication bias could This result has been robust over the last 30 years of pub-
impact our inference, after correcting for positive funnel lished studies and shows no sign of diminishing. Organic
plot skew, produced a negligible reduction in the effect farming is therefore a tried and tested method for increas-
size ( 00001, three studies added). This suggests that, if ing biodiversity on farmlands and may help to reverse the
publication bias is evident, the reported effect size is continued declines of formerly common species in devel-
robust to its impact. Investigating further, the cumulative oped nations (Burns et al. 2013). Similar results have been
meta-analysis of effect sizes sorted by sampling variance previously obtained (Bengtsson, Ahnstr€ om & Weibull
showed that less reliable studies caused the grand mean to 2005; Fuller et al. 2005; Hole et al. 2005; Bat ary et al.
increase, but not drastically so (Fig. 4b). If we assume 2011; Garratt, Wright & Leather 2011), but our study is
that this was due to publication bias then the most con- the most up to date, deals with the hierarchical structure
servative effect size estimate is 0190 (95% CI: 0135– of multiple within-publication effect sizes and includes
0246), which still corresponds to a >20% increased spe- standardized measures of land-use intensity and heteroge-
cies richness on organic farms. This was the minimum neity across all studies.
value obtained from the cumulative plot and was reached In other areas of biology and medicine, it has been
after c. 80 observations (out of 184) were included. This noted that, with the addition of further evidence, effect
reduced effect size did not greatly alter our interpretation sizes concerning a particular question often decrease over
of the magnitude of organic farming’s positive effect on time (Jennions & Møller 2002). This is thought to occur
biodiversity. The relationship between sampling variance because of initial publication bias against non-significant
and the effect size had a positive slope (0022, 95% CI: or negative results that is eventually corrected. The effect
0056 to 0101), which confirms the positive association size in our new study is slightly lower than the one
seen in Fig. 4. reported in Bengtsson, Ahnstr€ om and Weibull (2005);
The cumulative meta-analysis plot for data sorted by however, our analysis reveals that the grand mean effect
publication date (Fig. 4c) showed that the grand mean size is robust over time (Fig. 4c). There is therefore no
effect size estimated from our model was robust over sign of a dwindling effect size with the addition of further
time, although, interestingly, many of the earliest studies evidence. This implies that the increase in diversity with
reported very high effect sizes. The lack of change with organic farming that we report here is robust, given the
Meta-analysis data FAO data
Cereal Cereal
Veg
Veg
Grass
Fruit
Orchard Pulses
Mixed Misc. Oil crops
Fibre crops
S America C America
N Europe C America S America
Fig. 3. Top row: proportions of different N America
crop types present in the meta-analysis N America Asia
data set compared with the frequency of S Europe N Europe
the most commonly grown organic crops
Africa
world-wide. Bottom row: geographical ori- NZ-Australia S Europe
gin of studies in the meta-analysis data set
compared with the area under organic pro-
duction in different regions of the world.
WC Europe NZ-Australia
FAO data obtained from their website
(FAOSTAT 2013). WC Europe
© 2013 The Authors. Journal of Applied Ecology published by John Wiley & Sons Ltd on behalf of British Ecological Society., Journal of
Applied Ecology, 51, 746–755752 S. L. Tuck et al.
(a)
between organic and conventional farming generally
increased with increasing proportion of arable fields,
although there was large variation around the estimated
slope. Some of this variance may be due to different
responses between functional groups (Bat ary et al. 2011).
The slope of this relationship decreased in the order:
decomposers > ‘other’ > predators > herbivores > produc-
ers > pollinators, suggesting that the effect of organic
farming on predators is greater in intensively managed
landscapes, whereas the effect of organic farming on
pollinators does not increase much with land-use inten-
sity. These differences may be due to the importance of
(b) (c)
local actions relative to regional actions and to the move-
ment of organisms and chemicals across the landscape.
For example, some pollinators are known to be sensitive
to certain pesticides (Goulson 2013), leading to an EU
moratorium on neonicotinoids. If an organic farmer
refrains from using pesticides, then local pollinator rich-
Sample size (cumulative total)
ness might increase; however, given that these chemicals
might drift substantially, and that pollinators on an
organic farm will likely visit neighbouring farms, the
Sampling variance
impact of this local action might have no more effect in
Publication date
an intensively managed landscape compared with an
extensive one.
ORGANISM GROUPS, CROP TYPES AND SPATIAL
SCALE
We expected that the magnitude of the positive effect of
organic farming would vary among organism groups, as
this has been found repeatedly (Bengtsson, Ahnstr€ om &
Weibull 2005; Fuller et al. 2005; Batary et al. 2011; Garr-
att, Wright & Leather 2011; Winqvist et al. 2011; Winqvist,
Effect size (log response ratio) Effect size (log response ratio) Ahnstr€ om & Bengtsson 2012). As in previous studies, we
found that plants benefited most from organic farming,
Fig. 4. (a) Funnel plot showing asymmetry in the spread of resid-
probably because of restricted herbicide use (Roschewitz
uals around the mean, created using the R package meta (Schwar-
zer 2010). The dashed line shows 95% confidence limits. (b) et al. 2005; Rundl€of, Edlund & Smith 2010). Arthropods,
Cumulative meta-analysis forest plot of data sorted by increasing birds and microbes also benefited, with varying levels of
sampling variance. (c) Cumulative meta-analysis forest plot of estimated confidence. Accordingly, most functional groups
data sorted by increasing publication date. – herbivores, pollinators, predators and producers – were
more diverse in organic farming, with the exception of
choice of crops and study areas included (see below for a decomposers. The lack of positive effects on decomposers,
discussion of the representativeness of our study). which are mostly soil fauna, is surprising given that there
are positive effects of organic farming on soil conditions
and soil carbon (M€ ader et al. 2002; Gattinger et al. 2012).
LAND-USE INTENSITY EFFECTS
This may be because variation in soil type and structure is
Many authors have speculated on and investigated the more important for soil organisms than the farming system
importance of landscape characteristics in shaping the itself. Such interactions between factors influencing the
likely effect of organic farming on biodiversity (Bengts- diversity and abundance of soil organisms would repay
son, Ahnstr€ om & Weibull 2005; Rundl€ of & Smith 2006; more investigation. The strong positive effects of organic
Rundl€ of, Bengtsson & Smith 2008; Rundl€ of, Nilsson & farming on herbivores and pollinators are consistent with
Smith 2008; Batary et al. 2011). Here, we calculated other studies (Rundl€of & Smith 2006; Holzschuh, Steffan-
three standardized measures of land-use intensity and Dewenter & Tscharntke 2008; Rundl€ of, Bengtsson & Smith
heterogeneity for all studies: the proportion of arable 2008; Garratt, Wright & Leather 2011).
fields, the typical field size and the number of habitats. We found significant differences in the effect of organic
Only the proportion of arable fields in the landscape had farming among crop types. In cereal fields, which com-
any significant overall effect. The difference in diversity prised >50% of the studies, organic farming had large
© 2013 The Authors. Journal of Applied Ecology published by John Wiley & Sons Ltd on behalf of British Ecological Society., Journal of
Applied Ecology, 51, 746–755Hierarchical meta-analysis of organic farming 753
effects, significantly higher than in vegetable crops and these products being widely available in European super-
orchards (Fig. 1c). This might reflect the intensive man- markets. Mediterranean climates are also underrepre-
agement of conventional cereal crops, with repeated appli- sented, although a few studies from California
cations of inorganic fertilizers and fungicides. The effect (Drinkwater et al. 1995; Letourneau & Bothwell 2008;
size in both vegetable crops and orchards, although posi- Kremen, Iles & Bacon 2012) and South Africa (Kehinde
tive, did not differ significantly from zero, but this could & Samways 2012) exist.
be due to small sample sizes. A lower but still significant
effect was found in grasslands (pastures and permanent or
THE ORGANIC CONTROVERSY
semi-permanent leys), which are generally not so inten-
sively managed. The number of studies in grasslands, veg- The yields from organic farms are generally lower than
etables and orchards was quite low, and we recommend conventional yields, although some controversy exists con-
that these crops are given more attention in the future. cerning the size of this effect and whether it is more
In a previous meta-analysis (Bengtsson, Ahnstr€ om & prominent in developed countries (Badgley et al. 2007; De
Weibull 2005), small-scale studies (on the plot or single Ponti, Rijk & van Ittersum 2012; Dobermann 2012; Rega-
field scale) showed much larger effect sizes than studies nold 2012; Seufert, Ramankutty & Foley 2012). As out-
on larger spatial scales. However, we found negligible dif- lined in the introduction, this implies a potential trade-off
ferences across scales. This suggests that the general bene- between biodiversity and crop yields. For example, Gab-
fit of organic farming is robust across sampling scales, in riel et al. (2013) in a study of cereal crops in Southern
contrast to recent work that suggests that this benefit England concluded that the benefits of organic farming to
diminishes at larger scales (Gabriel et al. 2010; Crowder biodiversity were entirely bought at the cost of reduced
et al. 2012). The previous meta-analysis result may have yield. They further suggested that the lower yields of
been due to small sample size or publication bias, which organic farming may therefore have the unfortunate result
highlights the importance of updating meta-analyses with of increasing the total area of land under agricultural pro-
additional evidence. We note that most of the recent stud- duction. However, there are other, often unmeasured,
ies have been conducted at the farm scale, which is the potential positive environmental benefits of organic farm-
most relevant scale for evaluating both organic farming as ing. For example, nitrogen and phosphorus pollution
an agrienvironmental scheme for biodiversity, and for the caused by leaching from intensively managed fields is still
sustainability of farming systems in general. a major problem in many countries and incurs significant
costs to society (Heathwaite, Sharpley & Gburek 2000).
An overall evaluation of organic farming in relation to
PUBLICATION BIAS
crop yields therefore needs to account for the effects of
The funnel plot suggests a positively biased spread of farming practice on a wider range of environmental fac-
effect sizes (Fig. 4a), which could be interpreted as a ten- tors (Mondelaers, Aertsens & Huylenbroeck 2009; Sand-
dency for studies showing large positive effects of conven- hu, Wratten & Cullen 2010; Gattinger et al. 2012;
tional farming on biodiversity to remain unpublished. Bommarco, Kleijn & Potts 2013).
However, an alternative interpretation may be that large
positive effects of organic farming occur occasionally,
SYNTHESIS AND RECOMMENDATIONS
while large positive effects of conventional farming are
exceptionally unlikely. This seems reasonable given the This analysis affirms that organic farming usually has
nonlinear nature of many natural processes, for example large positive effects on average species richness compared
population growth, which could occasionally fuel very with conventional farming. Given the large areas of land
large impacts of not controlling certain groups of organ- currently under agricultural production, organic methods
isms. In any case, the positive bias is slight and has been could undoubtedly play a major role in halting the contin-
shown to not affect our result. ued loss of diversity from industrialized nations. The
Previous studies of organic farming on biodiversity effect of organic farming varied with the organism group
have been strongly biased towards temperate Western and and crop studied, and with the proportion of arable land
Northern Europe and North America (Fig. 3), that is, in the surrounding landscape. We found larger effects in
intensive farming systems in developed countries. There is cereals, among plants and pollinators, and in landscapes
extremely limited data available from other areas of the with higher land-use intensity. Despite the fact that
world, for example, Eastern Europe, Asia, Africa, Central organic farming has been suggested to have large effects
and Southern America, a bias also noted by Bat ary et al. on soil conditions, its effects on soil organisms were
(2011), Martin, Blossey and Ellis (2012), and Randall and ambiguous and in general understudied. Finally, it is clear
James (2012). We therefore recommend that studies of that three decades of studying the effects of organic farm-
organic farming practices on diversity in tropical and sub- ing on biodiversity have been heavily biased towards agri-
tropical areas (e.g. Deb 2009; Zhang et al. 2013) should cultural systems in the developed world, especially Europe
receive high priority. It is, for example, surprising that and North America. We therefore recommend that other
there are no studies on organic bananas or cacao, despite regions and agricultural systems are given much greater
© 2013 The Authors. Journal of Applied Ecology published by John Wiley & Sons Ltd on behalf of British Ecological Society., Journal of
Applied Ecology, 51, 746–755754 S. L. Tuck et al.
attention. In particular, more studies are needed in tropi- De Ponti, T., Rijk, B. & van Ittersum, M.K. (2012) The crop yield gap
between organic and conventional agriculture. Agricultural Systems,
cal, subtropical and Mediterranean climates. Studies at
108, 1–9.
any scale would be beneficial: at the farm scale because Deb, D. (2009) Biodiversity and complexity of rice farm ecosystems: an
this is the economic unit of farming, and at the landscape empirical assessment. Open Ecology Journal, 2, 112–129.
Diek€otter, T., Wamser, S., Wolters, V. & Birkhofer, K. (2010) Landscape
scale because this is the scale at which many organisms
and management effects on structure and function of soil arthropod
respond. This would allow a more balanced and globally communities in winter wheat. Agriculture, Ecosystems & Environment,
relevant assessment of organic farming effects on biodi- 137, 108–112.
Dobermann, A. (2012) Getting back to the field. Nature, 485, 176–177.
versity, ecosystem services, food production and agricul-
Drinkwater, L.E., Letourneau, D.K., Workneh, F., van Bruggen, A.H.C.
tural sustainability. & Shennan, C. (1995) Fundamental differences between conventional
and organic tomato agroecosystems in California. Ecological Applica-
tions, 5, 1098.
Acknowledgements Fedorov, S. (2013) GetData Graph Digitizer, v2.25. Moscow, Russia.
http://getdata-graph-digitizer.com/
We thank authors who performed the reviewed studies (see Appendix S1 Fischer, J., Brosi, B., Daily, G.C., Ehrlich, P.R., Goldman, R., Goldstein,
Supporting information) and who corresponded with us during data col- J. et al. (2008) Should agricultural policies encourage land sparing or
lection, and FAO for the publication of their data. We also thank Peter wildlife-friendly farming? Frontiers in Ecology and the Environment, 6,
Batary and one anonymous reviewer for constructive feedback, and John 380–385.
Stevens for help with calculating residuals. The work was funded by the Fischer, C., Flohre, A., Clement, L.W., Batary, P., Weisser, W.W.,
Swedish Research Council FORMAS and the Ekhaga Foundation. SLT Tscharntke, T. & Thies, C. (2011) Mixed effects of landscape structure
was supported by UK Natural Environment Research Council. and farming practice on bird diversity. Agriculture, Ecosystems & Envi-
ronment, 141, 119–125.
Flohre, A., Rudnick, M., Traser, G., Tscharntke, T. & Eggers, T. (2011)
Does soil biota benefit from organic farming in complex vs. simple land-
Author contributions
scapes? Agriculture, Ecosystems & Environment, 141, 210–214.
Food and Agriculture Organization of the United Nations (FAOSTAT).
SLT, JB and LAT designed the analyses and drafted the
(2013) http://faostat3.fao.org/home/index.html#DOWNLOAD.
paper; SLT performed the analyses; JA, CW and FM col- Fuller, R.J., Norton, L.R., Feber, R.E., Johnson, P.J., Chamberlain, D.E.,
lected the data. The original idea for the study emerged Joys, A.C. et al. (2005) Benefits of organic farming to biodiversity vary
among taxa. Biology Letters, 1, 431–434.
from discussions between JB, LAT, JA, FM and CW.
Gabriel, D., Sait, S.M., Hodgson, J.A., Schmutz, U., Kunin, W.E. & Ben-
ton, T.G. (2010) Scale matters: the impact of organic farming on biodi-
versity at different spatial scales. Ecology Letters, 13, 858–869.
Data accessibility Gabriel, D., Sait, S.M., Kunin, W.E. & Benton, T.G. (2013) Food produc-
tion vs. biodiversity: comparing organic and conventional agriculture.
Meta-analysis data and R script: DRYAD entry doi: Journal of Applied Ecology, 50, 355–364.
105061/dryad.609t7 (Tuck et al. 2014). FAO statistics on Galvan, G.A., Paradi, I., Burger, K., Baar, J., Kuyper, T.W., Scholten,
O.E. & Kik, C. (2009) Molecular diversity of arbuscular mycorrhizal
organic farming coverage: FAOSTAT (2013).
fungi in onion roots from organic and conventional farming systems in
the Netherlands. Mycorrhiza, 19, 317–328.
Garratt, M.P.D., Wright, D.J. & Leather, S.R. (2011) The effects of farm-
References ing system and fertilisers on pests and natural enemies: a synthesis of
current research. Agriculture, Ecosystems & Environment, 141, 261–270.
Badgley, C., Moghtader, J., Quintero, E., Zakem, E., Chappell, M.J.,
Gattinger, A., Muller, A., Haeni, M., Skinner, C., Fliessbach, A., Buch-
Aviles-V azquez, K., Samulon, A. & Perfecto, I. (2007) Organic agricul-
mann, N. et al. (2012) Enhanced top soil carbon stocks under organic
ture and the global food supply. Renewable Agriculture and Food Sys-
farming. Proceedings of the National Academy of Sciences, 109, 18226–
tems, 22, 86–108.
18231.
Batary, P., Baldi, A., Kleijn, D. & Tscharntke, T. (2011) Landscape-mod-
Gillman, L.N. & Wright, S.D. (2010) Mega mistakes in meta-analyses:
erated biodiversity effects of agri-environmental management: a
devil in the detail. Ecology, 91, 2550–2552.
meta-analysis. Proceedings of the Royal Society B: Biological Sciences,
Google Earth. (2013) http://www.google.co.uk/intl/en_uk/earth/.
278, 1894–1902.
Goulson, D. (2013) An overview of the environmental risks posed by neo-
Bengtsson, J., Ahnstr€ om, J. & Weibull, A.-C. (2005) The effects of organic
nicotinoid insecticides. Journal of Applied Ecology, 50, 977–987.
agriculture on biodiversity and abundance: a meta-analysis. Journal of
Green, R.E., Cornell, S.J., Scharlemann, J.P.W. & Balmford, A. (2005)
Applied Ecology, 42, 261–269.
Farming and the fate of wild nature. Science, 307, 550–555.
Bommarco, R., Kleijn, D. & Potts, S.G. (2013) Ecological intensification:
Heathwaite, L., Sharpley, A. & Gburek, W. (2000) A conceptual approach
harnessing ecosystem services for food security. Trends in Ecology &
for integrating phosphorus and nitrogen management at watershed
Evolution, 28, 230–238.
scales. Journal of Environmental Quality, 29, 158–166.
Borenstein, M., Hedges, L.V., Higgins, J.P.T. & Rothstein, H.R. (2009)
Hedges, L.V., Gurevitch, J. & Curtis, P.S. (1999) The meta-analysis of
Introduction to Meta-Analysis. John Wiley & Sons, Ltd, Chichester, UK.
response ratios in experimental ecology. Ecology, 80, 1150–1156.
Brittain, C., Bommarco, R., Vighi, M., Settele, J. & Potts, S.G. (2010)
Higgins, J.P.T. & Thompson, S.G. (2002) Quantifying heterogeneity in a
Organic farming in isolated landscapes does not benefit flower-visiting
meta-analysis. Statistics in Medicine, 21, 1539–1558.
insects and pollination. Biological Conservation, 143, 1860–1867.
Hodgson, J.A., Kunin, W.E., Thomas, C.D., Benton, T.G. & Gabriel, D.
Burns, F., Eaton, M.A., Gregory, R.D., Al Fulaij, N., August, T.A., Biggs,
(2010) Comparing organic farming and land sparing: optimizing yield
J. et al. (2013) State of nature report. The State of Nature partnership.
and butterfly populations at a landscape scale. Ecology Letters, 13,
Chamberlain, D.E., Fuller, R.J., Bunce, R.G.H., Duckworth, J.C. &
1358–1367.
Shrubb, M. (2000) Changes in the abundance of farmland birds in rela-
Hole, D.G., Perkins, A.J., Wilson, J.D., Alexander, I.H., Grice, P.V. &
tion to the timing of agricultural intensification in England and Wales.
Evans, A.D. (2005) Does organic farming benefit biodiversity? Biological
Journal of Applied Ecology, 37, 771–788.
Conservation, 122, 113–130.
Crowder, D.W., Northfield, T.D., Strand, M.R. & Snyder, W.E. (2010)
Holzschuh, A., Steffan-Dewenter, I. & Tscharntke, T. (2008) Agricultural
Organic agriculture promotes evenness and natural pest control. Nature,
landscapes with organic crops support higher pollinator diversity. Oikos,
466, 109–112.
117, 354–361.
Crowder, D.W., Northfield, T.D., Gomulkiewicz, R. & Snyder, W.E.
Jennions, M.D. & Møller, A.P. (2002) Relationships fade with time: a
(2012) Conserving and promoting evenness: organic farming and fire--
meta-analysis of temporal trends in publication in ecology and evolu-
based wildland management as case studies. Ecology, 93, 2001–2007.
© 2013 The Authors. Journal of Applied Ecology published by John Wiley & Sons Ltd on behalf of British Ecological Society., Journal of
Applied Ecology, 51, 746–755Hierarchical meta-analysis of organic farming 755
tion. Proceedings of the Royal Society of London Series B: Biological Sandhu, H.S., Wratten, S.D. & Cullen, R. (2010) Organic agriculture and
Sciences, 269, 43–48. ecosystem services. Environmental Science & Policy, 13, 1–7.
Jonason, D., Smith, H.G., Bengtsson, J. & Birkhofer, K. (2013) Landscape Schwarzer, G. (2010) Meta-analysis with R: package ‘meta’. R Package
simplification promotes weed seed predation by carabid beetles (Coleop- Version 3.0-1 edn. http://cran.r-project.org/web/packages/meta/index.
tera: Carabidae). Landscape Ecology, 28, 487–494. html
Kehinde, T. & Samways, M.J. (2012) Endemic pollinator response to Seufert, V., Ramankutty, N. & Foley, J.A. (2012) Comparing the yields of
organic vs. conventional farming and landscape context in the Cape organic and conventional agriculture. Nature, 485, 229–232.
Floristic Region biodiversity hotspot. Agriculture, Ecosystems & Envi- Stevens, J.R. & Taylor, A.M. (2009) Hierarchical dependence in
ronment, 146, 162–167. meta-analysis. Journal of Educational and Behavioral Statistics, 34,
Kremen, C., Iles, A. & Bacon, C. (2012) Diversified farming systems: an 46–73.
agroecological, systems-based alternative to modern industrial agricul- Tscharntke, T., Klein, A.M., Kruess, A., Steffan-Dewenter, I. & Thies, C.
ture. Ecology and Society, 17, 44. (2005) Landscape perspectives on agricultural Intensification and biodi-
Letourneau, D.K. & Bothwell, S.G. (2008) Comparison of organic and versity – ecosystem service management. Ecology Letters, 8, 857–874.
conventional farms: challenging ecologists to make biodiversity func- Tscharntke, T., Clough, Y., Wanger, T.C., Jackson, L., Motzke, I., Per-
tional. Frontiers in Ecology and the Environment, 6, 430–438. fecto, I., Vandermeer, J. & Whitbread, A. (2012) Global food security,
M€ader, P., Fliessbach, A., Dubois, D., Gunst, L., Fried, P. & Niggli, U. biodiversity conservation and the future of agricultural intensification.
(2002) Soil fertility and biodiversity in organic farming. Science, 296, Biological Conservation, 151, 53–59.
1694–1697. Tuck, S.L., Winqvist, C., Mota, F., Ahnstr€ om, J., Turnbull, L.A. & Ben-
Martin, L.J., Blossey, B. & Ellis, E. (2012) Mapping where ecologists gtsson, J. (2014) Data from: land-use intensity and the effects of organic
work: biases in the global distribution of terrestrial ecological observa- farming on biodiversity: a hierarchical meta-analysis. Dryad Digital
tions. Frontiers in Ecology and the Environment, 10, 195–201. Repository, doi:10.5061/dryad.609t7.
Martınez-Sanchez, J.C. (2008) The role of organic production in biodiver- Tuomisto, H.L., Hodge, I.D., Riordan, P. & Macdonald, D.W. (2012)
sity conservation in shade coffee plantations. PhD Thesis, Department Does organic farming reduce environmental impacts? – a meta-analysis
of Biology, University of Washington, USA. of European research. Journal of Environmental Management, 112,
Mondelaers, K., Aertsens, J. & Huylenbroeck, G.V. (2009) A meta-analy- 309–320.
sis of the differences in environmental impacts between organic and Vandermeer, J. & Perfecto, I. (2007) The agricultural matrix and a future
conventional farming. British Food Journal, 111, 1098–1119. paradigm for conservation. Conservation Biology, 21, 274–277.
Mota, F.K.P. (2010) The effects of organic farming on biodiversity: a Winqvist, C., Ahnstr€ om, J. & Bengtsson, J. (2012) Effects of organic farm-
meta-analysis. Unpublished Master’s thesis, Institute of Evolutionary ing on biodiversity and ecosystem services: taking landscape complexity
Biology and Environmental Studies, University of Z€ urich, Z€urich, Swit- into account. Annals of the New York Academy of Sciences, 1249,
zerland. 191–203.
Nakagawa, S. & Santos, E.S.A. (2012) Methodological issues and Winqvist, C., Bengtsson, J., Aavik, T., Berendse, F., Clement, L.W.,
advances in biological meta-analysis. Evolutionary Ecology, 26, 1253– Eggers, S. et al. (2011) Mixed effects of organic farming and landscape
1274. complexity on farmland biodiversity and biological control potential
€
Ostman, € Ekbom, B. & Bengtsson, J. (2001) Landscape heterogeneity
O., across Europe. Journal of Applied Ecology, 48, 570–579.
and farming practice influence biological control. Basic and Applied Zhang, J., Zheng, X., Jian, H., Qin, X., Yuan, F. & Zhang, R. (2013)
Ecology, 2, 365–371. Arthropod biodiversity and community structures of organic rice eco-
€
Ostman, € Ekbom, B. & Bengtsson, J. (2003) Yield increase attributable
O., systems in Guangdong Province, China. Florida Entomologist, 96, 1–9.
to aphid predation by ground-living polyphagous natural enemies in
spring barley in Sweden. Ecological Economics, 45, 149–158. Received 19 November 2013; accepted 23 December 2013
Phalan, B., Onial, M., Balmford, A. & Green, R.E. (2011) Reconciling Handling Editor: Ailsa McKenzie
food production and biodiversity conservation: land sharing and land
sparing compared. Science, 333, 1289–1291.
R Development Core Team. (2013) R: A Language and Environment for Supporting Information
Statistical Computing. R Foundation for Statistical Computing, Vienna,
Austria. Additional Supporting Information may be found in the online version
Randall, N.P. & James, K.L. (2012) The effectiveness of integrated farm
of this article.
management, organic farming and agri-environment schemes for con-
serving biodiversity in temperate Europe – a systematic map. Environ-
mental Evidence, 1, 1–21. Appendix S1. List of studies included in the meta-analysis.
Reganold, J.P. (2012) The fruits of organic farming. Nature, 485, 176.
Roschewitz, I., Gabriel, D., Tscharntke, T. & Thies, C. (2005) The effects Appendix S2. PRISMA flowchart showing the data collection deci-
of landscape complexity on arable weed species diversity in organic and
conventional farming. Journal of Applied Ecology, 42, 873–882.
sion process.
Rundl€ of, M., Bengtsson, J. & Smith, H.G. (2008) Local and landscape
effects of organic farming on butterfly species richness and abundance. Table S1. Model estimates.
Journal of Applied Ecology, 45, 813–820.
Rundl€ of, M., Edlund, M. & Smith, H.G. (2010) Organic farming at local
Table S2. Coefficient estimates for subgroups included in Fig. 1.
and landscape scales benefits plant diversity. Ecography, 33, 514–522.
Rundl€ of, M., Nilsson, H. & Smith, H.G. (2008) Interacting effects of
farming practice and landscape context on bumble bees. Biological Con- Table S3. List of studies rejected during data collection, with rea-
servation, 141, 417–426. sons for rejection.
Rundl€ of, M. & Smith, H.G. (2006) The effect of organic farming on but-
terfly diversity depends on landscape context. Journal of Applied Ecol-
ogy, 43, 1121–1127.
© 2013 The Authors. Journal of Applied Ecology published by John Wiley & Sons Ltd on behalf of British Ecological Society., Journal of
Applied Ecology, 51, 746–755You can also read