Direct and Indirect Effects of Literacy Skills and Writing Fluency on Writing Quality Across Three Genres - MDPI
←
→
Page content transcription
If your browser does not render page correctly, please read the page content below
education
            sciences
Article
Direct and Indirect Effects of Literacy Skills and
Writing Fluency on Writing Quality Across
Three Genres
Gary A. Troia 1, * , Julie S. Brehmer 1 , Kaitlin Glause 2 , Heather L. Reichmuth 1           and
Frank Lawrence 1
 1    College of Education, Michigan State University, East Lansing, MI 48824, USA;
      brehmerj@michigan.gov (J.S.B.); reichmu1@msu.edu (H.L.R.); cougar@msu.edu (F.L.)
 2    English Department, Millikin University, Decatur, IL 62522, USA; kglause@millikin.edu
 *    Correspondence: gtroia@msu.edu

 Received: 2 October 2020; Accepted: 19 October 2020; Published: 22 October 2020

 Abstract: Data were collected for this study early in the school year to analyze the direct and indirect
 effects of word-level literacy skills (word recognition, spelling, and written vocabulary use) and
 handwriting fluency on writing quality across three genres of typewritten papers. We further explored
 whether typing fluency and text generation fluency mediated the effects. Finally, we examined whether
 there was any difference in the effects across three writing genres. Fourth and fifth graders (N = 175)
 from 21 typical classrooms in 12 different Midwestern U.S. schools participated. Regression path
 analyses were employed and revealed that word-level literacy skills had both significant direct and
 serial indirect effects on quality, via typing fluency and then text generation fluency (text length)
 when controlling for handwriting fluency. Further, handwriting fluency had no direct effect when
 controlling for word-level literacy skills but did have a significant serial indirect effect on writing
 quality via typing fluency then text generation fluency. Results indicate that handwriting fluency
 matters, even when composing on the computer. Stronger transcription fluency, particularly by
 hand, leads to higher quality writing, likely because less cognitive effort is devoted to transcription.
 This study adds to limited research on the cross-modal effects of transcription on writing quality.

 Keywords: handwriting fluency; typing fluency; writing quality; serial mediation; path analysis

1. Introduction
      The simple view of writing [1–3] postulates that writing is represented by an integrated array of
knowledge and skills executed during writing tasks within one’s limited capacity working memory.
This array of knowledge and skills includes transcription (spelling, handwriting, and keyboarding),
text generation (ideation and language formulation at the word, sentence, and discourse levels),
and executive functions, initially supported by others, that coordinate transcription and text generation
(e.g., conscious control of attention, concentration, and effort as well as flexible self-regulation of
writing-related behaviors, thoughts, and emotions). Transcription skills and knowledge, in particular,
are foundational to writing development and performance [4], as they exert a strong influence over the
success of text generation processes in writing tasks (at least those that do not rely on dictation) due to
limited cognitive capacity. Thus, unless and until transcription is automatized, written expression is
likely to be more limited in length and quality [5–8].

1.1. Relationships between Transcription and Writing Performance
     The importance of transcription is demonstrated by studies in which handwriting fluency and
both isolated and contextual spelling proficiency have been found to explain a significant, non-trivial

Educ. Sci. 2020, 10, 297; doi:10.3390/educsci10110297                          www.mdpi.com/journal/education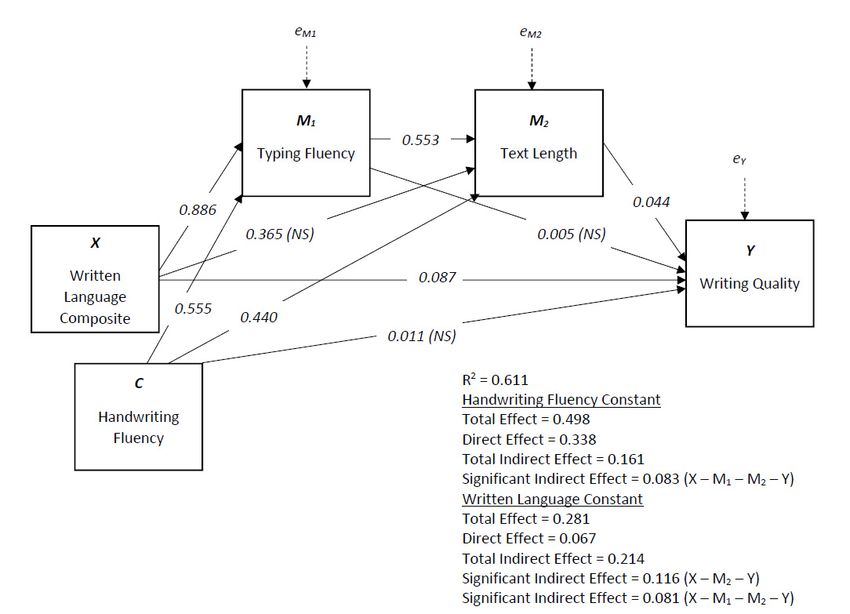
Educ. Sci. 2020, 10, 297                                                                             2 of 21

portion of variance in handwritten composition quality and quantity across different genres throughout
grade school [9–15]. Moreover, teaching transcription by hand yields moderate to large effects for
writing productivity and quality [16–18]. Likewise, keyboarding (i.e., typing) fluency has a significant
association with word-processed compositional quality and productivity and keyboarding instruction
produces at least modest effects on computer-generated writing performance [19–21]. Most relevant to
the purposes of our study, handwriting fluency is positively correlated (r = 0.38) with word-processed
composition quality and typing fluency is positively correlated (r = 0.44) with handwritten composition
quality [20], meaning that, regardless of transcription mode, more fluent transcription by hand and/or
by keyboard is associated with higher quality writing. However, research suggests that handwriting
fluency may be only indirectly related to writing quality in older students cf. [13,22–24]. What remains
unclear from the extant research, which we address here, is to what extent all these aspects of
transcription (and other literacy skills) make direct and indirect contributions to writing quality, and do
these contributions differ depending on the genre of writing produced. In particular, we are interested
in examining how precisely handwriting and typing fluency (i.e., graphomotor fluency) influence
computer-generated composition quality.

1.2. Relationships between Aspects of Transcription
      There is evidence to indicate the varied aspects of transcription—spelling, handwriting,
and keyboarding—are related because they rely to varying degrees on three integrated knowledge
sources [19,25]: phonological (letter names and their associated sounds), orthographic (rules associated
with combining individual letters and letter clusters to form words), and graphomotor (motor plans
and movements required to produce written symbols). A meta-analysis performed by Feng, Lindner, Ji,
and Joshi [10] observed a significant average weighted effect size of 0.561 for the relationship between
handwriting and keyboarding fluency (accuracy plus speed) and 0.431 for the relationship between
handwriting and keyboarding speed, but the effect size for the relationship between handwriting and
keyboarding accuracy was not significantly different from zero. The four to five studies used to calculate
these effect sizes included students in grades four and beyond, including adults. Overall, these few
research studies indicate that students who possess weaker handwriting fluency also generally possess
weaker keyboarding fluency, at least in the absence of adequate keyboarding instruction or a history of
regular keyboard use cf. [26].
      The meta-analysis conducted by Feng and colleagues [10] reported that neither the mean effect size
for the association between spelling accuracy and handwriting fluency (0.290) nor the mean effect size
for the relationship between spelling errors and handwriting fluency (−0.147) was significantly different
from zero based on seven studies located, the majority of which included students in the primary grades.
Spelling accuracy and errors were derived from writing samples rather than independent measures
of spelling performance. Nevertheless, a study by Limpo, Alves, and Connelly [24], which was not
included in the Feng et al. meta-analysis, found a significant correlation of 0.41 between handwriting
fluency and composition spelling accuracy in a group of seventh and eighth-graders. The best-fitting
model for the data suggested these were independent but correlated constructs, differentially associated
with planning and translating, and their effects on opinion writing quality were fully mediated by the
higher-level writing processes of planning and translating (at the sentence level). Studies describing
relationships between keyboarding and spelling are relatively rare, but Cohen and Wicklund [27]
reported a significant correlation of 0.37 between typing speed and spelling error recognition task
performance among high school students. More recently, Jiménez and Hernández-Cabrera [28] reported
significant correlations of about 0.30 between typing fluency tasks and dictated spelling accuracy tasks
in first and second graders.
      Of course, relationships between the three aspects of transcription, putatively due to reliance
on shared knowledge resources in long-term memory, do not mean they are executed in the same
manner or use these resources to the same degree. Handwriting, typing, and written spelling all
require memorization and rapid recall of letter forms and planned sequential movements (graphomotor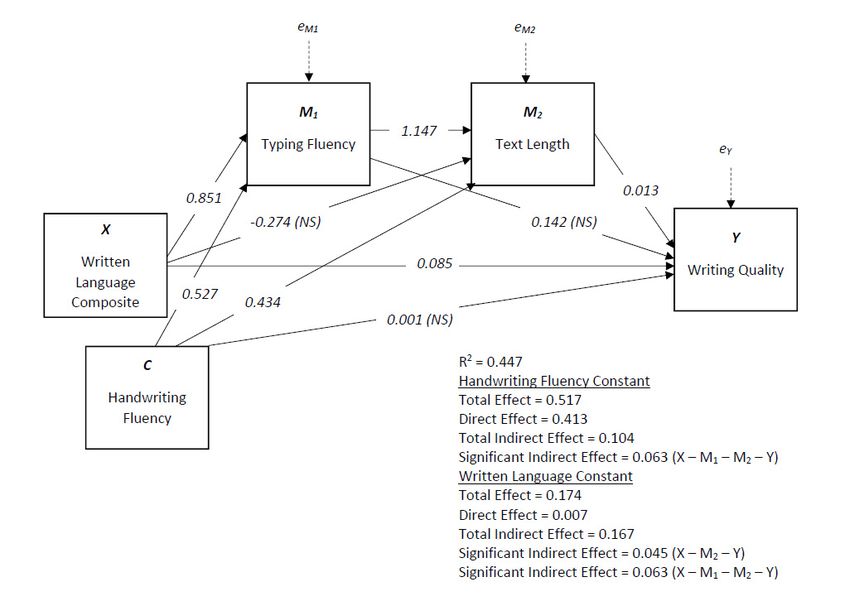
Educ. Sci. 2020, 10, 297                                                                            3 of 21

knowledge). In fact, evidence suggests letter forms are represented in long-term memory coupled
with their associated motor movements derived through writing by hand but not typing [29–31].
Spelling, however, recruits additional phonological and orthographic information, though transcribing
dictated material by hand or keyboard also recruits these knowledge resources because spelling is still
involved. Thus, the nature of the transcription task is an important consideration—copying text and
using retrieval of rote content such as the alphabet foreground graphomotor fluency and deemphasize
(but do not eliminate) phonological and orthographic processing.
     Handwriting employs a stylus to transcribe language, whereas keyboarding employs key presses
(and recall of the locations of specific letter keys on the keyboard). Handwriting is believed to involve
more temporally and spatially unified visual and haptic experiences than typing [32–34]. For instance,
visual attention while typing (at least among those who have not developed touch typing skills) must
be directed both at the screen and the keyboard, separating motor input from the visual output. This is
a presumed reason for the observed positive effects on orthographic recall and encoding conveyed
by handwriting but not typing noted by Longcamp and colleagues [29–32]. More generally, typing is
executed with less precise motor control and coordination than handwriting, demonstrated by the
sheer volume of typographic errors committed by most individuals. Consequently, while typing
and handwriting speed and fluency do appear to be related, there is reason to believe they involve
somewhat distinct graphomotor operations.

1.3. Relationships between Other Literacy Abilities and Writing Performance
     It is important to acknowledge the contribution of other word-level literacy abilities to writing
performance. The most obvious contributor is reading proficiency, because reading relies on
phonological and orthographic knowledge sources, though not graphomotor. A recent meta-analysis
reported by Kent and Wanzek [13] found correlations between reading performance and text length
ranged from −0.08 to 0.69 across 16 samples with a total of 1306 individuals. The relationship was
moderated by grade—a modest positive association was found for students in the primary grades
(kindergarten through third grade) but an insignificant association was observed for students in
grades four through six. Reading ability also predicts writing quality, and increasingly so as children
grow older [35,36]. Of course, the relations between reading ability and writing performance are
not unidirectional—development and/or instruction in one affects performance in the other [37–40].
A particular finding to note, because we capitalize on it in our study, is that word reading and spelling
are highly correlated (rs often greater than 0.65 in primary and intermediate grades), much more so
than reading and writing component skills at higher levels of language [35–37], leading Mehta and
colleagues [41] to consider decoding and spelling a singular word-level literacy factor.

1.4. Study Rationale
     Though there seem to be solid conceptual grounds for an association between graphomotor
fluency and spelling, especially regarding the reinforcing effect handwriting appears to have on
learning of spelling patterns, the empirical evidence is inconsistent. Spelling and word reading,
on the other hand, have a well-documented and strong association. Thus, in this study, we combine
dictated spelling accuracy, isolated word reading accuracy, and correct written vocabulary use to
form a written language composite to represent word-level literacy abilities. We include vocabulary
as a literacy component skill because it has been shown to make unique contributions to writing
quality across grades [42–44]. Though handwriting and typing differ in motor execution and degree
of visual-proprioceptive integration, correlations between these two modes of transcription have
been observed. Yet, it is unclear how they operate in tandem to affect composition productivity and
quality. Moreover, it is reasonable to assume that there are significant effects of handwriting fluency on
keyboarded papers, but these effects may be mediated by more proximal transcription factors when
writing on a computer, namely typing fluency. Consequently, our study aims to address the following
three key research questions. First, to what degree do word-level literacy skills and handwriting
Educ. Sci. 2020, 10, 297 4 of 21
fluency directly and indirectly influence the quality of typewritten papers? Second, are the effects of
word-level literacy skills and handwriting fluency on typed papers mediated by typing fluency and
text generation fluency? Third, are direct and/or indirect relationships between word-level literacy
skills/graphomotor fluency and text quality replicated across different genres of writing? Although we
have no particular reason to believe genre would influence the existence of any observed relationships,
cognitive models of writing [45,46] suggest that schemas for varied genres operate as a controlling
influence on other writing processes during composing, and thus may influence the strength of the
relationships. For example, a poorly elaborated writing schema associated with a less familiar genre
would be expected to place more cognitive demands on the writer, resulting in weaker relationships
between lower-level skills and writing performance because more variance would be attributable to
the higher-level controlling influences [47].
2. Materials and Methods
2.1. Participants
A total of 175 students from grades 4 (n = 60) and 5 (n = 115), ages 9−0 to 11−2, participated.
These students came from 21 general education classrooms distributed throughout 12 different
Midwestern schools. The teachers were surveyed regarding aspects of their writing instruction. Out of
the 21 teachers, only six reported devoting any instructional time to keyboarding or typing, between
10 and 60 min per week (M = 30.00, SD = 18.97). Only one teacher reported devoting time (10 min
per week) to handwriting instruction. Thirteen teachers reported spending any instructional time
on spelling, between 5 and 80 min per week (M = 28.46, SD = 24.27). The students in this study
were recruited at the classroom level as part of a larger study of the relationships between teachers’
writing instructional practices and annual growth in their students’ writing performance, knowledge,
and motivation. Of the participants, 52% (n = 91) were female and 67.4% were White (n = 118).
Additionally, about 10% (n = 17) of the students were considered non-native English learners or
students with disabilities (learning disability, ADHD, or autism) (n = 18). Participant data were
collected in the first three months of the school year using procedures approved by the authors’
institutional review board.
2.2. Measures
2.2.1. Word Reading
The Reading subtest of the Wide Range Achievement Test-3 [48] was administered to measure
students’ word recognition ability. Students were asked to read as many of the 42 words as possible
on the test plate, which were presented in rows with increasing difficulty. Responses had to be given
within 10 s and had to be correct whole-word pronunciations to be marked correct. Internal consistency
reliabilities for the age group of students in this study range between 0.88 and 0.90.
2.2.2. Spelling
The Spelling subtest of the Test of Written Language-4 [49] was given to students to evaluate
their spelling ability. Students were presented with a series of dictated sentences they had to write.
Each sentence was scored correct if all the written words were correctly spelled (though minor word
substitutions were permitted, substituted words also had to be spelled correctly to receive credit).
Obligatory capitalization also was considered part of spelling accuracy. A sentence fragment or major
deviation from the dictated sentence was scored incorrect. The internal consistency reliabilities for the
age group of students in this study range between 0.90 and 0.93.Educ. Sci. 2020, 10, 297 5 of 21
2.2.3. Written Vocabulary
The Vocabulary subtest of the Test of Written Language-4 [49] was given to students to evaluate their
vocabulary knowledge. Students were presented with a written word that they read independently
and then created a sentence that incorporated the word, as written, to demonstrate their understanding
of its meaning. Sentences were scored correct if a single sentence clearly displayed appropriate
semantic use of the target word without altering its form; errors in other aspects of sentence writing
(e.g., grammar, spelling) were not considered. The internal consistency reliabilities for the age group
of students in this study range between 0.85 and 0.92.
2.2.4. Handwriting Fluency
A paragraph copy task like the one developed by Monroe and Sherman [50] was used to measure
handwriting fluency. A paragraph of 147 words and 602 characters (pilot testing indicated the original
paragraph used by Monroe and Sherman required lengthening to avoid ceiling effects) was presented
on a sheet of paper with widely spaced lines below it for copying the text. They were given 90 s to copy
as much of the paragraph as possible and reminded that it was not necessary to read the text before
copying it. The number of characters correctly written (i.e., characters accurately copied in sequence
excluding additions or substitutions) in the time allotted was calculated (see [11]). All students elected
to copy the paragraph using manuscript print.
2.2.5. Typing Fluency
This task was a typed analog to the handwriting fluency task described above using a computer
keyboard to type text into a text box below the paragraph presented on a desktop or laptop screen.
Again, the number of characters correctly written in 90 s was calculated. This task was administered at
least several days after the handwriting fluency task.
2.2.6. Text Length
The total number of words written for each typewritten text in response to a narrative, opinion,
or informative prompt was automatically calculated by computer. Because the amount of time students
had to compose was limited to 15 min, text length in our study best represents text generation fluency.
2.2.7. Writing Quality
Participants’ typewritten texts (see below for details regarding how texts were elicited) were
hand-scored using a rubric based on the Smarter Balanced Assessment Consortium performance task
writing rubrics. The rubric contains seven dimensions: (1) reader orientation to purpose, (2) logical
coherence, (3) concluding section, (4) cohesion through linking words or phrases, (5) development of
ideas using details such as facts, examples, quotes, and experiences, (6) precise and varied language;
and (7) correct grammar/usage/mechanics (i.e., writing conventions). Each dimension was scored on
a scale of 0 (no evidence of dimensional quality, severely flawed/incomprehensible) to 5 (excellent
evidence of dimensional quality, virtually no flaws/fully comprehensible) for a total score between
0 and 35. Each paper was initially read without scoring to obtain an overall impression of writing
quality and to initially segregate the papers into high-, medium-, and low-quality subsets to expedite
scoring using the rubric, a common practice in large-scale writing assessments [51]. Then, all papers
were scored on each dimension in succession, beginning with writing conventions and ending with
reader orientation to purpose, until scores for all seven dimensions were assigned. For this study,
we excluded the dimension scores for writing conventions to enable a stricter test of our hypotheses.
The remaining six dimension scores loaded on a single factor that accounted for 55.6%, 61.8%, and 61.4%
of the total variance for narrative, opinion, and informative papers, respectively. Internal consistency
reliabilities using the six dimensions were 0.81, 0.85, and 0.87 for narrative, opinion, and informative
papers, respectively. All of the papers were double scored by trained undergraduates and the interraterEduc. Sci. 2020, 10, 297 6 of 21
reliability estimates, calculated with a two-way random effects intraclass correlation (ICC), were 0.85
for each of the three genres using absolute agreement.
2.3. Writing Tasks
All tasks in this study were administered by one or two of the first four study authors to groups
of 6 to 15 students. After completing the norm-referenced tests of word reading, spelling, and written
vocabulary, and the timed handwriting fluency copying task, students were asked to respond to one
writing prompt each for narrative, opinion, and informative genres (in that order) on a computer or
laptop and to complete the typing fluency copying task on the same equipment using a web-based
application called Writing Architect 1.0 [52]. Except for word reading, all tasks in this study were
group administered. Students were encouraged to complete the handwriting fluency task after each
time they wrote a paper to improve their performance, but this was not mandatory; thus, for most
students, the data reported for this task are the average of two or three attempts. The writing prompts
were administered over a period of several days so that students did not complete all three in one
sitting. For each writing prompt to which students responded, they were given a printed copy of
materials they viewed on the computer screen as well as a blank space below the printed prompt
instructions for planning their papers (they were instructed to plan in whatever fashion they had
been taught for the genre). Students were permitted up to three minutes to plan each paper and
15 min to write. When writing using Writing Architect 1.0, all accessibility and auto-correction word
processing features are disabled. For planning, a countdown clock appeared in the lower-left corner of
the screen; the prompt instruction page automatically advanced to the next screen page (informing the
students they were going to be given 15 min to write a paper in response to the prompt they had been
assigned in a blank text box on the next screen page; students had to manually advance to the text box
screen page to begin writing) after the maximum time elapsed, but students could advance to the next
screen page if they did not wish to plan or finished early. For writing, an audible beep paired with
a visual warning flashed across the top of the screen was given when one minute remained. Just as
for planning, students could advance to the next screen page if they completed their writing before
the 15 min elapsed. All instructions (and passages for informational papers, see below) were not only
presented in print and on the computer screen, but also were audibly presented by the computer to
help alleviate problems encountered by weaker readers. Students were provided with headphones to
listen simultaneously while reading the hard copy and/or electronic versions of materials.
Each genre had four prompt options and one option from each genre was randomly assigned to
each student. The prompts (and task instructions noted below) were reviewed by an expert panel of
writing researchers and teachers. Narrative prompts were in the form of a story title: (1) One Day of
Invisibility; (2) The Attack; (3) Fantastic Voyage; (4) Don’t Go into The Attic. Opinion prompts were in
the form of a question: (1) Should sugary foods be allowed at school?; (2) Should a person always be
honest?; (3) Should cellphones be allowed in classrooms?; (4) Should families be able to pick who their
children’s friends are? Informative prompts were linked to modified expository passages from online
sources. The passage titles were: (1) 13-Year-Old World War II Veteran; (2) Swat Up: Six Reasons to
Love Flies; (3) Can an Elevated Bus Solve China’s Traffic Woes?; (4) Plastic Bottle Village. Permission
was obtained from the copyright holders to use and modify the passages for research. The passages
were modified to be within a range of readability appropriate for grades 3 through 8 based on word
count, Lexile® , Flesch–Kincaid, and Coh–Metrix degree of narrativity (below 50% for each passage).
A pilot study to evaluate the equivalence of these prompts with a sample of approximately 175 children
in grades 3 through 8 found no significant differences in text length and quality (including conventions)
associated with prompt in any genre.
When responding to a narrative prompt, students were told to “write a creative, fictional story—
a make believe story—to match the title; write a story others will find interesting and enjoyable to
read and remember, a good story (1) establishes the setting, (2) develops the characters, (3) describes
an exciting plot sequence that has a clear beginning event, character actions related to that event,Educ. Sci. 2020, 10, 297 7 of 21
and an outcome or conclusion, and (4) follows the rules of writing.” When responding to an opinion
prompt, students were told to “write a persuasive essay that convinces readers to agree with your
answer to the question and remember, a good persuasive essay (1) clearly states your opinion, (2) gives
detailed facts and personal experiences to support your opinion, (3) has a conclusion that helps your
readers understand why they should agree with your opinion, and (4) follows the rules of writing.”
When responding to an informative prompt, students were told to “write an informative paper that
will help others learn about the topic of the passage you read; be sure to use information from the
article you just read to give reasons why it is important and remember, a well written informative
paper (1) has a clear main idea and stays on topic, (2) includes a good introduction and conclusion,
(3) uses information from the article stated in your own words plus your own ideas, and (4) follows
the rules of writing.”
2.4. Data Analysis
We first screened all measures for univariate normality and homogeneity of variance across grade,
gender, and ability (students with a disability versus those without) groups. Except for handwriting
fluency, which exhibited group variance heterogeneity (in this case, an appropriate alternative was
used for inferential statistical tests), the data from the measures were normally distributed without
extreme outliers and exhibited equivalent variances across groups. We also examined the scatterplots of
residuals as a function of predicted values for all variables and the assumptions of homoscedasticity and
linear relationships were valid in all cases. Means and standard deviations for all measures by grade,
gender, and ability group are presented in Table 1. We then used one-way ANOVAs (with α = 0.005
to adjust for multiple hypothesis testing) to determine if there were group differences for any of the
measures (see Table 1 for summary) and dependent samples t-tests to determine if students’ writing
fluency differed significantly by mode of production or if there were significant differences between
genres with regard to text length or quality. Subsequently, we computed bivariate correlations for all
the measures using the entire dataset; these are reported in Table 2. Statistical significance was set to α
= 0.001 after applying the Bonferroni correction for the experiment-wise error. Finally, we employed
regression path analysis using the PROCESS v3.3 macro [53] for SPSS, which permits the evaluation of
total direct, total indirect, and discrete indirect effects between antecedent (i.e., predictor) and consequent
(i.e., outcome) observed variables. Path analyses were conducted separately for each genre to examine how
written language skills, indexed by a composite of word reading, spelling, and vocabulary (see below),
and handwriting fluency are related to writing quality, mediated by typing fluency and then text length.
Figure 1 illustrates the proposed serial mediation model tested for each genre. It should be noted that
because PROCESS allows examination of effects on a terminal consequent variable by only a single focus
antecedent (the X in Figure 1), any other focus antecedent variable must be treated as a covariate (the C in
Figure 1) and, subsequently, the two are switched (i.e., the covariate becomes the focal antecedent, and the
original focal antecedent is treated as a covariate) to estimate the effects of both variables. Mathematically,
this yields the same regression coefficients and direct and indirect effects as if the variables were entered
simultaneously using structural equation modeling [53] (p. 144).Educ. Sci. 2020, 10, x FOR PEER REVIEW 8 of 22
Educ. Sci. 2020, 10, 297 8 of 21
11.86 12.63 11.81 12.87 8.56 12.77
Narrative Quality
(3.86) (3.38) (3.43) (3.62) (2.71) (3.40) *
Table 1. Means (and standard deviations) for study variables by group and mean comparisons.
76.85 113.69 87.99 113.08 64.14 104.89
Opinion Length
Variable (49.10)
Grade (61.32) * (54.44) Gender (62.40) (54.04) (59.41)
Disability
4 11.55 5 13.18 11.69
Male 13.47
Female 8.50
Yes 13.04
No
Opinion Quality (n = 60) (n = 115) (n = 84) (n = 91) (n = 18) (n = 157)
(4.47) (3.84) (3.90) (4.16) * (4.64) (3.85) *
Word Reading 109.68 (12.73) 105.15 (13.10) 107.85 (13.09) 105.66 (13.12) 96.50 (13.29) 107.89 (12.61) *
83.17 93.81 85.55 94.37 58.71 93.30
Informative
Spelling Length 10.13 (2.81) 9.90 (3.11) 9.83 (3.18) 10.12 (2.85) 6.61 (2.91) 10.37 (2.77) *
Written Vocabulary
(56.51)
10.92 (2.51)
(55.26)
10.92 (3.25)
(57.22)
11.10 (3.24)
(54.39)
10.76 (2.78)
(38.97)
8.11 (2.61)
(56.27)
11.24 (2.89) *
HandwritingFluency 11.42 110.98 (28.84)
98.77 (23.38) 13.05* 103.88 (28.45)
12.24 109.4712.72 (26.72) 84.178.71
(27.82) 12.87
109.38 (26.48) *
Informative
Typing FluencyQuality84.32 (42.16)
(4.03) 95.10 (37.50)
(4.75) 94.81 (41.06)
(4.76) 88.46 (37.75)
(4.42) 62.45 (37.60)
(4.20) 94.50 (38.39) *
(4.45) *
Narrative Length 128.87 (75.40) 145.31 (69.75) 131.34 (68.27) 147.18 (74.60) 70.38 (52.24) 147.03 (69.90) *
Notes:Quality
Narrative All variables were
11.86 normally
(3.86) distributed
12.63 (3.38) within groups with
11.81 (3.43) no extreme8.56
12.87 (3.62) outliers;
(2.71) * indicates
12.77 (3.40) *
Opinion Lengthdifference
significant 76.85between
(49.10) 113.69 (61.32)
groups at p *< 0.005
87.99 (54.44)
(Bonferroni 113.08 (62.40)
adjusted value;64.14
the (54.04) 104.89 (59.41)
Brown–Forsythe
Opinion Quality 11.55 (4.47) 13.18 (3.84) 11.69 (3.90) 13.47 (4.16) * 8.50 (4.64) 13.04 (3.85) *
robust Length
Informative test of equality
83.17 of means was
(56.51) used
93.81 when the
(55.26) assumption
85.55 (57.22) of homogeneity
94.37 (54.39) of variances
58.71 (38.97) was not
93.30 (56.27)
Informative
met forQuality
handwriting 11.42 (4.03)
fluency). 13.05 (4.75) 12.24 (4.76) 12.72 (4.42) 8.71 (4.20) 12.87 (4.45) *
Notes: All variables were normally distributed within groups with no extreme outliers; * indicates significant
at pEduc. Sci. 2020, 10, 297 9 of 21
p < 0.001, g = −0.90, spelling, F(1, 173) = 29.56, MSE = 7.72, p < 0.001, g = −1.35, written vocabulary,
F(1, 173) = 19.60, MSE = 8.17, p < 0.001, g = −1.09, handwriting fluency, F(1, 172) = 14.48, MSE = 708.33,
p < 0.001, g = −0.95, typing fluency, F(1, 171) = 13.05, MSE = 1443.86, p < 0.001, g = −0.90, narrative
paper length and quality, F(1, 167) = 17.66 and 22.04, MSE = 4732.42 and 11.39, p < 0.001, g = −1.10
and −1.24, respectively, opinion paper quality, F(1, 169) = 21.46, MSE = 15.42, p < 0.001, g = −1.22,
and informative paper quality, F(1, 157) = 9.96, MSE = 19.56, p = 0.002, g = −0.85. Girls performed
better than boys with respect to opinion paper quality, F(1, 169) = 7.97, MSE = 16.60, p = 0.012, g = 0.43,
but did not significantly differ from boys otherwise. Fifth graders wrote longer, F(1, 169) = 8.71,
MSE = 3916.20, p = 0.004, g = 0.48, but not qualitatively better opinion papers than fourth graders.
Fifth graders also exhibited greater handwriting fluency, F(1, 172) = 7.99, MSE = 733.87, p = 0.005,
g = 0.45, though not typing fluency.
3.2. Transcription Mode and Writing Genre Comparisons
We did find that handwriting fluency was significantly greater than typing fluency in our sample
of students, t(171) = 5.82, p < 0.001, d = 0.47. Additionally, students produced narrative papers that
were significantly longer than opinion papers, t(165) = 8.19, p < 0.001, d = 0.54, and informative papers,
t(156) = 10.36, p < 0.001, d = 0.76, and opinion papers that were significantly longer than informative
papers, t(156) = 2.53, p = 0.013, d = 0.19. However, paper quality was not significantly different
across genres.
3.3. Associations between Variables
Table 2 illustrates that word reading, spelling, and written vocabulary scores from norm-referenced
tests were all strongly positively correlated, sharing at least 40% variance; thus, we created a word-level
Written Language Composite (WLC) for subsequent analyses by summing the scores from these
three measures. Handwriting and typing fluency are significantly positively related to each other
and to writing length and quality in each genre, though typing fluency is more strongly related to
text length and quality when writing on a computer than handwriting fluency, as might be expected.
Additionally notable is that the relationship between text length and quality is significantly weaker
for narrative papers (r = 0.49) compared to informative papers (r = 0.69), z = −2.79, p = 0.005, and for
opinion papers (r = 0.51) compared to informative papers, z = −2.56, p = 0.01. Additionally, text quality
across genres is generally slightly more strongly related than text length across genres.
3.4. Predicting Narrative Writing Quality
The results of regression path analysis to determine how written language skills transmit their
effect to narrative writing quality through typing fluency and text length, while controlling for
handwriting fluency, are presented in Table 3 (also see Figure 2 for a visual summary of results).
As can be seen in this table and the associated figure, students with higher scores on WLC displayed
stronger typing fluency (a1 = 0.851) but did not produce longer narratives (a2 = −0.274, NS) when
controlling for handwriting fluency. Conversely, typing fluency was not associated with story quality
(b1 = 0.142, NS) but those students who wrote longer narratives did write better stories (b2 = 0.013)
when controlling for handwriting fluency. Bootstrap 95% confidence intervals based on 5,000 samples
for the indirect effects of written language skills on narrative quality via typing fluency (a1 b1 ) and via
text length (a2 b2 ) both included zero and thus represented no significant indirect effects. However,
the bootstrap confidence interval for the mediation of the effects of written language skills on narrative
quality via typing fluency and then text length (a1 d21 b2 ) was entirely above zero (0.026, 0.110) and
thus represented a significant serial indirect effect. For every one standard deviation change in WLC
controlling for handwriting fluency, there was a difference of about one-tenth of a standard deviation
in story quality as a result of the total indirect effects. There also was evidence that students’ WLC
score was positively associated with narrative quality, independent of written language skills’ effects
on typing fluency or text length, but still controlling for handwriting fluency (c0 = 0.085); for every oneEduc. Sci. 2020, 10, 297 10 of 21
standard deviation change in WLC, there was approximately four-tenths of a standard deviation change
in narrative quality independent of the mediators. Overall, when controlling for handwriting fluency,
typing fluency and text length together significantly mediated the relationship between WLC and
narrative quality, and WLC had a significant direct effect on narrative quality as well. These antecedent
variables explained approximately 45% of variance in narrative quality.
Also in Table 3 and Figure 2 are the results regarding how handwriting fluency transmits its effect
on narrative writing quality through typing fluency and text length, while controlling for written
language skills. Students with more fluent handwriting displayed stronger typing fluency (a1 = 0.527)
and wrote longer narratives (a2 = 0.434) when controlling for WLC. The bootstrap confidence interval
for the indirect effect of handwriting fluency on narrative quality via typing fluency (a1 b1 ) included
zero and thus was not significant, but for the indirect effect via text length (a2 b2 ), the bootstrap interval
did not include zero (0.007, 0.097) and thus did represent a significant indirect effect. The bootstrap
confidence interval for the mediation of the effects of handwriting fluency on narrative quality via
typing fluency and then text length (a1 d21 b2 ) was entirely above zero (0.025, 0.111) and thus represented
a significant serial indirect effect. For every one standard deviation change in handwriting fluency
controlling for WLC, there was a difference of about 0.17 standard deviation in story quality as a result
of the total indirect effects. There was no evidence that students’ handwriting fluency was positively
associated with narrative quality independent of the mediators when controlling for WLC (c0 = 0.001,
NS). Overall, when controlling for WLC, typing fluency and text length significantly mediated the
relationship between handwriting fluency and narrative quality, but there was no significant direct
effect of handwriting fluency on story quality.
Table 3. Regression path analysis for narrative quality outcome.
(a)
Consequent Variables
M 1 (Typing Fluency) M 2 (Text Length) Y (Narrative Quality)
Antecedent Variables Coeff. SE p Coeff. SE p Coeff. SE p
X (Written Language) 0.851 0.1480.167 0.043 0.090 0.259
covariate)
Indirect Effect 1 (X → M1 → Y) 0.058 0.035 −0.005 0.135
Indirect Effect 2 (X → M2 → Y) 0.045 0.023 0.007 0.097
Indirect Effect 3 (X → M1 → M2 → Y) 0.063 0.022 0.025 0.111
Contrast 1 (IE1 – IE2) 0.013 0.045 −0.072 0.105
Contrast 2 (IE1 – IE3) −0.005 0.044 −0.093 0.083
Educ. Sci. 2020, 10, 297
Contrast 3 (IE2 – IE3) −0.018 0.028 −0.081 0.032 11 of 21
Figure 2. Serial Mediation Results for Narrative Quality.
Figure 2. Serial Mediation Results for Narrative Quality.
3.5. Predicting Opinion Writing Quality
3.5. Predicting Opinion Writing Quality
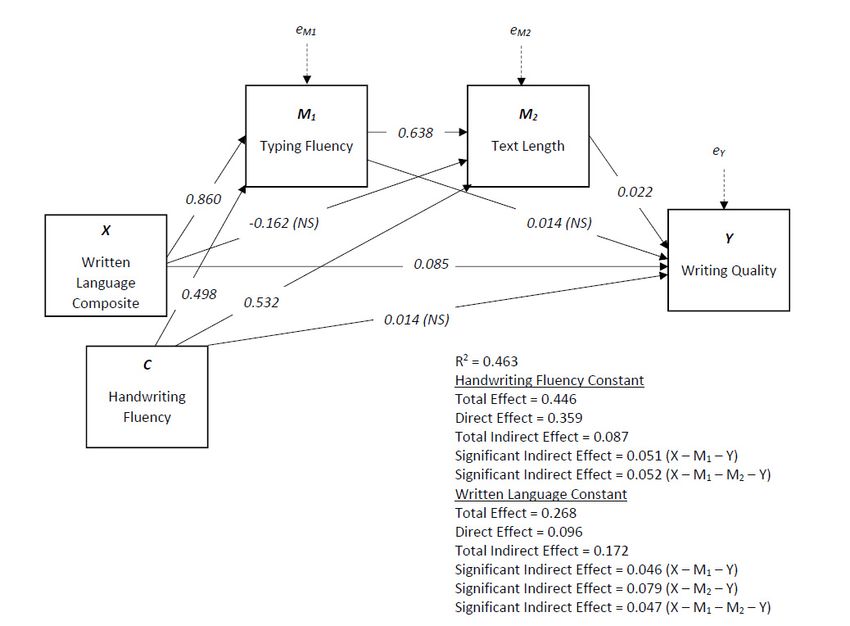
Table 4 (also see Figure 3) displays the results of the regression path analysis using opinion
Table 4as(also
writing quality the see Figureconsequent
terminal 3) displays the results As
variable. of the
canregression
be seen inpath thisanalysis
table and using
the opinion
associated
writing quality as the terminal consequent variable. As can be seen in this table and the associated
figure, students with higher scores on WLC displayed stronger typing fluency (a1 = 0.860) but did
figure, students with higher scores on WLC displayed stronger typing fluency (a1 = 0.860) but did not
not produce longer opinion papers (a2 = −0.162, NS) when controlling for handwriting fluency.
produce longer opinion papers (a2 = −0.162, NS) when controlling for handwriting fluency.
Conversely, typing fluency was not associated with opinion paper quality (b1 = 0.014, NS) but those
Conversely, typing fluency was not associated with opinion paper quality (b1 = 0.014, NS) but those
students whowho
students wrote longer
wrote texts
longer did
texts didwrite
writebetter
betteropinion
opinion papers
papers (b(b22==0.022)
0.022) when
when controlling
controlling for for
handwriting fluency.
handwriting fluency.TheThebootstrap
bootstrapconfidence
confidence interval for the
interval for theindirect
indirecteffect
effectof of written
written language
language
skillsskills
on opinion quality
on opinion viavia
quality typing
typing fluency 1 b1b
fluency(a(a 1 1)) did
did not contain
containzero
zero(0.001,
(0.001, 0.102)
0.102) andand
thus thus
waswas
significant, though
significant, the the
though confidence
confidence interval
intervalfor
forthe
theindirect
indirect effect via
viatext
textlength
length(a(a2b22)bdid
2 ) did include
include zero zero
and consequently
and consequently was notwassignificant.
not significant.
The The bootstrap
bootstrap confidence
confidence interval
interval for for
the the mediation
mediation of the
of the effects
effectslanguage
of written of written skills
language skills on opinion
on opinion quality quality
via typing via typing fluency
fluency and andthenthentexttext
lengthlength(a1(a1db
d21 21b)2)was
2
wasabove
entirely entirely above
zero zero0.091)
(0.024, (0.024,and
0.091) andrepresented
thus thus represented a significant
a significant serial
serial indirect
indirect effect.
effect.Educ. Sci. 2020, 10, 297 12 of 21
Table 4. Regression path analysis for opinion quality outcome.
(a)
Consequent Variables
M 1 (Typing Fluency) M 2 (Text Length) Y (Opinion Quality)
Antecedent Variables Coeff. SE p Coeff. SE p Coeff. SE p
X (Written Language) 0.860 0.145 < 0.001 −0.162 0.278 0.561 0.085 0.015 < 0.001
C (Handwriting Fluency) 0.498 0.092 < 0.001 0.532 0.174 0.003 0.014 0.010 0.147
M1 (Typing Fluency) — — — 0.638 0.135 < 0.001 0.014 0.008 0.082
M2 (Text Length) — — — — — — 0.022 0.004 < 0.001
Constant −71.897 18.986 < 0.001 8.250 34.418 0.811 −3.489 1.896 0.068
R = 0.337
2 R = 0.262
2 R2 = 0.463
F(2, 166) = 42.091 F(3, 165) = 19.538 F(4, 164) = 35.341
p < 0.001 p < 0.001 p < 0.001
(b)
Direct and Indirect Effects Decomposition
Bootstrapped Bootstrapped
Standardized Bootstrapped
Effect 95% CI 95% CI
Coeff. SE
Lower Limit Upper Limit
Total Effect (handwriting fluency covariate): c 0.446
Direct Effect (handwriting fluency covariate): c0 0.359
Total Indirect Effect (handwriting fluency covariate): c – c0 0.087 0.040 0.017 0.175
Indirect Effect 1 (X → M1 → Y): a1 b1 0.051 0.026 0.001 0.102
Indirect Effect 2 (X → M2 → Y): a2 b2 −0.015 0.029 −0.065 0.050
Indirect Effect 3 (X → M1 → M2 → Y): a1 d21 b2 0.052 0.017 0.024 0.091
Contrast 1 (IE1 – IE2) 0.066 0.037 −0.014 0.134
Contrast 2 (IE1 – IE3) −0.001 0.032 −0.068 0.056
Contrast 3 (IE2 – IE3) −0.067 0.038 −0.140 0.010
Total Effect (written language covariate) 0.268
Direct Effect (written language covariate) 0.096
Total Indirect Effect (written language covariate) 0.172 0.054 0.081 0.290
Indirect Effect 1 (X → M1 → Y) 0.046 0.025 0.001 0.099
Indirect Effect 2 (X → M2 → Y) 0.079 0.044 0.011 0.079
Indirect Effect 3 (X → M1 → M2 → Y) 0.047 0.016 0.021 0.081
Contrast 1 (IE1 – IE2) −0.033 0.048 −0.140 0.050
Contrast 2 (IE1 – IE3) −0.001 0.029 −0.060 0.056
Educ. Sci. 2020, 10, x FOR PEER REVIEW 13 of 22
Contrast 3 (IE2 – IE3) 0.032 0.047 −0.045 0.141
Figure 3. Serial
Figure Mediation
3. Serial MediationResults
Results for
for Opinion Quality.
Opinion Quality.
Table 4 and Figure 3 also give results regarding how handwriting fluency transmits its effect on
opinion writing quality through typing fluency and text length, while controlling for written
language skills. Students with more fluent handwriting displayed stronger typing fluency (a1 = 0.498)
and wrote longer opinion papers (a2 = 0.532) when controlling for WLC. The 95% bootstrap
confidence intervals based on 5,000 samples for the indirect effects of handwriting fluency on opinion
quality via typing fluency (a1b1) and via text length (a2b2) were both significant as they did not containEduc. Sci. 2020, 10, 297 13 of 21
For every one standard deviation change in WLC controlling for handwriting fluency, there was a
difference of about 0.08 standard deviation in opinion paper quality as a result of the total indirect
effects. There also was evidence that students’ WLC score was positively associated with opinion
quality, independent of written language skills’ effects on typing fluency or text length, but still
controlling for handwriting fluency (c0 = 0.085); for every one standard deviation change in WLC,
there was approximately a third of a standard deviation change in opinion quality independent of
the mediators. Overall, when controlling for handwriting fluency, typing fluency and text length
significantly mediated the relationship between WLC and opinion quality, and WLC had a significant
direct effect on opinion quality as well. These antecedent variables explained approximately 46% of
variance in opinion paper quality.
Table 4 and Figure 3 also give results regarding how handwriting fluency transmits its effect on
opinion writing quality through typing fluency and text length, while controlling for written language
skills. Students with more fluent handwriting displayed stronger typing fluency (a1 = 0.498) and
wrote longer opinion papers (a2 = 0.532) when controlling for WLC. The 95% bootstrap confidence
intervals based on 5,000 samples for the indirect effects of handwriting fluency on opinion quality
via typing fluency (a1 b1 ) and via text length (a2 b2 ) were both significant as they did not contain the
value of zero (0.001, 0.099 and 0.011, 0.079, respectively). Moreover, the bootstrap confidence interval
for the mediation of the effects of handwriting fluency on opinion quality via typing fluency and
then text length (a1 d21 b2 ) was entirely above zero (0.021, 0.081) and thus represented a significant
serial indirect effect. For every one standard deviation change in handwriting fluency controlling for
WLC, there was a difference of about 0.17 standard deviation in opinion paper quality as a result of
the total indirect effects. There was no evidence that students’ handwriting fluency was positively
associated with opinion quality independent of the mediators when controlling for WLC (c0 = 0.014,
NS). Overall, when controlling for WLC, typing fluency and text length significantly mediated the
relationship between handwriting fluency and opinion quality, but there was no significant direct
effect of handwriting fluency on opinion quality.
3.6. Predicting Informative Writing Quality
Finally, the results associated with the regression path analysis using informative writing quality
as the terminal consequent variable are presented in Table 5 and Figure 4. Students with higher scores
on WLC displayed stronger typing fluency (a1 = 0.886) but did not produce longer informative papers
(a2 = 0.365, NS) when controlling for handwriting fluency. Conversely, typing fluency was not related
to informative quality (b1 = 0.005, NS) but those students who wrote longer texts did write better
informative papers (b2 = 0.044) when controlling for handwriting fluency. The bootstrap confidence
interval for the indirect effects of written language skills on informative quality via typing fluency (a1 b1 )
and via text length (a2 b2 ) included zero and consequently were not significant. The bootstrap confidence
interval for the mediation of the effects of written language skills on informative paper quality via
typing fluency and then text length (a1 d21 b2 ) was entirely above zero (0.046, 0.121) and thus represented
a significant serial indirect effect. For every one standard deviation change in WLC controlling for
handwriting fluency, there was a difference of about 0.16 standard deviation in informative paper
quality as a result of the total indirect effects. There also was evidence that students’ WLC score
was positively associated with informative quality, independent of written language skills’ effects on
typing fluency or text length, but still controlling for handwriting fluency (c0 = 0.087); for every one
standard deviation change in WLC, there was approximately a third of a standard deviation change in
informative quality independent of the mediators. Overall, when controlling for handwriting fluency,
typing fluency and text length significantly mediated the relationship between WLC and informative
paper quality, and WLC had a significant direct effect on informative quality as well. These antecedent
variables explained approximately 61% of variance in informative paper quality.Educ. Sci. 2020, 10, 297 14 of 21
Table 5. Regression path analysis for informative quality outcome.
(a)
Consequent Variables
Educ. Sci. 2020, 10, x FOR PEERM
REVIEW
1 (Typing Fluency) M 2 (Text Length) Y (Informative Quality)
15 of 22
Antecedent Variables Coeff. SE p Coeff. SE p Coeff. SE p
X (Written Language) 0.886 0.145 < 0.001 0.365 0.232 Lower
0.118 Limit
0.087 Upper Limit
0.015 < 0.001
Total EffectFluency)
C (Handwriting (handwriting fluency0.092
0.555 < 0.001 0.440 0.147 0.003 0.011 0.010 0.261
M1 (Typing Fluency) 0.498 < 0.001
covariate): c — — — 0.553 0.115 0.005 0.008 0.543
M2 (Text Length) — — — — — — 0.044 0.005 < 0.001
Direct Effect (handwriting
Constant
fluency19.113
−82.509 < 0.001 −55.288 29.076 0.059 −4.217 1.892 0.027
0.338
covariate): c′ R = 0.383
2 R2 = 0.358 R2 = 0.611
F(2, 155) = 48.015
Total Indirect Effect (handwriting F(3, 154) = 28.626 F(4, 153) = 60.068
p < 0.001 0.161 0.044
p < 0.001 0.073 p < 0.248
0.001
fluency covariate): c – c′
(b) Indirect Effect 1 (X → M1 → Y): a1b1 0.017 0.031 −0.038 0.085
Indirect Effect 2 (X → M2 → Y): a2b2 0.062 0.040 −0.010
Direct and Indirect 0.147
Effects Decomposition
Indirect Effect 3 (X → M1 → M2 → Bootstrapped Bootstrapped
0.083 0.020 Bootstrapped0.046
Standardized 0.121
Y): a1d21bEffect
2
Coeff. SE
95% CI 95% CI
Lower Limit Upper Limit
Contrast 1 (IE1 – IE2) −0.045 0.058 −0.153 0.068
Total Effect (handwriting
Contrast 2 (IE1 – IE3) fluency covariate): c −0.066 0.498 0.038 −0.136 0.017
Direct Effect (handwriting fluency covariate): c0 0.338
Contrast 3 (IE2 – IE3) −0.021
Total Indirect Effect (handwriting fluency covariate): c – c0 0.161
0.047 0.044
−0.108 0.073
0.077 0.248
Total Effect (written language
Indirect Effect 1 (X → M1 → Y): a1 b1 0.017 0.031 −0.038 0.085
0.281
Indirect Effect 2 (X → M2 → Y): a2 b2
covariate) 0.062 0.040 −0.010 0.147
Indirect Effect 3 (X → M1 → M2 → Y): a1 d21 b2 0.083 0.020 0.046 0.121
Direct Effect (written language
Contrast 1 (IE1 – IE2) 0.067 −0.045 0.058 −0.153 0.068
covariate)
Contrast 2 (IE1 – IE3) −0.066 0.038 −0.136 0.017
Total Indirect Effect3(written
Contrast (IE2 – IE3) −0.021 0.047 −0.108 0.077
Total Effect (written language covariate) 0.214 0.281 0.050 0.120 0.317
language covariate)
Direct Effect (written language covariate) 0.067
Indirect Effect 1 (X → M1 → Y)
Total Indirect Effect (written language covariate)
0.016 0.214
0.031 0.050
−0.032 0.120
0.090 0.317
Indirect Indirect (X →1 M
Effect 2Effect (X2→→MY)1 → Y) 0.116 0.016 0.040 0.031 0.042 −0.032 0.199 0.090
Indirect EffectIndirect → M21 (X
3 (XEffect →→ MM2→2 →Y)Y) 0.081 0.116 0.021 0.040 0.042 0.042 0.125 0.199
Indirect Effect 3 (X → M1 → M2 → Y) 0.081 0.021 0.042
Contrast 1 (IE1 – IE2) −0.100 0.055 −0.200 0.017 0.125
Contrast 1 (IE1 – IE2) −0.100 0.055 −0.200 0.017
ContrastContrast
2 (IE1 –2 IE3)
(IE1 – IE3) −0.065 −0.065 0.036 0.036 −0.130 −0.130 0.016 0.016
ContrastContrast
3 (IE2 –3 IE3)
(IE2 – IE3) 0.035 0.035 0.048 0.048 −0.055 −0.055 0.133 0.133
Figure Serial
4. 4.
Figure Mediation
Serial MediationResults
Results for InformativeQuality.
for Informative Quality.Educ. Sci. 2020, 10, 297 15 of 21
Table 5 and Figure 4 also give results regarding how handwriting fluency transmits its effect
on informative writing quality through typing fluency and text length, while controlling for written
language skills. Students with more fluent handwriting displayed stronger typing fluency (a1 = 0.555)
and wrote longer informative papers (a2 = 0.440) when controlling for WLC. The 95% bootstrap
confidence interval for the indirect effect of handwriting fluency on informative quality via typing
fluency (a1 b1 ) was not significant (−0.032, 0.090) but was for the indirect effect via text length
(a2 b2 ) (0.042, 0.199). Moreover, the bootstrap confidence interval for the mediation of the effects of
handwriting fluency on informative paper quality via typing fluency and then text length (a1 d21 b2 )
did not include the value of zero (0.042, 0.125) and thus represented a significant serial indirect effect.
For every one standard deviation change in handwriting fluency controlling for WLC, there was a
difference of about two-tenths of a standard deviation in informative paper quality as a result of
the total indirect effects. There was no evidence that students’ handwriting fluency was positively
associated with informative quality independent of the mediators when controlling for WLC (c0 = 0.011,
NS). Overall, when controlling for WLC, typing fluency and text length significantly mediated the
relationship between handwriting fluency and informative quality, but there was no significant direct
effect of handwriting fluency on informative quality.
4. Discussion
In our sample of fourth and fifth graders from typical classrooms in the Midwestern United
States, we found that, regardless of genre, a composite score representing word−level written
language skills—word recognition, spelling, and written vocabulary use—has both a significant
direct and a serial indirect (through typing fluency and then text length) effect on writing quality,
when controlling for handwriting fluency. Overall, a one standard deviation change in the WLC
corresponded to about a one-half standard deviation change in writing quality across genres, and about
20−32% of that change was due to indirect effects, depending on the genre. This finding implies two
things. One, stronger component literacy skills enhance typewritten text quality; spelling, vocabulary,
and reading performance each have been found to predict writing quality [13,36,43,44]. That is,
students who possess greater breadth and depth in their vocabulary knowledge and who are more
capable of decoding and encoding phonological and orthographic information can leverage these
abilities to write better papers. Our quality scale included a dimension devoted to precise and varied
language, which subsumes vocabulary use, and thus would be sensitive to individual variation
in semantic skills such as vocabulary use. However, we excluded writing conventions (including
spelling) as part of measured writing quality, so the direct influence of word-level literacy skills on
quality probably indicates that more proficient phonological and orthographic processing frees up
cognitive resources for other aspects of composing, which is in line with extant research (e.g., [46]).
Two, stronger component literacy skills are associated with increased typing fluency, which in turn
is related to higher text generation fluency, and finally these together positively impact typewritten
paper quality. Again, we believe this demonstrates how stronger foundation literacy skills reduce
the total cognitive load associated with writing, permitting students to divert adequate resources for
transcription and text generation fluency while composing on the computer.
Most importantly, we found that, regardless of genre, handwriting fluency had a significant
serial indirect effect on writing quality via typing fluency then text generation fluency (and via text
generation fluency alone), though no significant direct effect, when controlling for word-level literacy
skills. Overall, a one standard deviation change in handwriting fluency corresponded to about a
one-fifth to a one-third standard deviation change in writing quality, and about 64−96% of that change
was due to indirect effects, depending on the genre. Though the effects of handwriting fluency on
computer-generated paper quality are indirect, mediated by more proximal writing fluency factors,
namely typing fluency and text generation fluency, the fact that handwriting fluency matters even
when composing on the computer elevates the importance of this aspect of transcription regardless of
mode and adds to limited findings regarding cross-modal effects of transcription on writing quality [20].Educ. Sci. 2020, 10, 297 16 of 21
The indirect manner in which handwriting fluency transmits its effects to writing quality is anticipated
for students in late elementary grades; we may have very well observed direct effects if we had sampled
younger students for whom transcription is far less automatized cf. [13,22–24]. The indirect path
between handwriting fluency, text generation fluency, and writing quality deserves special mention.
Scholars have posited that greater transcription fluency, especially handwriting fluency (in older
students in particular), permits higher-level writing processes to occur more efficiently and effectively
during the parallel processing required for most writing tasks [54], whether measured by duration of
written language production bursts [55–57] or simply writing productivity or quality [11]. Our finding
that handwriting fluency transmits its effects on quality not only through typing fluency then text
generation fluency (as typing fluently permits one to produce more text in a given period of time)
but also just through text generation fluency complements this account of the special influence of
handwriting on composition. Overall, we see not only greater graphomotor fluency across modes of
transcription leads to higher quality typed papers, but also more fluent transcription by hand, with its
putative deep connections to other lower- and higher-level linguistic processes [15], benefits text
generation fluency, which itself results in better quality typed papers. Students who develop strong
proficiency with handwriting in elementary school, where most writing tasks still employ inscription
using a stylus (e.g., [58]), have probably accumulated greater flexibility with diverting cognitive effort
to idea generation and language formulation (text generation) for many writing tasks, including those
using a keyboard.
As anticipated, the existence of relations between antecedent and consequent variables in our
models was largely unaffected by genre, except for opinion writing quality, which appeared to rely
more heavily on typing fluency whether the focal antecedent was word-level literacy component skills
or handwriting fluency. This particular finding needs to be replicated, and we have no immediately
discernible rationale for it. More directly to the issue of whether genre impacted the strength of
the observed relations, we did find that informative writing had the largest associated indirect
effects regardless of whether handwriting fluency or word-level written language was the focal
antecedent variable. Informative papers were significantly shorter than narrative or opinion papers
(though qualitative differences across genres were not observed), suggesting that our informative
writing task, one in which students had to read and listen to a passage about an unfamiliar topic and
share what they learned from the passage in their papers, was likely the most challenging for the
children in our study. Our finding of stronger indirect effects for informative writing implies that
lower-level skills (both word-level literacy and transcription skills) are mediated to a greater extent
by higher-level (text generation) skills, and this is consistent with the hypothesis of Olive et al. [47],
who suggested that less familiar, more challenging writing tasks place a premium on higher-level
cognitive and linguistic skills and consequently will yield weaker relations between lower-level skills
and quality.
As with any study, ours possesses several significant limitations. First, we did not counterbalance
the administration of the handwriting and typing fluency tasks (handwriting fluency always was
measured prior to typing fluency). It is possible that order effects influenced the students’ performance
on these tasks. We elected to have students complete the handwritten paragraph copy task first along
with other paper and stylus tasks to streamline our group administration procedures. The typewritten
paragraph copy task was administered at least a week later, so we believe recall of the paragraph
had little influence on the results. Second, we did not collect samples of handwritten papers by
students—this made it impossible to fully evaluate the cross-modal effects of transcription and text
generation fluency. However, this was not the main purpose of our study and our findings still
contribute meaningfully to the small body of work on this topic. Third, our writing performance
task is confounded with fluency due to the timed nature of the task. It is likely students would have
written longer and qualitatively superior papers had they been provided with more time. Nevertheless,
we do not have reason to believe this would have altered the relationships between the antecedent and
consequent variables we investigated. Finally, we did not include sentence- or discourse-level languageYou can also read