An Analysis of the Operational Costs of Trucking: 2020 Update - November 2020
←
→
Page content transcription
If your browser does not render page correctly, please read the page content below

An Analysis of the Operational
Costs of Trucking: 2020 Update
                       November 2020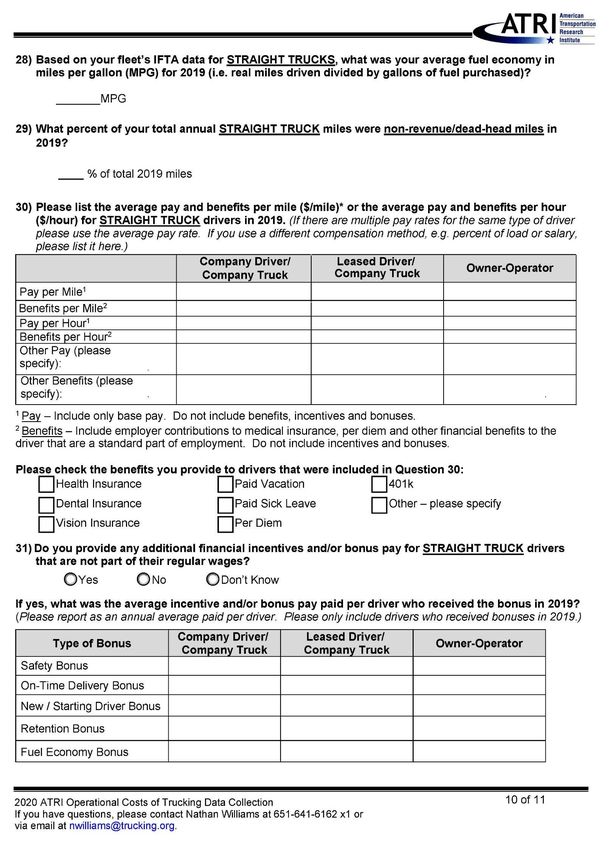
An Analysis of the Operational Costs of Trucking:
                   2020 Update

                     November 2020

                    Nathan Williams
                   Research Analyst
        American Transportation Research Institute
                    Minneapolis, MN

                      Dan Murray
                  Senior Vice President
        American Transportation Research Institute
                    Minneapolis, MN

                 950 N. Glebe Road, Suite 210
                   Arlington, Virginia 22203
                    TruckingResearch.org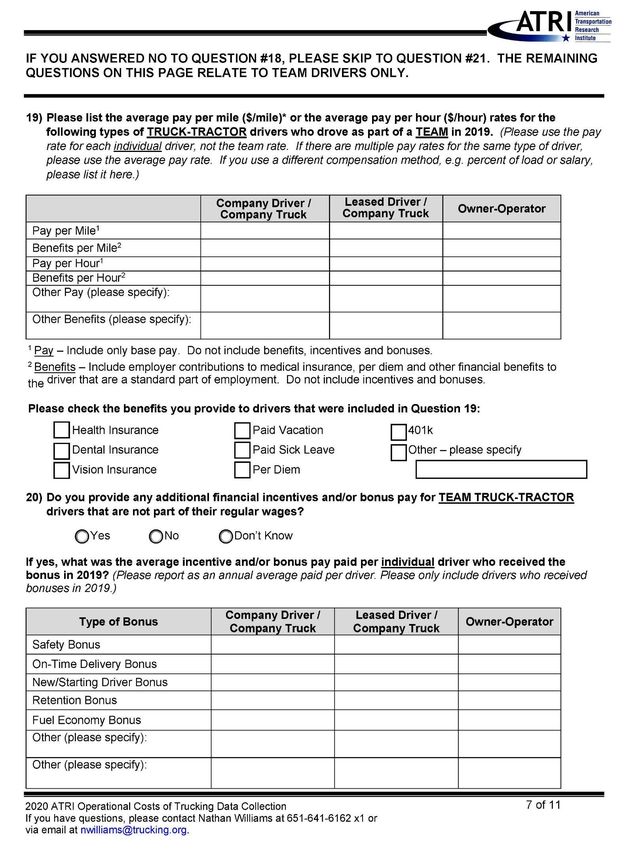
ATRI BOARD OF DIRECTORS

Judy McReynolds                    Dennis Nash
Chairman of the ATRI Board         Executive Chairman of the Board
Chairman, President and Chief      Kenan Advantage Group
Executive Officer                  North Canton, OH
ArcBest Corporation
Fort Smith, AR                     Brenda Neville
                                   President and CEO
Andrew Boyle                       Iowa Motor Truck Association
Co-President                       Des Moines, IA
Boyle Transportation
Billerica, MA                      James D. Reed
                                   President and CEO
Hugh Ekberg                        USA Truck
President and CEO                  Van Buren, AR
CRST International, Inc.
Cedar Rapids, IA                   Annette Sandberg
                                   President and CEO
Darren D. Hawkins                  Transsafe Consulting, LLC
Chief Executive Officer            Davenport, WA
YRC Worldwide
Overland Park, KS                  John A. Smith
                                   President and CEO
Derek Leathers                     FedEx Freight
President and CEO                  Memphis, TN
Werner Enterprises
Omaha, NE                          Rebecca Brewster
                                   President and COO
Robert E. Low                      ATRI
President and Founder              Atlanta, GA
Prime Inc.
Springfield, MO                    Chris Spear
                                   President and CEO
Rich McArdle                       American Trucking Associations
President                          Arlington, VA
UPS Freight
Richmond, VA

Benjamin J. McLean
Chief Executive Officer
Ruan Transportation Management
Systems
Des Moines, IA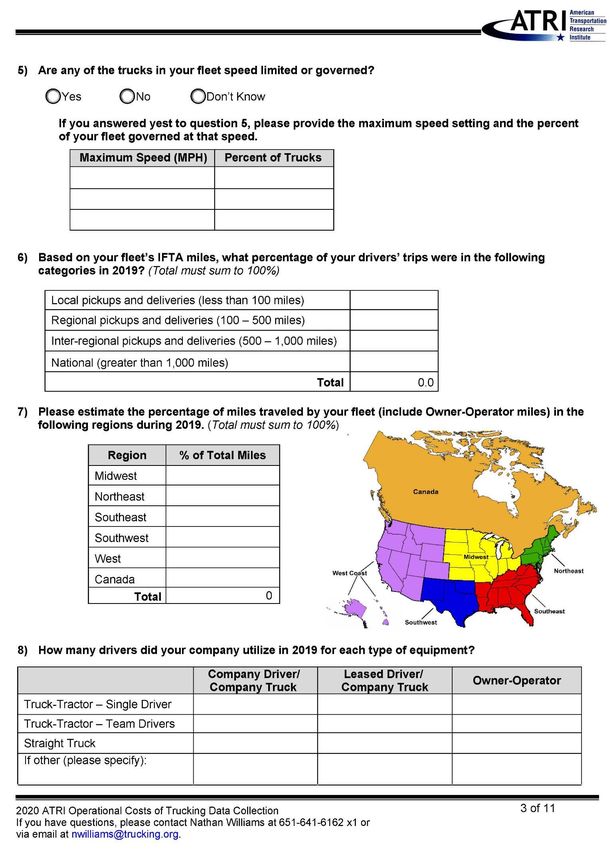
ATRI RESEARCH ADVISORY COMMITTEE

Karen Rasmussen, RAC             Stephen Laskowski               Steven Raetz
Chairman                         President                       Dir. Research & Market
Executive Director               Canadian Trucking Alliance      Intelligence
Independent Carrier Safety                                       C.H. Robinson Worldwide, Inc.
Association                      Don Lefeve
                                 President and CEO               Jeremy Reymer
Michael Ahart                    Commercial Vehicle Training     Founder and CEO
VP, Regulatory Affairs           Association                     DriverReach
Omnitracs LLC
                                 Kevin Lhotak                    Lee Sarratt
Thomas A. Balzer, CAE            President                       Director of Safety
President and CEO                Reliable Transportation         J.B. Hunt
Ohio Trucking Association        Specialists
                                                                 Mark Savage
Shawn R. Brown                   Mike Ludwick                    Retired Deputy Chief
Vice President of Safety         Chief Administrative Officer    Colorado State Patrol
Cargo Transporters               Bison Transport
                                                                 Kary Schaefer
Kenneth Calhoun                  Douglas B. Marcello, Esq        General Manager of Marketing
Fleet Optimization Manager       Transportation Attorney         and Strategy for Freightliner
Altec Service Group              Marcello & Kivisto, LLC         and Detroit Brands
                                                                 Daimler Trucks North America,
Alison Conway, Ph.D.             Jaime Maus                      LLC
Assistant Professor              Vice President of Safety and
The City College of New York     Compliance                      Russ Simpson
                                 Werner Enterprises, Inc.        America’s Road Team Captain
Robert P. Costello                                               Holland
Chief Economist and Senior       Caroline Mays
Vice President,                  Director, Freight and           Mike Stephens
International Trade Policy and   International Trade Section     Vice President of Finance
Cross-Border Operations          Texas DOT                       USA Truck, Inc.
American Trucking
Associations                     Shannon Newton                  Collin Stewart
                                 President                       President and CEO
Dan Drella                       Arkansas Trucking Association   Stewart Transport, Inc.
Director, Safety and Training
Schneider National, Inc.         Steve Olson                     Sara Walfoort
                                 President and Chief             Manager, Freight Planning
James P. Fields                  Underwriting Officer            Southwestern Pennsylvania
Chief Operating Officer          Great West Casualty Company     Commission
Pitt-Ohio, LLC
                                 Holly Pixler                    Tom Weakley
Victoria King                    Senior Director of              Director of Operations
VP, Public Affairs               Transportation and Logistics    Owner-Operator Independent
UPS                              Ardent Mills                    Drivers Association Foundation

James Langley                    John Prewitt                    Shawn Yadon
President                        President                       Chief Executive Officer
Trimble Transportation           Tideport Distributing, Inc.     California Trucking Association
TABLE OF CONTENTS

ACRONYMS .............................................................................................................................. 6
INTRODUCTION ....................................................................................................................... 7
RESEARCH OBJECTIVE .......................................................................................................... 7
METHODOLOGY ...................................................................................................................... 7
RESPONDENT DEMOGRAPHICS ............................................................................................ 9
     Size of Operation ............................................................................................................ 9
     Type of Operation ..........................................................................................................11
     Equipment .....................................................................................................................12
     Alternative Fuels ............................................................................................................14
     Fuel Efficiency ...............................................................................................................15
MOTOR CARRIER COSTS ......................................................................................................17
FINDINGS.................................................................................................................................18
      Driver Compensation .....................................................................................................23
                Driver Wages and Benefits ..............................................................................23
                Benefits ...........................................................................................................24
                Driver Bonuses ................................................................................................25
      Fuel Costs .....................................................................................................................27
      Equipment Costs ...........................................................................................................29
                Lease and Purchase Costs ..............................................................................30
                Repair and Maintenance..................................................................................30
                Truck Insurance Premiums ..............................................................................32
                Tires ................................................................................................................34
                Tolls .................................................................................................................35
                Permits and Special Licenses ..........................................................................35
      Regional Costs ..............................................................................................................35
      Driving the Trucking Industry: Small Carrier Spotlight ....................................................37
CONCLUSION ..........................................................................................................................39
APPENDIX – OPERATIONAL COSTS OF DATA COLLECTION FORM .................................41

  4                                                   An Analysis of the Operational Costs of Trucking: 2020 Update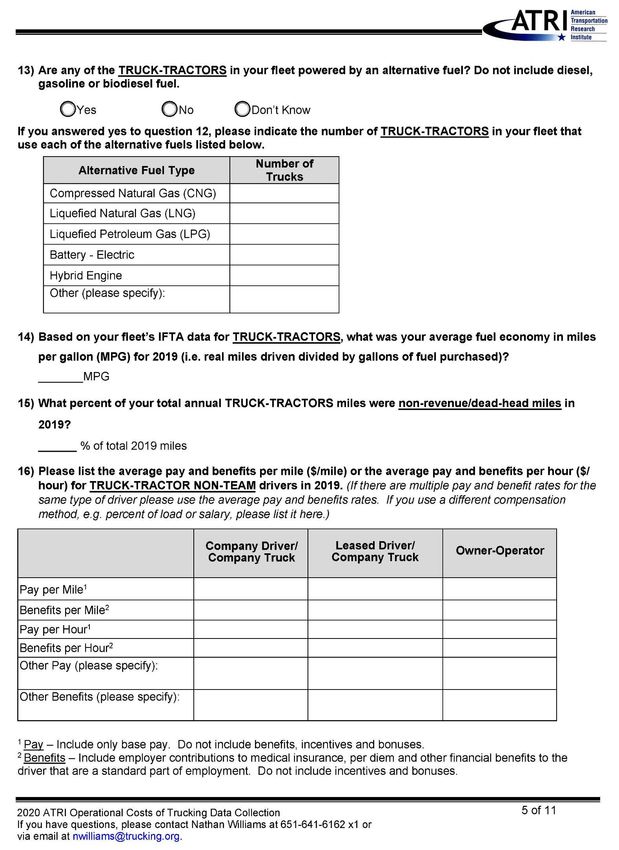
FIGURES AND TABLES

Table 1: For-Hire Industry Sector Breakout ........................................................................... 9
Figure 1: Respondent Fleet Size ............................................................................................10
Figure 2: Respondent Revenue..............................................................................................10
Table 2: Respondent Trip Types, 2016 to 2019 .....................................................................11
Table 3: Respondent Truck VMT and National Truck Registrations by Region .................12
Table 4: Respondent Equipment Characteristics .................................................................13
Table 5: Respondent Equipment Trade Cycle.......................................................................14
Table 6: Use of Alternative Fuel Vehicles ..............................................................................15
Figure 3: Average MPG by Year .............................................................................................16
Table 7: Respondent Reported Fuel Economy and Speed by Typical Operating Weight ..17
Table 8: Average Marginal Costs per Mile, 2011-2019 ..........................................................19
Table 9: Average Marginal Costs per Hour, 2011-2019 ........................................................20
Table 10: Annual Change of Average Marginal Costs ..........................................................21
Table 11: Share of Total Average Marginal Cost, 2011-2019................................................22
Table 12: Average Total Marginal Costs by Sector, 2011-2019 ............................................22
Figure 4: Driver Wages and Benefits per Mile, 2010-2019 ....................................................24
Table 13: ATRI Ops Costs Respondent Driver Benefits Offered .........................................25
Table 14: Single Driver Bonus Pay by Type ..........................................................................25
Figure 5: Diesel Prices and ATRI Fuel Cost per Mile Index, 2006-2019 ...............................27
Figure 6: Monthly U.S. On-Highway Diesel Prices, 2016-2019 .............................................28
Figure 7: Respondent Fuel Costs per Mile by Fleet Size......................................................29
Figure 8: Respondent Lease and Purchase Payments per Mile, 2010-2019 .......................30
Figure 9: Repair and Maintenance Cost per Mile by Size of Fleet .......................................31
Figure 10: Respondent Truck Insurance Premium Costs per Mile by Size of Fleet ...........33
Figure 11: ATRI Tire and Fuel Cost per Mile Indices, 2008-2019 .........................................34
Table 15: Average Marginal Cost per Mile by Region, 2019 .................................................36
Table 16: Average Marginal Cost per Mile by Fleet Size ......................................................37

An Analysis of the Operational Costs of Trucking: 2020 Update                                                             5
ACRONYMS

AOBRD       Automatic On-Board Recording Device
ATRI        American Transportation Research Institute
ATA         American Trucking Associations
CFO         Chief Financial Officer
CNG         Compressed Natural Gas
CPM         Cost per Mile
CPH         Cost per Hour
EIA         U.S. Energy Information Administration
ELD         Electronic Logging Device
FPM         Freight Performance Measures
LNG         Liquefied Natural Gas
LPG         Liquefied Propane Gas
LTL         Less-than-Truckload
MPG         Miles per Gallon
MPH         Miles per Hour
NPTC        National Private Truck Council
OPEC        Organization of the Petroleum Exporting Countries
Ops Costs   Operational Costs of Trucking
OTR         Over-the-Road
QCEW        Quarterly Census of Employment and Wages
RAC         Research Advisory Committee
STA         State Trucking Associations
TL          Truckload
VMT         Vehicle Miles Traveled

 6             An Analysis of the Operational Costs of Trucking: 2020 Update
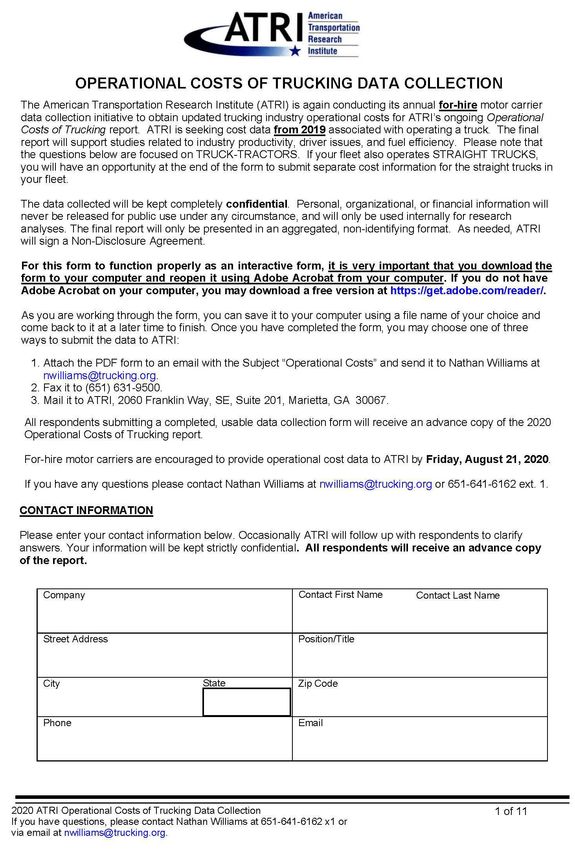
INTRODUCTION
The American Transportation Research Institute (ATRI) published the first iteration of
An Analysis of the Operational Costs of Trucking in 2008 with the goal of providing
accurate marginal cost data for the trucking industry. The need for this data in the
trucking industry was originally identified by ATRI’s Research Advisory Committee
(RAC) 1 as a top priority in 2008, and ATRI has continued to publish an annual update,
streamlining methodologies and updating the marginal costs of trucking on a yearly
basis.
Working with industry finance subject matter experts, ATRI developed a comprehensive
methodology to calculate key cost centers in the trucking industry. These cost centers
are further disaggregated by fleet size, sector, and region of operation. This research
provides a high-level benchmarking tool and serves as an information repository for
freight planning activities. This report details marginal cost data from 2019.
RESEARCH OBJECTIVE
ATRI’s Operational Costs of Trucking (Ops Costs) research derives from the need for
more accurate trucking industry operational cost data by motor carriers and government
transportation planners. The primary metrics focus on marginal line-item costs
associated with per-mile or per-hour operational costs. While previous outside studies
have provided operational cost measurements, many relied on modeled data and
subjective value-of-time metrics that were considered by industry experts to be
inaccurate or subjective. ATRI’s Ops Costs utilizes real-world data derived from
industry operations.
METHODOLOGY
The methodology for collecting and analyzing the data provided by for-hire motor
carriers has largely remained consistent to ensure that year-to-year comparisons
remain statistically salient. There were no new questions added to the 2020 Ops Costs
data collection form, but questions were reformatted for ease of response.
The following changes were made to the data collection form for 2020:
    •   Question #16: Average loading/dwell time per trip was removed;
    •   Question #17: Listed benefits were changed from an open-ended response to
        check-boxes listing specific benefits;
    •   Question #23: Electronic Logging Devices (ELD) and Automatic On-Board
        Recording Device (AOBRD) adoption question was removed.

The 2020 data collection form can be found in the Appendix. Participating motor carriers
were asked to provide a variety of data including fleet and driver demographic
1 ATRI’s Research Advisory Committee RAC is comprised of industry stakeholders representing motor carriers,
trucking industry suppliers, federal government agencies, labor and driver groups, law enforcement, and academia.
The RAC is charged with annually recommending a research agenda for the Institute.

An Analysis of the Operational Costs of Trucking: 2020 Update                                                   7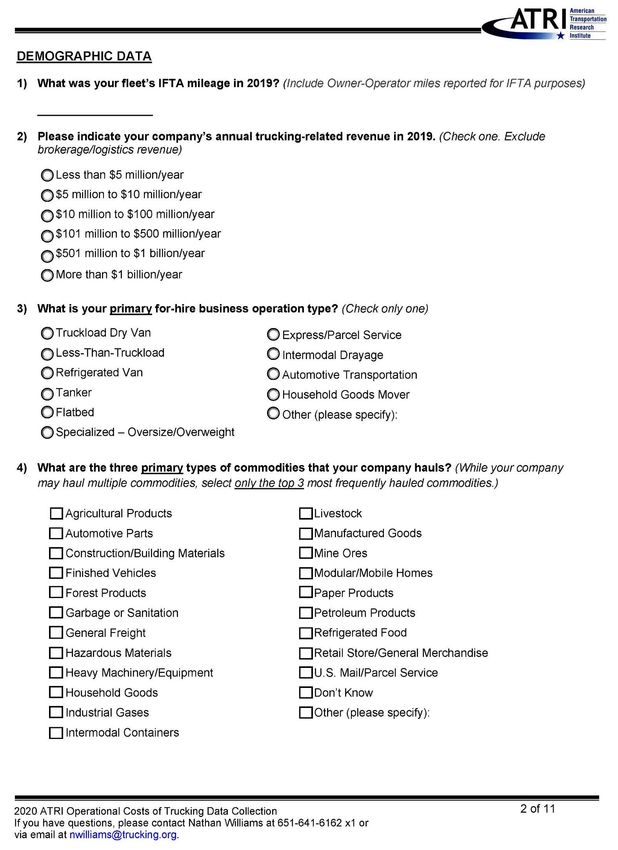
information to line-item costs per mile. To ensure validity and reliability across sectors,
the data collection form was confidentially tested with stakeholders from a variety of
industry sectors.
As line-item costs and fleet financial data are largely proprietary, ATRI’s data collection
process ensures confidentiality. Where requested, ATRI provided a non-disclosure
agreement to participating motor carriers. The underlying data is presented in
aggregate form only.
Data collection commenced in May 2020 with initial solicitation of data from long-
standing participants in ATRI’s Ops Costs research representing truckload (TL), less-
than-truckload (LTL) and specialized fleets. In addition, ATRI solicited further
participation by leveraging a number of channels, including emails, news alerts, and
coverage from industry trade press. Members of the 50 State Trucking Associations
(STA) were also asked submit cost data to ATRI. Respondents were able to submit
their data via mail, fax, or online submission, with a majority of carriers providing their
data through a secure online portal. ATRI staff reviewed each submittal and followed-
up with participants on any metrics that were in question. Responses were collected
through the end of September 2020.
The primary measures of the Ops Costs report focus on weighted average marginal
cost per mile (CPM) and weighted average marginal cost per hour (CPH). To
understand how costs change over time, these metrics are compared year-over-year.
The CPM metric was converted to the CPH metric through a speed metric derived from
ATRI’s Freight Performance Measures (FPM) program. 2 The most recent speed metric
calculated was 39.42 miles per hour (MPH).
ATRI weights respondents based on industry sector to ensure that the cost per mile for
the trucking industry as a whole represents its requisite parts. Different sectors of the
trucking industry have radically different costs. Specialized carriers and LTL carriers
report much higher costs per mile, especially in permit costs and pay per mile. To best
represent the total cost per mile, these costs are weighted by their impact on the
industry. Table 1 shows the sector breakout for the ATRI Ops Costs respondents as
well as how industry employment is distributed in the Bureau of Labor Statistics
Quarterly Census of Employment and Wages (QCEW). As shown in Table 1, ATRI’s
dataset is underrepresented by TL carriers, and overrepresented by Other/Specialized
carriers. Weighting the data using the QCEW percentages generates more
representative findings.

2 ATRI derived this speed using data from the ATRI Freight Performance Measures (FPM) program. ATRI analyzed
one full week of national FPM data in each of the four quarters in 2017 (February, May, August, October). This
dataset consisted of nearly 500 million truck speed data points. The 39.42 MPH figure is an update to the 39.98 MPH
figure used in previous iterations of this report, which was based on truck speed data from 2010. The average speed
figure was also validated by multiple motor carriers from various sectors of the industry. This speed figure more
accurately represents an average operational speed since it includes speeds in all types of operational conditions.

    8                                       An Analysis of the Operational Costs of Trucking: 2020 Update
Table 1: For-Hire Industry Sector Breakout
                                                    ATRI Ops
                                                                           U.S Trucking
                                                      Costs
                                                                             Industry 3
                                                   Respondents
                 Truckload                                       40%                     67%

                 Less-than-Truckload                             10%                     15%

                 Other/Specialized                               50%                     18%

Cost metrics were also weighted, as necessary, using fleet sector type, fleet size and
region of operation. This process provides more accurate insight into subsets of the
Ops Costs data, such as the cost of operations by region or by industry sector. As with
all data reported in this study, these subsets were only presented in aggregated form to
protect the confidential information submitted by individual carriers.
Thanks to an ongoing collaboration with the National Private Truck Council (NPTC),
which produces a somewhat similar benchmarking report among private fleets, ATRI is
able to juxtapose several of its for-hire cost metrics with those of private fleets (see
www.nptc.org for more information). While private fleets utilize a very different business
model, many of the externalities that affect for-hire truck costs create similar impacts
and pressures on private fleets, although their strategies for mitigating impacts are often
very different. In 2019, a slight majority of motor carriers (51.2%) were classified as for-
hire carriers, and 44.1 percent of carriers were classified as private. 4 In all cases, where
“2020 NPTC report data” is cited, it reflects truck data generated in 2019.
RESPONDENT DEMOGRAPHICS
Size of Operation
ATRI’s 2020 Ops Costs data included 188,029 trucks, consisting of 181,906 truck-
tractors, and 6,123 straight trucks. Additionally, the data includes 348,088 trailers of
varying types, and represents over 17 billion vehicle miles traveled. As shown in Figure
1, a plurality of the sample (31%) are from fleets of between 26 and 100 power units.
The average fleet size in the sample was 2,350 power units. In contrast to previous
years’ reports, 28 percent of this year’s sample came from fleets with over 1,000 power
units, an increase of 10 percentage points from the 2019 report. The ATRI average
fleet size skews considerably larger than the NPTC respondent sample, which had an
average private fleet size of 438 power units.

3 Quarterly Census of Employment and Wages. U.S. Department of Transportation. Bureau of Labor Statistics.

Available online: https://www.bls.gov/cew/
4 “American Trucking Trends – 2020.” American Trucking Associations. Arlington, VA.

An Analysis of the Operational Costs of Trucking: 2020 Update                                                9
Figure 1: Respondent Fleet Size
1%
9%
28%
31%
19%
13%
Less than 5 Power Units 5 - 25 Power Units
26 - 100 Power Units 101 - 250 Power Units
251 - 1,000 Power Units Greater than 1,000 Power Units
Fleet revenue was split into bins to aid in the analysis. A plurality of the carriers in the
sample (42%) listed their 2019 revenue as between $10 million and $100 million. The
full fleet revenue breakdown is shown in Figure 2.
Figure 2: Respondent Revenue
5% 12% 10%
12%
19%
42%
Less than $5 million $5 million to $10 million
$10 million to $100 million $101 million to $500 million
$501 million to $1 billion Greater than $1 billion
Empty miles, also known as “back haul” or “dead head” miles, place a serious strain on
for-hire fleet efficiency, as these miles accrue considerable operational costs without the
requisite customer revenue stream. The percent of deadhead miles in 2019 increased,
rising from 16.6 percent of total miles in 2018 to 20.1 percent in 2019, which may be
indicative of the freight slowdown in late 2019. Since it is easier to fill dead head
capacity on longer hauls (i.e. more shipper options in a larger geography), the general
10 An Analysis of the Operational Costs of Trucking: 2020 Updatetrend toward shorter truck trip lengths may reflect an unfortunate reality for future
increases in dead head miles.
Among private fleets, dead head miles are standard operating procedure in that private
fleets typically move goods one way: from manufacturers to buyers. Hence, 33 percent
of all private truck miles were empty in 2019. Private fleets have attempted to offset this
reality by obtaining for-hire operating authorities and selling the excess capacity to
interested shippers. Consequently, in the 2019 data, 56 percent of private fleets had
obtained their own operating authority, although two years earlier, 78 percent of private
fleets had their own operating authority. Again due to growing e-commerce and shorter
truck trips, it is questionable whether private fleets will be successful in filling empty
miles: in 2017 empty miles represented 26 percent of all miles, but that figure increased
to 33 percent just two years later.
Type of Operation
The for-hire trucking industry has experienced a dramatic shift in average trip lengths
with the rise of e-commerce, with average trip lengths shifting from approximately 800
miles per trip to approximately 500 miles per trip. 5 Similarly, a majority of the for-hire
trips (66%) in this year’s analysis were less than 500 miles in length. Table 2 details the
shift in trip types from 2016 to 2019. Trips under 500 miles increased in the sample by
4 percent, while trips over 1,000 miles have decreased by 3 percent. As documented in
ATRI’s report, “E-Commerce Impacts on the Trucking Industry,” intra-regional and last-
mile truck trips have decreased the overall average trip length by 37 percent from 2000
to 2018, and these trip lengths have continued to decrease in 2019. 6
Table 2: Respondent Trip Types, 2016 to 2019
2016 2019
Local pick-ups and deliveries (less than 100 miles) 21% 26%
Regional pick-ups and deliveries (100-500 miles) 40% 39%
Inter-regional pick -ups and deliveries (500-1,000 miles) 23% 22%
National (over 1,000 miles) 16% 13%
5 “How E-Commerce Continues to Reshape Trucking Industry Operations.” Security Business Capital. February
2020. Available online: https://www.mysbcapital.com/how-e-commerce-continues-to-reshape-trucking-industry-
operations/
6 Hooper, Alan, and Murray, Dan. “E-Commerce Impacts on the Trucking Industry.” The American Transportation
Research Institute. February, 2019. Arlington, VA.
An Analysis of the Operational Costs of Trucking: 2020 Update 11These same trip length changes were experienced by private fleets as well. In the 2020
NPTC report, average private truck trip lengths declined 10 miles from the previous year
to 225 miles; this is the third consecutive annual decrease in trip lengths for private
fleets. As previously noted, explanations included e-commerce impacts, traffic
congestion and re-engineering of supply chains and distribution hubs.
To compare the composition of ATRI’s Ops Costs sample to the larger U.S. trucking
industry, the participants’ percent of vehicle miles traveled (VMT) was compared to the
percent of U.S. truck registrations. In the sample, VMT indicates underrepresentation of
the Midwest and an overrepresentation of VMT in the Southeast.
Table 3: Respondent Truck VMT and National Truck Registrations by Region
Ops Costs Respondent
Share of U.S. Truck
Region Percent of Miles
Registrations 7
Traveled
Midwest 29% 40%
Northeast 14% 7%
Southeast 30% 19%
Southwest 10% 12%
West 14% 21%
Canada 3%
Total 100% 100%
Equipment
In 2019, the trucking industry hauled 11.84 billion tons of freight representing 72.5
percent of the total domestic tonnage in the U.S. 8 The percent of tonnage hauled by
trucks increased by 1.1 percentage points from 2018, where trucks accounted for 71.4
percent of total domestic tonnage shipped. 9 While 2018 had record freight demand,
2019 saw a rapid softening in freight due to the impacts of Chinese and American tariffs
on the U.S. trucking industry. 10
To ship freight across the U.S., the predominate vehicle used in the Ops Costs sample
was the truck-tractor, with approximately 182,000 in the sample. The heavy reliance of
truck-trailer combinations aligns with data that shows that combination trucks are
responsible for moving more than 75 percent of freight tonnage. 11 On average, these
truck tractors were 5.1 years old, a 0.7 year increase from last year’s Ops Costs report.
7 “Table MV-9: Truck and Truck-Tractor Registration – 2018.” 2018 Highway Statistics Series. Office of Highway
Policy Information, Federal Highway Administration, United States Department of Transportation. December 2019.
Available online: https://www.fhwa.dot.gov/policyinformation/statistics/2018/pdf/mv9.pdf
8 “American Trucking Trends 2020.” American Trucking Associations. Arlington, VA. 2020.
9 “American Trucking Trends 2019.” American Trucking Associations. Arlington, VA. 2019.
10 Adler, Alan. “Trucking Industry Threatened by Escalating U.S.-China Trade War.” Trucks.com. May 2019.
Available online: https://www.trucks.com/2019/05/15/trucking-industry-threatened-us-china-trade-war
11 “U.S. Freight Transportation Forecast to 2023.” American Trucking Associations. Arlington, VA. 2012.
12 An Analysis of the Operational Costs of Trucking: 2020 UpdateThe average number of miles driven per year for truck-tractors increased from 91,506
miles per year per truck in 2018 to 93,955 miles per year per truck in 2019, a 2.7
percent increase. Private truck annual miles are extremely similar in that their heavy-
duty truck miles averaged 91,600 miles, but their trend line decreased from the previous
year’s average of 96,000 miles.
In addition to truck-tractors, 6,123 straight trucks were also included in the ATRI
sample. Again, among these medium duty trucks, average trip lengths between ATRI’s
for-hire straight trucks and NPTC’s straight trucks were nearly identical: for-hire straight
trucks averaged 35,096 miles per year versus private fleet straight trucks at 33,000
miles annually. The full breakdown of equipment is shown in Table 4.
Table 4: Respondent Equipment Characteristics
Average Miles
Average Age
Equipment Type Number of Trucks/ Trailers Driven per Year
(Years)
per Truck
Straight Trucks 6,123 8.4 35,096
Truck-Tractors 181,906 5.1 93,955
Total Trucks 188,029
28' Trailers 126,686 8.1
33' Trailers 649 5.0
45' Trailers 1,811 9.2
48' Trailers 22,320 7.9
53' Trailers 143,736 6.2
Tank Trailer 16,505 16.7
Flatbed Trailer 5,395 5.3
Refrigerated Trailer 20,122 4.0
Intermodal Trailers 1,111 4.7
Other Trailers 9,753 11.0
Total Trailers 348,088
The average age of these trucks increased from 4.4 years in 2018 to 5.1 years in 2019,
indicative of the dramatic fall in truck orders from 2018 to 2019. 12 By November of 2019,
truck orders had fallen to their lowest monthly level since 2015. In addition to average
age, the data collection form also asked for the average trade cycle for both trucks and
trailers. Table 5 details the trade cycle for straight trucks, truck-tractors, and trailers.
12Stinson, Jim. “2019: Freight Market Slowdown, Tariffs Diminished Trucking Industry’s Performance.” December,
2019. Transport Topics. Available online: https://www.ttnews.com/articles/2019-freight-market-slowdown-tariffs-
diminished-trucking-industrys-performance
An Analysis of the Operational Costs of Trucking: 2020 Update 13Table 5: Respondent Equipment Trade Cycle
Average Miles
Equipment Average Number of Years
Driven Until
Type Until Replacement
Replacement
Straight Trucks 10.2
Truck-Tractors 6.8 585,294
Trailers 12.8
In 2019, straight trucks had an average trade cycle of 10.2 years, while truck-tractors
had an average trade cycle of 6.8 years, or approximately 585,000 miles.
The average trade cycle in ATRI’s Ops Costs decreased in both years and miles for
truck-tractors, decreasing from the 2019 report average of 7 years or 700,000 miles.
The average trade cycle for trailers was 12.8 years, which varies based on the type of
trailer. The trade cycle for trailers is a slight decrease from last year’s Ops Cost report,
which showed an average of 13.3 years before trade. The average number of years
before replacing of truck-tractors in the sample decreased slightly from 2018, going from
7 years on average to 6.8 years on average. This decrease in the trade cycle may be
due to the increase in truck sales in 2018. 13
Alternatively, private truck fleets that had their own in-house maintenance – as is the
case for most for-hire fleets – held their trucks slightly longer than for-hire fleets, with a
mean trade cycle for private trucks of 7.0 years or 738,000 miles in 2019.
Alternative Fuels
In 2019, approximately 15 percent of the respondents indicated that their fleets used
some form of alternative fuel. This is a 2.0 percentage point increase over 2018.
Compressed natural gas (CNG) continued to have the highest rate of adoption among
Ops Costs carriers in 2019, with 8.8 percent of carriers having at least one truck which
utilizes CNG (Table 6). Liquid natural gas (LNG) had the second highest percentage of
adoption among carriers, with 6.3 percent of carriers reporting at least one truck which
utilizes LNG. Surprisingly, 5 percent of carriers indicated that they had at least one
battery-powered truck. However, only 8 trucks total in the sample utilized battery power,
indicating low overall adoption.
13 Ibid.
14 An Analysis of the Operational Costs of Trucking: 2020 UpdateTable 6: Use of Alternative Fuel Vehicles
Percent of ATRI Ops
Alternative Fuel
Costs Respondents
Type
Using Alternative Fuels
CNG 8.8%
LNG 6.3%
LPG 1.3%
Battery 5.0%
Hybrid 1.3%
According to ACT Research, after falling 15 percent in 2018, 2019 saw a 20 percent
increase in natural gas-fueled trucks. 14 While adoption stays low, the number of trucks
utilizing alternative fuels is increasing. This relatively low adoption rate can be
attributed to a number of factors, including the lack of adequate fueling/charging
stations and high switching cost associated with alternative fuels. 15 Due to a strong
2018, as well as the increased investment in trucks, the percent of carriers utilizing
alternative fuels increased by 2 percentage points.
While 85 percent of NPTC’s private fleets invested in “green technologies,” only 5
percent indicated that they use alternative energy trucks – indicating that alt fuels are
three times more common among for-hire carriers.
Fuel Efficiency
Truck-tractors in the sample experienced an increase in miles per gallon (MPG) from
2018 to 2019, from 6.4 MPG to 6.5 MPG. Technology plays a significant role in greater
fuel economy, and speed limiter use and updated engines both lead to greater fuel
efficiency. The increase in MPG in Ops Costs sample is indicated in Figure 3.
14 McNealy, Jennifer. “ACT Research: Class 8 Natural Gas Truck Retail Sales Rose 20% YTD 2019 through
November.” ACT Research. Available online: https://content.actresearch.net/blog/act-research-afq-class-8-natural-
gas-truck-retail-sales-rose-20-ytd-2019-through-november
15 Gilroy, Roger. “Trucking to Turn to More Alternative Fuels, Experts Say.” Transport Topics. October 2018.
Available online: https://www.ttnews.com/articles/trucking-turn-more-alternative-fuels-experts-say
An Analysis of the Operational Costs of Trucking: 2020 Update 15Figure 3: Average MPG by Year
6.6
6.55
6.5
6.45
Miles per Gallon
6.4
6.35
6.3
6.25
6.2
6.15
2015 2016 2017 2018 2019
Year
Speed limiters also play a role in the increased fuel efficiency present in the
sample. From 2018 to 2019, the percent of fleets which utilized speed limiters
increased from 90 percent to 91 percent. The increase in speed limiter use also was
mirrored in terms of percent of adoption rate of speed limiters. In 2018, 88 percent of
fleets which used speed limiters reported that all of their trucks had speed limiters, and
that number increased to 90 percent in 2019. Private fleets ranked speed governors as
their number one strategy for managing fuel economy and environmental impacts.
In conjunction with the increase in speed limiter adoption, the average operating speed
of the sample decreased from 50.8 MPH in 2018 to 49.3 MPH in 2019. These factors
would further explain the increase in MPG, as speed plays a major factor fuel
efficiency.
The surge of new truck purchases in 2018 may have played a substantial role in the
increase in gas mileage, as newer trucks tend to have significantly better gas mileage
than older Class 8 trucks. 16
In Table 7, truck MPG and speed are broken out across the gross vehicle weight of the
sample. The average operating weight in 2019 was approximately 63,000 pounds.
Generally, as truck weights increase, fuel MPG decreases, with some mild variation as
truck weights increase
16 Ibid
16 An Analysis of the Operational Costs of Trucking: 2020 UpdateTable 7: Respondent Reported Fuel Economy and Speed by Typical Operating
Weight
Average Moving
Typical Operating Weight MPG
Speed (MPH)
Less than 20,000 lbs. 6.8 49
20,001 - 40,000 lbs. 6.4 49
40,001 - 60,000 lbs. 7.0 42
60,001 - 80,000 lbs. 6.6 51
Greater than 80,000 lbs. 5.1 47
MOTOR CARRIER COSTS
Line-item cost trends are difficult to interpret, as the external factors which impact them
are diverse and dynamic. Lease and purchase costs can vary dramatically based on
year of purchase and type of equipment purchased. Repair and maintenance costs can
vary based on type of service required and type of truck purchased. With this in mind,
ATRI worked closely with industry experts to identify which areas of marginal cost are
most pertinent and statistically salient.
To retain the ability to compare Ops Costs data over time, the same cost centers and
data collection methodologies analyzed in this report have been utilized over the 13-
year time period that the Ops Costs report has been published. Divided into two
general cost centers of interest, these are vehicle-based costs and driver-based costs.
These costs are listed below.
• Vehicle-based
o Fuel
o Truck/Trailer Lease or Purchase Payments
o Repair and Maintenance Costs
o Truck Insurance Premiums
o Permits and Special Licenses
o Tolls
• Driver-based
o Wages
o Benefits
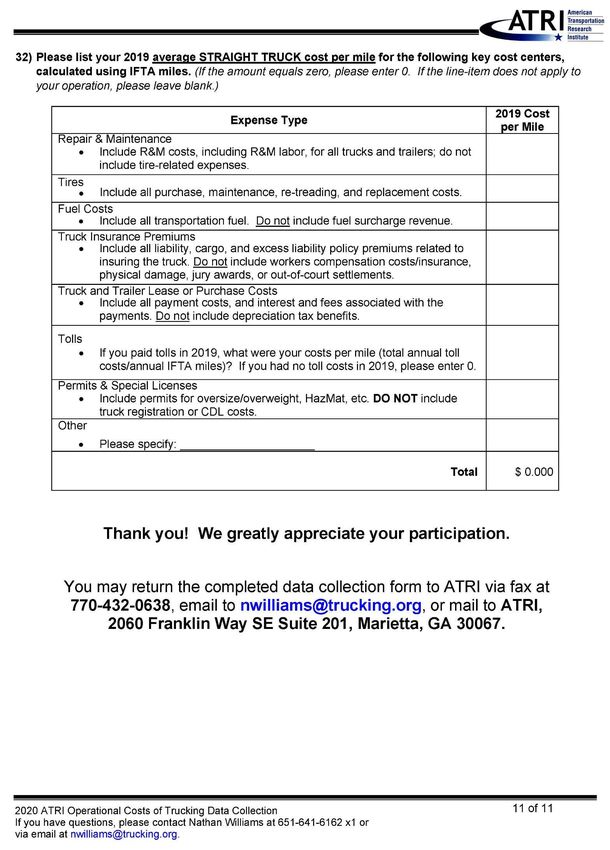
An Analysis of the Operational Costs of Trucking: 2020 Update 17FINDINGS In 2019, the average cost per mile for fleets decreased dramatically due to the reduction of a number of line-item costs, including fuel, repair and maintenance, and wages and benefits. In 2018, trucking encountered record demand and the highest tonnage in the last 20 years. 17 In the contraction that followed in 2019, a number of independent factors were at play to lower the operational costs of trucking, which are explained in greater detail in the following sections. In 2019, the costs of trucking contracted significantly from $1.821 to $1.652, a decrease of 9 percent. In addition, the cost per hour was approximately $65.11, down from $71.78 in last year’s report. These two metrics are shown in Tables 8 and 9. During this same time period, private truck costs (all trucks) increased from $2.73 in 2018 to $2.80 in 2019. While NPTC cost metrics include fixed “administrative” costs, it should be noted that those administrative costs decreased from 29 cents per mile in 2018 to 24 cents per mile in 2019. The growing cost differential between for-hire and private fleets may move more private fleet trips to for-hire carriers in the future. 17 Adler, Alan. “Freight Growth to Slow in New Year After Smashing Records in 2018.” January 2019. Trucks.com. Available online: https://www.trucks.com/2019/01/02/freight-growth-slow-after-smashing-records-2018/ 18 An Analysis of the Operational Costs of Trucking: 2020 Update
Table 8: Average Marginal Costs per Mile, 2011-2019 18

    Motor Carrier Costs                     2011        2012         2013         2014        2015         2016         2017        2018         2019

Vehicle-based

  Fuel Costs                               $0.590       $0.641      $0.645       $0.583      $0.403       $0.336       $0.368      $0.433       $0.396
  Truck/Trailer Lease or
                                           $0.189       $0.174      $0.163       $0.215      $0.230       $0.255       $0.264      $0.265       $0.259
  Purchase Payments
  Repair & Maintenance                     $0.152       $0.138      $0.148       $0.158      $0.156       $0.166       $0.167      $0.171       $0.143

  Truck Insurance Premiums                 $0.067       $0.063      $0.064       $0.071      $0.074       $0.075       $0.075      $0.084       $0.068

  Permits and Licenses                     $0.038       $0.022      $0.026       $0.019      $0.019       $0.022       $0.023      $0.024       $0.023

  Tires                                    $0.042       $0.044      $0.041       $0.044      $0.043       $0.035       $0.038      $0.038       $0.036

  Tolls                                    $0.017       $0.019      $0.019       $0.023      $0.020       $0.024       $0.027      $0.030       $0.034

Driver-based

  Driver Wages                             $0.460       $0.417      $0.440       $0.462      $0.499       $0.523       $0.557      $0.596       $0.533

  Driver Benefits                          $0.151       $0.116      $0.129       $0.129      $0.131       $0.155       $0.172      $0.180       $0.160

TOTAL                                      $1.706       $1.633      $1.676       $1.703      $1.575       $1.592       $1.691      $1.821       $1.652

   18To ensure data quality standards on highly volatile cost metrics, some of the tables in the analysis used a sample of data from multi-year carrier participants
   only. This ensures that data collection procedures, formulas and business models are replicated, and hence comparable, year-to-year – thus eliminating potential
   anomalies and outliers.

    An Analysis of the Operational Cost of Trucking: 2020 Update                                                                                                19
Table 9: Average Marginal Costs per Hour, 2011-2019
Motor Carrier Costs 2011 2012 2013 2014 2015 2016 2017 2018 2019
Vehicle-based
Fuel Costs $23.58 $25.63 $25.78 $23.29 $16.13 $13.45 $14.50 $17.07 $15.62
Truck/Trailer Lease or
$7.55 $6.94 $6.52 $8.59 $9.20 $10.20 $10.39 $10.45 $10.21
Purchase Payments
Repair & Maintenance $6.07 $5.52 $5.92 $6.31 $6.23 $6.65 $6.58 $6.72 $5.62
Truck Insurance Premiums $2.67 $2.51 $2.57 $2.86 $2.98 $3.00 $2.95 $3.32 $2.68
Permits and Licenses $1.53 $0.88 $1.04 $0.76 $0.78 $0.88 $0.92 $0.95 $0.90
Tires $1.67 $1.76 $1.65 $1.76 $1.72 $1.41 $1.50 $1.50 $1.42
Tolls $0.69 $0.74 $0.77 $0.90 $0.79 $0.97 $1.05 $1.17 $1.34
Driver-based
Driver Wages $18.39 $16.67 $17.60 $18.46 $19.95 $20.91 $21.97 $23.50 $21.01
Driver Benefits $6.05 $4.64 $5.16 $5.15 $5.22 $6.18 $6.78 $7.10 $6.31
TOTAL $68.21 $65.29 $67.00 $68.09 $62.98 $63.66 $66.65 $71.78 $65.11
20 An Analysis of the Operational Costs of Trucking: 2020 UpdateAs shown in Table 10, between 2018 and 2019, most line-item metrics decreased for
both cost per mile and cost per hour. The two largest percentage decreases came from
repair and maintenance costs and truck insurance premiums. In addition, fuel costs
decreased by 9 percent, reflecting the national decrease in average diesel fuel prices of
$0.12 from 2018 to 2019. 19 While wages and benefits decreased from 2018 to 2019,
wages still remained at one of their highest levels in ATRI’s Ops Costs data collection.
Furthermore, as detailed below, driver bonuses showed large increases this year, costs
which are not calculated as part of the CPM data in Tables 8 and 9.
Table 10: Annual Change of Average Marginal Costs
2018-2019
Motor Carrier Costs
Change
Vehicle-based
Fuel Costs -9%
Truck/Trailer Lease or Purchase Payments -2%
Repair & Maintenance -16%
Truck Insurance Premiums -19%
Permits and Licenses -5%
Tires -5%
Tolls 15%
Driver-based
Driver Wages -11%
Driver Benefits -11%
TOTAL -9%
Despite the decrease in overall cost per mile, the relative share – indicated as a
percentage of total cost – for each line-item remained fairly constant, with little
fluctuation between 2018 and 2019. The largest single line-item cost continued to be
driver wages, representing 32 percent of the operating cost per mile. However, the
combined percentage of driver wages and benefits fell slightly, from 43 percent in 2018
to 42 percent in 2019. Percent share of lease and purchase payments increased by 1
percentage point from 2018. These results are shown in Table 11.
To further explain the increase in private truck costs during this same time period, the
NPTC report shows that the following cost centers all saw increases:
• Equipment purchases
• Repair & maintenance
• Fuel (slightly)
• Driver wages & benefits
• Permits & licenses
19Average Diesel Price calculated from Weekly Retail Gas and Diesel Prices. U.S. Energy Information
Administration. Available online: https://www.eia.gov/dnav/pet/pet_pri_gnd_dcus_nus_w.htm
An Analysis of the Operational Cost of Trucking: 2020 Update 21Table 11: Share of Total Average Marginal Cost, 2011-2019
Motor Carrier Costs 2011 2012 2013 2014 2015 2016 2017 2018 2019
Vehicle-based
Fuel Costs 35% 39% 38% 34% 26% 21% 22% 24% 24%
Truck/Trailer Lease
or Purchase 11% 11% 10% 13% 15% 16% 16% 15% 16%
Payments
Repair &
Maintenance 9% 8% 9% 9% 10% 10% 10% 9% 9%
Truck Insurance
Premiums 4% 4% 4% 4% 5% 5% 4% 5% 4%
Permits and Licenses 2% 1% 2% 1% 1% 1% 1% 1% 1%
Tires 2% 3% 2% 3% 3% 2% 2% 2% 2%
Tolls 1% 1% 1% 1% 1% 2% 2% 2% 2%
Driver-based
Driver Wages 27% 26% 26% 27% 32% 33% 33% 33% 32%
Driver Benefits 9% 7% 8% 8% 8% 10% 10% 10% 10%
TOTAL 100% 100% 100% 100% 100% 100% 100% 100% 100%
All for-hire industry sectors experienced a decrease in the cost per mile from 2018 to
2019 (Table 12). The largest percentage decrease came from truckload carriers, where
the cost per mile decreased by over 9 percent. Specialized/Other carrier cost per mile
was $1.85, representing a decrease of over 8 percent. Less-than-truckload carriers
reported the smallest decrease in costs, only 3.5 percent in 2019.
While the NPTC report segmented the industry by trailer type, rather than sector,
analogies can still be drawn between for-hire and private fleets. Within the private
fleets, Bulk/Tank operations were the highest grouping at $3.16 per mile and Van
operations (TL) were on the low end at $2.45 per mile. NPTC flatbeds had the lowest
private fleet cost per mile at $2.31, while ATRI’s flatbed cost per mile was second
lowest at $1.74.
Table 12: Average Total Marginal Costs by Sector, 2011-2019
Sector 2011 2012 2013 2014 2015 2016 2017 2018 2019
LTL $1.93 $1.79 $1.84 $1.83 $1.60 $1.74 $1.84 $1.92 $1.85
Specialized
$1.79 $1.73 $1.67 $1.85 $1.72 $1.83 $1.95 $2.02 $1.85
/ Other
TL $1.57 $1.51 $1.60 $1.58 $1.50 $1.42 $1.49 $1.71 $1.55
22 An Analysis of the Operational Cost of Trucking: 2020 UpdateLine Item Costs Driver Compensation Driver compensation has consistently represented the highest percentage of the cost per mile, with just three years in ATRI’s Ops Costs analyses where fuel represented a higher percentage of the overall cost per mile. Despite the decrease in wage and benefit costs from 2018 to 2019, wages and benefits are higher than in 2016, the last time that freight demand experienced a softening similar to 2019. Even with freight demand softening in 2019, the driver shortage continued to persist throughout the year, and is expected to worsen in the coming decade. Current projections have the shortage topping 160,000 drivers by 2028. 20 The driver shortage is due to multiple factors including the lack of young people choosing a career in driving and a rapidly aging workforce, 21 in addition to more recent COVID-19-related impacts on the industry’s workforce. 22 Driver Wages and Benefits In 2019, 42 percent of the total line-item cost, 69.3 cents per mile, went toward driver pay and benefits. This is down from an all-time high of 77.6 cents per mile in 2018. Wages and benefits are still higher than in previous years, with a 1.6 cent increase over the last freight softening which took place in 2016. 23 From 2010 to 2019, the wages and benefits cost per mile is approximately 10 cents higher. Figure 4 details wages and benefits from the last 10 years of Ops Costs data collection. 20 Costello, Bob and Alan Karickhoff. “Truck Driver Shortage Analysis: 2019.” American Trucking Associations. 21 Short, Jeffrey. “Analysis of Truck Driver Age Demographics Across Two Decades.” American Transportation Research Institute. Arlington, VA. December 2014. 22 “Critical Issues in the Trucking Industry – 2020.” The American Transportation Research Institute. Arlington VA. October 2020. 23 Bays, Josh. “Signs of Softening in US Truck Demand.” Site Selection Group Blog. July 22, 2016. Available online: https://info.siteselectiongroup.com/blog/which-manufacturers-sectors-are-looking-to-hire-0 An Analysis of the Operational Costs of Trucking: 2020 Update 23
Figure 4: Driver Wages and Benefits per Mile, 2010-2019
                                 $0.900

                                 $0.800
     Pay and Benefits per Mile

                                 $0.700

                                 $0.600

                                 $0.500

                                 $0.400

                                 $0.300

                                 $0.200

                                 $0.100

                                 $0.000
                                          2010   2011   2012      2013      2014   2015        2016   2017   2018    2019
                                                                               Year

                                                               Driver PPM    Driver Benefits

It is well understood that private fleet drivers receive higher compensation than for-hire
drivers. In 2019, private fleet drivers (all trucks) were paid approximately $1.35 per mile
in combined wages, benefits and bonuses. ATRI’s for-hire combined driver wages and
benefits in 2019 was 69.3 cents per mile. It is interesting to note that, among private
fleets that provide “guaranteed minimum compensation,” the maximum cost-per-mile
provided was 52.5 cents – closely mirroring for-hire driver wages of 53.3 cents per mile.
Benefits
Benefits offered to drivers varied across trucking fleets and industry sectors.
Respondents were asked to choose which benefits they offered, including:
       •                          health insurance;
       •                          paid vacation;
       •                          401K;
       •                          dental insurance;
       •                          paid sick leave;
       •                          vision insurance;
       •                          per diems;
       •                           “other benefits.”

Motor carriers use these benefits as another way to attract and retain drivers.
According to the American Trucking Associations’ latest Driver Compensation report, 95

24                                                                An Analysis of the Operational Cost of Trucking: 2020 Update
percent of carriers provide health insurance and 92 percent of carriers offered paid
leave. 24 ATRI’s Ops Costs respondents similarly provided health insurance, paid leave,
and other benefits to their drivers as shown in Table 13.
Table 13: ATRI Ops Costs Respondent Driver Benefits Offered
Percent Offered
Health Insurance 91%
Paid Vacation 88%
Dental Insurance 71%
401K 70%
Vision Insurance 58%
Paid Sick Leave 44%
Per Diem 39%
Other Benefits 25%
The most prevalent type of benefit offered to drivers was health insurance, with 91
percent of respondents indicating that their fleet offered health insurance to their drivers.
In contrast, only 39 percent of respondents reported that per diems were offered. The
relatively small percentage of per diems is due to two factors; tax code changes in per
diems and shortening trip length (Table 2). It is expected that the percent of companies
offering per diems may increase, as the tax savings for drivers can be significant if
structured correctly. 25
Driver Bonuses
In addition to pay and benefits, many of ATRI’s Ops Costs respondents offered
additional financial incentives to their drivers. These “performance” bonuses were
awarded for a number of reasons, including starting/new hire, safety, and retention. On
average, all bonuses increased from 2018, indicating that while driver wages fell, other
incentives for drivers increased. The average annual amount for each of the bonuses is
listed in Table 14.
Table 14: Single Driver Bonus Pay by Type
Bonus Type 2018 2019 Annual Change (%)
Safety $1,238 $1,373 10.9%
Starting $1,562 $1,846 18.2%
Retention $672 $1,218 81.3%
24 Karickhoff, Alan and Bob Costello. “ATA 2020 Driver Compensation Study.” American Trucking Associations.
Arlington, VA. May 2020.
25 Straight, Brian. “Ending the Confusion over Per Diem.” Freightwaves. January 2018. Available online:
https://www.freightwaves.com/news/2018/1/16/ending-the-confusion-over-per-diem
An Analysis of the Operational Costs of Trucking: 2020 Update 25Safety bonuses saw an increase of approximately 11 percent from 2018 to 2019, from $1,238 to $1,373. Companies are incentivized to invest in safety, as large verdicts due to crashes have been increasing over time and putting strain on businesses. 26 This average safety bonus amount represents the highest safety bonus in the last three years. This may be an attempt to combat an increase in large truck crashes by offering larger incentives to the safest drivers. The average starting bonus increased as well from 2018, from $1,562 in 2018 to $1,846 in 2019 – an increase of 18 percent. This increase further represents the competition present among fleets for recruiting high-quality drivers. As the driver shortage worsens, higher starting bonuses are likely to become commonplace, with annual increases likely. Average retention bonuses increased by over 80 percent from 2018 to 2019. In 2018, retention bonuses dropped almost 20 percent, from $836 in 2017 to $672 in 2018. The average retention bonus in 2019 was $1,235. The increase in retention bonuses coincides with the increase in driver starting bonuses, as recruiting and retaining qualified drivers is a top priority for fleets. According to ATRI’s “Critical Issues in the Trucking Industry – 2020,” driver retention was the 6th most critical issue in the trucking industry this year. 27 Despite the decrease in wages and benefits per mile for drivers, the increase in bonuses still indicates that the driver shortage is at the forefront of carriers’ priorities. Looking Forward Despite the dip in driver wages and benefits in 2019, driver compensation is expected to surge back in 2020 due to COVID-19. As more Americans sheltered and worked from home, consumer demand increased for delivered goods and e-commerce. According to J.P Morgan, the U.S. spent $211.5 billion on e-commerce in the second quarter of 2020, an increase of almost 32 percent quarter over quarter. 28 While trucking demand increased for many carriers in 2020, some fleets did not have the excess capacity to meet that demand. As a result, that capacity transferred to the spot market. 29 In September 2020, DAT Freight and Analytics reported that spot load posts doubled from 2019, and van rates increased by 28.9 percent year over year in September. 30 As the pandemic continues to surge across the U.S. in 2020, demand for trucking has placed greater strain on capacity. With increasing demand and stagnating capacity, 26 Murray, Dan, Williams, Nathan, and Speltz, Erin. “The Impact of Nuclear Verdicts on the Trucking Industry.” American Transportation Research Institute. Arlington, VA. June 2020. 27 “Critical Issues in the Trucking Industry – 2020.” The American Transportation Research Institute. October, 2020. 28 “How COVID-19 Has Transformed Consumer Spending Habits.” J.P. Morgan. September, 2020. Available online: https://www.jpmorgan.com/solutions/cib/research/covid-spending-habits 29 Shultz, John D. “Fall trucking levels surprisingly high as industry rebounds from COVID-19 shutdown.” Logistics Management. September 2020. Available online: https://www.logisticsmgmt.com/article/fall_trucking_levels_surprisingly_high_as_industry_rebounds_from_covid_19_s 30Hitch, John. “Spot rates ‘unseasonably strong’ for September 2020.” October 2020. American Trucker. Available online: https://www.trucker.com/equipment/trucks/article/21144399/spot-rates-unseasonably-strong-for-september- 2020 26 An Analysis of the Operational Cost of Trucking: 2020 Update
spot rates will continue to increase. With this in mind, trucking wages will continue to
follow trends in the spot rates, which have remained strong throughout 2020. 31
Fuel Costs
Fuel costs remained the second-highest line-item cost in 2019, despite dropping
considerably from 2018. In 2019, fuel costs per mile were 39.6 cents per mile,
decreasing from 43.3 cents per mile in last year’s report. Dropping almost 9 percent
from 2018 to 2019, most of the fuel cost decrease can be attributed to substantially
lower diesel costs in 2019. The average diesel price in 2019 was $3.06.
Among private fleets, fuel costs were the third highest cost center after labor and
equipment investment, and remained stagnant from 2018 to 2019 at 45 cents per mile.
The ATRI-developed fuel cost index (Figure 5) closely tracks with the average price of
diesel fuel in 2019, further validating the accuracy of the Ops Costs dataset.
                             Figure 5: Diesel Prices and ATRI Fuel Cost per Mile Index, 2006-2019
                           160

                           150

                           140

                           130
      Index (100 = 2006)

                           120

                           110

                           100

                            90

                            80

                            70
                                 2006 2007 2008 2009 2010 2011 2012 2013 2014 2015 2016 2017 2018 2019

                                               Diesel Price Index   ATRI Fuel CPM Index

Fuel prices experienced a precipitous drop in at the beginning of 2019, falling from
$3.34 in early November 2018 to $2.97 in early February 2019. The price of diesel
stagnated the rest of the year, fluctuating around $3.00 per gallon for diesel. The

31   Ibid.

An Analysis of the Operational Costs of Trucking: 2020 Update                                            27
fluctuations are shown in Figure 6. Even with fuel price stagnation throughout 2019,
prices were markedly higher than the low point in 2016. 32
Figure 6: Monthly U.S. On-Highway Diesel Prices, 2016-2019 33
$3.50
$3.30
$3.10
Cost per Gallon
$2.90
$2.70
$2.50
$2.30
$2.10
$1.90
Date
Fuel costs are dependent on a number of complex factors beyond simple oil market
economics. For example, fleet size can be an important factor in fuel expenses, as
firms with more market power can negotiate better pricing contracts with petroleum
suppliers. Larger fleets also tend to operate newer, more fuel efficient trucks, further
decreasing the cost of the fuel per mile. As expected, the cost per mile for diesel has
an inverse relationship with the size of the respective fleet (Figure 7).
32 Average Diesel Price calculated from Weekly Retail Gas and Diesel Prices. U.S. Energy Information
Administration. Available online: https://www.eia.gov/dnav/pet/pet_pri_gnd_dcus_nus_w.htm
33 Average Diesel Price calculated from Weekly Retail Gas and Diesel Prices. U.S. Energy Information
Administration. Available online: https://www.eia.gov/dnav/pet/pet_pri_gnd_dcus_nus_w.htm
28 An Analysis of the Operational Cost of Trucking: 2020 UpdateFigure 7: Respondent Fuel Costs per Mile by Fleet Size
$0.600
$0.486
$0.500
$0.445
$0.431
$0.400 $0.375 $0.362
Cost per Mile
$0.300
$0.200
$0.100
$0.000
Less than 26 26 - 100 Power 101 - 250 Power 251 - 1,000 Power Greater than
Power Units Units Units Units 1,000 Power
Units
Fleet Size
Looking Forward
The lack of car travel due to COVID-19 has severely decreased the demand for
gasoline and diesel – resulting in one of the steepest decreases in fuel prices in recent
times. Both the U.S. Energy Information Administration (EIA) and Organization of the
Petroleum Exporting Countries (OPEC) project that world petroleum demand will
continue to fall throughout 2020 and 2021. 34 With the pandemic currently at record
levels in the U.S., the holiday travel season may generate markedly less fuel demand
than previous years, keeping oil prices low throughout the rest of 2020. It is expected
that fuel prices will continue to decrease in 2020, and the cost per mile for fuel in the
Ops Costs data sample will decrease as well.
Equipment Costs
Equipment-related purchases, including lease and purchase costs, have a large bearing
on other costs. For example, the age of the truck has a direct effect on repair and
maintenance, fuel costs, and other line items. Newer trucks may also impact insurance
costs; newer trucks with better safety equipment may have fewer crashes, but they also
cost more to repair.
34 “From the barrel to the pump: the impact of the COVID-19 pandemic on prices for petroleum products.” U.S Bureau
of Labor Statistics. October 2020. Available online: https://www.bls.gov/opub/mlr/2020/article/from-the-barrel-to-the-
pump.htm
An Analysis of the Operational Costs of Trucking: 2020 Update 29You can also read