Big Sandy Community and Technical College - 2016-2021 Diversity & Inclusion Greta Heintzelman Slone, A.B.D.
←
→
Page content transcription
If your browser does not render page correctly, please read the page content below

Big Sandy Community and Technical College

  Understanding & Nurturing Institutional Togetherness, Equity, & Diversity

       2016-2021 Diversity & Inclusion

                  Greta Heintzelman Slone, A.B.D.
                   Email: GSlone0020@KCTCS.EDU
                             Tel. 606/367-6082

                                      1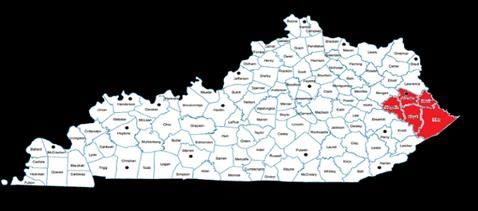
TABLE OF CONTENTS
                                                               Page (s)
Executive Summary ………………………………………………………………………………………………….           3
Introduction …………………………………………………………………………………………………………….           3

Diversity Planning Process…………………………………………………………………………………………       9

Opportunity………………………………………………………………………………………………………………              25
Success …………………………………………………………………...………………………………………………             27
Impact ……………………………………………………………………………………………………………………                48
Assessment ………………………………………………………………………………………………………….               49
Conclusion ………………………………………………………………………………………………………………              49

                                  2
Executive Summary

Big Sandy Community and Technical College (BSCTC) is committed to cultural awareness and
cultural diversity where respect and understanding fosters interaction, acceptance, and
collegiality by embracing all. Our commitment is demonstrated in our mission statement,
strategic themes, and college diversity plan, UNITED. This report serves to provide insight into
the college’s approach to diversity, its history, and the challenges the college faces in providing
a diverse environment. Data is provided for the purpose of assessing current performance
within the areas of student diversity and success and workforce diversity.

Big Sandy’s UNITED 2016-2021 Diversity and Inclusion Plan incorporates the goals and
strategies which will be assessed annually in a report that will detail progress made toward
targets, a summary and analysis of college activities with barriers encountered, and
opportunities for improvement. UNITED will serve as a guide to improve future recruitment,
retention, and promotion of students by providing measureable goals and the strategies that
BSCTC will implement to achieve meaningful progress.

The Dean of Community Development leads the campus diversity efforts and assumes a key
role in enhancing the academic, cultural, and social needs of minority students by providing
opportunities for multicultural education and assisting in the development of a campus culture
where diversity is respected and valued. It is the belief that diversity is the responsibility of all
faculty, staff, and students as individuals and as members of the campus community, and this
charge is not limited to one department. At BSCTC, senior cabinet level leadership is
committed to this plan and will provide leadership and resources to assist in the
implementation and support of all associated goals and strategies.

 Introduction

History

Big Sandy Community and Technical College (BSCTC), a member of the Kentucky Community
and Technical College System (KCTCS), is a
comprehensive community and technical
college that serves Floyd, Johnson, Magoffin,
Martin and Pike counties in eastern Kentucky.
In 2004, the Commission on Colleges of the
Southern Association of Colleges and Schools
(SACSCOC) approved the Prospectus for
                                                  3
Substantive Change for Big Sandy Community and Technical College, which detailed the
consolidation of Prestonsburg Community College, founded in 1964, with Mayo Technical
College, founded in 1938. Prestonsburg Community College was awarded initial membership
with the SACSCOC in 1964. Prior to consolidation with Prestonsburg, Mayo Technical College
was accredited by the Council on Occupational Education (COE). In 2008, Big Sandy Community
and Technical College was reaffirmed by SACSCOC. BSCTC is geographically accessible to
constituents through four campus locations--Prestonsburg, Pikeville, Paintsville and Hager Hill.
Celebrating more than 75 years of educational excellence, BSCTC features multiple career
pathways for students.
BSCTC’s mission statement serves as the foundation on which the programs and services of the
institution are built. The premise of the College’s mission statement focuses on providing
accessible, quality learning services that support student success and enhance economic
growth and quality of life throughout the region. The mission statement is supported by the
College’s vision, values, priorities, and basic themes. Consistent with its mission statement, the
College provides a strong, diverse inventory of academic programs. BSCTC offers 30 academic
and technical programs and more than 200 credentials with an emphasis on innovation in
learning and student access, transfer, and success. BSCTC awards continuing education units,
diplomas, certificates, and associate degrees consistent with the comprehensive nature of the
College.
The College’s Board of Directors is comprised of ten members (excluding one, who is an
Emeritus member). Seven of the ten are appointed by the Governor of Kentucky. The remaining
three positions are filled based on established procedures. A student representative is the
elected Student Government President; a staff representative is elected by popular vote from
the staff; and a faculty representative, by vote of the faculty. The composition of the BSCTC
Board of Directors for 2016-2017 is 60% female and 40% male with 0% of Black/African
American descent 0% Hispanic/Latino and 100% White Caucasian. Reference Table 1.
Table 1: Board of BSCTC Demographics (college)
Community
Board Number Race Student Faculty Staff
Member
Male 4 white 1 3
Female 6 white 1 1 4
BSCTC has vast experience serving a diverse population which includes low-income, first-
generation, and nontraditional students with assorted educational and work experience
backgrounds—individuals who, faced with financial challenges, family obligations, and limited
academic preparation, could be deprived of an affordable higher education opportunity if it
were not for the community and technical college. Residents are afforded the opportunity to
begin a higher education without leaving home. They can choose basic skills training, career
training, professional associate degree education, or preparation for transfer to a four-year
institution.
4BSCTC recognizes its student diversity composition and continues its commitment to recruit and
retain a diverse student population while promoting diversity efforts across the College’s four
campus sites and within the College’s community. BSCTC’s vision, values, and goals reiterate a
commitment to diversity.
Service Area
Located in the eastern most part of the state, BSCTC serves central Appalachia with its unique
cultural heritage historically comprised of an immigrant population of industrial workers that
included the Ulster Scots, English, Welsh, Irish, Slavs, Italians, Hungarians, Germans, Hispanics,
Asians, African Americans, Jews, and Native Americans. In spite of the fact that this region was
ethnically diverse, it was assumed homogenized by those living outside the region. Due to this
perpetuated misnomer, people of southern Appalachia have been blind to their own ethnic
diversity. There is much work to be done to formally establish ethnic identities of generations of
people in this region, but the twenty-first century will see a nascent
cultural diversity that destroys any stereotype of homogeneity.
Currently the demographics of BSCTC’s service area denotes the
following distinctions for Martin, Magoffin, Pike, Johnson and Floyd
counties:
Table 2. Service Area Population Estimates 16-64
White Black or American Asian Native Two or Hispanic
African Indian Hawaiian More
Service Area Population Total American and and Other Races
Alaska Pacific
Native Islander
Big Sandy Floyd 23318 23318 273 28 59 0 101 154
Big Sandy Johnson 14365 14365 69 23 70 3 109 104
Big Sandy Magoffin 8117 8117 21 23 8 0 38 95
Big Sandy Martin* 6955 6955 798 36 19 0 38 377
Big Sandy Pike 38637 38637 325 37 205 9 213 288
BSCTC Service Area Total 94915 91392 1486 147 361 12 499 1018
By learning more about the characteristics of the service area population, the College is better
equipped to make strategic plans of improvement regarding diversity. Table 3 references eight
specific characteristics that were analyzed using the United State Bureau Census for the years
of 2010 and 2015. Special Note*: At the time of this review from the U.S. Census data, Martin
County’s overall population is the lowest of the service area, the data implies the highest
number of Black/African Americans and Hispanic/Latino reside in Martin County. However, this
data for Martin County may not reflect the true population of Black/African Americans and
Hispanic/Latino for employment or student enrollment because the U.S Census data also
5included at that time the population of the Federal Prison in Martin County. This data is
presented in Table 3:
Table 3. Big Sandy Community and Technical College Service Area Quick Facts
BSCTC Service Area Counties Quick Facts Martin Magoffin Pike Johnson Floyd
Population:
Population estimates, July 1, 2015 12,307 12,808 61,792 23,175 37,756
Population estimates base, April1, 2010 12,929 13,333 65,924 23,358 39,451
Pop. % change April 1, 2010-July 1, 2015 -4.8 -3.9 -5.0 -0.8 -4.3
Age:
Person 65 years/over, percent July 1, 2015 14.2 15.3 16.6 16.9 15.3
real numbers of persons 65 years/over, 2015 1,748 1,960 10,257 3,917 5,777
Person 65 years/over, percent April 1, 2010 11.2 12.9 13.7 14.1 13.6
Race and Hispanic Origin
White alone, percent, July 1, 2015 91.5 98.5 97.8 98 97.9
White alone, percent, April 1, 2010 92 98.6 98 98.4 98.2
Black/AA alone, percent, July 1, 2015 7.3 0.3 0.8 0.5 1
real numbers of Black/AA as of July1, 2015 898 38 494 116 378
Black/AA alone, percent, April 1, 2010 6.9 0.1 0.5 0.2 0.7
American Indian, percent, July 1, 2015 0.4 0.3 0.1 0.1 0.1
American Indian, percent, April 1, 2010 0.4 0.3 0.1 0.1 0.1
Two or More Races, percent, July 1, 2015 0.7 0.8 0.7 0.9 0.7
Two or More Races, percent, April 1, 2010 0.7 0.7 0.7 0.8 0.6
Hispanic/Latino, percent, July 1, 2015 3.4 0.8 0.8 0.6 0.7
real numbers of Hispanic/Latino July 1, 2015 418 102 494 139 264
Hispanic/Latino, percent, April 1, 2010 3 0.7 0.7 0.5 0.6
Population Characteristics:
Veterans, 2010-2014 578 351 2.935 1,548 1,903
Health:
With a disability, under 65 yrs., percent 25.9 21.1 25.5 24.2 23.4
real numbers of persons with disability under
3,188 2,702 15,757 5,608 8,835
65 years of age
Economy:
In labor force, total percent of
Population age 16 yrs. + 2010-14 31.1 39.8 44.3 43.2 43.6
real numbers of individuals 16 yrs + available
3,827 5,098 27,374 10,112 16,462
for the labor force
Income and Poverty:
Person in poverty, percent 40.6 30.2 27.4 25.6 31.1
real numbers of the populations living in
4,997 3,845 16,931 5,933 11,742
poverty
Businesses:
Total employment, percent change
62013-2014 -17.8 -13.4 -6.1 -6 4.5
Reference dNote: United States Census Bureau QuickFacts; Martin, Magoffin, Pike, Johnson, Floyd counties in
Kentucky. https://www.census.gov/quickfacts
The data from Table 3 indicates that counties within the BSCTC service region each experienced
a loss in overall population from 2010 to 2015 with the greatest decrease in Pike County.
Although there was a decrease in overall population for each county, there was an increase in
the percentage of Black/African American and Hispanic/Latino over a 5-year census. However,
this growth was .4% or less in each county. Decline in overall population may be connected to
the decline in employment percentages in four of the five counties. Data from the table
provides possible insight into some of the difficulty impacting efforts to increase both student
and employee diversity within BSCTC.
College Strategic Planning Process
The development of the 2016-2022 BSCTC Strategic Plan began in September 2015 with the
Strategic Planning Team conducting a review of the current Strategic Plan in place at the time.
The Strategic Planning Team, which provides broad-based input concerning the College’s
Strategic Plan, uses a variety of processes to develop themes, objectives, strategies, assessment
processes, and improvement actions for both short-term and long-term periods. This Team
reports to the President of the College and meets in January and as needed. The committee is
chaired by the President and members include Chair of the Faculty Council, community
members, President of the Student Government Association, Chair of Staff Council, and other
appointed college employees.
In October 2015, the President’s Cabinet began to develop a working draft of the Vision,
Mission, Values, Priorities, and Themes while ensuring alignment of the BSCTC themes with
proposed goals of KCTCS. In November 2015, the Gates Foundation held regional forums across
Kentucky with local business and industry to gather input regarding challenges and
opportunities for the future. The results of the forums were published by KCTCS. BSCTC
assessed the alignment of the results with the College’s new strategic plan. Progress reports in
addition to requests for feedback were presented to the BSCTC Board of Directors during the
November and December meetings. In December 2015, the President’s Cabinet sent the draft
version to all BSCTC employees along with a survey designed to solicit input and to provide
opportunity for feedback. In January 2016, the President’s Cabinet incorporated feedback from
both the Gates Foundation regional forum and BSCTC employees. The final version of the 2016-
2022 BSCTC Strategic Plan was submitted to the BSCTC Board of Directors for approval at the
February 2016 Board meeting. Endorsement was granted at the February 2016 Board meeting.
Following endorsement by the Board of Directors, the mission was approved by the KCTCS
Board of Regents (governing board) at the March 2016 Board of Regents meeting.
7BSCTC Mission Statement
Big Sandy Community and Technical College provides accessible quality educational
opportunities for student success, promotes economic growth, and enhances the quality of life of
its constituents.
Commitments:
Add value to the region through excellence in teaching and learning.
Promote regional growth through community, workforce, and economic
development.
Provide innovative and affordable learning opportunities for academic
scholarship and professional success.
Support civic and cultural vitality to promote quality of place.
BSCTC Vision Statement
As the region’s premier community and technical college, Big Sandy Community and
Technical College will continue to be recognized as the first choice for higher education;
academic achievement; cultural enrichment; student success; and community, workforce,
and economic development.
BSCTC Values
Continuous Improvement
Intellectual Pursuit
Relevance
Respect
Responsiveness
Sustainable Use of Resources
Transparency
BSCTC Priorities
Innovative Teaching and Learning
Academic Support and Resources
8Student Development Services
Partnerships, Support and Relationships
BSCTC Basic Themes (Goals)
1. Raise the level of educational attainment in the Commonwealth by positioning BSCTC
as the first-choice for accessible, affordable, and relevant higher education and
community, workforce, and economic development in our region.
2. Increase BSCTC student access and success with particular emphasis among the
underserved populations of this region.
3. Develop clear and relevant career pathways through all levels of postsecondary
education with experiential learning opportunities and associated services that lead to
successful employment outcomes.
4. Improve student engagement, support, experiences, and success with academic and
student services to make eastern Kentucky competitive in a global economy.
5. Build relationships with all stakeholders to enhance communication and collaboration
that aligns the BSCTC mission, programs, and curriculum with community, workforce,
and economic development needs.
6. Aggressively pursue external funding to expand the college’s capacity and become the
premier economic development engine in eastern Kentucky.
7. Promote active involvement in cultural and environmental activities to improve, protect
and sustain our community.
Within the BSCTC Strategic Plan, four themes (1, 2, 4, and 7) directly impact diversity. However,
diversity is implied in all other themes. The College’s Strategic Plan provides the framework for
its Diversity Plan.
Diversity Planning Process
The 2016-2021 Diversity Plan will place an emphasis on the entire College to become focused
and engaged in diversity improvements within departments and classroom activities. Empathy
for diversity and inclusion will become a common thread throughout BCTCS.
The Dean of Community Development assumes a key role in enhancing the academic, cultural,
and social needs of underrepresented students by providing opportunities for multicultural
education and assisting in the development of a campus culture where diversity is respected
and valued. To accomplish this, two teams were assembled: the Diversity Planning Team and
Campus Environment Team, each with different roles, and both integral to the overall success
of the Diversity Plan.
Diversity Planning Team (DPT)
The BSCTC Diversity Planning Team was established by President Dr. Devin Stephenson mid-
November of 2016. The team was charged to create and present to College Administration, a
9broad-based, comprehensive, data-driven, strategic diversity plan. Under the guidance
provided by KCTCS and the Council of Postsecondary Education, this plan would align with the
College Mission, the BSCTC 2016-2022 Strategic Plan, the BSCTC 2016 Strategic Enrollment Plan
and based upon the opportunities for improvement as discovered through research. The plan
would provide guidance and include goals, outcomes, and strategies.
The Diversity Planning Team will be focused on the following:
Conducting broad-based research and analyzing data (both quantitative and qualitative)
to ascertain current status of the institution with regards to diversity.
Identifying relevant best practices that facilitate equitable student success.
Designing and activating engagement of college stakeholders.
Collaborating with President’s Cabinet to establish outcomes and strategies.
Creating the Diversity and Inclusion Plan
The ten-member team represents a broad cross-section of the institution and consists of faculty
and staff from the areas of technical education, general education, student services and
strategic communications. A breakdown of status, position, gender and race is shown below.
The Diversity Planning Team Gender and Race is made up of 6 males and 4 females, of the 10
members there are 6 white/Caucasian, 1 Black/ African American, 2 Hispanic/Latino and 1 with
two or more race. Reference Table 4.
Table 4: Diversity Planning Team
Faculty Position Race/Gender
Arron Brooks Instructor/Diesel Technology White/Male
Dewayne Kinner Instructor/Collision Repair Technology White/Male
Greta Heintzelman Slone Associate Professor/English Two or more races/Female
Toufic Saad Professor/Mathematics White/Male
Staff Position Race
Denese Atkinson Information Resource Analyst White/Female
Exon Menjivar Admission Advisor/Recruiter Hispanic/Male
Francisco Gamero Recruiter Hispanic/Male
Jennifer Little Public Relations Assistant White/Female
Bobby McCool Dean of Community Development and Diversity White/Male
Tina Terry Coordinator of Student
African American/Female
Activities/Recruiter(Special Populations)
Campus Environment Team (CET)
The mission of the Campus Environment Team is to cultivate an inclusive community that
reflects a diverse worldview at Big Sandy by providing activities, performances, and
presentations that encourage a broadening of cultural perspectives among faculty, staff,
students, and community.
10The team’s purpose is to develop and facilitate diversity initiatives as a way to create
awareness, acceptance, and appreciation of diversity on campus as well as within the
surrounding communities.
The CET is comprised of fifteen members from across the institution. The composition of the
Campus Environment Team consists of 33% faculty, 46.7% staff and 13.3% students. Women
represent 53.3% of the team and men make up the other 47%. One-third of the membership of
the CET is minority representation consisting of three members of Hispanic descent (20%), one
member of African American descent (6.67%) and one of two or more races (6.67%). Reference
Table 5.
Table 5: Composition of Campus Environmental Team
Faculty Position Race/Gender
William Bowman Instructor/Librarian White/male
Kimberly DeRossett Professor/Nursing White/female
Marsha McKenzie Associate Professor/Nursing White/female
Greta Heintzelman Slone Associate Professor/English Two or more races/female
Dr. Thomas Vierheller Professor/Biology White/male
Staff Position Race/Gender
Misty Adkins Admissions Advisor White/female
Denese Atkinson Information Resource Analyst White/female
Janie Beverley Director of Disability Services White/female
Exon Menjivar Admission Advisor/Recruiter Hispanic/male
Kayla Rice Admissions Advisor White/female
Coordinator of Student
Tina Terry African American/female
Activities/Recruiter(Special Populations)
Francisco Gamero Recruiter Hispanic/male
Dean of Community Development and
Bobby McCool White/male
Diversity
Student Race/Gender
Frank Peterson African/male
Robert Lopez Hispanic/male
In July 2017, a Director of Diversity, Equity, and Inclusion was named to lead the diversity
efforts of Big Sandy and assure that the strategies outlined in this plan are implemented and
assessed. The Director of Diversity, Equity, and Inclusion will also serve to foster new ideas as
they relate to the overarching goals of creating a more inclusive college. She will serve as a
primary administrator of cultural enrichment initiatives and work collaboratively with internal
and external partners for support of diversity strategies.
This position will lead a newly formed Diversity Council, yet to be appointed, whose
membership will consist of a broad-based representation from our college. Together, this
Council will encourage dialogue about diversity and inclusivity and explore the complexities of
difference as they relate to student access, retention, and success.
11Researching the Campus Climate
Big Sandy strives to create a learning environment that is welcoming to all. Physical facilities are
maintained to provide accessibility and offer the capacity for trainings and special events.
Employee professional development is critical to creating understanding, inclusion and
classroom innovation. Faculty and staff play a key role in the retention and success of students
and provide the foundation for a safe and accepting environment.
Having a limited minority population within the service area, student and community activities
focused on diversity provide opportunities to increase knowledge, create empathy for
differences and provide individuals exposure to a more global perspective.
In reviewing current campus culture with regard to expanding and improving diversity efforts,
the Diversity Planning Team (DPT) reviewed the service area’s ethnic population. Student trend
data focusing on enrollment, retention, credentials, graduation, and workforce was also
reviewed and analyzed for areas of needed improvement. Survey data was collected from
faculty, staff, students and community stakeholders, along with personal interviews conducted
with BSCTC Administration. The qualitative research obtained from the surveys and interviews
was compiled and reviewed. Finally, a S.W.O.T. analysis focusing on our institution’s diversity
was conducted. From both quantitative and qualitative data, the DPT was able to create
overarching themes, which later became the foundation, or the Goals, Objectives, Strategies
and Targets for the 2016-2021 Diversity Plan.
Enrollment & Student Success Data
Students interested in applying to BSCTC complete an online application located on the
College’s website. In preparation for potential enrollment, all applications are reviewed and
processed by the admissions staff, who alert students to any additional information or action
required on their part to complete the application process. Table 6, located below, provides a
fall breakdown by ethnicity of the number and the percentage of enrollment from the total
applications received.
12Table 6: Fall Comparison of Student Applications Received
Fall 2013 Fall 2014 Fall 2015 Fall 2016
% % % %
Enrolled
Enrolled
Enrolled
Enrolled
Enrolled Enrolled Enrolled Enrolled
Applied
Applied
Applied
Applied
that that that that
Applied Applied Applied Applied
American
3 - 0.00% 4 1 25.00% 10 7 70.00% 6 4 66.67%
Indian/Alaska
Native
Asian 8 7 87.50% 5 3 60.00% 4 4 100.00% 15 12 80.00%
Black/African 18 12 66.67% 34 15 44.12% 22 13 59.09% 30 19 63.33%
American
Hispanic/Latino 18 6 33.33% 14 5 35.71% 20 11 55.00% 15 8 53.33%
Native
2 2 100.00% - - - - - - 2 2 100.00%
Hawaiian/Pacific
Islander
Unknown (Non- 77 62 80.52% 140 110 78.57% 826 810 98.06% 287 257 89.55%
Specified)
Two or More 13 6 46.15% 17 10 58.82% 21 14 66.67% 15 8 53.33%
Races
White 1123 704 62.69% 1275 782 62.30% 1602 987 61.61% 2088 1406 67.34%
BIG SANDY
1262 799 63.31% 1489 926 62.22% 2505 1846 73.69% 2458 1716 69.81%
Total
Data Source: Unofficial student records data. Enrolled total includes enrolled and dropped students.
The data shows that from Fall 2013 to Fall 2016, BSCTC received 7,714 applications. Of this
total, 68.53% enrolled at BSCTC. Of the applications with “White” designation, 63.71% actually
enrolled. Of the applications from reporting minorities, 57.10% actually enrolled.
More recently, Fall 2016 showed a percentage of applicant enrollment of 69.81%. Applications
from self-reported, Black/African American applicants increased in Fall 2016 over Fall 2015 by
36.36% (22 to 30) with an overall 63.33% of those enrolling Fall 2016. For the same time frame,
the number of self-reported Hispanic applicants decreased by 25% (20 to 15) with 53.33%
enrolling.
Enrollment
BSCTC has an open admissions policy. Low income students represent approximately 92% of
enrollment. Student ethnicity is self-reported on the admissions application. The student
enrollment is primarily from the population of the five county service area (see Table 2) which
has a small minority population of 3.29%. The fall 2016 College Profile is shown below and
Table 7 details fall enrollment by ethnicity over a four-year period.
13BSCTC Fall 2016 College Profile
Enrollment Breakout Fall 2016
Gender
Female 2,683 53.1%
Male 2,374 46.9%
Unknown 0.0%
Enrollment Status
Full-Time 2,210 43.7%
Part-Time 2,847 56.3%
Total Enrollment 5,057
Race/Ethnicity
Total UNDERREPRESENTED
MINORITY (URM) 141 2.79%
AMERICAN INDIAN 17 0.34%
AFRICAN AMERICAN 42 0.83%
HISPANIC 38 0.75%
NATIVE HAWAIIAN 2 0.04%
BIG SANDY TWO OR MORE RACES 42 0.83%
Total Non-URM 4,916 97.21%
NON-RESIDENT ALIEN 20 0.40%
ASIAN 1 0.02%
UNKNOWN 575 11.37%
WHITE 4,320 85.43%
State
Kentucky 4,975 98.4%
Not Kentucky 82 1.6%
Credential-Seeking
Associate Degree 2,555 50.5%
Certificate 27 0.5%
Diploma 246 4.9%
Unkown 7 0.1%
Auditor 0.0%
High School 380 7.5%
Non-Degree 1,842 36.4%
14Table 7: 5 Year Trends
Enrollment
Breakout Fall 2011 Fall 2012 Fall 2013 Fall 2014 Fall 2015
Gender
Female 2,735 50.9% 2,550 49.4% 2,224 46.8% 2,244 48.2% 2,529 51.1%
Male 2,632 49.0% 2,601 50.4% 2,491 52.4% 2,395 51.4% 2,409 48.7%
Unknown 3 0.1% 6 0.1% 39 0.8% 20 0.4% 10 0.2%
Enrollment Status
Full-Time 2,377 44.3% 2,283 44.3% 2,448 51.5% 2,399 51.5% 2,236 45.2%
Part-Time 2,993 55.7% 2,874 55.7% 2,306 48.5% 2,260 48.5% 2,712 54.8%
Total Enrollment 5,370 100.0% 5,157 100.0% 4,754 100.0% 4,659 100.0% 4,948 100.0%
Race/Ethnicity
Total
UNDERREPRESENTE
D MINORITY (URM) 124 2.3% 95 1.8% 92 1.9% 94 2.0% 95 1.9%
BIG SANDY
AMERICAN INDIAN
16 0.3% 13 0.3% 10 0.2% 7 0.2% 9 0.2%
AFRICAN AMERICAN
30 0.6% 34 0.7% 30 0.6% 30 0.6% 24 0.5%
HISPANIC
41 0.8% 29 0.6% 27 0.6% 29 0.6% 35 0.7%
NATIVE HAWAIIAN
2 0.0% 2 0.0% 4 0.1% 0.0% 0.0%
TWO OR MORE
RACES 35 0.7% 17 0.3% 21 0.4% 28 0.6% 27 0.5%
Total Non-URM
5,246 97.7% 5,062 98.2% 4,662 98.1% 4,565 98.0% 4,853 98.1%
ASIAN
12 0.2% 9 0.2% 9 0.2% 8 0.2% 12 0.2%
NON-RESIDENT
ALIEN 0.0% 1 0.0% 4 0.1% 4 0.1% 1 0.0%
UNKNOWN
219 4.1% 279 5.4% 190 4.0% 267 5.7% 1,112 22.5%
WHITE
5,015 93.4% 4,773 92.6% 4,459 93.8% 4,286 92.0% 3,728 75.3%
State
Kentucky 5,256 97.9% 5,002 97.0% 4,647 97.7% 4,537 97.4% 4,844 97.9%
Not Kentucky 114 2.1% 155 3.0% 107 2.3% 122 2.6% 104 2.1%
15Fall trend data presented in Table 8 below indicates that the ethnicity of the BSCTC student
body is increasing at a slow but steady pace with gains coming from the Black & Hispanic
population showing an increase over the four-year period from 1.20% to almost 1.58%. This
increase correlates with the increases in the service area populations for the same groups as
shown in Table 3. Another item of interest is the growth shown in the Two or More Races
category, which has doubled from 21% in fall 2013.
Table 8: 4 Year Trend- Fall Enrollment by Ethnicity
Percentage Percentage Percentage
Change Change Change
Fall Enrollment by Fall Fall Fall Fall
Fall 2014 Fall 2015 Fall 2016
Ethnicity 2013 2014 2015 2016
from from from
Fall 2013 Fall 2014 Fall 2015
AMERICAN INDIAN 10 7 -30.00% 9 28.57% 17 88.89%
ASIAN 9 8 -11.11% 12 50.00% 1 -91.7%
BLACK/AFRICAN
30 30 0.00% 24 -20.00% 42 75.00%
AMERICAN
HISPANIC 27 29 7.41% 35 20.69% 38 8.57%
NATIVE HAWAIIAN 4 - -100.00% - - 2 200.00%
NON-RESIDENT ALIEN 4 4 0.00% 1 -75.00% 17 0.00%
TWO OR MORE RACES 21 28 33.33% 27 -3.57% 42 55.56%
UNKNOWN 190 267 40.53% 1112 316.48% 575 -48.29%
WHITE 4459 4286 -3.88% 3728 -13.02% 4320 15.88%
BIG SANDY Total 4754 4659 -2.00% 4948 6.20% 5057 2.20%
Data Source: CPE Official data except for most recent time frame. Most recent data uses Unofficial Student Records.
Retention
Tables 9, 10, and 11 provide data regarding student retention. The timeframe is from fall 2010
to fall 2015.
16In reviewing the last five years (2010-2015) of Fall to Fall retention rates reported in Table 8
below, BSCTC shows an overall URM retention for the period of 37%(38/102) as compared to
Non-URM retention of 57.5%(1635/2842).
Table 9: Retention URM vs Non-URM (Fall to Fall)
Fall 2010 Fall 2011 Fall 2012 Fall 2013 Fall 2014 Fall 2015
Race Description
Retained
Retained
Retained
Retained
Retained
Retained
Cohort
Cohort
Cohort
Cohort
Cohort
Cohort
% % % % % %
TOTAL
637 365 57.3 491 288 58.7 453 243 53.6 434 240 55.3 446 262 58.7 483 275 56.9
URM 19 2 10.5 15 8 53.3 21 9 42.9 14 6 42.9 16 8 50.0 17 5 29.4
AMERICAN
INDIAN
1 0 0.0 2 1 50.0
AFRICAN
AMERICAN
8 0 0.0 4 3 75.0 11 6 54.5 7 2 28.6 5 2 40.0 5 1 20.0
HISPANIC 4 0 0.0 6 4 66.7 6 2 33.3 3 2 66.7 2 2 100 6 0.0
NATIVE
HAWAIIAN
1 0 0.0 2 0 0.0 3 0.0
TWO OR
MORE 5 2 40.0 5 1 20.0 2 0 0.0 2 2 100 9 4 44.4 6 4 66.7
RACES
Non-URM 618 363 58.7 476 280 58.8 432 234 54.2 420 234 55.7 430 254 59.1 466 270 57.9
ASIAN 1 1 100 2 2 100 1 1 100 1 1 100 1 1 100
NON-
RESIDENT 1 0 0.0 2 0 0.0 2 0 0.0
ALIEN
UNKNOWN 2 2 100 3 1 33.3 6 3 50.0 8 5 62.5 2 1 50.0 5 4 80.0
WHITE 615 360 58.5 471 277 58.8 424 230 54.2 409 228 55.7 426 253 59.4 460 265 57.6
17Table 10 addresses retention of low-income students at all colleges throughout KCTCS:
Table 10: Low Income Retention (Fall to Fall)
Fall 2010 to Fall 2011 to Fall 2012 to Fall 2013 to Fall 2014 to Fall 2015 to
Low Income Retention 2016*
2011* 2012* 2013* 2014* 2015*
Ashland 43.7% 46.8% 41.2% 46.2% 44.9% 48.7%
Big Sandy 57.6% 56.5% 55.0% 53.6% 55.7% 56.1%
Bluegrass 55.4% 40.7% 43.9% 43.7% 41.9% 45.8%
Elizabethtown 49.8% 47.3% 42.6% 45.4% 43.6% 46.5%
Gateway 57.6% 52.6% 57.3% 57.7% 51.4% 54.1%
Hazard 56.3% 57.2% 53.6% 52.2% 53.5% 50.8%
Henderson 49.1% 42.2% 38.0% 41.6% 42.9% 55.1%
Hopkinsville 50.2% 42.3% 44.4% 45.0% 41.1% 45.3%
Jefferson 50.0% 45.6% 42.7% 46.8% 44.4% 46.4%
Madisonville 52.9% 50.4% 52.6% 55.4% 50.5% 54.9%
Maysville 59.0% 55.8% 53.9% 46.2% 49.1% 58.4%
Owensboro 53.0% 53.1% 55.0% 47.0% 41.6% 50.6%
Somerset 58.8% 50.7% 55.3% 48.5% 47.7% 48.5%
Southcentral 53.4% 44.7% 47.9% 52.3% 52.3% 54.1%
Southeast 53.4% 60.6% 55.7% 57.6% 56.5% 61.6%
West KY 58.9% 52.7% 55.2% 55.2% 51.2% 55.9%
KCTCS Total 54.1% 48.4% 48.7% 48.5% 46.7% 50.5%
Source: CPE Official Type 1 and Type A
Draft- Pending vetting process with CPE.
Based on data in Table 10, BSCTC has maintained an average retention rate for low-income
students of 55.75%. Specifically, the Fall 2015 to Fall 2016 retention rate of 56.1% ranks BSCTC
as second among all KCTCS colleges in retention of low-income students.
Student Persistence & Credentials
Student persistence in terms of diversity is analyzed through reports (Tables 11a, 11b, 11c, 12,
13, 14, 15 and 16) on credentials awarded, completers within 150%, credentials awarded by
low-income, low-income graduation rate, selected admissions, and a transfer report.
Tables 11a, 11b, and 11c provide data for credentials awarded by student ethnicity. Table 11a
represents 2015-2016; 11b, 2014-2015; and 11c, 2013-2014:
18Table 11a. 2015-2016 Credentials Awarded by Student Ethnicity
2015 - 2016
Credentials Awarded % of Credentials Awarded
Total % of
Race
Number Total
Description Associates Certificate Diploma Awarded Associates Certificate Diploma Awarded
AMERICAN
INDIAN
- - - - - - - 0.0%
ASIAN 3 6 9 0.6% 0.6% - 0.6%
BLACK/AFR.
4 8 12 0.8% 0.8% 0.7%
AMERICAN
HISPANIC 5 14 2 21 1.0% 1.4% 1.6% 1.3%
TWO OR MORE
RACES
2 12 - 14 0.4% 1.2% - 0.9%
UNKNOWN 4 5 2 11 0.8% 0.5% 1.6% 0.7%
WHITE 504 925 121 1,550 96.6% 95.4% 96.8% 95.9%
BIG SANDY
522 970 125 1,617 100.0% 100.0% 100.0% 100.0%
Total
Table 11b. 2014-2015 Credentials Awarded by Student Ethnicity
2014-2015
Credentials Awarded % of Credentials Awarded
Total % of
Race
Number Total
Description Associates Certificate Diploma Awarded Associates Certificate Diploma Awarded
AMERICAN
INDIAN
1 3 - 4 0.2% 0.3% - 0.2%
ASIAN 2 1 - 3 0.4% 0.1% - 0.2%
BLACK/AFR.
1 7 1 9 0.2% 0.7% 0.6% 0.5%
AMERICAN
HISPANIC 1 1 0.2% 0.1%
TWO OR MORE
RACES 1 - - 1 0.2% - - 0.1%
UNKNOWN 4 10 - 14 0.8% 0.9% - 0.8%
WHITE 496 1,048 158 1,702 98.0% 98.0% 99.4% 98.2%
BIG SANDY
506 1,069 159 1,734 100.0% 100.0% 100.0% 100.0%
Total
Table 11c. 2013-2014 Credentials Awarded by Student Ethnicity
2013-2014
Credentials Awarded Total % of Credentials Awarded % of
19Race Number Total
Description Associates Certificate Diploma Awarded Associates Certificate Diploma Awarded
AMERICAN
INDIAN
- 5 4 9 - 0.5% 2.7% 0.5%
ASIAN 1 11 1 13 0.2% 1.0% 0.7% 0.8%
BLACK/AFR.
1 4 5 0.2% 0.4% 0.3%
AMERICAN
HISPANIC 5 21 3 29 1.1% 2.0% 2.0% 1.8%
NON-RESIDENT
ALIEN
1 - - 1 0.2% - - 0.1%
TWO OR MORE
RACES 2 2 1 5 0.4% 0.2% 0.7% 0.3%
UNKNOWN 4 5 1 10 0.9% 0.5% 0.7% 0.6%
WHITE 431 1,015 138 1,584 96.9% 95.5% 93.2% 95.7%
BIG SANDY
445 1,063 148 1,656 100.0% 100.0% 100.0% 100.0%
Total
KCTCS definition of minority includes the following race/ethnicity descriptions: American Indian, Asian, Native Hawaiian, Black, Hispanic,
Two or more races.
CPE definition of minority includes the following race/ethnicity descriptions: American Indian, Native Hawaiian, Black, Hispanic, Two or
more races.
Most recently, the credentials awarded during 2015-2016 indicate known minority graduates
received a total of 56 credentials representing 3.5% of the total credentials awarded. In relation
to individual credentials, known minority students earned 2.8% (14) of all Associates degrees,
4% (40) of all certificates and 1.6% (2) of all diplomas.
Table 12 provides a comparison by ethnicity of completers within 150% timeframe:
Table 12: Completers within 150% by Student Ethnicity
American
Total Two or
Indian or African Nonresident
Revised Asian Hispanic Hawaiian White more UNKNOWN
Alaska American Alien
Cohort races
Native
Total
Cohort Revised % of Completers
Year Cohort
2014 449 33.33% 37.50% 19.77% 0.00% 25.00%
2013 524 0.00% 0.00% 0.00% 0.00% 16.44% 0.00% 50.00%
2012 431 100.00% 0.00% 0.00% 17.95% 3.03%
2011 296 0.00% 0.00% 100.00% 12.87% 25.00%
Source: IPEDS-KCTCS ORPA
Table 13 reports the number of credential awarded to low-income students:
Table 13: 2010-2015 Credentials Awarded Low Income
2010- 2011- 2012- 2013- 2014- 2015-
BIG SANDY
2011* 2012* 2013* 2014* 2015* 2016* **
Certificates - Low income 524 596 685 802 906 906
20Diplomas - Low income 51 70 105 121 140 140
Certificates and Diplomas -
575 666 790 923 1,046 1,046
Low income
Associate Degrees –
227 248 287 334 384 384
Low income
Annual count of associate degrees awarded by Low Income (Pell recipients at any period of enrollment – since 2005-06 – at any KCTCS
Institution).
* preliminary
** 2014-15 as placeholder (waiting on 2015-16 Financial Aid file due to CPE on Nov 1)
Table 13 shows an increase in the number of credentials awarded to low income students each
academic year. The highest category was found with certificates awarded.
As shown below, Table 14 identifies a significant increase in low-income graduation rates for
BSCTC from the 2013-2014 academic year to the 2014-2015 academic year. Specifically, the
percentage increased from 14.7% to 21%.
Table 14: Low Income Graduation Rates (4 Year Trend)
Low Income Fall 2010 Fall 2011 Fall 2012 Fall 2013
Graduation
Rate
District Cohort Grads % Cohort Grads % Cohort Grads % Cohort Grads %
Ashland 394 65 16.50% 471 86 18.30% 351 58 16.50% 324 84 25.90%
Big Sandy 399 60 15.00% 346 50 14.50% 305 61 20.00% 293 51 17.40%
Bluegrass 956 172 18.00% 1096 150 13.70% 1005 167 16.60% 797 122 15.30%
Elizabethtown 707 145 20.50% 680 138 20.30% 579 139 24.00% 531 145 27.30%
Gateway 218 69 31.70% 154 41 26.60% 140 35 25.00% 127 33 26.00%
Hazard 436 100 22.90% 413 121 29.30% 390 103 26.40% 400 97 24.30%
Henderson 107 18 16.80% 132 26 19.70% 97 21 21.60% 100 13 13.00%
Hopkinsville 235 41 17.40% 300 46 15.30% 306 55 18.00% 266 67 25.20%
Jefferson 570 66 11.60% 586 68 11.60% 645 69 10.70% 481 49 10.20%
Madisonville 247 66 26.70% 208 49 23.60% 214 87 40.70% 193 79 40.90%
Maysville 359 105 29.20% 376 101 26.90% 327 100 30.60% 314 84 26.80%
Owensboro 400 110 27.50% 388 104 26.80% 411 115 28.00% 395 97 24.60%
Somerset 900 197 21.90% 855 183 21.40% 728 162 22.30% 678 147 21.70%
Southcentral
286 55 19.20% 193 42 21.80% 275 68 24.70% 221 56 25.30%
Kentucky
Southeast
325 77 23.70% 289 77 26.60% 288 83 28.80% 249 81 32.50%
Kentucky
West
412 145 35.20% 369 120 32.50% 443 174 39.30% 404 157 38.90%
Kentucky
KCTCS 6951 1491 21.50% 6856 1402 20.40% 6504 1497 23.00% 5773 1362 23.60%
Selective Admission Programs
21Minority enrollment in most BSCTC selective admissions programs is significantly lower than as
represented in total enrollment. Additional follow-up is required and initiatives implemented
that will increase minority STEM-H opportunities and enrollment.
Table 15: Selective Admission Program Enrollment
Selective Admission Program Enrollment Minority vs. Non-Minority
Total Percentage Total
Major Fall 2015
(CIP CIP Title Fall 2015
Minority Non- Minority Non-
Code) Minority Minority
510602 Dental 35 35 100.0% 100.0%
Hygiene/Hygienist
510908 Respiratory Care 24 24 100.0% 100.0%
Therapy/Therapist
510909 Surgical
Technology/Technologist
513801 Registered 133 133 100.0% 100.0%
Nursing/Registered
Nurse
513901 Licensed 17 17 100.0% 100.0%
Practical/Vocational
Nurse Training
Total Percentage Total
Fall 2014
Fall 2014
510602 Dental 3 69 72 4.2% 95.8% 100.0%
Hygiene/Hygienist
510908 Respiratory Care 43 43 100.0% 100.0%
Therapy/Therapist
510909 Surgical 1 1 100.0% 100.0%
Technology/Technologist
513801 Registered 7 324 331 2.1% 97.9% 100.0%
Nursing/Registered
Nurse
513901 Licensed 27 27 100.0% 100.0%
Practical/Vocational
Nurse Training
Total Percentage Total
Fall 2013
Fall 2013
510602 Dental 82 82 100.0% 100.0%
Hygiene/Hygienist
510908 Respiratory Care 73 73 100.0% 100.0%
Therapy/Therapist
510909 Surgical 1 1 100.0% 100.0%
Technology/Technologist
513801 Registered 6 425 431 1.4% 98.6% 100.0%
Nursing/Registered
Nurse
513901 Licensed 1 28 29 3.4% 96.6% 100.0%
Practical/Vocational
Nurse Training
22Transfer
In reviewing transfer data for ethnic cohorts, data indicates that although some ethnic cohorts
exceeded the Caucasian cohort in percentage to transfer, additional services and follow-up
within this area are needed by all groups.
Table 16: Transfer Report
Fall 2014 Fall 2013
Transfer Cohort Transfers % Cohort Cohort Transfers % Cohort
Transferred Transferred
by
Ethnicity
AFRICAN 30 5 16.67% 30 8 26.67%
AMERICAN
AMERICAN 7 0.00% 10 1 10.00%
INDIAN
Asian 8 1 12.50% 9 0.00%
HISPANIC 29 1 3.45% 27 2 7.41%
NATIVE 4 1 25.00%
HAWAIIAN
Caucasian 4286 432 10.08% 4459 453 10.16%
Two or More 28 3 10.71% 21 4 19.05%
Races
Non Resident 4 4 0.00%
Alien
Unknown 267 26 190 6 3.16%
OPPORTUNITIES AND SUPPORT FOR OTHER DIVERSE STUDENT POPULATIONS
BSCTC embraces diversity through higher education’s broad definition that includes age,
ethnicity, gender, race, physical disabilities, sexual orientation, thinking styles, socio-economic
background, and life experiences. The College has found this working definition useful in order
to more fully support our campus population.
Students with Documented Disabilities. The Director of Disability Support Services is
responsible for advocating for any student with a disability and for the self-identified students
with disabilities. The Director works to ensure that students with disabilities receive the same
access to activities and services as all other students. She acts as a link between the student
with disabilities and faculty members in order to ensure that the student is a fully participating
member in their classroom environments.
23The College encourages students to self-identify any concerns or requests they may have
regarding their education and has included contact information for the Office of Disability
Support Services in every course syllabus. Through the Office of Disability Support Services,
BSCTC served 62 students in fall 2014. In fall 2015, a total of 76 students were served; and in
fall 2016, a total of 61 students were served. There were 377 students enrolled who received
Kentucky Vocational Rehabilitation educational benefits in FY16.
Veterans. BSCTC sees growth potential in the number of veterans seeking a college education.
Currently, the College offers a wide range of counseling services. Veterans are referred to a
specific counselor on two of our four campuses, Prestonsburg and Pikeville, who will assist
them with their applications for VA education benefits, academic advising, and/or act as a
liaison with the U.S. Department of Veterans Affairs on their behalf. Referrals are made to
outside professional agencies to meet needs that are not related to education. With the
number of veterans pursuing a post-secondary education, it is a welcomed opportunity for
BSCTC to serve military personnel.
The Counseling Services and Veterans Advisor provided data on the number of veterans (which
does not include children of veterans nor reservists) enrolled for each semester for three
academic years; however, for this report, fall to fall numbers are shown due to potential
headcount duplication. Veteran enrollment for fall 2014 totaled 17; enrollment for fall 2015
totaled 24; and enrollment for fall 2016 totaled 19.
Lesbian, Gay, Bi Sexual & Transgendered (LGBTQ+). Students can choose membership in the
Gay-Straight Alliance (GSA) organization. This organization provides an atmosphere of inclusion
and education to promote understanding, acceptance, and support. The Gay Straight Alliance
promotes Safe Spaces throughout BSCTC campuses and promotes safety for the LGBTQ+
community. Through visibility and inclusivity, the Gay Straight Alliance serves as an advocate for
equal rights.
24Goals and Strategies
Recruitment
Goal 1Develop recruitment and outreach efforts to Black/African American
community.
MEASURE: ENROLLMENT-BLACK/AFRICAN AMERICAN
Objective:
Increase Black/African American student enrollment.
Measure:
Fall enrollment data of credential seeking students as reported to IPEDS.
Performance Metric: Actual Target Target Target Target
Undergraduate Baseline
Fall 2016 Fall 2017 Fall 2018 Fall 2019 Fall 2020
Enrollment
24 42 48 54 60 67
Black/African American
(0.5%) (0.8%) (1.0 %) (1.1%) (1.2%) (1.3%)
Strategies Cost Steward Partners Implementation
1.1 Implement usage of No cost to Dean of Academic Director of Enrollment Mgmt. Fall 2017
Radius Software to institution Services
identify and track Target (a): By September 2017, two full-time employees will be trained to generate recruitment
potential Black/African reports that will be used by to target Black/African American population within local
American students geographical area.
within geographical
area.
1.2 Promotion of John T. No cost to Dean of Academic Scholarship Coordinator Fall 2017
Smith Scholarship. institution Services, Public Relations Each Fall & Spring
Director of Public
Relations
Target (a): Each year, the number of John T. Smith Scholarships awarded will be proportionate
with the total enrollment of students who meet the award criteria.
1.3 Utilization of minority $500.00
Dean of Academic Director of Enrollment Mgmt., Fall 2016
recruiter to identify, recruitment
Services Recruiter (Special Populations)
actively recruit, track materials
enrollment and follow- Target A: Increase the number of Hispanic applicants that result in an increase of 1% in full-time
up of potential Black/African American enrollment for fall 2018 baseline data of fall 2017.
Black/African American
enrollment.
251.4 Cultivate relationships No cost to Director of Diversity, Recruiter (Special Populations)
with agencies, institution Equity & Inclusion
organizations and Target (a): Identify the number of community, business and agency partners within local
businesses that locally geographical area that provide support for URM’s (Black/African American).
support URM Target (b): Schedule meetings with targeted partners to establish a collaborative relationship.
populations.
1.5 Create Minority No cost to Director of Diversity, Recruiter (Special Populations)
Mentorship Program to institution Equity & Inclusion
partner minority students Target (a): Identify minority community members to volunteer in the mentorship program.
with minority community Target (b): Schedule meetings with targeted partners to establish a collaborative relationship.
members to establish
support system.
Goal 2 Develop recruitment and outreach efforts to Hispanic community.
MEASURE: ENROLLMENT-HISPANIC
Objective:
Increase Hispanic student enrollment.
Source:
Fall enrollment of credential seeking students as reported to IPEDS.
Performance Metric: Actual Target Target Target Target
Undergraduate Baseline
Fall 2016 Fall 2017 Fall 2018 Fall 2019 Fall 2020
Enrollment
35 38 43 48 53 58
Hispanic
(0.7%) (0.8%) (0.8%) (0.9%) (1.0 %) (1.1%)
Strategies Cost Steward Partners Implementation
2.1 Implement usage of No cost to Director of Enrollment
Radius Software to Dean of Academic Services Fall 2017
institution Mgmt.
identify and track
Target (a): By September 2017, two full-time employees will be trained to generate recruitment
potential Hispanic
reports that will be used to target Hispanic population within geographical area.
students within
geographical area.
2.2 Establish Admissions
Conversational ESL Advisor/Recruiter,
Dean of Career Ed & Workforce
course. $500.00 Director of Enrollment Fall 2017
Dev.
Mgmt.
Target (a): Place on schedule for Fall 2017 as pilot course.
2.3 Develop outreach Admissions
efforts to engage Advisor/Recruiter
Summer 2017
Hispanic community $1,500 Dean of Academic Services Dir of Director of
population Enrollment Mgmt.
Target (a): Summer 2017, employment of full-time Hispanic admissions advisor/recruiter.
262.4 Develop scholarship No cost to Big Sandy Educational Fall 2018
Director of Advancement
for Hispanic students institution Foundation
Target (a): Secure funding or establish scholarship fund/endowment.
2.5 Develop promotional Admissions
items in Spanish Advisor/Recruiter
language Director of Enrollment Summer 2017
$500.00 Director of Public Relations
Mgmt.
Dean of Academic
Services
Target (a): All items will be available by September 2017.
2.6 Create Spanish Admissions Advisor/Recruiter
language version of Director of Enrollment Mgmt. Summer 2017
$250.00 Director of Public Relations
recruitment Dean of Academic Services
materials
Target (a): All recruitment items will be available by October 2017.
2.7 Utilization of Admissions
minority recruiter to Salary + Advisor/Recruiter Fall 2018
Dean of Academic Services
identify, actively Fringe Recruiter (Special
recruit, track Populations)
enrollment and Target (a): Summer 2017, employment of full-time Hispanic admissions advisor/recruiter.
follow-up of Target (b): Increase the number of Hispanic applicants that result in an increase of 10% in full-time
potential Hispanic Hispanic enrollment for fall 2018 using baseline of fall 2017.
enrollment.
2.8 Develop student Admissions 2019
TBD Dean of Academic Services
mentorship program Advisor/Recruiter
utilizing Hispanic Target (a): 10% increase each year from baseline in number of students participating.
community business
leaders.
2.9 Develop close Dean of Academic Services
Admissions 2019
relationships with TBD Director of Diversity, Equity,
Advisor/Recruiter
Hispanic students and and Inclusion
their families. Target (a): 10% increase each year from baseline in number of students participating.
Goals and Strategies
Enrollment, Retention, Graduation, Credentials,
Transfer & Campus Climate
Goal 3 Increase access and success for traditionally underserved
populations.
27MEASURE 3.1: ENROLLMENT-URM
Objective:
Increase URM student enrollment.
Underrepresented Minorities (URM) (American Indian or Alaska Native, Black or African American, Hispanic or Latino, Native
Hawaiian or Other Pacific Islander and Two or More Races.
Metric: Credential Seeking Students (URM)
Fall enrollment data of credential seeking students as reported to IPEDS.
Performance Metric: Actual Target Target Target Target
Undergraduate Baseline
Fall 2016 Fall 2017 Fall 2018 Fall 2019 Fall 2020
Enrollment
95 141 149 157 166 174
URM
(1.9%) (2.8%) (3.0%) (3.1%) (3.3%) (3.4%)
Implementation
Strategies Cost Steward Partners
Conduct informational Director of
meetings in each county Dean of Enrollment
Planning
within the BSCTC service Academic Mgmt.,
$750.00 Stage
area to promote college Services Director of
programs, supportive Public
services, and enrollment. Relations
Target
(a):
Strategies Target
(b):
3.1.1 Establish a presidential $1,000.0
ambassador program Dean of Academic Services Student Services Staff 2018
0
for URM students and
Target (a): Program will reflect a diverse composition with at least 25% of participants from
their families.
ethnic background.
3.1.2 Design an Dean of Career Ed and
$515.00
Evening/Weekend Workforce Dev,
per Summer 2017
schedule of classes to Dean of Academic Services Director of IT and Facilities,
credit
attract prospective Dean of Institutional
hour
students interested in Effectiveness
a high-wage, high- Target (a): Increase pathway offerings by 1 new program each year from baseline of year 2017-
demand field. 2018.
3.1.3 Utilize Social Media to
Dean of Academic Services 2017-2018
increase outreach with $500.00 Director of Public Relations
Director of Enrollment Mgmt.
secondary schools in
the BSCTC service area. Target (a): Geo-target prospective student groups through social media.
3.1.4 Partner with public Dean of Student Services,
secondary schools Director of Enrollment Mgmt., Fall 2018
00.00 Dean of Academic Services
within the BSCTC five- Director of Public Relations &
county service area to Director of Financial Aid
host a ‘Big Sandy Day’ Target (a): Increase in number of attendees over previous year with baseline established in
2017-2018.
28event for high school Target (b): 20% Prospects from event will enroll within one year
students.
3.1.5 Hold FAFSA Workshops $50.00
at secondary schools Advertise Dean of Student Services, Spring 2018
within the BSCTC five- Dean of Student Services
ment Director of Financial Aid
county service area. material
Target (a): Using baseline data for 2016-2017 (4 high schools), increase by 3 additional high
school FAFSA workshops each year.
3.1.6 Host an evening Dean of Student Services,
recruitment event at a Director of Enrollment Mgmt. 2017-
$500.00 Dean of Academic Services
large venue within the Director of Public Relations, 2018
five-county service Director of Financial Aid
area showcasing BSCTC Target (a): Increase in number of attendees over previous year with baseline established in
academic programs, 2017-2018.
financial aid and Target (b): 20% Prospects from event will enroll within one year
support services.
3.1.7 Develop a student Dean of Academic Services Director of Enrollment Mgmt. Spring 2018
mentorship program 00.00
Director of Public Relations
utilizing College Target (a): Participants will show an increase in the understanding and application of leadership
leadership. principles and skills as shown by results of pre/post survey
3.1.8 Develop Marketing
Strategies that target Fall
minority students in Dean of Academic Services Director of Public Relations
2019
effort to promote
technical programs, Target (a): Provide specific information on services, scholarships, etc. geared towards students
Early College Academy of diverse backgrounds.
enrollment and Skills
USA participation.
Goal 3 Increase access and success for traditionally underserved populations.
MEASURE 3.2: RETENTION-URM (1st to 2nd Year)
OBJECTIVE:
Increase URM student 1st to 2nd year retention.
Metric: 1st to 2nd Year Retention URM
Fall-to-fall retention rates of first-time, credential-seeking students by Underrepresented Minorities (URM)
(American Indian or Alaska Native, Black or African American, Hispanic or Latino, Native Hawaiian or Other Pacific
Islander and Two or More Races).
Performance Metric Baseline Actual Target Target Target Target
2015-16 Fall 2016 Fall 2017 Fall 2018 Fall 2019 Fall 2020
URM 50% 52% 53% 54% 55% 56.1 %
Associated
STRATEGIES Steward Partners Implementation
Cost
Utilize Dean of Academic Dean of Student Services,
3.2.1 Establish an at-risk Pilot Summer
current Services Director of Financial Aid,
advising process to 2017
employees Institutional Research &
29You can also read