A longitudinal and geospatial analysis of COVID-19 tweets during the early outbreak period in the United States
←
→
Page content transcription
If your browser does not render page correctly, please read the page content below
Cuomo et al. BMC Public Health      (2021) 21:793
https://doi.org/10.1186/s12889-021-10827-4

 RESEARCH                                                                                                                                           Open Access

A longitudinal and geospatial analysis of
COVID-19 tweets during the early outbreak
period in the United States
Raphael E. Cuomo1,2, Vidya Purushothaman1,2, Jiawei Li2,3, Mingxiang Cai3,4 and Tim K. Mackey1,2,3*

  Abstract
  Introduction: Early reports of COVID-19 cases and deaths may not accurately convey community-level concern
  about the pandemic during early stages, particularly in the United States where testing capacity was initially limited.
  Social media interaction may elucidate public reaction and communication dynamics about COVID-19 in this critical
  period, during which communities may have formulated initial conceptions about the perceived severity of the
  pandemic.
  Methods: Tweets were collected from the Twitter public API stream filtered for keywords related to COVID-19.
  Using a pre-existing training set, a support vector machine (SVM) classifier was used to obtain a larger set of
  geocoded tweets with characteristics of user self-reporting COVID-19 symptoms, concerns, and experiences. We
  then assessed the longitudinal relationship between identified tweets and the number of officially reported COVID-
  19 cases using linear and exponential regression at the U.S. county level. Changes in tweets that included
  geospatial clustering were also assessed for the top five most populous U.S. cities.
  Results: From an initial dataset of 60 million tweets, we analyzed 459,937 tweets that contained COVID-19-related
  keywords that were also geolocated to U.S. counties. We observed an increasing number of tweets throughout the
  study period, although there was variation between city centers and residential areas. Tweets identified as COVID-
  19 symptoms or concerns appeared to be more predictive of active COVID-19 cases as temporal distance increased.
  Conclusion: Results from this study suggest that social media communication dynamics during the early stages of
  a global pandemic may exhibit a number of geospatial-specific variations among different communities and that
  targeted pandemic communication is warranted. User engagement on COVID-19 topics may also be predictive of
  future confirmed case counts, though further studies to validate these findings are needed.
  Keywords: Ecological epidemiology, COVID-19, Infectious diseases, Geospatial analysis, Social media

* Correspondence: tmackey@ucsd.edu
1
 Department of Anesthesiology, University of California, San Diego School of
Medicine, San Diego, CA, USA
2
 Global Health Policy and Data Institute, San Diego, CA, USA
Full list of author information is available at the end of the article

                                        © The Author(s). 2021 Open Access This article is licensed under a Creative Commons Attribution 4.0 International License,
                                        which permits use, sharing, adaptation, distribution and reproduction in any medium or format, as long as you give
                                        appropriate credit to the original author(s) and the source, provide a link to the Creative Commons licence, and indicate if
                                        changes were made. The images or other third party material in this article are included in the article's Creative Commons
                                        licence, unless indicated otherwise in a credit line to the material. If material is not included in the article's Creative Commons
                                        licence and your intended use is not permitted by statutory regulation or exceeds the permitted use, you will need to obtain
                                        permission directly from the copyright holder. To view a copy of this licence, visit http://creativecommons.org/licenses/by/4.0/.
                                        The Creative Commons Public Domain Dedication waiver (http://creativecommons.org/publicdomain/zero/1.0/) applies to the
                                        data made available in this article, unless otherwise stated in a credit line to the data.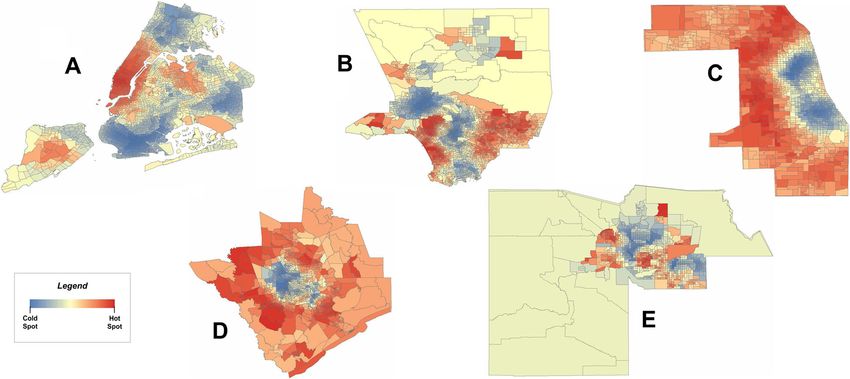
Cuomo et al. BMC Public Health   (2021) 21:793                                                                 Page 2 of 11

Background                                                    receive and respond to pandemic-specific public health
In mid-March 2020, approximately 150,000 cases of cor-        communication strategies [19–21].
onavirus 2019 (COVID-19) had been confirmed globally,            Building on this prior research, this study aims to ex-
with only about 2000 of these cases occurring at the          plore the use of geospatial, statistical, and machine
time in the United States [1]. Domestic attention to the      learning methods to better understand how social media
potential threat of the COVID-19 pandemic was likely          data from the popular microblogging platform Twitter
widespread [2–4], though current data do not allow for        can be leveraged to estimate geographic distributions of
a highly valid means of estimating the extent of public       public attention and concern to the COVID-19 pan-
concern at this earlier stage of the pandemic. Further-       demic. Specifically, the use of Twitter data has a number
more, many who became infected did not exhibit                of advantages in achieving the objective of understand-
symptoms (i.e., asymptomatic cases) or exhibited very         ing geospatial variability in communication during dis-
mild symptoms, complicating the relationship between          ease outbreaks. Practically, it is more feasible to obtain
reporting of case counts and actual public attention and      large volumes of unprompted and self-reported conver-
concern to what would eventually become a global pub-         sations closer to real-time that more immediately convey
lic health crisis, which as of March 2021, has claimed        the experiences of online users compared to traditional
the lives of more than half a million Americans [5, 6].       surveys that may be retrospective and subject to recall
   In the first half of March 2020, limited availability of   bias [22]. The near real-time data generated by social
tests for COVID-19 led public health officials to suggest     media is particularly important when exploring changing
that only certain individuals need to seek confirmation       trends in public health emergencies, such as a global
of COVID-19 infection with a diagnostic test [7]. As a        pandemic. Also, the unprompted nature of these mes-
result, it was recommended that testing be reserved for       sages may encourage more organic spatiotemporal re-
individuals suffering relatively severe symptoms requir-      flection of attention to a given topic, which is further
ing hospitalization [8]. This may have resulted in an         facilitated by a large number of users (Twitter reports
early outbreak period that exhibited inaccurate spatial       that it had 187 million active users worldwide as of
variation for pandemic-related concern due to underre-        January 2021) and methods to opt-in to geolocation [23, 24].
porting of true case count estimations. Hence, limited           We specifically choose to examine the early out-
testing capacity and data on actual case estimations          break period in the United States as it represents a
necessitates examination of non-traditional sources of        critical time frame of formation of public perception,
surveillance data, including forms of syndromic and           knowledge dissemination, and initial behavior adapta-
infodemiology approaches that use data generated out-         tion towards public health interventions, which can
side of clinical settings. One approach to assessing          influence subsequent behaviors and attitudes towards
underreporting of COVID-19 symptomatic individuals            the pandemic in later stages [25]. Other studies have
and possible cases is by using “infoveillance” approaches,    similarly examined other social media platforms (e.g.,
including using Internet and social media data to iden-       Chinese microblogging platform Weibo) at the early
tify the distribution and determinants of disease-related     stages of COVID-19 in other countries for public per-
concern, such as self-reporting of COVID-19 symptoms          ception and sentiment, such as in Wuhan City, China,
and lack of access to testing [9–11].                         where the outbreak originated [26–28].
   A number of studies have used social media data to
identify and characterize user experiences with COVID-        Methods
19, including the detection of self-reporting of COVID-       Study methods included interdisciplinary approaches in
19 symptoms, user sentiment, information spreading,           data mining, mathematical transformations, regression
exposure to misinformation, illegal sale of COVID-19          analysis, geospatial statistics, and machine learning for
health products, and other topics [12–16]. In addition to     content classification. The distributions predominantly
social media-based infoveillance, analysis of geographic      under scrutiny were spatial, though temporal fluctua-
distributions of online COVID-19 communication                tions were also assessed. Data collection and mining was
during this period may be helpful in understanding the        conducted using the computer programming language
variability in how communities interact with the topic of     Python and data analysis was conducted in ArcGIS ver-
a novel and emerging infectious disease outbreak [17,         sion 10.6 and R version 3.6.0. Figure 1 provides an over-
18]. These geographic distributions may also be valuable      view of the data collection, processing, and analysis
to public health practitioners seeking to disseminate         phases used in this study.
information about preventive behaviors (e.g. mask wear-
ing, social distancing) in the context of pandemic re-        Data collection
sponse, as well as to public health practitioners seeking     Data access via the Twitter public API stream was
to understand the latent capability of communities to         used to prospectively download publicly available posts
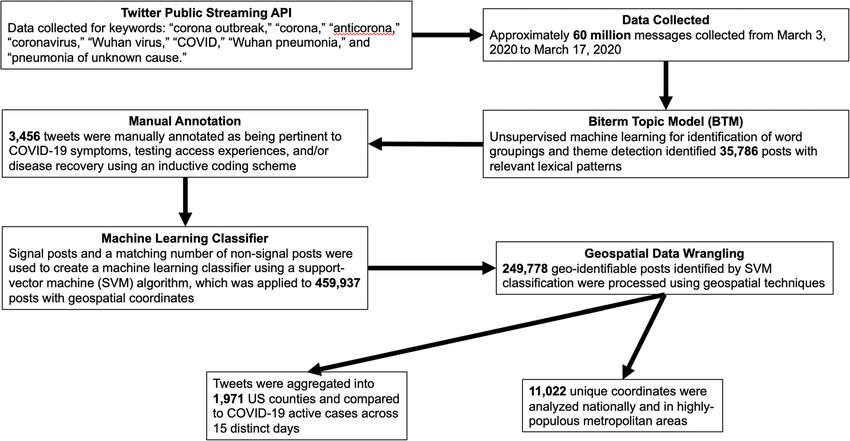
Cuomo et al. BMC Public Health       (2021) 21:793                                                                          Page 3 of 11

 Fig. 1 Flowchart describing data collection, processing, and analysis phases for social media posts related to COVID-19

located in the United States between March 3rd and                          “limitations” section) [31]. Of these tweets, 459,937 had
March 17th, 2020, inclusive. Data collection commenced                      available geospatial information in the metadata of col-
in early March and was terminated for the purposes of                       lected messages.
this study when data were sufficient to allow for testing                      Geospatial information was in the form of latitude and
the longitudinal prediction of cases from social media                      longitude coordinates. The original source of this infor-
posts with a two-week time-lag. This timeframe can also                     mation was information generated from the user’s device
be characterized as occurring towards the end of the                        where Twitter users are required to opt in to enable geo-
early outbreak period in the United States, as on March                     location. For the purposes of this study Twitter IDs were
13th, former President Donald Trump declared COVID-                         removed from datasets prior to analysis to ensure appro-
19 a national emergency, an event emphasizing the ser-                      priate de-identification. Posts with these coordinate data
iousness of the outbreak and unlocking billions in fed-                     are made available to third parties via the Twitter API.
eral funds to fight its spread.                                             There are a number of reasons why twitter users may
  Keywords used to obtain tweets from the public API                        choose to geolocate or geotag their tweet. Reasons for
stream were intended to encompass a broad representa-                       lack of geolocation include changes in Twitter’s privacy
tion of conversations regarding COVID-19 at the time.                       policy and individual privacy concerns about sharing
These were “corona outbreak,” “corona,” “anticorona,”                       data and not opting-in to geolocation services/apps. Spe-
“coronavirus,” “Wuhan virus,” “COVID,” “Wuhan pneu-                         cifically, in 2015 Twitter changed its terms to require ex-
monia,” and “pneumonia of unknown cause.” these key-                        plicit op-in to share precise location data (i.e. GPS data)
words were chosen on the basis of structured manual                         whereas previously precise data was included when geo-
searches conducted on twitter that detected content re-                     tagging tweets. Reasons why users may geolocate include
lated to the COVID-19 outbreak as posted by users, and                      a preference to geotag their location when tweeting and
they have also been validated as being able to identify                     integration or use of other applications. COVID-19
tweets pertaining to COVID-19 conversations in prior                        cases at the U.S. county and national levels were avail-
studies [29, 30]. Approximately 60 million messages                         able from the 2019 Novel Coronavirus COVID-19
were collected during this timeframe. Prior studies sug-                    (2019-nCoV) Data Repository, actively maintained on
gest that collecting data from the twitter public stream-                   GitHub by the Johns Hopkins University Center for Sys-
ing API will generate a random sample of approximately                      tems Science and Engineering, which collects case infor-
1% of all public tweets having these keywords, though                       mation reported from a variety of validated sources [32].
selection of keywords, volume of overall tweets, and                        Cases were obtained for each day when posts were col-
other factors may impact this approximation (see                            lected on Twitter. Active case counts were used in
Cuomo et al. BMC Public Health   (2021) 21:793                                                                  Page 4 of 11

regression modeling, computed by subtracting county-            users’ followers to following was 1607:78, and only 111
level recoveries and deaths from confirmed cases.               users had accounts created recently in 2020 in the prior
Normalization of tweets for national and local analysis         published study, which are all macro characteristics indi-
was done by dividing the number of tweets by the                cative of non-bot traffic.
amount of people living in a given county or census
tract. Population at these ecological units was available
from the US Census Bureau.                                      Longitudinal analysis
                                                                Analysis of signal tweets specifically located for the
Content analysis using machine learning                         United States involved scrutiny of the longitudinal rela-
In a prior published study, we used an unsupervised ma-         tionship between tweets and cases at the U.S. county
chine learning approach, called the biterm topic model          level. Bivariate regressions were conducted to investigate
(BTM), to identify users self-reporting COVID-19 symp-          the strength of relationships between county-level tweets
tom related experiences and concerns (e.g., lack of ac-         and county-level active cases. These models were com-
cess to testing when having symptoms) from the 60               puted to compare the distribution of tweets on the same
million-tweet corpus collected during the study period.         day as the distribution of active cases, as well as for
Coding involved five thematic categories/codes for iden-        every combination of time-lagged tweets with active
tification of “signal” tweets (i.e., tweets that were con-      cases. R2 values were used to assess the fit of linear
firmed as associated with self-reporting of symptoms            relationships and were compared to Nagelkerke’s R2 to
and concerns after manual annotation). Results from the         assess the fit of exponential relationships for the set of
study reported high inter-rater reliability (κ = 0.98); with    same-day or time-lagged relationships. Nagelkereke’s
a more detailed description of these methods available in       method provides a range from zero to one, as with the
Mackey et al., 2020 [29]. In brief, 35,786 posts were clus-     R2 statistic for linear relationships, in computing a fit
tered by BTM and identified as containing highly corre-         relative to a nested null model without predictors.
lated word patterns thought to be associated with
symptom-related conversations, with 3465 of these posts
then positively identified via manual annotation as asso-       Geospatial analysis
ciated with self-reporting of symptoms and concerns.            In order to explore the county-level distribution of all
   These signal posts largely did not contain geospatial        geolocated tweets with COVID-19 keywords within the
information but were nevertheless detected during the           United States, tweets were aggregated across the March
early outbreak period and were used for this study. This        3rd - 17th data collection period and divided by county-
initial set of training data, along with a matching num-        level population based on data from the US Census
ber of posts coded for non-signal (i.e., posts that were        Bureau. Geospatial cluster analysis was conducted for
false positives and determined by manual annotation to          the top five most populous cities in the United States.
not be related to self-reporting of symptoms), were used        For cities bounded by the perimeter of a single county,
for further supervised machine learning classification          the distribution across census tracts was analyzed at the
tasks using a support-vector machine (SVM) algorithm.           county level; otherwise, the distribution across census
The SVM classifier was applied to the 459,937 posts in          tracts was analyzed at the city level. This strategy was
this study with geospatial coordinates to identify 249,778      undertaken in order to relay relevant distributions across
posts whose text content is more consistent with self-          space, particularly with cities contiguous with numerous
reported user Twitter messages related to COVID-19              other cities and towns. Unique coordinates from the
symptoms/concerns, therefore excluding “noise” associ-          overall study period were utilized for cluster analysis of
ated with tweets that were about news coverage, satire,         all five areas, so as to prevent clustering statistics from
and other topics not related to symptoms and concerns.          being biased toward locations of individuals with higher
This final labeled subset of 249,778 geo-identifiable posts     volumes of social media posting. For areas with suffi-
was used in all regression models computed in this              cient sample size, additional analysis was done on the
study.                                                          first day (March 3rd) and the last day (March 17th) of
   As our training set explicitly excluded posts that ap-       the study period, in order to relay change in the distribu-
peared to originate from bots in its signal dataset (includ-    tion of social media messages. The computational
ing signal data we observing observed generally included        analysis itself involved calculation of the Getis Ord Gi*
longer interactions with other users, original content, and     statistic for each census tract within the area. These G
profile information that had individually identifiable infor-   statistics were used to obtain corresponding z scores,
mation or biographies), the output of the SVM classifier is     which were then visualized to relay high-value “hot”
likely to exclude from its classification similar bot-like      spots and low-value “cold” spots.
traffic. In addition, we observed that the average ratio of
Cuomo et al. BMC Public Health (2021) 21:793 Page 5 of 11 Results 5911 active cases (representing close to a 10,000% A total of 459,937 tweets included geospatial informa- increase) across 523 counties ranging from 1 to 807 tion and originated from 11,022 unique coordinates. per county. Tweets were available for 1971 US counties (55% of US counties), with tweets per capita ranging from Longitudinal analysis 0.0000076 per capita to 0.75 per capita. National ana- Regression models comparing non-normalized tweets lysis assessed active cases from March 3rd, which and active cases tended to exhibit better fit as the day of totaled 59 cases across 24 counties ranging from 1 to active case data became further from the day of tweet 14 cases per county; increasing on March 17th to data (Table 1). This prediction was especially strong for Table 1 R2 values for regression models with number of active COVID-19 cases regressed on number of tweets related to COVID-19 at the county level. Linear and exponential models were computed for both same-day tweets and time-lagged tweet day predicting active cases. Greener shading indicates higher R2 values within that table; otherwise, shading is relative to row values *p value for tweets covariate under 0.05
Cuomo et al. BMC Public Health (2021) 21:793 Page 6 of 11
exponential models, with the fit of active cases by from Houston, with 26 (32.1%) on March 3rd and 73
COVID-related tweets reaching an R2 of 0.76 for the ex- (90.1%) on March 17th; and 40 from Maricopa County
ponential model with tweets from March 4th predicting (i.e. Phoenix) with 13 (32.5%) on March 3rd and 25
active cases 13 days later. Average R2 for same-day pre- (62.5%) on March 17th. Therefore, across all city areas,
diction was 0.16 for linear models and 0.15 for exponen- approximately one-third of the number of locations
tial models. Although only one comparison was interacting with the COVID-19 topic were represented
available, R2 for 14-day prediction was 0.49 for the linear in early March. The number of locations approximately
model and 0.73 for the exponential model. The tweet doubled by mid-March, consistent with the national
covariate was not statistically significant when predicting trend in increase in number of locations tweeting about
cases on March 3rd, March 4th, or March 5th. Con- COVID-19.
versely, 96% of bivariate models for subsequent days ex- Geospatial cluster analysis was conducted for each
hibited p values under 0.05 for the tweet covariate. major metropolitan city area. In New York City, a cluster
of tweets was detected in Manhattan, which is the most
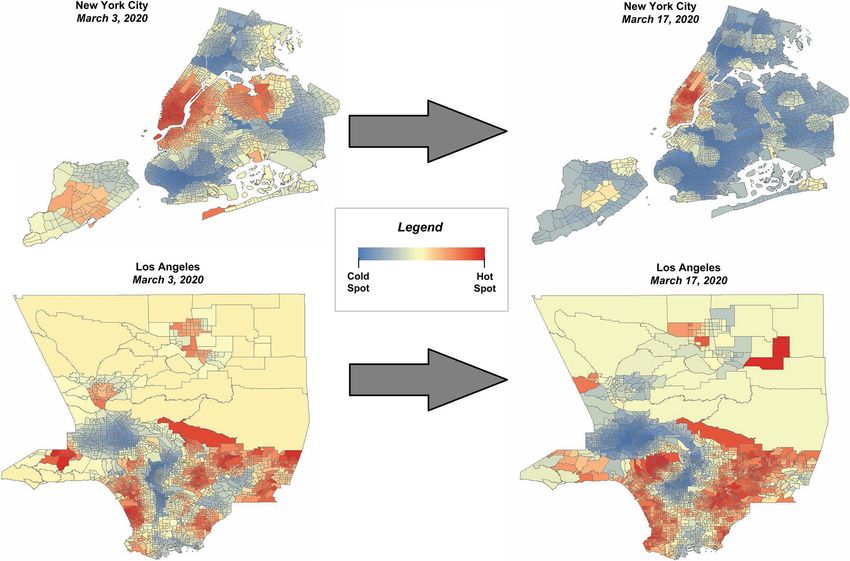
Geospatial analysis densely populated area of the city. Conversely, in Los
Between March 3rd and March 17th, we collected 249, Angeles County, the densely populated downtown area
788 posts which were classified as related to COVID-19 was labelled as a cold spot, whereas the relatively resi-
user-generated symptoms and concerns as outputted by dential areas of West Los Angeles and San Gabriel
the SVM classifier. These posts had 11,022 unique geo- Valley were labelled as hot spots. The same pattern was
spatial coordinates. To illustrate the difference in social observed for Cook County (i.e., Chicago) and Houston,
media communication between early March and mid- where city centers exhibited lower levels of social media
March, we compared tweets obtained at the beginning conversations related to COVID-19 symptoms and con-
of the study period (March 3rd) with those obtained 2 cerns. However, the distribution of tweets within
weeks later (March 17th). We detected 3842 (34.9%) Maricopa County (i.e., Phoenix) seemed more consistent
posts on March 3rd and 8420 (76.4%) on March 17th. with that of New York City, with relatively high repre-
Within the five most populous cities in the United States sentation of COVID-19 conversations in the densely
(or their respective encompassing counties), there were populated city center (Fig. 2). These results may reflect
95 unique coordinates from New York City, with 35 different underlining patterns of twitter user’s engage-
(36.8%) on March 3rd and 66 (69.5%) on March 17th; ment or geolocation in different city and residential
178 unique coordinates from Los Angeles County, with environments, or more or less engagement on COVID-
58 (32.3%) on March 3rd and 147 (82.5%) on March 19-related topics due to specific community consider-
17th; 86 from Cook County (i.e. Chicago), with 27 ations (e.g., on March 17th, New York City had 182 new
(31.4%) on March 3rd and 59 (68.6%) on March 17th; 81 cases and Los Angeles County had 50 new cases),
Fig. 2 Z-scores for the Getis Ord Gi* statistic, indicating geospatial clustering of tweets about COVID-19 from (a) New York City, (b) Los Angeles
County, (c) Cook County (i.e. Illinois), (d) Houston, and (e) Maricopa County (i.e. Phoenix)Cuomo et al. BMC Public Health (2021) 21:793 Page 7 of 11
though these patterns require further study and gener- k tweets that contained COVID-19-related keywords
ation of additional hypotheses. that were geolocated in just over half of all counties in
Analysis for different time points was possible for New the United States during the early stages of the pan-
York City and Los Angeles County. On March 3rd, the demic. We observed variation in clustering of tweets
distribution of coordinates in New York City spanned within populous metropolitan areas, indicating sub-
across lower and central Manhattan, radiating across the regional differences in patterns of social media commu-
East River into parts of Brooklyn and Queens. Despite nication about COVID-19.
more social media activity on March 17th, the distribu- Results of this study are primarily exploratory and
tion of coordinates in New York City became much are important in generating further hypotheses to bet-
more concentrated within the island of Manhattan. The ter characterize social media communication dynamics
opposite trend was observed in Los Angeles County. On at early stages of a public health emergency, particu-
March 3rd, small clusters of tweets were detected from larly in the context of a novel emerging infectious
Los Angeles International Airport and some areas of San disease and when there is a lack of accurate informa-
Gabriel Valley. On March 17th, these small clusters ap- tion on case counts, as this period was marked by
peared to have grown to encompass most areas within underreporting of active and asymptomatic cases due
the county’s South Bay, Westside, San Gabriel Valley, to lack of testing capacity [12]. Overall, this study re-
and Southeast regions (Fig. 3). vealed a number of quantitative aberrations, discrep-
ancies, and findings that require further study that
Discussion could help in better assessing the epidemiological and
From an initial dataset of 60 million tweets, this study communication characteristics of the ongoing
used a combination of geospatial analysis, statistical test- COVID-19 pandemic using geolocated tweets as a
ing, and machine learning to analyze approximately 460 proxy indicator for community attention to disease
Fig. 3 Changes in z-scores for the Getis Ord Gi* statistic, relaying clustering at the start of the study period (March 3rd) and the end of the study
period (March 17th) for New York City and Los Angeles CountyCuomo et al. BMC Public Health (2021) 21:793 Page 8 of 11 outbreaks, with possible insights related to disease users commented about concerning issues related to an transmission trends over time. absence of people/crowds, decrease in traffic, and store/ Analysis of county-level data in the United States also event closures, towards the end of the study period. This suggested a time lag between Twitter posts and predict- may reflect growing awareness to the pandemic’s sever- ive power for officially reported COVID-19 cases. In this ity as the pandemic progressed. study, posts exhibited much better fit for reported active Overall, the cities of New York and Phoenix exhibited cases as the time gap between Twitter posts and cases different Twitter clustering patterns than those for the increased, especially in exponential models. The reason for areas of Los Angeles, Chicago, and Houston. In New this discrepancy may be that social media users are York and Phoenix, clusters were generally observed from responding to the perceived risk of COVID-19 due to news relatively densely populated city centers. However, in coverage and conversations generated from other users’ ex- Los Angeles, Chicago, and Houston, clusters were periences earlier than official reporting of cases by state mostly observed outside of city centers. Further research public health agencies [33]. Specifically, there is generally a is needed to assess why these city and residential specific lag with public health surveillance reporting, which can also variations may be occurring, which could be influenced be impacted by the availability and speed of laboratory test- by differences in dynamics between working and living ing [34]. Hence, this study’s approach can potentially in different cities (including access to public transporta- provide closer to real-time insights by identifying commu- tion, commuting for work, and the impact of stay-at- nities where self-reporting of symptoms and public concern home orders on working and living conditions specific about disease transmission are experiencing statistical and to cities or states) [35]. Areas that exhibited similar geospatially specific fluctuations. tweet clustering (e.g., the Phoenix area and New York Analysis of the areas for the five most populated cities City) require further study to assess if there are similar in the United States revealed some consistencies and patterns of user risk-perception or COVID-19-related also some differences in relation to Twitter engagement self-reported behavior. on COVID-19-related topics. All cities appeared to fol- Importantly, our study builds on a growing body of low the national longitudinal trend of increasing tweets infoveillance literature using geolocated data to explore and corresponding case counts, where approximately potential disease transmission and online communica- one-third of all cities analyzed included Twitter discus- tion dynamics using publicly available social media data. sions related to COVID-19 on March 3rd, which then This includes a 2016 study of Japanese tweets containing doubled by March 17th. This result appears to indicate influenza symptoms which found a similar time lag be- that, in addition to the total number of Twitter posts fol- tween the rate of tweets with forecasting words and the lowing a similar longitudinal trend as local COVID-19 national influenza rate [36]. A separate study of Korean rates, the number of unique locations interacting with tweets from 2016 found that tweets with keywords re- this issue was also indicative of the evolving national lated to Middle East respiratory syndrome (MERS) were concern about the pandemic. more predictive of the South Korean quarantine rate as Specifically, temporal differences were observed be- the time lag increased, but less predictive of laboratory- tween New York City and Los Angeles County, where confirmed cases [37]. Finally, a 2010 study of English- clustering of highly tweeted areas became more concen- language tweets about the H1N1 pandemic found that trated in New York City and less concentrated and dis- tweets which were automatically coded as indicative of persed in Los Angeles County. As New York City personal disease experience, based on keywords, exhib- exhibited extremely high COVID-19 rates in mid-March ited high correlation with personal disease experience compared to the rest of the country, this result may after manual verification of tweets [38]. partly be due to highly concentrated user engagement in Throughout the COVID-19 crisis, maps and data specific areas of the city, mainly Manhattan (with users dashboards have been popularly used to describe the ex- in this area possibly more likely to geotag their tweets), tent and distribution of the pandemic and offer action- actively discussing COVID-19 topics. Los Angeles able public health insights [32, 39, 40]. However, these County exhibited the opposite trend, where the distribu- maps have primarily focused on the disease distribution tion of tweets became more dispersed between March itself (e.g., visualizing validated cases, testing and vaccine 3rd and March 17th, possibly reflecting the fact that case centers, and requesting users to self-report symptoms), counts were relatively lower in this area compared to whereas social consequences of the disease (such as other states/cities. Furthermore, lack of highly concen- those discussed in social media posts) may also provide trated tweet geographic clusters may indicate that public useful insights warranting the production of map visuali- concern about the outbreak was still being formulated, zations [41, 42]. Furthermore, there exist powerful geo- particularly as case counts continued to increase locally. spatial and statistical methods that can applied to these In both city-specific groups of tweets, we observed that data to assess specific risk factors associated with
Cuomo et al. BMC Public Health   (2021) 21:793                                                                                  Page 9 of 11

geolocated communities, including examining potential            intended to be primarily hypothesis generating, and find-
COVID-19-related challenges such as health disparities,          ings from this study should be further validated in more
lack of access to testing/treatment, and assessing the im-       highly controlled settings while also leveraging add-
pact of policy on pandemic response and human behav-             itional sources of both structured and unstructured data.
ior [43]. This form of digital syndromic COVID-19                For example, a study in a manageable set of smaller
surveillance can generate previously undiscoverable in-          communities should seek to determine whether variation
sights not readily available from other data sources.            in social media data is highly predictive of community
  Infoveillance-derived metrics, such as the relative fre-       caseloads that were obtained by communities with simi-
quency of posts from a given area and the change over            lar levels of testing at this early stage of the pandemic,
time of tweets from specific communities, may also be            and also attempt to account for variations that may re-
helpful in coordinating public health communication              late to public health policy decisions at the local level.
strategies to effectively disseminate targeted information       Such future studies may also seek to assess differences
and education relevant to pandemic response, needed              in the predictive power of social media messages at dif-
public health interventions, and associated clinical care        ferent intervals from the caseload prediction time point.
[19, 44]. Geospatially-resolute infoveillance statistics may
also be helpful after the initiation of public health com-       Conclusion
munication programs, as they can provide evidence on             Results from this study suggest that social media com-
the comparative effectiveness of strategies and/or the           munication dynamics during the early stages of a global
variation in community-level absorptive capacity for a           pandemic exhibit a number of geospatial specific varia-
given communication strategy [33, 45]. Furthermore,              tions and that engagement of these topics may be pre-
geospatial variation in COVID-19 risk factors has previ-         dictive of future confirmed case counts, though further
ously been tied to discrepancies in patterns of hospital-        studies to validate these findings are needed. Across five
ized care for COVID-19 [46], and spatial concentrations          major US cities, geospatial patterns of tweets about
of healthcare workforce personnel have been associated           pandemic-related experiences and concerns revealed
with COVID-19 case distributions [47, 48]. Concor-               variations in geospatial hot and cold spots of tweet loca-
dantly, further research should assess how geospatial            tions between metropolitan communities, with suggested
variation in online communication dynamics of COVID-             further variations relating to how these clustering pat-
19 may be predictive of patterns in patient care and             terns change over time. The utility of social media data
population-based healthcare metrics.                             as an infoveilance data layer for measuring early concern
                                                                 about infectious disease outbreaks warrants further
Limitations                                                      study, as does the potential moderating effect of concern
Findings from this study are subject to a number of key          on behavior-related prevention of transmission.
limitations. Importantly, only a fraction of all tweets are
                                                                 Acknowledgements
geolocated, which raises the possibility of sampling bias        Not applicable.
with respect to the overall tweet corpus. Aggregated ana-
lyses correspond to 2 weeks of social media communica-           Authors’ contributions
                                                                 RC and TK conceptualized the study. MC conducted data collection. RC and
tion and therefore may have limited generalizability             VP analyzed the data. RC and TK worked on writing the manuscript. All
beyond the early outbreak period. Furthermore, some              authors approved the final manuscript.
communities and their specific demographic features
                                                                 Funding
may have a greater propensity to post Twitter messages           This research was funded by a grant from the California HIV/AIDS Research
or geolocated tweets, regardless of conditions experi-           Program (Award #R00RG2400).
enced in any of its users’ communities. While it is pos-
                                                                 Availability of data and materials
sible that this error is approximately systemic, and             The datasets used and/or analyzed during the current study are available
thereby may not appreciably contribute to the discovery          from the corresponding author on reasonable request.
of spurious relationships, little analysis has been done to
verify whether the proportion of posts responding to             Declarations
local conditions is consistent across geospatial units.          Ethics approval and consent to participate
Similarly, we have considered the variation in COVID-            Not applicable.
19 cases to be reflective of true variation at an artificially
                                                                 Consent for publication
deflated magnitude, due to insufficient testing. However,        Not applicable.
testing capacity of local public health bodies may have
appreciably varied during the study period, potentially          Competing interests
                                                                 TKM, JL, and MC are employees of the startup company S-3 Research LLC. S-
resulting in erroneous variation, in addition to the sus-        3 Research is a startup funded and currently supported by the National Insti-
pected erroneous variation in magnitude. This study is           tutes of Health – National Institute on Drug Abuse through a Small Business
Cuomo et al. BMC Public Health (2021) 21:793 Page 10 of 11
Innovation and Research contract for opioid-related social media research 17. Tao Z-Y, Chu G, McGrath C, Hua F, Leung YY, Yang W-F, et al. Nature and
and technology commercialization. Author reports no other conflict of inter- diffusion of COVID-19–related oral health information on Chinese social
est associated with this manuscript and have not been asked by any media: analysis of tweets on weibo. J Med Internet Res. 2020;22(6):e19981.
organization to be named on or to submit this manuscript. RC and VP report https://doi.org/10.2196/19981.
no conflicts of interest or financial relationships associated with this 18. Mavragani A. Tracking COVID-19 in Europe: infodemiology approach. JMIR
manuscript. Public Health Surveill. 2020;6(2):e18941. https://doi.org/10.2196/18941.
19. Cuello-Garcia C, Pérez-Gaxiola G, van Amelsvoort L. Social media can
Author details have an impact on how we manage and investigate the COVID-19
1
Department of Anesthesiology, University of California, San Diego School of pandemic. J Clin Epidemiol. 2020;127:198–201. https://doi.org/10.1016/j.
Medicine, San Diego, CA, USA. 2Global Health Policy and Data Institute, San jclinepi.2020.06.028.
Diego, CA, USA. 3S-3 Research LLC, San Diego, CA, USA. 4Global Health 20. Mavragani A, Gkillas K. COVID-19 predictability in the United States using
Program, Department of Anthropology, University of California, San Diego, Google trends time series. Sci Rep. 2020;10(1):1–12.
USA. 21. Doogan C, Buntine W, Linger H, Brunt S. Public perceptions and attitudes
toward COVID-19 nonpharmaceutical interventions across six countries: a
Received: 14 November 2020 Accepted: 9 April 2021 topic modeling analysis of twitter data. J Med Internet Res. 2020;22(9):
e21419. https://doi.org/10.2196/21419.
22. Sakshaug J, Ofstedal M, Guyer H, Beebe T, Johnson T. Handbook of Health
Survey Methods; 2015.
References 23. Slavik CE, Buttle C, Sturrock SL, Darlington JC, Yiannakoulias N. Examining
1. Verhagen MD, Brazel DM, Dowd JB, Kashnitsky I, Mills M. Mapping hospital tweet content and engagement of Canadian public health agencies and
demand: demographics, spatial variation, and the risk of “hospital deserts” decision makers during COVID-19: mixed methods analysis. J Med Internet
during COVID-19 in England and Wales. OSF Preprints. 2020. Res. 2021;23(3):e24883. https://doi.org/10.2196/24883.
2. Lau H, Khosrawipour V, Kocbach P, Mikolajczyk A, Ichii H, Schubert J, Bania J, 24. Jang H, Rempel E, Roth D, Carenini G, Janjua NZ. Tracking COVID-19
Khosrawipour T. Internationally lost COVID-19 cases. J Microbiol Immunol discourse on twitter in North America: Infodemiology study using topic
Infect. 2020;53(3):454–8. modeling and aspect-based sentiment analysis. J Med Internet Res. 2021;
3. Wang X, Ma Z, Ning Y, Chen C, Chen R, Chen Q, et al. Estimating the case 23(2):e25431. https://doi.org/10.2196/25431.
fatality ratio of the COVID-19 epidemic in China. medRxiv. 2020. 25. Liu Q, Zheng Z, Zheng J, Chen Q, Liu G, Chen S, et al. Health
4. Zhuang Z, Cao P, Zhao S, Lou Y, Wang W, Yang S, et al. Estimation of local communication through news media during the early stage of the COVID-
novel coronavirus (COVID-19) cases in Wuhan, China from off-site reported 19 outbreak in China: digital topic modeling approach. J Med Internet Res.
cases and population flow data from different sources. Frontiers in Physics. 2020;22(4):e19118. https://doi.org/10.2196/19118.
2020;8(336). 26. Li J, Xu Q, Cuomo R, Purushothaman V, Mackey T. Data mining and content
5. Tian S, Hu N, Lou J, Chen K, Kang X, Xiang Z, et al. Characteristics of COVID- analysis of the Chinese social media platform Weibo during the early
19 infection in Beijing. J Infect. 2020;80(4):401–6. https://doi.org/10.1016/j. COVID-19 outbreak: retrospective observational infoveillance study. JMIR
jinf.2020.02.018. Public Health Surveill. 2020;6(2):e18700. https://doi.org/10.2196/18700.
6. Hu Z, Song C, Xu C, Jin G, Chen Y, Xu X, et al. Clinical characteristics of 24 27. Li S, Wang Y, Xue J, Zhao N, Zhu T. The impact of COVID-19 epidemic declaration
asymptomatic infections with COVID-19 screened among close contacts in on psychological consequences: a study on active Weibo users. Int J Environ Res
Nanjing, China. Sci China Life Sci. 2020;63(5):706–11. Public Health. 2020;17(6):2032. https://doi.org/10.3390/ijerph17062032.
7. World Health Organization. Global surveillance for COVID-19 caused by 28. Xu Q, Shen Z, Shah N, Cuomo R, Cai M, Brown M, et al. Characterizing
human infection with COVID-19 virus: interim guidance, 20 March 2020. Weibo social media posts from Wuhan, China during the early stages of the
Geneva: World Health Organization; 2020. COVID-19 pandemic: qualitative content analysis. JMIR Public Health Surveill.
8. Odendaal, W. A Method to Model Outbreaks of New Infectious Diseases 2020;6(4):e24125. https://doi.org/10.2196/24125.
with Pandemic Potential such as COVID-19. 2020. medRxiv. 29. Mackey TK, Purushothaman V, Li J, Shah NS, Nali M, Bardier C, et al. Machine
9. Eysenbach G. Infodemiology and infoveillance: framework for an emerging Learning to Detect Self-Reporting of COVID-19 Symptoms, Testing Access
set of public health informatics methods to analyze search, communication and Recovery on Twitter. [Under Review]; 2020.
and publication behavior on the internet. J Med Internet Res. 2009;11(1): 30. Cuomo RE, Purushothaman V, Li J, Cai M, Mackey TK. A Statistical and
e11. https://doi.org/10.2196/jmir.1157. Geospatial Analysis of Global and National COVID-19-Related Tweets. [Under
10. Buolos MNK, Geraghty EM. Geographical tracking and mapping of Review]; 2020.
coronavirus disease COVID-19/severe acute respiratory syndrome 31. Ghosh S, Zafar MB, Bhattacharya P, Sharma N, Ganguly N, Gummadi K. On
coronavirus 2 (SARS-CoV-2) epidemic and associated events around the sampling the wisdom of crowds: Random vs. expert sampling of the twitter
world: how 21st century GIS technologies are supporting the global fight stream. In: Proceedings of the 22nd ACM international conference on
against outbreaks and epidemics. Int J Health Geogr. 2020;19(1):8. Information & Knowledge Management, vol. 2013; 2013. p. 1739–44.
11. Zhou C, Su F, Pei T, Zhang A, Du Y, Luo B, et al. COVID-19: Challenges to 32. Dong E, Du H, Gardner L. An interactive web-based dashboard to track
GIS with Big Data. Geography and Sustainability. 2020;1(1):77–87. COVID-19 in real time. Lancet Infect Dis. 2020;20(5):533–4. https://doi.org/1
12. Mackey T, Purushothaman V, Li J, Shah N, Nali M, Bardier C, et al. 0.1016/S1473-3099(20)30120-1.
Machine learning to detect self-reporting of symptoms, testing access, 33. Cuomo RE, Purushothaman V, Li J, Cai M, Mackey TK. National and sub-National
and recovery associated with COVID-19 on twitter: retrospective big Longitudinal and geospatial analysis of COVID-19 tweets and confirmed cases. PLoS
data infoveillance study. JMIR Public Health Surveill. 2020;6(2):e19509. One. 2020;15(10):e0241330. https://doi.org/10.1371/journal.pone.0241330.
https://doi.org/10.2196/19509. 34. Vanella P, Wiessner C, Holz A, Krause G, Möhl A, Wiegel S, et al. The role of
13. Mackey TK, Li J, Purushothaman V, Nali M, Shah N, Bardier C, et al. Big data, age distribution, time lag between reporting and death and healthcare
natural language processing, and deep learning to detect and characterize system capacity on case fatality estimates of COVID-19. medRxiv. 2020.
illicit COVID-19 product sales: Infoveillance study on twitter and Instagram. 35. Fu X, Zhai W. Examining the spatial and temporal relationship between
JMIR Public Health Surveill. 2020;6(3):e20794. https://doi.org/10.2196/20794. social vulnerability and stay-at-home behaviors in New York City during the
14. Ferrara E, Cresci S, Luceri L. Misinformation, manipulation, and abuse on COVID-19 pandemic. Sustain Cities Soc. 2021;67:102757. https://doi.org/10.1
social media in the era of COVID-19. J Comput Soc Sci. 2020;3(2):271–7. 016/j.scs.2021.102757.
https://doi.org/10.1007/s42001-020-00094-5. 36. Hayate I, Wakamiya S, Aramaki E. Forecasting word model: Twitter-based
15. Cinelli M, Quattrociocchi W, Galeazzi A, Valensise CM, Brugnoli E, Schmidt influenza surveillance and prediction. In: Proceedings of COLING 2016, the
AL, et al. The COVID-19 social media infodemic. Sci Rep. 2020;10(1):16598. 26th International Conference on Computational Linguistics: Technical
https://doi.org/10.1038/s41598-020-73510-5. Papers, vol. 2016; 2016. p. 76–86.
16. Hung M, Lauren E, Hon ES, Birmingham WC, Xu J, Su S, et al. Social network 37. Shin S-Y, Seo D-W, An J, Kwak H, Kim S-H, Gwack J, et al. High correlation of
analysis of COVID-19 sentiments: application of artificial intelligence. J Med Middle East respiratory syndrome spread with Google search and twitter
Internet Res. 2020;22(8):e22590. https://doi.org/10.2196/22590. trends in Korea. Sci Rep. 2016;6(1):32920. https://doi.org/10.1038/srep32920.Cuomo et al. BMC Public Health (2021) 21:793 Page 11 of 11
38. Chew C, Eysenbach G. Pandemics in the age of twitter: content analysis of
tweets during the 2009 H1N1 outbreak. PLoS One. 2010;5(11):e14118.
https://doi.org/10.1371/journal.pone.0014118.
39. Novel Coronavirus (COVID-19) [https://www.healthmap.org/covid-19/].
40. Novel Coronavirus Infection Map [https://hgis.uw.edu/virus/].
41. Rossman H, Keshet A, Shilo S, Gavrieli A, Bauman T, Cohen O, et al. A
framework for identifying regional outbreak and spread of COVID-19 from
one-minute population wide surveys. Nat Med. 2020;26:634–8.
42. Qiu Y, Chen X, Shi W. Impacts of social and economic factors on the
transmission of coronavirus disease 2019 (COVID-19) in China. J Popul Econ.
2020;9:1–46.
43. Haupt MR, Jinich-Diamant A, Li J, Nali M, Mackey TK. Characterizing twitter
user topics and communication network dynamics of the “liberate”
movement during COVID-19 using unsupervised machine learning and
social network analysis. Online Soc Netw Media. 2021;21:100114. https://doi.
org/10.1016/j.osnem.2020.100114.
44. Malecki KM, Keating JA, Safdar N. Crisis communication and public
perception of COVID-19 risk in the era of social media. Clin Infect Dis. 2021;
72(4):697–702. https://doi.org/10.1093/cid/ciaa758.
45. Dahlan N, Noor SM. Social Media and Firm Absorptive Capacity in Crisis
Communications Preparedness. Int Acad Res J Business Technol. 2015;1(2):
79–87.
46. Consortium SBC-R. Geospatial Distribution and Predictors of Mortality in
Hospitalized Patients With COVID-19: A Cohort Study. Open Forum Infect
Dis. 2020;7(10):ofaa436.
47. Ruthberg JS, Quereshy HA, Jella TK, Kocharyan A, D'Anza B, Maronian N,
et al. Geospatial analysis of COVID-19 and otolaryngologists above age
60. Am J Otolaryngol. 2020;41(4):102514. https://doi.org/10.1016/j.a
mjoto.2020.102514.
48. Jella TK, Desai A, Jella T, Steinmetz M, Kimmell K, Wright J, et al. Geospatial
distribution of neurosurgeons age 60 and older relative to the spread of
COVID-19. World Neurosurg. 2021;145:e259–66. https://doi.org/10.1016/j.
wneu.2020.10.037.
Publisher’s Note
Springer Nature remains neutral with regard to jurisdictional claims in
published maps and institutional affiliations.You can also read